49. proteus and proto-oceanus: ancestral paleogene oceans ... · pdf fileproceedings of the...
TRANSCRIPT

Barker, P. F, Kennett, J. P., et al., 1990 Proceedings of the Ocean Drilling Program, Scientific Results, Vol. 113
49. PROTEUS AND PROTO-OCEANUS: ANCESTRAL PALEOGENE OCEANS AS REVEALED FROM ANTARCTIC STABLE ISOTOPIC RESULTS; ODP LEG 1131
J. P. Kennett2 and L. D. Stott2,3
ABSTRACT
Benthic oxygen and carbon isotopic results from a depth transect on Maud Rise, Antarctica, provide the first evidence for Warm Saline Deep Water (WSDW) in the Paleogene oceans. Distinct reversals occur in the oxygen isotopic gradient between the shallower Hole 689B (Eocene depth ~ 1400 m; present-day depth 2080 m) and the deeper Hole 690B (Eocene depth -2250 m; present-day depth 2914 m). The isotopic reversals, well developed by at least 46 Ma (middle middle Eocene), existed for much of the remaining Paleogene. We do not consider these reversals to be artifacts of differential diagenesis between the two sites or to have resulted from other potentially complicating factors. This being so, the results show that deep waters at Hole 690B were significantly warmer than deep waters at the shallower Hole 689B. A progressive decrease and eventual reversal in benthic to planktonic 5180 gradients in Hole 690B, demonstrate that the deeper waters became warmer relative to Antarctic surface waters during the Eocene. The warmer deep waters of the Paleogene are inferred to have been produced at middle to low latitudes, probably in the Tethyan region which contained extensive shallow-water platforms, ideal sites for the formation of high salinity water through evaporative processes.
The ocean during the Eocene, and perhaps the Paleocene, is inferred to have been two-layered, consisting of warm, saline deep waters formed at low latitudes and overlain by cooler waters formed at high latitudes. This thermospheric ocean, dominated by halothermal circulation we name Proteus. The Neogene and modern psychrospheric ocean Oceanus is dominated by thermohaline circulation of deep waters largely formed at high latitudes. An intermediate condition existed during the Oligocene, with a three-layered ocean that consisted of cold, dense deep waters formed in the Antarctic (Proto-AABW), overlain by warm, saline deep waters from low latitudes, and in turn overlain by cool waters formed in the polar regions. This we name Proto-oceanus which combined both halothermal and thermohaline processes.
The sequence of high latitude, major, climatic change inferred from the oxygen isotopic records is as follows: generally cooler earlier Paleocene; warming during the late Paleocene; climax of Cenozoic warmth during the early Eocene and continuing into the early middle Eocene; cooling mainly in a series of steps during the remainder of the Paleogene. Superimposed upon this Paleogene pattern, the Paleocene/Eocene boundary is marked by a brief but distinct warming that involved deep to surface waters and a reduction in surface to deep carbon and oxygen isotopic gradients. This event coincided with major extinctions among the deep-sea benthic foraminifers as shown by Thomas, this volume.
Salinity has played a major role in deep ocean circulation, and thus paleotemperatures cannot be inferred directly from the oxygen isotopic composition of Paleogene benthic foraminifers without first accounting for the salinity effect.
INTRODUCTION
This contribution presents the first Paleogene oxygen and carbon isotopic data for benthic foraminifers from the Antarctic Ocean. During ODP Leg 113 we successfully drilled two sequences on Maud Rise, an aseismic ridge at 65 °S in the Weddell Sea, Antarctica, 700 km north of Dronning Maud Land (see Barker, Kennett, et al., 1988 for location map). Site 689, presently located at 2080 m, and Site 690 at 2914 m contain the first well preserved, calcareous, biogenic sequences from Antarctica that are ideal for stable isotopic investigations. Together, these two sites form an almost completely continuous Paleogene sequence. These sites also provide a unique opportunity to examine the evolution of Antarctic deep water formation during the Paleogene and the influence of changing climatic conditions on the structure of the Antarctic water column. By utilizing isotopic compositional changes in both benthic and planktonic foraminifers it is possible to investigate how the structure between surface and deep waters responded to the influence of changing sources of deep water and the processes of their for-
1 Barker, P. R, Kennett, J. P., et al., 1990. Proc. ODP, Sci. Results, 113: College Station, TX (Ocean Drilling Program).
2 Marine Science Institute and Department of Geological Sciences, University of California, Santa Barbara, CA 93106. 3 Present address: Department of Geological Science, University of Southern California, Los Angeles, California 90089.
mation. Paleodepth estimates for Sites 689 and 690 have been determined using normal subsidence rates for oceanic crust. The oldest sediments immediately overlying basement in both sites are taken to be 74.5 Ma (Campanian/Maestrichtian boundary; Barker, Kennett, et al., 1988). Thomas (this volume) has estimated depths of deposition of the oldest sediments in Site 689 to have been between 500 and 1000 m and for Site 690 between 1000 and 2000 m. We have assumed that sediments of 74.5 Ma were deposited at 500 m for Site 689 and 1350 m for Site 690. Using these assumptions, a total subsidence of only about 590 m took place between 60 and 25 Ma, the time under consideration here. Approximate paleodepth estimates for Site 689 at specific intervals of time are as follows: 60 Ma = 1200 m; 50 Ma = 1400 m; 35 Ma = 1650 m; 25 Ma = 1790 m. Paleodepth estimates for Site 690 are as follows: 60 Ma = 2040 m; 50 Ma = 2250 m; 35 Ma = 2490 m; 25 Ma = 2625 m. The maximum range of water depths during the Paleogene was therefore between about 1200 and 2600 m and hence the sites provide information about intermediate water masses closely adjacent to the Antarctic as well as indicating global climate change that has influenced ocean temperatures.
Maud Rise is located close to the present-day major source of Antarctic bottom water (AABW) that is formed through thermohaline processes along the continental margins (Deacon 1963; Gordon, 1971). The cold, dense Antarctic bottom water flows from the Weddell Sea northward into the major ocean basins. The Maud Rise area is today influenced by the warmer cir-
865

J. P. KENNETT, L. D. STOTT
cumpolar deep water that forms as a mixture of different intermediate water masses flowing into the Antarctic Ocean from other sources. The overriding influence on the structure and characteristics of the Antarctic water column is the climate of the Antarctic continent. The presence of freezing surface waters, large ice shelves and extensive sea-ice produces cold, dense bottom waters through the process of freezing and sinking of surface waters. As a result, surface and deep waters of the Antarctic today are similar in temperature as well as other physical properties, and little vertical structure exists.
The modern oceanographic setting has not existed unchanged during the Cenozoic. Large ice-sheets and ice shelves have not always existed on the Antarctic continent. There is much evidence to suggest that polar temperatures were warmer in the past. This means that modern oceanographic processes and structures, likewise, did not always exist in the past. In the absence of extensive sea-ice, large ice shelves, and ice-sheets, the formation of water masses in the Antarctic and in other parts of the oceans would have been quite different. As early as 1906, Chamberlin recognized that the existence of warm temperatures at high latitudes at some time in the geologic past would have precluded the formation of cold, dense bottom waters. He instead suggested that the oceans would have been filled with warm, saline deep waters formed in regions marked by high temperatures and high evaporation.
Oxygen isotopic investigations of benthic foraminifers from the deep sea have already shown that during much of the Cenozoic the oceans were filled with warmer waters than today (Emiliani, 1954; Shackleton and Kennett, 1975; Savin et al., 1975; Miller and Fairbanks, 1985). However, previously no evidence has been found for the existence of major middle to low latitude sources of warm, saline deep waters during the Paleogene. Woodruff and Savin (1989) provided isotopic and benthic foraminiferal evidence of important low latitude sources of warm, saline intermediate waters in the Indian Ocean during the early Miocene. These sources ceased by the middle Miocene. Thomas (this volume) has interpreted changes in benthic foraminiferal assemblages from the Maud Rise sequences to reflect the changing influence of low and high latitude sources of deep waters during the latest Paleocene through middle Eocene. A major extinction in benthic foraminifers at the end of the Paleocene is attributed by Thomas (this volume) to an intense period of formation of warm deep water in low latitudes. The depth transect within the Antarctic water column at Maud Rise provides an opportunity to examine the existence of deep waters that may not have been formed in the Antarctic Ocean during the Paleogene. The oxygen isotopic composition of benthic foraminifers is influenced by both temperature and salinity. Therefore, in this paper we have attempted to interpret the oxygen isotopic record in terms of both of these variables. In doing so, we have not attributed any of the oxygen isotopic change to the formation of large ice accumulations on Antarctica during the Paleocene and Eocene. Temporary ice-sheets of limited size may have accumulated on Antarctica during the Oligocene (Barker, Kennett, et al., 1988) and thus affected the oxygen isotopic composition of the oceans. Carbon isotopes are interpreted in terms of changes in the dissolved inorganic carbon in the oceans and of aging of water masses and the cycling of nutrients during their transit around the ocean basins. In order to understand the history of deep-water formation and the cycling of nutrients around the ocean basins it is useful to compare the isotopic records of Maud Rise with those from other regions. In this paper, comparisons are made with Site 577 in the Pacific, a well dated sequence containing a high quality isotopic record (Miller et al., 1987c).
METHODS
During shipboard operations, samples of 10-20 cm3 were taken at ~ 75 cm intervals from sequences at Sites 689 and 690. This study is based upon analyses of benthic foraminifers from essentially all of these samples. Stratigraphic and chronostratigraphic resolution varies in relation to changes in sediment accumulation rates. The stratigraphic resolution provided by this sampling strategy has allowed recognition of the major patterns of change in the isotopic composition of benthic foraminifers during the Paleogene.
Each sample was dried in an oven at 50°C and weighed. The weighed samples were soaked in either a calgon solution or a sodium hexametaphosphate solution (pH = 7) for 24 hr or longer when necessary. The disaggregated samples were then washed over a 63 fim screen. The > 63 jtim residue was dried at 50°C and reweighed.
Specimens of Cibicidoides and Nuttallides truempyi group were picked for isotopic analysis from the Paleogene benthic foraminiferal assemblages. Approximately 8-15 specimens of Cibicidoides and 10-20 of Nuttallides were picked throughout the sequence. In the lower Paleogene, Cibicidoides does not occur continuously and in sufficient abundance for isotopic analysis. Nuttallides is most abundant in the lower Paleogene. Nuttallides has been shown to secrete its calcite test close to that of Cibicidoides with respect to <513C, although it exhibits higher 5180 values by ~0.1%0-0.15%o (Shackleton et al., 1984; Miller et al., 1987c). Studies of modern Cibicidoides have found that this taxa secretes its test close to equilibrium with respect to 513C. Authors have applied <5180 correction factors to different Cibicidoides species ranging from 0.5%o to 0.64%o (Shackleton and Opdyke, 1973; Woodruff et al., 1980; Shackleton et al., 1984). Since we have analyzed several species of Cibicidoides in these sequences, we chose to apply a single correction factor of 0.64%o (Shackleton and Opdyke, 1973). We realize that slight differences in the applied correction factor will affect any paleotem-perature measurement based on the <5180 values, although this will not have affected such measurements by more than 0.5°C. Thus, we have adopted correction factors for these benthic taxa as follows: for 5186, +0.64%o to Cibicidoides and +0.5%o to Nuttallides. No corrections were made to <513C for either taxa.
Each of the benthic genera have been plotted separately in the figures because of distinct isotopic offsets between Nuttallides and Cibicidoides. Nuttallides is persistently lower in 513C and 5180 compared to Cibicidoides but varies in magnitude throughout the Paleogene. This means that a single correction factor is probably not appropriate for the entire Paleogene record. However, we focus on the relative offsets between the records for each genus rather than absolute values. We assume that for any interval of time, the offset from isotopic equilibrium displayed by any single benthic taxon was similar throughout the oceans. If this assumption is correct, inter-ocean comparisons are possible on the basis of the relative contrasts in isotopic composition of benthic foraminiferal genera. Because we cannot constrain which taxon was varying temporally or the factors which controlled isotopic disequilibrium fractionation, we have avoided making comparisons between different genera.
For isotopic analyses the benthic foraminiferal samples were sonicated for 10 s in methanol to remove adhering nannofossils and dried at 50°C. The benthic foraminifers were loaded into reaction vessels and roasted in vacuo at 375°-400°C for 1 hr. Analyses were carried out at the Graduate School of Oceanography, University of Rhode Island; Lamont-Doherty Geological Observatory; and Department of Geological Sciences, University of California, Santa Barbara. Interlaboratory calibration is
866
PROTEUS AND PROTO-OCEANUS: ANCESTRAL PALEOGENE OCEANS
carried out through the analysis of international standards such as NBS 20, NBS 18, and NBS 19. Results are reported relative to PDB standard for both oxygen and carbon. Precision is 0.1%o or better for both 5180 and 613C. Samples were analyzed in a non-sequential fashion with respect to stratigraphic position in order to minimize potential systematic error.
Preservation of benthic foraminifers throughout the Paleogene is very good, particularly in the early Paleogene. This can be attributed to two factors. These are: (1) the predominance of coccoliths over discoasters and sphenoliths, the last two of which provide nucleation sites for recalcification (Kennett and von der Borch, 1986; Nelson, 1986). In the absence of these nucleation sites the ooze/chalk transition occurs at greater burial depths; (2) subsidence and sediment accumulation rates on Maud Rise were relatively low during the Cenozoic and therefore, burial depths remained low.
The age model (Table 1) applied to the data set described here and used to illustrate the temporal patterns is based upon the planktonic foraminiferal biostratigraphy of Stott and Kennett (this volume, chapter 34) which has been intercalibrated with the magnetostratigraphy of Sites 689 and 690 (SpieB, this volume; Hamilton, this volume) and calibrated to the standard time scale of Berggren et al. (1985). The stratigraphy of the two
Table 1. Datums used to develop age models for Site 689 and 690.
Hole Datum level
689B Base Chron 8N-2 Top Chron 9N Base Chron ION Base Chron UN Base Chron 12N Top Chron 13N Top Chron 16N Base Chron 16N Top Chron 17N-1 Base Chron 17N-3 Top Chron 18N Base Chron 19N Top Chron 20N Unconformity P. australiformis FAD A. praepentacamerata FAD Unconformity S. inconstans FAD S. pseudobulloides FCOD
690B Top Chron 8N Base Chron 8N Top Chron 9N Base Chron 9N Top Chron ION Base Chron ION Top Chron UN Base Chron UN Top Chron 13N Unconformity Base Chron 16N Top Chron 17N Base Chron 18N-1 Unconformity -Top Chron 20N Unconformity -Top Chron 21N Base Chron 21N Base Chron 22N Top Chron 23N Base Chron 23N Top Chron 24N Base Chron 24N Top Chron 25N Top Chron 26N
Depth (mbsf)
75.97 79.46 91.93
103.37 106.87 119.69 128.32 134.02 135.75 152.73 153.70 163.16 165.55 202.25 207.92 215.30 227.51 229.84 231.89
53.25 60.12 61.00 68.47 72.17 73.92 80.75 84.00 91.70 93.20 95.70 96.74
105.67 106.77 107.36 118.36 118.36 123.63 133.17 137.20 140.87 144.42 154.62 185.47 210.05
Age (Ma)
27.74 28.15 30.33 32.06 32.90 35.87 38.10 39.24 39.52 41.11 41.21 44.06 44.66
57.60 60.25
64.70 66.10
26.86 27.74 28.15 29.21 29.73 30.33 31.23 32.06 35.39
39.24 39.53 41.73
44.69
49.11 50.34 52.62 53.88 54.70 55.14 56.14 58.64 60.21
sequences is complicated by the presence of several significant hiatuses that disrupt the continuity of the isotopic record in each site. These hiatuses represent different time intervals within each sequence. For this reason it has been possible, given our level of biostratigraphic and magnetostratigraphic control, to obtain a complete composite isotopic record from the two sequences. The temperature equation relating oxygen isotopic composition to the temperature of calcification is based on the equation of O'Neil et al. (1969) and the additional considerations discussed in Shackleton (1974).
RESULTS Results of the isotopic analyses of benthic foraminifers from
Holes 689B and 690B are presented in the Appendix. Isotopic data for planktonic foraminifers of Holes 689B and 690B are presented in Stott et al., (this volume). The values illustrated in the following figures have been corrected according to the discussion given above. Our approach is to first describe the oxygen isotopic patterns for Cibicidoides in each of the two holes followed by a description of carbon isotopic patterns. Oxygen isotopic results of Nuttallides are discussed separately for each Maud Rise sequence. These data are compared to that from equatorial Pacific DSDP Site 577. Carbon isotopic results for Nuttallides are described in a similar fashion. Finally, planktonic foraminiferal results are compared to that of benthic foraminifers for each of the two Maud Rise sequences.
Cibicidoides: Comparisons between Holes 689B and 690B
Oxygen Isotopes Figure 1 shows the general oxygen isotopic patterns of change
in Cibicidoides of Maud Rise Holes 689B and 690B. The <5180 values for Cibicidoides are ~ 1.0%o in the middle Paleocene and exhibit decreasing values through the late Paleocene. A broad minimum occurred during the early and earliest middle Eocene. Superimposed on this broad minimum are two intervals of particularly low values (~0.0%o), one at the Paleocene/Eocene boundary, the other at the early/middle Eocene boundary (52.0 Ma). The isotopic values of the early Eocene are the lowest recorded in Antarctic benthic foraminifers during the entire Cenozoic.
A long-term trend of increasing oxygen values commenced at the early /middle Eocene boundary ( -52.0 Ma). This trend continued through the remainder of the Paleogene to reach maximum values of ~3.5%o in the middle Oligocene in Hole 689B. Superimposed upon this long term trend, the isotopic records of both sites show distinct oscillations. These oscillations produce a pattern of increasing and decreasing offsets between the two Maud Rise records.
To better examine isotopic relationships between the two sequences, we focus greater attention on specific intervals of time during the Paleogene. Figure 2 illustrates these relationships between 60.0 and 38.0 Ma, while Figure 3 concerns the interval of time between 38.0 and 26.0 Ma. The data illustrated in these two figures show that for most of the Paleogene, up to 28.0 Ma, the 5lsO of benthic foraminifers in the deeper Hole 690B (-2040-2625 m paleodepths) was lower than in the shallower Hole 689B (—1200-1790 m paleodepths). This means that the vertical oxygen isotopic gradient is inverted at intermediate water depths as measured between the two Maud Rise sequences. The magnitude of this inversion varies throughout the Paleogene, being generally 0.5%o but as much as 1.0%o in some intervals.
During the Oligocene (Fig. 3), the isotopic inversion persisted to 28.0 Ma. Within this interval, there appear to have been brief intervals when there was greater convergence between the isotopic records of Holes 689B and 690B. Within the late Oligocene, beginning at about 28.0 Ma, the oxygen isotopic
867

J. P. KENNETT, L. D. STOTT
5 ( J o/oo 18 _ 8 0 o/oo
Age Ma
25
30
35
40
45 -
50 -
55
60 J
j I i L
Cibicidoides
Figure 1. Cibicidoides <5180 data for the Paleogene of Hole 689B and 690B. Values have been corrected by 0.64%o. The age model is based upon the biostratigraphy and magnetostratigraphy as discussed in Stott and Kennett (this volume, chapter 34) and follows the chronostratigraphic scheme of Berggren et al., 1985. • = Hole 689B; o = Hole 690B; ► = Site 577.
gradient reversed, with higher values in the deeper sequence. The gradient after -28 .0 Ma ranges up to 0.6%o.
Carbon Isotopes Figure 4 illustrates general patterns in the Paleogene carbon
isotopic stratigraphy based on Cibicidoides for Holes 689B and 690B. In the early late Paleocene ( -60 .5 Ma), 513C values were about 2.0%o. Between 60.5 and 59.0 Ma, isotopic values increased rapidly to 3.0%o forming a distinct peak during the latest Paleocene. This was followed by a conspicuous decrease in 613C during the latest Paleocene and early Eocene to values of 0.4%o by about 53.0 Ma. Carbon isotopic values then increased through the early middle Eocene to values of - 1.0%o at about 49.0 Ma. Throughout the remainder of the Paleogene, isotopic values oscillated between 1.5%o and 0.2%0 as follows: decreased by 0.7%o from 49.0 to 46.5 Ma; increased by 0.75%o between 46.5 and 42.0 Ma in the late middle Eocene; and remained essentially constant at about 0.8%o between 42.0 and 36.0 Ma. At the Eocene/Oligocene boundary S13C values increased by 0.5%o to values of 1.5%o and then rapidly decreased again through the early Oligocene to 0.25%o at 32.0 Ma. In the middle Oligocene, values fluctuate considerably between 0.25%o and 1.0%o.
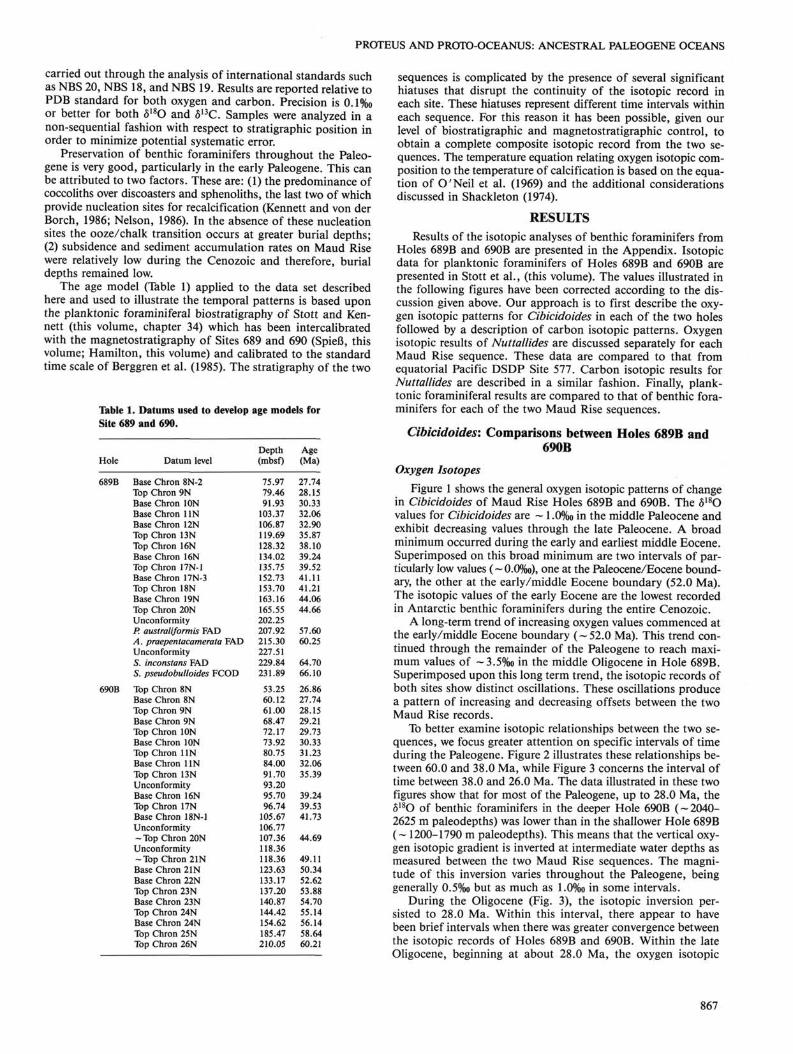
Greater details in the isotopic records are shown in Figures 5 and 6 which focus on specific intervals during the Paleogene. Figure 5 shows the carbon isotopic relationships between Holes 689B and 690B between 60.0 and 37.0 Ma. There is insufficient
Age
Eoce
ne
Pal.
Ear
ly
Mid
dle
L La
te
Ma
42 -
47 _
52 "
57 1
I . I . I , ,
Cibicidoides ^ F
689 690 <ff~ _ ^ f
"r^.^689
J ^ , 690 Figure 2. Cibicidoides 5lsO data for the early to middle Paleogene (38-62 Ma) of Holes 689B and 690B. Error bars in upper left of figure indicate the stratigraphic range within which occurs the last appearance of Subbotina linaperta at both sites. • = Hole 689B; o = Hole 690B; ► = Site 577.
data from Hole 689B in the late Paleocene through early Eocene, until 49.0 Ma to examine relationships. The isotopic records between 49.0 and 37.0 Ma exhibit an alternating pattern of increasing and decreasing 513C. These patterns suggest that the isotopic gradient between Holes 689B and 690B may have been reversing (Fig. 5).
The isotopic records for the two Maud Rise sequences appear to exhibit parallel trends during most of the Oligocene (Fig. 6) except for a short interval at — 29 Ma.
Nuttallides'. Comparisons between Holes 689B, 690B, and DSDP Site 577
Oxygen Isotopes Because of concerns over taxon-specific disequilibrium frac
tionation factors as discussed above, we have plotted Nuttallides values separately from Cibicidoides. Isotopic data for Nuttallides truempyi exists for DSDP Site 577 which is representative of intermediate water conditions (-2000 m paleodepth) in the equatorial Pacific during the Paleogene. By plotting these data together with those of the Maud Rise sequences, it is possible to infer whether isotopic gradients existed within intermediate water masses between the two regions.
Figure 7 illustrates the oxygen isotopic data for Nuttallides truempyi for Holes 689B, 690B, and Site 577. The oxygen isotopic records of these sections are similar for the late Paleocene and early Eocene. Oxygen isotopic values are about 0.75%o in the early Paleocene (-65.0 Ma) and increase to about 1.0%o in
868

PROTEUS AND PROTO-OCEANUS: ANCESTRAL PALEOGENE OCEANS
0.5 8 O o/oo
1.5 2.5 3.5 4.5
AGE
CD C CD O O
O
Ma
26 _
28 _
30 -
32 _
34 _
36 _
Cibicidoides
690
Figure 3. Cibicidoides 6180 data for the early to late Oligocene (37-26 Ma) of Holes 689B and 690B. The inverted isotopic gradient is clearly exhibited during this interval. The isotopic gradient reversed during the late Oligocene at about 28 Ma; Hole 689B 5180 data is lower in this interval than that of Hole 690B. • = Hole 689B; o = Hole 690B; ► = Site 577.
O O o/oo 0.0
Age Ma
25
30 1
35 :
40 :
45 -
50
55 .
60
1.0 i _
2.0 i _
3.0 !_
Cibicidoides
Figure 4. Cibicidoides 513C data for the Paleogene of Holes 689B and 690B. No corrections have been applied to the data. Note the large negative shift in S13C across the Paleocene/Eocene boundary in Hole 690B. Additional isotopic shifts occur in the middle Eocene (~ 48-50 Ma) and in the early Oligocene. • = Hole 689B; o = Hole 690B; ► = Site 577.
the middle Paleocene. Following 61.0 Ma the oxygen isotopic values decreased steadily into the early Eocene where they reached minimum values of about -0.4%o. These low values seem to have lasted throughout the early Eocene. However, superimposed upon this trend were two sharp excursions toward even lower values. The first of these occurred at the Paleocene/Eocene boundary (57.8 Ma). The second is at 53.5 Ma within the late early Eocene. These excursions occur in association with similar excursions in the planktonic foraminiferal isotopic records (Stott et al., this volume). After 51.0 Ma oxygen isotopic values exhibit a trend toward increased 5180 values. This trend spanned most of the middle Eocene and encompassed a 1.5%o increase.
Based upon the available data, and given our level of stratigraphic resolution, there does not appear to have been any significant 5180 isotopic gradient at intermediate water depths between the equatorial Pacific and the Antarctic Ocean during the Paleocene to early middle Eocene.
Carbon Isotopes Figure 8 shows the carbon isotopic data for Nuttallides tru
empyi for Holes 689B, 690B, and Site 577. The patterns of carbon isotopic change are similar in the three sites during the late Paleocene and early Eocene. The overall pattern is one of increasing S13C values through the middle and late Paleocene involving an increase of at least 1.5%o. These values peaked between 60.0 and 58.0 Ma. At 60.0 Ma, maximum values were
close to 2.75%o and these appear to be the highest in benthic foraminifers for the entire Cenozoic. After 58.0 Ma the 513C values became progressively lower, a trend that continued through the early Eocene. By 56.0 Ma values had decreased by 2.5%o in both Hole 690B and Site 577. Above 55.0 Ma the data for Site 577 (Miller et al., 1987c) is not sufficiently detailed to determine the patterns of change in the 513C record. The data for Hole 690B are more complete in the interval between 56.0 Ma and 53.5 Ma. It is possible therefore, to recognize distinct negative peaks in the 513C record of Nuttallides. These occur at 57.8 Ma, at the Paleocene/Eocene boundary, and at 53.5 Ma. The peaks represent short-term negative excursions superimposed upon the longer-term trends in the 513C record. They also coincide with the peaks observed in the 513C and 5180 of planktonic foraminifers and Cibicidoides (Fig. 4, 5, and 7). After 53.0 Ma the data, although discontinuous, appear to exhibit only minor variations that range between 0.0%o and 1.0%o.
Sufficient data exist for some intervals from Sites 577 (Miller et al., 1987c) and the Maud Rise holes, to evaluate 513C gradients between the Pacific and Atlantic/Antarctic Ocean basins. There is a clear isotopic gradient between Hole 690B and Site 577 data. The Antarctic values are consistently higher in 513C. The isotopic difference varies from 0.2%o up to 1.4%o. The gradient appears to have been highest in the latest Paleocene between 60.0 and 58.0 Ma and within the early Eocene between 57.0 and 55.0 Ma. Based upon the available data, it is not possible to determine whether there was a significant change in the
869
J. P. KENNETT, L. D. STOTT
5 O o/oo § QyO/00 0.0
Figure 5. Cibicidoides 513C data for the early Paleogene (39-62 Ma) of Holes 689B and 690B. The occurrence of hiatuses in the late Paleocene of Hole 689B and in the middle Eocene of Hole 690B precludes detailed comparisons of the isotopic 513C gradients for much of the early Paleogene. In the late middle and late Eocene, the isotopic gradient between Holes 689B and 690B is not sufficiently clear to determine trends. • = Hole 689B; o = Hole 690B; ► = Site 577.
basin-basin 513C gradient during the two negative excursions centered at the Paleocene/Eocene boundary and within the early Eocene at 53.5 Ma (Fig. 8).
PLANKTONIC TO BENTHIC ISOTOPIC GRADIENTS
Figures 9-12 show oxygen and carbon isotopic values for both planktonic (acarininids and subbotinids) and benthic (Cibicidoides and Nuttallides) foraminifers. Changes in the oxygen and carbon isotopic composition of the water column are reflected in the isotopic composition of planktonic and benthic foraminifers living at various water depths. Oxygen isotopic gradients between the surface (planktonic) and deep (benthic) waters are interpreted to primarily reflect temperature stratification within the water column. Planktonic foraminifers living in warmer surface waters exhibit lower 5180; foraminifers calcifying at greater depths, in colder waters exhibit higher 6180 values. Carbon isotopic gradients between surface and deep waters reflect, primarily, the preferential removal of 12C from surface waters through biological productivity and the return of 12C to deeper waters through organic carbon decomposition. This produces a vertical gradient, the strength of which varies according to the amount of biological productivity in ocean surface waters. A typical vertical oceanic profile of 513C exhibits highest values at the surface, decreasing with increasing water depth. The oceanic 613C can also vary in response to changes in the dis-
AGE
CD cz
Olig
oce
Late
ar
ly
LU
Ma
26 _
28 -
30 .
32 -
34 _
36 -
Cibicidoides
^^*~~-
689 J-
1
i
/ 6 9 0
i i
Figure 6. Cibicidoides 513C data for the Oligocene (26-37 Ma) of Holes 689B and 690B. Note the similar trends in both records during most of the Oligocene except for a short interval centered at 29 Ma. • = Hole 689B; o = Hole 690B; ► = Site 577.
tribution of carbon between organic carbon and inorganic carbon reservoirs. In the fossil record, planktonic and benthic foraminiferal isotopic samples can reflect, not only vertical characteristics within the water column, but also the influence of changing seasonal parameters such as biotic productivity, temperature, and salinity. During the Cenozoic it is possible that water masses originating outside of the Southern Ocean and having properties different from those waters originating within the Antarctic may also have influenced the isotopic composition of the Maud Rise Paleogene foraminifers.
Oxygen and carbon isotopic gradients in fossil foraminifers have been examined to obtain information about the nature and evolution of the Antarctic water column. Presented first are the oxygen isotopic data, and then the carbon isotopic data for planktonic and benthic foraminifers from Holes 689B and 690B.
Oxygen Isotopes
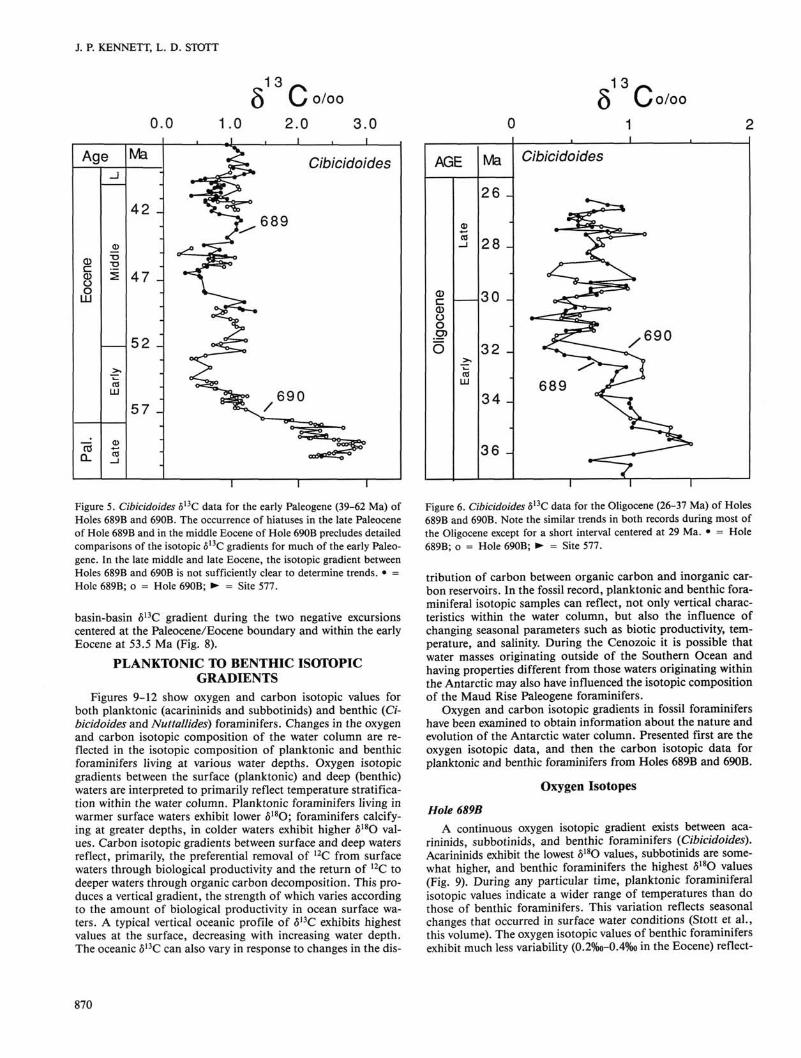
Hole 689B A continuous oxygen isotopic gradient exists between aca
rininids, subbotinids, and benthic foraminifers (Cibicidoides). Acarininids exhibit the lowest 5180 values, subbotinids are somewhat higher, and benthic foraminifers the highest 5180 values (Fig. 9). During any particular time, planktonic foraminiferal isotopic values indicate a wider range of temperatures than do those of benthic foraminifers. This variation reflects seasonal changes that occurred in surface water conditions (Stott et al., this volume). The oxygen isotopic values of benthic foraminifers exhibit much less variability (0.2%o-0.4%0 in the Eocene) reflect-
870

PROTEUS AND PROTO-OCEANUS: ANCESTRAL PALEOGENE OCEANS
5 Oo/o° -1.0 0.0 1.0 2.0
Age
Eoce
ne
Pale
oc.
Ear
ly
Mid
dle
E.
Late
Ma
45 -
50 -
55 -
60 -
t . i . i
Nuttallides
690
*-» ^A
5 7 7 *
Figure 7. Nuttallides 5180 data for the early Paleogene (43-65 Ma) for ODP Sites 689 and 690 and DSDP Site 577 in the tropical Pacific (Miller et al., 1987c). Note the general similarity in the records between the Antarctic and the tropical Pacific for the late Paleocene and early Eocene; some differences are exhibited in the middle early Eocene. • = Hole 689B; o = Hole 690B; ► = Site 577.
ing the more constant environmental conditions at depth (Fig. 9). In Hole 689B, there is a clear separation between subbotinid and benthic foraminiferal oxygen isotopic values (Fig. 9). However, the benthic foraminiferal values are similar to maximum subbotinid values.
Hole 690B At this site, the oxygen isotopic gradient between acarininids,
subbotinids, and benthic foraminifers {Cibicidoides) exhibits a pattern different from that of Hole 689B. The gradient between subbotinids and benthic foraminifers was well established in some intervals, but decreased in others, and was eliminated or even reversed in still others. In the late Paleocene to early Eocene ( — 61.0-57.5 Ma) there is clear separation between subbotinid and benthic values. Subbotinids exhibit a range of values similar to those seen in Hole 689B (~0.4%o) while benthic foraminifer values are generally higher, with maximum differences of 0.5%o. In the earliest Eocene, from 57.5 to 55.0 Ma, there is much greater overlap in S180 values between subbotinids and benthic foraminifers (Fig. 10). This overlap is seen between the minimum subbotinid and the benthic values. However, during this same interval, maximum subbotinid values were still considerably lower in 5180 than those of benthic foraminifers. This reflects a much greater degree of variability in the subbotinid isotopic values (~1.0%o). Beginning at 55.0 Ma, and continuing through the middle Eocene (44.0 Ma), subbotinid and benthic 5lsO values completely overlap (Fig. 10). At the end of the middle Eocene (~ 42.0 Ma) there was a reversal in the oxygen isotopic gradient between subbotinids and benthic fora-
8 1 3 C - 1 0 1 2 3
Age
Eoce
ne
Pale
oc.
Ear
ly
Mid
dle
E.
Late
Ma
45 -
50 -
55 -
60 -
I . I . I .
Nuttallides
pi(jh ip
^ 6 8 9
Figure 8. Nuttallides 513C data for the early Paleogene (43-65 Ma) for ODP Sites 689B, 690B, and DSDP Site 577 in the tropical Pacific (Miller et al., 1987c). Note that Antarctic values are consistently higher in 513C compared to the Site 577 data. Note also the two distinct excursions centered at the Paleocene/Eocene boundary and within the early Eocene at 53.5 Ma. • = Hole 689B; o = Hole 690B; ► = Site 577.
minifers (Fig. 10). This reversed gradient existed until the earliest late Eocene ( — 39 Ma) after which the values again overlap. During the early Oligocene, the subbotinids exhibit lower values than do the benthic foraminifers.
Carbon Isotopes
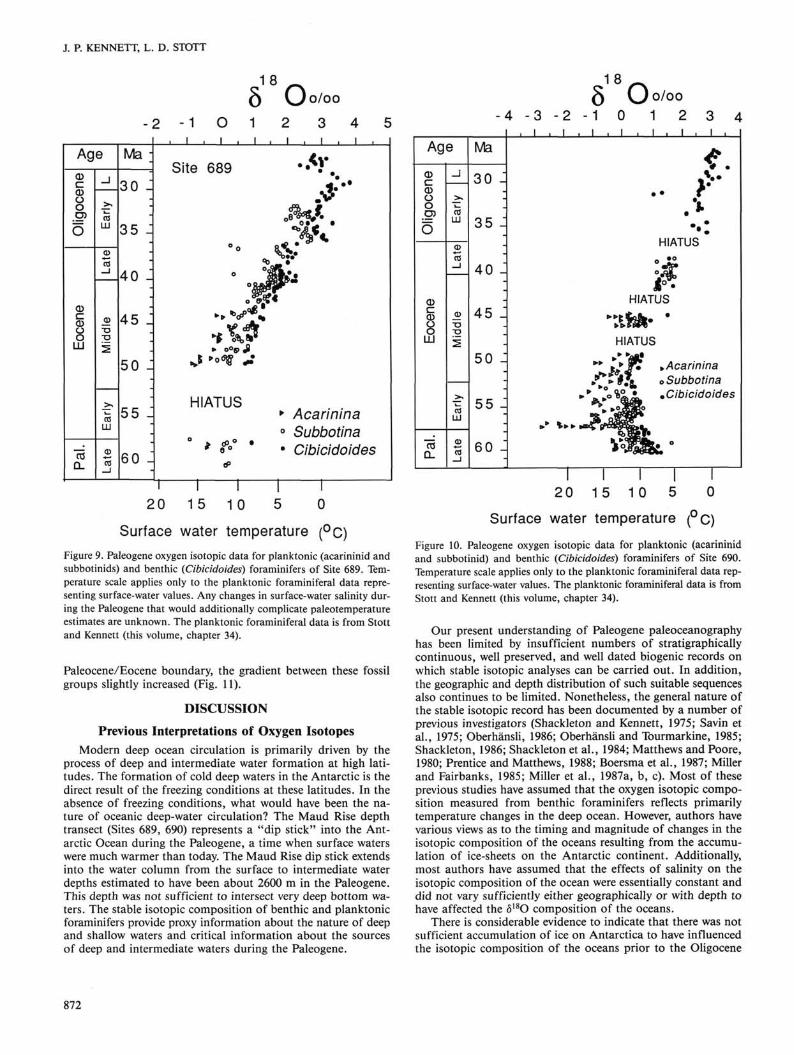
Hole 689B Figure 11 shows the 513C of acarininids, subbotinids, and
benthic foraminifers (Cibicidoides) from Hole 689B. A distinct gradient exists between the different foraminiferal groups, with highest values exhibited by the acarininids, intermediate values by the subbotinids, and lowest values by the benthic foraminifers. The pattern of isotopic gradients between the different faunal groups is similar to that observed for oxygen isotopes in Hole 689B, with benthic foraminifers reflecting deep water values and the subbotinids exhibiting a wider range of variability. There is an indication that the gradient significantly changed during the Eocene to early Oligocene.
Hole 690B Figure 12 shows the 513C of acarininids, subbotinids, and
benthic foraminifers (Cibicidoides) from Hole 690B. The pattern of 513C gradients between the different foraminiferal groups is similar to that for Hole 689B. However, the gradient between the subbotinids and the benthic foraminifers is slightly lower. We note that in the late Paleocene the total gradient between the subbotinids and benthic foraminifers was minimal. After the
871
J. P. KENNETT, L. D. STOTT
- 2 - 1 0 1 2 3 4 5
Age
Olig
ocen
e Eo
cene
Pa
l.
Early
L
Ear
ly
Mid
dle
Late
La
te
Ma ;
30 :
35 :
40
45 J
so :
55 :
60 :
1 I , 1 . I . I . I . i ,
Site 689 ••*? . •
am *
HIATUS * Acarinina 0 Subbotina
* f0 • Cibicidoides
20 15 10 5 0
Surface water temperature (°C) Figure 9. Paleogene oxygen isotopic data for planktonic (acarininid and subbotinids) and benthic (Cibicidoides) foraminifers of Site 689. Temperature scale applies only to the planktonic foraminiferal data representing surface-water values. Any changes in surface-water salinity during the Paleogene that would additionally complicate paleotemperature estimates are unknown. The planktonic foraminiferal data is from Stott and Kennett (this volume, chapter 34).
Paleocene/Eocene boundary, the gradient between these fossil groups slightly increased (Fig. 11).
DISCUSSION
Previous Interpretations of Oxygen Isotopes Modern deep ocean circulation is primarily driven by the
process of deep and intermediate water formation at high latitudes. The formation of cold deep waters in the Antarctic is the direct result of the freezing conditions at these latitudes. In the absence of freezing conditions, what would have been the nature of oceanic deep-water circulation? The Maud Rise depth transect (Sites 689, 690) represents a "dip stick" into the Antarctic Ocean during the Paleogene, a time when surface waters were much warmer than today. The Maud Rise dip stick extends into the water column from the surface to intermediate water depths estimated to have been about 2600 m in the Paleogene. This depth was not sufficient to intersect very deep bottom waters. The stable isotopic composition of benthic and planktonic foraminifers provide proxy information about the nature of deep and shallow waters and critical information about the sources of deep and intermediate waters during the Paleogene.
5 O o/o° - 4 - 3 - 2 - 1 0 1 2 3 4
Age
Olig
ocen
e Eo
cene
Pa
l.
Ear
ly
L Ea
rly
Mid
dle
Late
La
te
Ma
30 :
35 :
4 0 :
45 :
50 :
55 -I
60 :
, 1 , 1 . 1 . 1 . 1 . 1 , 1 ,
<
.. y-
HIATUS O * °
HIATUS
"lit*- ' HIATUS
** *£&• »Acarinina 3^ > §J^ o Subbotina
>* *°o%!• • Cibicidoides
20 15 10 5 0
Surface water temperature (°C) Figure 10. Paleogene oxygen isotopic data for planktonic (acarininid and subbotinid) and benthic (Cibicidoides) foraminifers of Site 690. Temperature scale applies only to the planktonic foraminiferal data representing surface-water values. The planktonic foraminiferal data is from Stott and Kennett (this volume, chapter 34).
Our present understanding of Paleogene paleoceanography has been limited by insufficient numbers of stratigraphically continuous, well preserved, and well dated biogenic records on which stable isotopic analyses can be carried out. In addition, the geographic and depth distribution of such suitable sequences also continues to be limited. Nonetheless, the general nature of the stable isotopic record has been documented by a number of previous investigators (Shackleton and Kennett, 1975; Savin et al., 1975; Oberhansli, 1986; Oberhansli and Tourmarkine, 1985; Shackleton, 1986; Shackleton et al., 1984; Matthews and Poore, 1980; Prentice and Matthews, 1988; Boersma et al., 1987; Miller and Fairbanks, 1985; Miller et al., 1987a, b, c). Most of these previous studies have assumed that the oxygen isotopic composition measured from benthic foraminifers reflects primarily temperature changes in the deep ocean. However, authors have various views as to the timing and magnitude of changes in the isotopic composition of the oceans resulting from the accumulation of ice-sheets on the Antarctic continent. Additionally, most authors have assumed that the effects of salinity on the isotopic composition of the ocean were essentially constant and did not vary sufficiently either geographically or with depth to have affected the 5lsO composition of the oceans.
There is considerable evidence to indicate that there was not sufficient accumulation of ice on Antarctica to have influenced the isotopic composition of the oceans prior to the Oligocene
872
PROTEUS AND PROTO-OCEANUS: ANCESTRAL PALEOGENE OCEANS
0 O o/oo - 1 0 1 2 3 4
Age
Olig
ocen
e
CD C CD
8 LU
Pal.
Ear
ly
L Ea
rly
Mid
dle
Late
La
te
Ma
30 :
3 5 :
40 ^
45 :
so :
5 5 :
60 :
I , 1 . 1 . 1
. * } : • Site 689 •
• • * • ^Acarinina •*°«#° .<>-$£, oSubbotina
rim . _ •Cibicidoides
°* m* *°
HIATUS
« « . o " >
oo o
Figure 11. Paleogene carbon isotopic data for planktonic (acarininid and subbotinids) and benthic (Cibicidoides) foraminifers of Hole 689B. The planktonic foraminiferal data is from Stott and Kennett (this volume, chapter 34).
(Barker, Kennett, et al., 1988; Mohr, this volume, chapter 36; Robert and Maillot, this volume; Stott et al., this volume). During the early Oligocene, cryospheric conditions were developing on the Antarctic continent (Margolis and Kennett, 1971; Shackleton and Kennett, 1975; Kennett and Shackleton, 1976; Kennett, 1977; Barrett et al., 1987; Harwood, 1986; Miller and Fairbanks, 1985; Keigwin and Keller, 1984; Matthews and Poore, 1980). However, the magnitude of any such ice accumulations, and hence the effect upon oceanic oxygen isotopic composition is not well known. Recently there has been growing recognition that at times in the past, the isotopic composition of different water masses may have been influenced to varying degrees by salinity changes (Prentice and Matthews, 1988; Woodruff and Savin, 1989; Hay, 1988).
The deep-sea benthic foraminiferal oxygen isotopic record for the Paleogene has traditionally been interpreted to reflect cooler high to midlatitude conditions during the early Paleocene, followed by a warming trend during the late Paleocene that culminated in the early Eocene. The early Eocene exhibits the warmest temperatures for the entire Cenozoic. Beginning in the middle Eocene, the isotopic record exhibits what has been interpreted as a cooling trend that continued during the remainder of the Eocene and Oligocene. The Antarctic planktonic foraminiferal oxygen isotopic record may provide a standard by which the deep sea isotopic record for the Paleogene may be interpreted in terms of either reflecting changes in temperature, salinity, or both. This is because it is unlikely that the Antarctic surface waters, which show this same general isotopic pattern (Stott et al., this volume), would have been substantially influenced by the same factors that affected the deep sea isotopic re-
O o/oo -2 0 2 4 6
Age
CD C CD
goc
HO
CD c CD O o LU
Pal.
_ l
CO LU
o CO
_ i
CD
•o T J
2
CO LU
Late
Ma -
30 -
35 -
40 -
45 -
50 -
55 -
60 :
i . .
* » • ^Acarinina ■> ■ ^ o Subbotma
* •Cibicidoides
HIATUS •°o
HIATUS
• •&£&* » HIATUS
0 w t ffigfc ***\ ™*9t° B..0 +*W
BBSs e ►Jc*
Figure 12. Paleogene carbon isotopic data for planktonic (acarininid and subbotinids) and benthic (Cibicidoides) foraminifers of Site 690. The planktonic foraminiferal data is from Stott and Kennett (this volume, chapter 34).
cord in other regions. It follows, therefore, that the Paleogene oxygen isotopic record of the Antarctic must reflect primarily temperature rather than salinity changes (Stott et al., this volume).
Benthic Carbon Isotopes as Deep-water Tracers The 513C of benthic foraminifers have been used to trace
paths of deep-water transport through the ocean basins in the past (Curry and Lohmann, 1982; Shackleton et al., 1983; Mix and Fairbanks, 1985; Miller and Fairbanks, 1985). This approach is predicated on the fact that younger waters, those near their surface source regions, will have the highest 513C values reflecting greater depletion of nutrients. In the modern ocean, the S13C of deep North Pacific waters exhibits values that are approximately 1.0%o lower than those of the North Atlantic (Kroop-nick, 1985). In the Paleogene however, when global climate was distinctly warmer than today, the production of deep waters may have occurred through a different variety of processes and at various locations. Previously, Chamberlin (1906) and Brass et al. (1982) both suggested that warm, saline deep waters formed at low to midlatitudes. Other studies have shown that high-latitude benthic and planktonic 5180 values are similar and that this suggests that deep-water production must have taken place in those regions (Shackleton and Kennett, 1975; Barrera et al., 1987; Stott et al., this volume). It is possible that the interplay between production at high and low latitudes produced a complex pattern of deep-water circulation, oceanic overturn, and nutrient cycling in the Paleogene oceans (Wilde and Berry, 1986). Therefore, the pattern of 513C gradients exhibited by benthic foraminifers throughout the ocean basins was probably
873
J. P. KENNETT, L. D. STOTT
more complex than during the Neogene when deep waters were mainly produced at high latitudes. For optimal results, benthic 613C should be used in conjunction with other Paleogene deep-water tracers.
Warm Saline Deep Waters: Evidence The Maud Rise sequences contain several lines of evidence
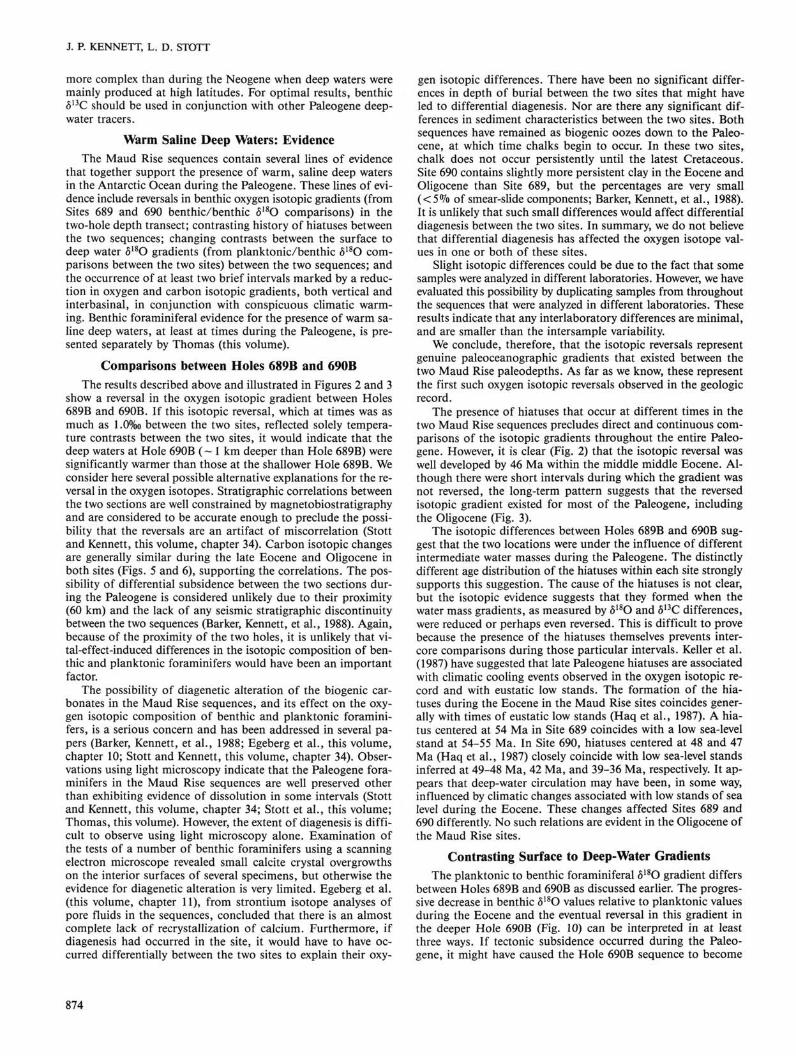
that together support the presence of warm, saline deep waters in the Antarctic Ocean during the Paleogene. These lines of evidence include reversals in benthic oxygen isotopic gradients (from Sites 689 and 690 benthic/benthic 5180 comparisons) in the two-hole depth transect; contrasting history of hiatuses between the two sequences; changing contrasts between the surface to deep water 5180 gradients (from planktonic/benthic 5180 comparisons between the two sites) between the two sequences; and the occurrence of at least two brief intervals marked by a reduction in oxygen and carbon isotopic gradients, both vertical and interbasinal, in conjunction with conspicuous climatic warming. Benthic foraminiferal evidence for the presence of warm saline deep waters, at least at times during the Paleogene, is presented separately by Thomas (this volume).
Comparisons between Holes 689B and 690B The results described above and illustrated in Figures 2 and 3
show a reversal in the oxygen isotopic gradient between Holes 689B and 690B. If this isotopic reversal, which at times was as much as 1.0%o between the two sites, reflected solely temperature contrasts between the two sites, it would indicate that the deep waters at Hole 690B (~ 1 km deeper than Hole 689B) were significantly warmer than those at the shallower Hole 689B. We consider here several possible alternative explanations for the reversal in the oxygen isotopes. Stratigraphic correlations between the two sections are well constrained by magnetobiostratigraphy and are considered to be accurate enough to preclude the possibility that the reversals are an artifact of miscorrelation (Stott and Kennett, this volume, chapter 34). Carbon isotopic changes are generally similar during the late Eocene and Oligocene in both sites (Figs. 5 and 6), supporting the correlations. The possibility of differential subsidence between the two sections during the Paleogene is considered unlikely due to their proximity (60 km) and the lack of any seismic stratigraphic discontinuity between the two sequences (Barker, Kennett, et al., 1988). Again, because of the proximity of the two holes, it is unlikely that vital-effect-induced differences in the isotopic composition of benthic and planktonic foraminifers would have been an important factor.
The possibility of diagenetic alteration of the biogenic carbonates in the Maud Rise sequences, and its effect on the oxygen isotopic composition of benthic and planktonic foraminifers, is a serious concern and has been addressed in several papers (Barker, Kennett, et al., 1988; Egeberg et al., this volume, chapter 10; Stott and Kennett, this volume, chapter 34). Observations using light microscopy indicate that the Paleogene foraminifers in the Maud Rise sequences are well preserved other than exhibiting evidence of dissolution in some intervals (Stott and Kennett, this volume, chapter 34; Stott et al., this volume; Thomas, this volume). However, the extent of diagenesis is difficult to observe using light microscopy alone. Examination of the tests of a number of benthic foraminifers using a scanning electron microscope revealed small calcite crystal overgrowths on the interior surfaces of several specimens, but otherwise the evidence for diagenetic alteration is very limited. Egeberg et al. (this volume, chapter 11), from strontium isotope analyses of pore fluids in the sequences, concluded that there is an almost complete lack of recrystallization of calcium. Furthermore, if diagenesis had occurred in the site, it would have to have occurred differentially between the two sites to explain their oxy
gen isotopic differences. There have been no significant differences in depth of burial between the two sites that might have led to differential diagenesis. Nor are there any significant differences in sediment characteristics between the two sites. Both sequences have remained as biogenic oozes down to the Paleocene, at which time chalks begin to occur. In these two sites, chalk does not occur persistently until the latest Cretaceous. Site 690 contains slightly more persistent clay in the Eocene and Oligocene than Site 689, but the percentages are very small ( < 5 % of smear-slide components; Barker, Kennett, et al., 1988). It is unlikely that such small differences would affect differential diagenesis between the two sites. In summary, we do not believe that differential diagenesis has affected the oxygen isotope values in one or both of these sites.
Slight isotopic differences could be due to the fact that some samples were analyzed in different laboratories. However, we have evaluated this possibility by duplicating samples from throughout the sequences that were analyzed in different laboratories. These results indicate that any interlaboratory differences are minimal, and are smaller than the intersample variability.
We conclude, therefore, that the isotopic reversals represent genuine paleoceanographic gradients that existed between the two Maud Rise paleodepths. As far as we know, these represent the first such oxygen isotopic reversals observed in the geologic record.
The presence of hiatuses that occur at different times in the two Maud Rise sequences precludes direct and continuous comparisons of the isotopic gradients throughout the entire Paleogene. However, it is clear (Fig. 2) that the isotopic reversal was well developed by 46 Ma within the middle middle Eocene. Although there were short intervals during which the gradient was not reversed, the long-term pattern suggests that the reversed isotopic gradient existed for most of the Paleogene, including the Oligocene (Fig. 3).
The isotopic differences between Holes 689B and 690B suggest that the two locations were under the influence of different intermediate water masses during the Paleogene. The distinctly different age distribution of the hiatuses within each site strongly supports this suggestion. The cause of the hiatuses is not clear, but the isotopic evidence suggests that they formed when the water mass gradients, as measured by 5180 and 513C differences, were reduced or perhaps even reversed. This is difficult to prove because the presence of the hiatuses themselves prevents inter-core comparisons during those particular intervals. Keller et al. (1987) have suggested that late Paleogene hiatuses are associated with climatic cooling events observed in the oxygen isotopic record and with eustatic low stands. The formation of the hiatuses during the Eocene in the Maud Rise sites coincides generally with times of eustatic low stands (Haq et al., 1987). A hiatus centered at 54 Ma in Site 689 coincides with a low sea-level stand at 54-55 Ma. In Site 690, hiatuses centered at 48 and 47 Ma (Haq et al., 1987) closely coincide with low sea-level stands inferred at 49-48 Ma, 42 Ma, and 39-36 Ma, respectively. It appears that deep-water circulation may have been, in some way, influenced by climatic changes associated with low stands of sea level during the Eocene. These changes affected Sites 689 and 690 differently. No such relations are evident in the Oligocene of the Maud Rise sites.
Contrasting Surface to Deep-Water Gradients The planktonic to benthic foraminiferal 5180 gradient differs
between Holes 689B and 690B as discussed earlier. The progressive decrease in benthic 5180 values relative to planktonic values during the Eocene and the eventual reversal in this gradient in the deeper Hole 690B (Fig. 10) can be interpreted in at least three ways. If tectonic subsidence occurred during the Paleogene, it might have caused the Hole 690B sequence to become
874
PROTEUS AND PROTO-OCEANUS: ANCESTRAL PALEOGENE OCEANS
increasingly influenced by the warmer deep waters and this might explain the decreasing planktonic/benthic 5180 gradient during the Eocene. This might also be expected to have produced an increased gradient in the benthic 5180 values between the two Maud Rise sections. Although comparisons are not possible for much of the Paleocene to middle middle Eocene because of the hiatuses, it does appear that the reversed gradient did strengthen between the two sections beginning in the middle Eocene (Figs. 1-3). The gradient was particularly strengthened across the Eocene/Oligocene boundary and remained well developed throughout much of the Oligocene (Fig. 3). As stated above, we do not believe that tectonic subsidence at Maud Rise would have been sufficient during the late Paleogene to account for this phenomenon. Another possible explanation is that both the volume and the temperature of a warm water mass bathing this depth on Maud Rise increased relative to the surface waters during the Paleogene. This appears to be unlikely because the longer-term oxygen isotopic trend in benthic and planktonic foraminifers is toward cooler rather than warmer temperatures. Alternatively, the deep water mass may have changed less in response to the climatic cooling during the Paleogene than did high latitude surface waters. This latter interpretation would imply that the warmer deep waters originated in lower latitudes where the cooling was less pronounced than at high latitudes.
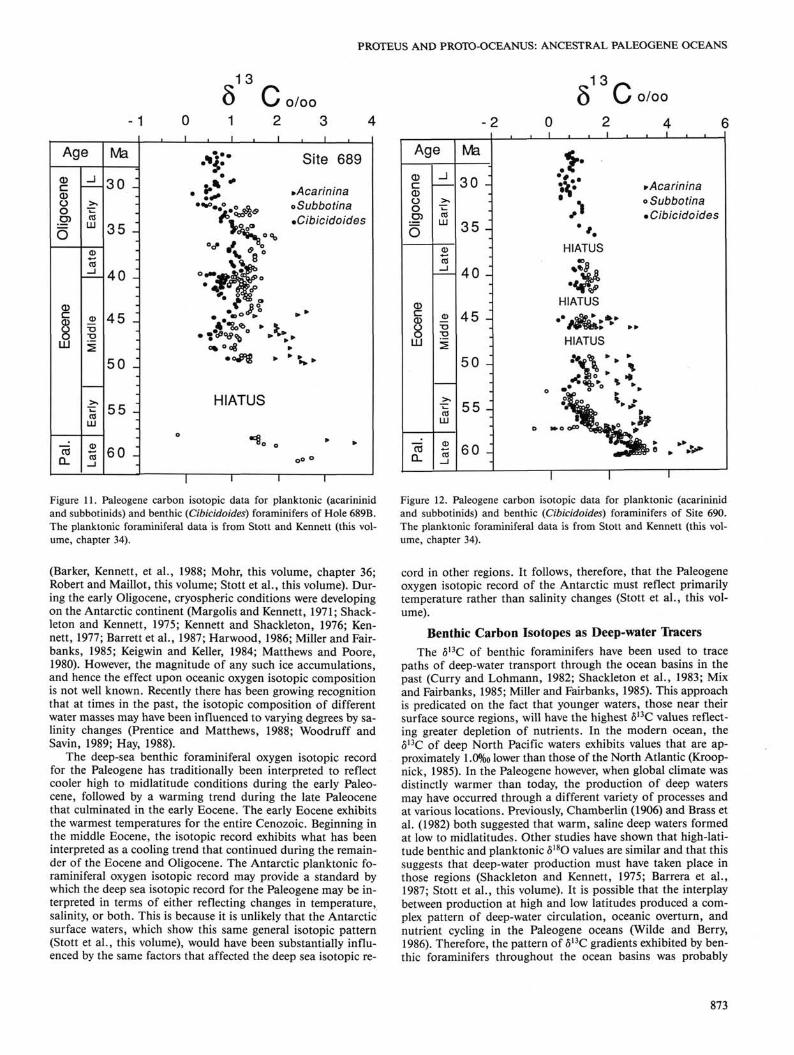
It is possible that the inferred warm, saline deep-water mass was progressively displaced upward to water depths which would have increasingly influenced Site 690. This could have resulted from enhanced production of cold, dense Antarctic bottom waters sinking beneath the warmer, saline water mass (Fig. 13). If this occurred, it would imply oceanographic processes similar to those occurring in the modern ocean, wherein AABW formed at the margins of Antarctica sinks and flows beneath warmer, saline North Atlantic Intermediate waters.
The reversed oxygen isotopic gradient between the Maud Rise sequences seemed to strengthen in the early Oligocene, a time represented by a major oxygen isotopic shift interpreted by many workers to reflect the initiation of significant sea-ice formation and the beginning of thermohaline driven circulation in the oceans (Shackleton and Kennett, 1975; Miller and Fairbanks, 1985). Indirect evidence that supports the presence of sea-ice around the Antarctic in the early Oligocene includes the earliest observed ice-rafted sediments in the Maud Rise sequences (Barker, Kennett, et al., 1988), changes in clay mineralogy reflecting marked cooling on the continent (Robert and Maillot, this volume), a sharp reduction in the Antarctic megaflora at the end of the Eocene (Mohr, this volume, chapter 36). Similar evidence has been documented for other sectors of Antarctica including plant extinctions near the end of the Eocene (Kemp, 1975; Kemp and Barrett, 1975; Truswell, 1983; Askin, 1988) and the presence of ice-rafted sediments and diamictites of Oligocene age in the Ross Sea area (Barrett et al., 1987). Surface-water upwelling was enhanced at the Eocene/Oligocene boundary in the Weddell Sea as evidenced by a marked increase in biogenic silica deposition (Barker, Kennett, et al., 1988). The production of cold, dense bottom waters (proto-AABW) was brought about by the climatic cooling and associated limited sea-ice formation in the early Oligocene (Benson, 1975; Kennett, 1977). We also suggest that the upward displacement of more saline waters from depth and their partial mixing with surface waters along the Antarctic continental margin may have indeed contributed to the higher densities required for the production of the proto-AABW. This process would have been similar to that occurring today producing North Atlantic Deep Water through the incursion of warm, saline Mediterranean waters to the Arctic.
ATLANTIC
ANT. ARCTIC
80° 70 60 50 40 30 20 10 0 10 20 30 40 50 60 70°
Latitude OCEANUS: Modern, psychrospheric (Thermohaline circulation)
i i i i i i i i i i i i > i i i
80° 70 60 50 40 30 20 10 0 10 20 30 40 50 60 70° S N
PROTO-OCEANUS: Oligocene (Mixed halothermal & thermohaline circulation)
80° 70 60 50 40 30 20 10 0 10 20 30 40 50 60 70° PROTEUS: Eocene (Halothermal circulation) N
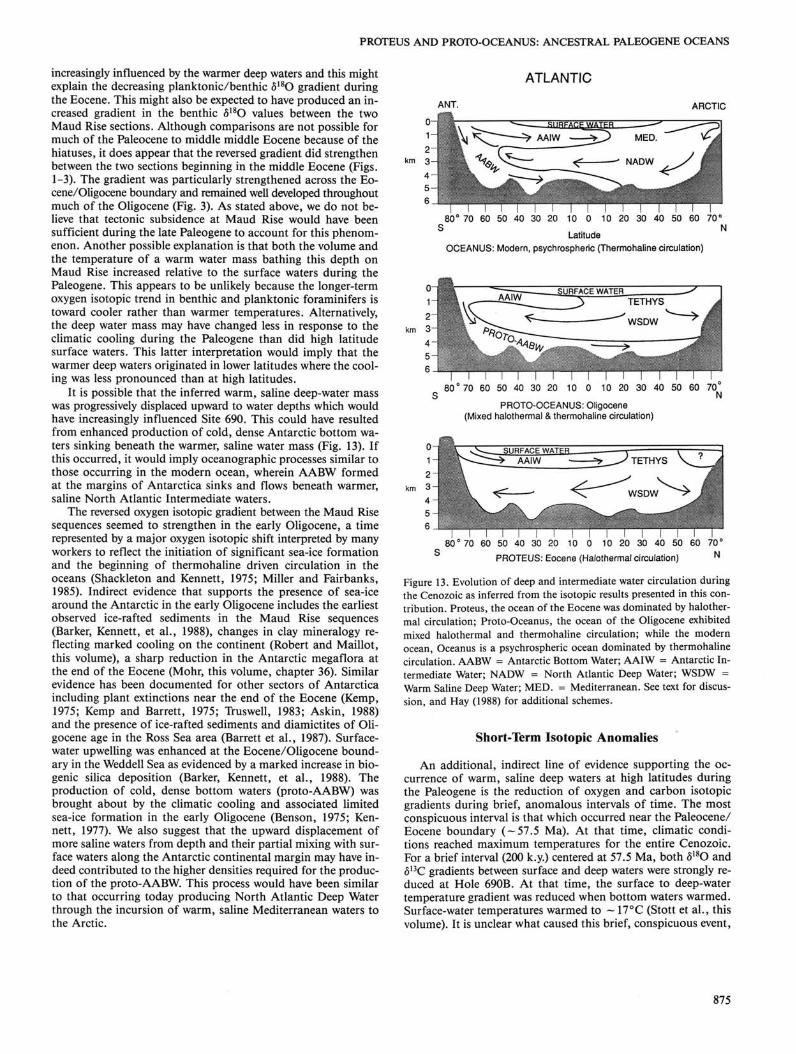
Figure 13. Evolution of deep and intermediate water circulation during the Cenozoic as inferred from the isotopic results presented in this contribution. Proteus, the ocean of the Eocene was dominated by halothermal circulation; Proto-Oceanus, the ocean of the Oligocene exhibited mixed halothermal and thermohaline circulation; while the modern ocean, Oceanus is a psychrospheric ocean dominated by thermohaline circulation. AABW = Antarctic Bottom Water; AAIW = Antarctic Intermediate Water; NADW = North Atlantic Deep Water; WSDW = Warm Saline Deep Water; MED. = Mediterranean. See text for discussion, and Hay (1988) for additional schemes.
Short-Term Isotopic Anomalies
An additional, indirect line of evidence supporting the occurrence of warm, saline deep waters at high latitudes during the Paleogene is the reduction of oxygen and carbon isotopic gradients during brief, anomalous intervals of time. The most conspicuous interval is that which occurred near the Paleocene/ Eocene boundary ( -57.5 Ma). At that time, climatic conditions reached maximum temperatures for the entire Cenozoic. For a brief interval (200 k.y.) centered at 57.5 Ma, both 5180 and 513C gradients between surface and deep waters were strongly reduced at Hole 690B. At that time, the surface to deep-water temperature gradient was reduced when bottom waters warmed. Surface-water temperatures warmed to ~ 17°C (Stott et al., this volume). It is unclear what caused this brief, conspicuous event,
875
J. P. KENNETT, L. D. STOTT
but because warming involved the entire water column, it seems unlikely that such an event would have originated at high latitudes and was more than a local event. For these reasons we believe that the event had its origin in processes associated with deep-water formation. That important changes occurred in deep waters at this time is supported by the association of a major extinction level in the benthic foraminiferal assemblages. Tjalsma and Lohmann (1983) showed that the largest change in deep-water foraminifers during the late Mesozoic and Cenozoic occurred at the Paleocene/Eocene boundary. Possible relationships between major benthic foraminiferal extinction and the production of warm, saline deep waters has also been suggested by Thomas (this volume) who shows that the largest extinctions in benthic foraminifers in Hole 690B occurred close to the Paleocene/Eocene boundary in Section 113-690B-19H-3. This horizon is precisely where we have observed a distinct isotopic spike in both benthic and planktonic foraminiferal 5lsO and 613C (Stott and Kennett, in prep.).
PROTEUS OCEAN We consider that the data presented here represent evidence
for the existence of multiple deep water sources during the Paleogene, including a major low latitude source of warm, saline deep water, high latitude cool intermediate water, and the formation in the early Oligocene of cold Antarctic bottom water (proto-AABW). The occurrence of warm, saline deep waters in the geologic past was anticipated by Chamberlin in 1906 and later considered to be feasible in modelling experiments carried out by Brass et al. (1982). These conclusions were based upon the assumption that, at some time in the past, the polar regions would have been too warm to provide a major source of cold, deep waters to the ocean basins. By contrast, during the Paleogene, the Tethys was an extensive region suitable for the production of large quantities of warm, saline deep waters. Paleore-constructions of the Tethys show the region located at midlati-tudes in the Northern Hemisphere, well suited for evaporation to have exceeded precipitation. It is well known that the Tethyan region (Smith and Briden, 1977; Smith et al., 1981; Dercourt et al., 1986) during the Paleogene consisted of an extensive mosaic of shallow-water basins in which thick sequences of evaporites were deposited at times (Murris, 1980). In general, the Paleogene was a time of relatively high sea level compared with the Neogene (Vail and Hardenbol, 1979), leading to greater flooding of the continental margins and hence contributing to the formation of evaporitive basins. Woodruff and Savin (1989) proposed that warm, saline waters derived from the Tethyan region continued to influence the oceans as late as the early Miocene. They also proposed that the closure of the Tethys took place at the end of the early Miocene, with resulting major reduction in the production of warm, saline deep waters. These changes, they suggested, were a major factor in the development of a large, permanent ice-sheet on East Antarctica during the middle Miocene (—15 Ma). It is also possible that for much of the Paleogene, higher precipitation and freshwater runoff from Antarctica reduced the salinity of surface waters closely adjacent to Antarctica. This would have assisted in reducing the production of dense waters from this region.
The ocean, at times during the Eocene, and perhaps the Paleocene, is inferred to have been two-layered, consisting of warm, saline deep waters formed at low latitudes and overlain by cooler waters formed at high latitudes (Fig. 13). This thermospheric ocean, dominated by halothermal circulation, we name Proteus. Proteus was a god of the sea, according to Greek mythology, whose charge it was to attend to the sea creatures belonging to Poseidon. Proteus arose from a union of Oceanus, Father of all seas and rivers, and Tethys, Goddess of oceanic fertility. Al
though this ancestral succession is reversed to that of the ocean evolutionary succession, we prefer the name Proteus because of the close relationships between these particular Greek gods and goddesses. It is perhaps symbolic that Proteus eluded all those that might discover his secrets by changing form!
The Neogene and modern psychrospheric ocean Oceanus, is dominated by thermohaline circulation of deep waters largely formed at high latitudes (Fig. 13). An intermediate condition existed during the Oligocene, with a three-layered ocean consisting of cold, dense waters derived from low latitudes, and in turn overlain by cool waters formed in the polar regions. This we name Proto-oceanus, which combined both halothermal and thermohaline processes (Fig. 13).
It is important to point out that the inverse relationship that exists between salinity and temperature, as calculated from 5180 composition, complicates direct temperature estimates for Hole 690B. The influence of salinity on 5180 composition requires that the temperatures of deep waters at Hole 690B were warmer than would be inferred directly from the oxygen isotopic values using normal temperature equations (Craig and Gordon, 1965; Shackleton, 1967). Salinity clearly played an important role in Paleogene ocean circulation and relatively large salinity gradients apparently existed vertically and meridionally. It follows, therefore, that paleotemperatures cannot be inferred directly from oxygen isotopic composition of deep water masses in the Paleogene without accounting for the salinity effect.
There are a number of implications resulting from the discovery of Ocean Proteus. The evolution of global climate during the Paleogene must have been governed by changes in ocean circulation patterns resulting from plate tectonics. Most previous climatic scenarios for the Paleogene have emphasized the importance of surface-water processes in exporting heat to the high latitudes. In Ocean Proteus it is clear that significant heat would have been transported meridionally to high latitudes at depth. This surely influenced the climatic evolution of the Antarctic continent and the surrounding Southern Oceans. A further corollary of warm, saline deep waters in the Paleogene oceans is that dissolved oxygen levels must have been lower at Site 690 compared with Site 689 and other areas not being influenced by this water mass. However, there is little evidence from Sites 689 and 690 to suggest that any significant differences existed in the oxygen content of deep waters between the two sequences, except possibly at the Paleocene/Eocene boundary which was marked by major extinctions of benthic foraminifers (Thomas, this volume). We also expected to observe lower 513C values in Hole 690B relative to those of Hole 689B assuming that oxygen levels were much lower in the warm, saline deep waters. The evidence presented earlier however, suggests that little difference existed in the 513C of benthic foraminifers in the two sequences during much of the Paleogene.
The diversity of deep-water sources and hence the inferred amount of physical and chemical variability also has significance with regard to the evolution of the Paleogene deep sea biota. Previous work on the deep sea fossil record has shown that the Paleogene was marked by higher faunal diversity, higher evolutionary rates, as well as intervals marked by large extinction events (Benson, 1975; Tjalsma and Lohmann, 1983; Douglas and Woodruff, 1981).
CONCLUSIONS 1. Oxygen and carbon isotopic gradients have been analyzed
in foraminifers of ODP Sites 689 and 690. The two sequences provide a Paleogene depth transect from the surface to about 2.5 km on Maud Rise in the Weddell Sea, Antarctica. The Maud Rise sequences are composed of well preserved calcareous biogenic sediments that span the Paleogene. The sequences have
876

PROTEUS AND PROTO-OCEANUS: ANCESTRAL PALEOGENE OCEANS
been sufficiently well dated using magnetobiostratigraphy to allow direct comparisons between the two sections. The sequences contain several distinct hiatuses that occur at different times in each site.
2. Clear reversals occur in the oxygen isotopic gradient between the shallower Hole 689B and the deeper Hole 690B. The isotopic reversal was established by at least 46 Ma, within the middle Eocene, and existed for most of the Paleogene. This indicates that intermediate waters were significantly warmer at depths represented by Hole 690B. The reversed isotopic gradient became especially strengthened in the early Oligocene. This may have resulted from progressive upward displacement of warm, saline deep waters by the developing cold, dense proto-Antarctic Bottom waters. This conclusion is supported by a progressive decrease and eventual reversal in benthic to planktonic foraminiferal 5180 gradients in Hole 690B during the Eocene, demonstrating that deeper waters became warmer relative to Antarctic surface waters. This is not observed in the shallower Hole 689B. The warm, saline deep waters discussed here are believed to have originated in the shallow Tethyan region at midlatitudes.
3. The presence of hiatuses of different ages within the Eocene in the two sequences indicates that they were each influenced by different intermediate water masses. The coincidence of the hiatuses with low stands of sea level suggest global climatic control on the deep-water circulation.
4. Although it is not possible, because of the inferred salinity effect, to apply specific paleotemperatures to the benthic 5180 records, the Paleogene pattern of climate change is well defined and is as follows: generally cooler early Paleocene; warming during the late Paleocene; climax of Cenozoic warmth during the early Eocene and continuing into the early middle Eocene; cooling mainly within a series of steps through the remainder of the Paleogene.
5. We envision two significantly different oceans during the Paleogene, each consisting of different deep-water structure. Proteus, of Eocene and possibly Paleocene age, was a two-layered ocean, consisting of warm, saline deep waters formed at middle to low latitudes and overlain by cooler intermediate waters formed at high latitudes. Proto-oceanus, of early to middle Oligocene age, was a three-layered ocean consisting of cold, dense bottom waters formed in the Antarctic (proto-AABW), overlain by warm, saline deep waters, and in turn overlain by cool intermediate waters formed in the polar regions. This represents an intermediate stage toward the modern oceanic structure whereby the formation of the deepest waters is dominated by high latitude processes. These models need to be tested by studies of similar depth transects in other parts of the oceans.
6. The Paleocene/Eocene boundary is marked by a brief reduction in surface to deep isotopic gradients associated with major warming, the warmest in the Antarctic for the entire Cenozoic. We believe that this event was associated with processes involving the formation of warm deep waters. The largest changes to have occurred in late Mesozoic and Cenozoic deep-sea benthic foraminiferal assemblages were associated with this event.
7. Salinity gradients clearly played an important role in deep-water circulation during the Paleogene. Paleotemperatures cannot be inferred directly from the oxygen isotopic composition of Paleogene benthic foraminifers without accounting for this salinity effect.
8. Proteus and Proto-oceanus have important implications with regard to global climatic evolution, including the development of the Antarctic cryosphere, the cycling of oceanic nutrients, oxygenation of deep waters and the global carbon cycle. Changes in these various components should have had an important influence on deep sea biotic evolution.
ACKNOWLEDGMENTS
We thank the scientific party of ODP Leg 113 for their pleasant cooperation and collaboration. Thanks are also extended to D. Pak, R. Fairbanks, and J. Zachos for their valuable assistance allowing this manuscript to be completed on time; and we thank Dr. E. L. Winterer for his useful comments. The criticism of several reviewers helped improve this manuscript: in particular, B. Curry, N. Shackleton, M. Arthur, P. Cloud, and J. Valentine. This research was supported by NSF grants DPP88-96183 and DPP89-11554 (Division of Polar Programs), and OCE87-13391 and OCE88-17135 (Marine Geology and Geophysics).
REFERENCES Askin, R. A., 1988. Campanian to Paleocene palynological succession
of Seymour and adjacent islands, northeastern Antarctic Peninsula. Geol. Soc. Am. Mem., 169:131-153.
Barker, P. E, Kennett, J. P., et al., 1988. Proc. ODP Init. Repts., 113, College Station, TX (Ocean Drilling Program).
Barrera, E., Huber, B. T., Savin, S. M., Webb, P.-N., 1987. Antarctic marine temperatures: Late Campanian through early Paleocene. Paleoceanography, 2:21-47.
Barrett, P. J., Elston, D. P., Harwood, D. M., McKelvey, B. C , Webb, P.-N., 1987. Mid-Cenozoic record of glaciation and sea-level change on the margin of the Victoria Land basin, Antarctica. Geology, 5: 634-637.
Benson, R. H., 1975. The origin of the psychrosphere as recorded in changes of deep sea ostracode assemblages. Lethaia, 8:69-83.
Berggren, W. A., Kent, D. V., and Flynn, J. J., 1985. Paleogene geochronology and chronostratigraphy. In Snelling, N. J. (Ed.), The Chronology of the Geological Record, Mem. 10. Geol. Soc. London, 141-195.
Boersma, A., Premoli-Silva, I., and Shackleton, N. J., 1987. Atlantic Eocene planktonic foraminiferal paleohydrographic indicators and stable isotope paleoceanography. Paleoceanography, 2:287-331.
Brass, G. W., Southam, J. R., and Peterson, W. H., 1982. Warm saline bottom water in the ancient ocean. Nature, 296:620-623.
Chamberlin, T. C , 1906. On a possible reversal of deep sea circulation and its influence on geologic climates. J. Geol., 14:363-373.
Craig, H, and Gordon, L. I., 1965. Deuterium and oxygen-18 variations in the ocean and the marine atmosphere. Proc. Stable Isotopes Oceanogr. Stud, and Paleotemp. Spoleto, 2:1-87.
Curry, W. B., and Lohmann, G. P., 1982. Carbon isotopic changes in benthic foraminifera from the western South Atlantic: reconstruction of glacial abyssal circulation patterns. Quat. Res., 18:218-235.
Deacon, G.E.R., 1963. The Southern Ocean. In Hill, M. N. (Ed.), The Sea, 2: New York (Interscience), 281-296.
Dercourt, J., Zonenshain, L. P., Ricou, L.-E., Kazmin., V. G, LePi-chon, X., Knipper, A. L., Grandjacquet, C , Sbortshikov, I. M., Geyssant, J., Lepvrier, C , Pechersky, D. H., Boulin, J., Sibuet, J.-C, Savostin, L. A., Sorokhtin, O., Westphal, M., Bazhenov, M. L., Lauer, J. P., and Biju-Duval, B., 1986. Geological evolution of the Tethys Belt from the Atlantic to the Pamirs since the Lias. Tectonophysics, 123:241-315.
Douglas, R. G, and Woodruff, E, 1981. Deep-sea benthic foraminifera. In Emiliani, C. (Ed.), The Oceanic Lithosphere, The Sea: N.Y. (John Wiley & Sons) 7:1233-1327.
Emiliani, C , 1954. Temperatures of Pacific bottom waters and polar superficial waters during the Tertiary. Science, 119:853-855.
Gordon, A. L., 1971. Comment on the Weddell Sea produced Antarctic Bottom Water. J. Geophys. Res., 76:5913-5914.
Haq, B. U, Hardenbol, J., and Vail, P. R., 1987. The new chronostratigraphic basis of Cenozoic and Mesozoic sea level cycles. Cushman Found. Foram. Res., Spec. Publ., 24:7-13.
Harwood, D., 1986. Diatoms. In Barrett, P. J. (Ed.), Antarctic history from theMSSTS-1 drillhole, McMurdo Sound. N. Z. Dept. Sci. In-dust. Res. Bull. 237:69-114.
Hay, W W, 1988. Paleoceanography: A review for the GSA Centennial. Geol. Soc. Am. Bull., 100, 12:1934-1956.
Keigwin, L. D., and Keller, G., 1984. Middle Oligocene climatic change from equatorial Pacific DSDP Site 77. Geology, 12:16-19.
877
J. P. KENNETT, L. D. STOTT
Keller, G., Herbert, T., Dorsey, R., D'Hondt, S., Johnsson, M., and Chi, W. R., 1987. Global distribution of late Paleogene hiatuses. Geology, 16:199-203.
Kemp, E. M., 1975. Palynology of Leg 28 drill sites, Deep sea Drilling Project. In Hayes, D. E., Frakes, L. A., et al., Init. Repts. DSDP, 28: Washington (U. S. Govt. Printing Office), 599-623.
Kemp, E. M., and Barrett, P. J., 1975. Antarctic glaciation and early Tertiary vegetation. Nature, 258:507-508.
Kennett, J. P., 1977. Cenozoic evolution of Antarctic glaciation, the Circum-Antarctic Ocean, and their impact on global paleoceanography. J. Geophys. Res., 82:3843-3860.
Kennett, J. P., and Shackleton, N. J., 1976. Oxygen isotope evidence for the development of the psychrosphere 38 Myr ago. Nature, 260:513-515.
Kennett, J. P., and von der Borch, C. C , 1986. Southwest Pacific Cenozoic Paleoceanography. In Kennett, J. P., von der Borch, C. C , et al., Init Repts. DSDP, 90: Washington (U. S. Govt. Printing Office), 1493-1517.
Kroopnick, P., 1985. The distribution of C-13 of TC0 2 in the world oceans. Deep-Sea Res., 32:57-84.
Margolis, S. V., and Kennett, J. P., 1971. Cenozoic paleoglacial history of Antarctica recorded in Subantarctic deep sea cores. Am. J. Sci., 271:1-36.
Matthews, R., and Poore, R. Z., 1980. Tertiary 1 80 record and glacioeustatic sea-level fluctuations. Geology, 8:501-504.
Miller, K. G., and Fairbanks, R. G., 1985. Oligocene to Miocene carbon isotope cycles and abyssal circulation changes. In Sundquist, E. T , and Broecker, W. S. (Eds.), The Carbon Cycle and Atmospheric C02: Natural Variations Archean to Present. Am. Geophys. Un. Mono. Ser., 32:469-486.
Miller, K. G., Fairbanks, R. G., and Mountain, G. S., 1987a. Tertiary oxygen isotope synthesis, sea level history, and continental margin erosion. Paleoceanography, 2:1-19.
Miller, K. G., Fairbanks, R. G., and Thomas, E., 1987b. Benthic foraminiferal carbon isotopic records and the development of abyssal circulation in the eastern North Atlantic, In Ruddiman, W. F , Kidd, R. B., et al. Init. Repts. DSDP, 94: Washington (U. S. Govt. Printing Office), 981-996.
Miller, K. G., Janecek, T R., Katz, M. E., and Keil, D. J., 1987c. Abyssal circulation and benthic foraminiferal changes near the Paleocene/Eocene boundary. Paleoceanography, 2:741-761.
Mix, A. C , and Fairbanks, R. G., 1985. North Atlantic surface-ocean control of Pleistocene deep-ocean circulation. Earth Planet. Sci. Lett., 73:231-243.
Murris, R. J., 1980. Hydrocarbon habitat of the Middle East. In Miall, A. D. (Ed.), Facts and Principles of World Petroleum Occurrence. CSPG Mem., 6:1-1004.
Nelson, C. S., 1986. Lithostratigraphy of Deep Sea Drilling Project Leg 90 drill sites in the Southwest Pacific: an overview. In Kennett, J. P., von der Borch, C. C , et al., Init. Repts. DSDP, 90: Washington (U.S. Govt. Printing Office), 1471-1491.
Oberhansli, H., 1986. Latest Cretaceous-early Neogene oxygen and carbon isotopic record at DSDP sites in the Indian Ocean. Mar. Micropaleontol., 10:91-115.
Oberhansli, H., and Tourmarkine, M., 1985. The Paleogene oxygen and carbon isotope history of Sites 522, 523, and 524 from the central South Atlantic. In Hsu, H. J., and Weissert, A. (Eds.), South Atlantic Paleoceanography: Cambridge (Cambridge Univ. Press), 124-147.
O'Neil, J. R., Clayton, R. N., and Mayeda, T. K., 1969. Oxygen isotope fractionation in divalent metal carbonates. J. Chem. Phys., 51: 5547-5558.
Prentice, M. L., and Matthews, R. K., 1988. Cenozoic ice-volume history: Development of a composite oxygen isotope record. Geology, 16:963-966.
Savin, S. M., Douglas, R. G., and Stehli, F. G., 1975. Tertiary marine paleotemperatures. Geol. Soc. Am. Bull., 86:1499.
Shackleton, N. J., 1967. Oxygen isotope analyses and paleotemperatures reassessed. Nature, 215:15-17.
, 1974. Attainment of isotopic equilibrium between ocean water and the benthonic foraminifera genus Uvigerina: isotopic changes in the ocean during the last Glacial. CNRS Res., Colloquim, 219: 203-209.
, 1986. Paleogene stable isotope events. Palaeogeogr., Palaeoclimatol., Palaeoecol., 57:91-102.
Shackleton, N. J., and Opdyke, N. D., 1973. Oxygen isotope and paleomagnetic stratigraphy of equatorial Pacific Core V28-238: Oxygen isotope temperatures and ice volumes on a I05 year and I06 year scale. Quat. Res., 3:39-55.
Shackleton, N. J., and Kennett, J. P., 1975. Paleotemperature history of the Cenozoic and the initiation of Antarctic glaciation: Oxygen and carbon isotope analyses in DSDP Sites 277, 279, and 281. In Kennett, J. P., Houtz, R. E., et al., Init. Repts. DSDP, 29: Washington (U.S. Govt. Printing Office), 743-756.
Shackleton, N. J., Imbrie, J., and Hall, M. A., 1983. Oxygen and carbon isotope record of East Pacific core VI9-30: implications for the formation of deep water in the late Pleistocene North Atlantic. Earth Planet. Sci. Lett., 65:233-244.
Shackleton, N. J., Hall, M. A., and Boersma, A., 1984. Oxygen and carbon isotope data from Leg 74 foraminifers. In Moore, T. C , Jr., Rabinowitz, P. D., et al., Init. Repts. DSDP, 74: Washington (U.S. Govt. Printing Office), 599-612.
Smith, A. G., and Briden, J. C , 1977. Mesozoic and Cenozoic Pa-leocontinental Maps: Cambridge (Cambridge Univ. Press).
Smith, A. G., Hurley, A. M., and Briden, J. C , 1981. Phanerozoic Pa-leocontinental World Maps: Cambridge (Cambridge Univ. Press).
Tjalsma, R. C, and Lohmann, G. P., 1983. Paleocene-Eocene bathyal and abyssal benthic foraminifera from the Atlantic Ocean. Micropaleontol. Spec. Publ, 4:1-90.
Truswell, E. M., 1983. Recycled Cretaceous and Tertiary pollen and spores in Antarctic marine sediments: A Catalogue. Palaeonto-graphicaB. 186:121-174.
Vail, P. R., and Hardenbol, J., 1979. Sea level changes during the Tertiary. Oceanus, 22:71-79.
Wilde, P., and Berry, W.B.N., 1986. The role of oceanographic factors in the generation of global bio-events. In Walliser, O. (Ed.), Lecture Notes in Earth Sciences, 8, Global Bio-events: Berlin (Springer-Verlag), 75-91.
Woodruff, F., and Savin, S. M., 1989. Miocene deepwater oceanography. Paleoceanography, 4:87-140.
Woodruff, F , Savin, S. M., and Douglas, R. G., 1980. Biological fractionation of oxygen and carbon isotopes by recent benthic foraminifera. Mar. Micropaleontol., 5:3-11.
Date of initial receipt: 1 May 1989 Date of acceptance: 16 October 1989 Ms 113B-188
APPENDIX ODP Leg 113 Benthic Isotope Data (not corrected)
Age Core, section, (Ma) Hole interval (cm)
26.19 689B 8-1, 35-39 26.37 26.46 26.55 26.55 26.72 26.81 26.90 26.99 27.08 27.16 27.41 27.94 28.03 28.24 28.64 29.07 29.22 29.34 29.46 29.58 29.70 29.82 29.94 30.27 30.39
8-2, 35-39 8-2, 110-114 8-3, 35-39 8-3, 35-39 8-4, 35-39 8-4, 110-114 8-5, 35-39 8-5, 110-114 8-6, 35-39 8-6, 110-114 9-1, 110-114 9-4, 110-114 9-5, 35-39 9-6, 35-39 10-1, 35-39 10-2, 110-115 10-3, 35-39 10-3, 110-115 10-4, 35-39 10-4, 110-115 10-5, 35-39 10-5, 110-115 10-6, 35-39 11-1, 35-39 11-1, 109-113
Depth (mbsf)
62.85 64.35 65.10 65.85 65.85 67.35 68.10 68.85 69.60 70.35 71.10 73.20 77.70 78.45 79.95 82.05 84.30 85.05 85.80 86.55 87.30 88.05 88.80 89.55 91.65 92.39
Cibicidoides
18Q
2.11 2.07 2.28 2.50
2.02 2.12 2.34
2.17 2.34 2.32 3.10 2.66 2.80 3.43 3.18 2.61 2.99 2.51 2.64 2.76 2.62 2.58 2.36
13C
0.63 0.80 0.92 0.93
0.48 0.55 0.47
0.54 0.80 0.70 1.23 0.63 0.80 1.06 1.02 0.65 0.95 0.66 0.65 0.71 0.43 0.52 0.45
Nuttallides
18Q
2.19 2.06
2.20 2.09 2.37 2.01 2.07 2.65 2.20 2.43
3.20
2.79
3.61
13C
0.37 0.59
0.60 0.67 0.63 0.60 0.40 0.72 0.45 0.05
1.08
0.87
1.23
878

Appendix (continued).
PROTEUS AND PROTO-OCEANUS: ANCESTRAL PALEOGENE OCEANS
Appendix (continued).
Age (Ma)
30.50 30.73 31.19 31.19 31.86 31.98 32.11 32.28 32.46 32.63 32.81 33.17 33.35 33.53 33.72 33.86 34.05 34.23 34.60 34.78 34.96 35.14 35.32 35.47 35.61 36.07 36.26 36.46 38.76 38.91 39.07 39.21 39.37 39.75 40.24 40.31 40.45 40.52 40.59 40.73 40.80 40.94 40.99 41.01 41.08 41.13 41.26 41.42 41.49 41.72 41.95 42.19 42.42 42.65 42.87 43.33 43.80 44.20 44.39 44.71 44.80 45.08 45.17 45.26 45.36 45.45 45.54 45.64 45.64 45.73 45.82 45.92 46.01 46.27 46.36 46.46 46.74
Core, section, Hole interval (cm)
689B 11-2,35-39 11-3, 35-39 11-5, 35-39 11-5, 35-39 12-1, 110-114 12-2, 35-39 12-2, 110-114 12-3, 35-39 12-3, 110-114 12-4, 35-39 12-4, 110-114 12-5, 110-114 12-6, 35-39 12-6, 110-114 12-7, 35-39 13-1, 35-39 13-1, 110-115 13-2, 35-39 13-3, 35-39 13-3, 111-116 13-4, 34-38 13-4, 111-116 13-5, 34-38 13-5, 111-116 13-6, 34-38 14-1, 37-39 14-1, 110-114 14-2, 36-40 15-2, 35-39 15-2, 107-112 15-3, 35-39 15-3, 107-112 15-4, 35-39 15-6, 107-112 16-3, 110-114 16-4, 35-37 16-5, 35-37 16-5, 110-114 16-6, 35-37 16-7, 35-37 17-1, 35-37 17-2, 35-37 17-2, 87-89 17-2, 110-112 17-3, 35-37 17-3, 87-89 17-4, 35-37 17-4, 87-89 17-4, 110-112 17-5, 35-37 17-5, 110-112 17-6, 35-37 17-6, 110-112 17-7, 35-37 18-1, 36-38 18-2, 36-38 18-3, 36-38 18-4, 36-38 18-4, 110-113 18-5, 110-113 18-6, 36-38 19-1, 35-39 19-1, 110-114 19-2, 35-39 19-2, 110-114 19-3, 35-39 19-3, 110-114 19-4, 35-39 19-4, 35-39 19-4, 110-114 19-5, 35-39 19-5, 110-114 19-6, 35-39 20-1, 35-39 20-1, 109-113 20-2, 35-39 20-3, 109-113
Depth (mbsf)
93.15 94.65 97.65 97.65
102.10 102.85 103.60 104.35 105.10 105.85 106.60 108.10 108.85 109.60 110.35 110.95 111.70 112.45 113.95 114.71 115.43 116.20 116.94 117.71 118.45 120.57 121.30 122.06 131.65 132.37 133.15 133.87 134.65 138.37 143.50 144.25 145.75 146.50 147.25 148.75 149.45 150.95 151.47 151.70 152.45 152.97 153.95 154.47 154.70 155.45 156.20 156.95 157.70 158.45 159.16 160.66 162.16 163.66 164.40 165.90 166.66 168.85 169.60 170.35 171.10 171.85 172.60 173.35 173.36 174.10 174.85 175.60 176.35 178.45 179.19 179.95 182.19
Cibicidoides Nuttallides
180
2.65 2.42 2.26 2.22 2.25 2.29 2.26 2.22 2.00 2.26 2.19 2.35 2.12 2.07 1.94 2.65 2.20 2.13 2.10 2.19 2.18 2.39 2.35 2.37 2.50 1.62 1.19 1.26 1.00 0.98 1.13 1.18 1.39 1.56 1.49 1.56 1.16 1.10 1.21 0.77 1.10 1.07 0.98 1.04 0.95 0.95 0.93 0.91 1.12 0.79 0.99 0.95 0.97 0.75 0.62 0.32 0.27 0.50 0.62
0.31 0.32 0.23 0.44 0.17 0.28 0.36
0.40 0.36 0.39 0.16 0.26 0.25
13C 18 0
0.43 0.16 0.45 0.56 0.26 0.37 0.43 0.64 0.74 0.95 0.88 0.84 0.80 0.76 0.75 0.99 0.99 0.99 1.07 1.02 1.01 1.24 1.41 1.32 1.50 1.02 0.65 0.99 1.04 1.29 1.32 1.19 1.04 0.78 0.85 0.75 0.67 0.72 0.84 0.40 0.77 0.94 0.79 0.76 0.73 0.62 0.62 0.66 0.73 0.75 0.70 0.82 1.11 1.15 1.07 1.09 0.94 1.00 0.59
0.39 0.82 0.68 0.92 0.71 0.73 0.67 0.72
0.52 0.47 0.41 0.25
0.62 0.65 0.50 0.53 0.32 0.53
Age 13C (Ma) Hole
46.83 689B 47.82 47.91 48.59 48.68 48.76 48.93 49.02 49.10 49.19 49.28 57.72 57.94 58.15 63.72 63.86 63.94 64.42 64.72 64.86 64.97 65.48 65.75 65.88 66.23 66.25 66.53 66.54 66.86 67.14 67.14 67.14 67.14 26.54 690B 26.74 26.83 26.93 27.03 27.12 27.22 27.32 27.42 27.51 27.61 27.71 27.93 28.18 28.39 28.50 28.61 29.04 29.36 29.46 29.57 29.68 29.85 30.07 30.30 30.38
0.23 30.59 30.59 30.70 30.79 30.90 31.00 31.19 31.35
0.21 31.54 0.20 32.05 0.19 32.38 0.01 32.70
33.03 33.36 33.68 34.64 34.96 35.29
Core, section, interval (cm)
20-4, 35-39 21-3 21-3 22-1 22-1 22-2 22-3 22-3 22-4 22-4 22-5 23-1 23-2 23-2 25-2 25-2 25-2 25-2 25-3 25-2 25-3 25-3 25-4 25-4 25-5 25-5 25-5 25-5 25-6 26-1 26-1 26-1 26-1
, 35-39 , 110-114 , 35-39 , 110-114 , 35-39 , 35-39 , 110-114 , 35-39 , 110-114 , 35-39 , 108-112 , 35-39 , 108-112 , 25-28 , 45-49 , 58-62 , 129-133 , 23-27 , 43-46 , 60-63 , 135-138 , 25-28 ,44-47 , 51-53 , 79-81 , 91-94 , 94-96 , 98-100 , 14-16 , 14-16 , 17-20 , 17-20
7-1, 35-39 7-2, 7-2, 7-3, 7-3, 7-4, 7-4, 7-5, 7-5, 7-6, 7-6, 7-7, 8-1, 8-1, 8-2, 8-3, 8-3, 8-5, 8-7, 9-1, 9-1, 9-2, 9-2, 9-3, 9-3, 9-4, 9-5, 9-5, 9-5, 9-6, 9-6, 9-7,
35-39 110-114 35-39 110-114 35-39 110-114 35-39 110-114 35-39 110-114 35-39 36-38 110-114 110-114 36-39 110-114 110-114 36-38 35-38 110-115 35-40 110-115 35-40 110-115 35-40 35-40 35-40 110-115 35-40 110-115 35-40
10-1, 110-115 10-2, 35-40 10-2, 110-115 10-4, 35-40 10-4, 110-115 10-5, 35-40 10-5, 110-115 10-6, 35-40 10-6, 110-115 11-1, 110-114 11-2, 35-39 11-2 , 110-114
Depth (mbsf)
182.95 191.15 191.90 197.85 198.60 199.35 200.85 201.60 202.35 203.10 203.85 208.28 209.05 209.78 228.35 228.55 228.68 229.39 229.83 230.03 230.20 120.95 231.35 231.54 233.12 233.40 233.51 233.54 235.08 236.44 236.44 236.47 236.47
50.75 52.25 53.00 53.75 54.50 55.25 56.00 56.75 57.50 58.25 59.00 59.75 60.46 61.20 62.70 63.46 64.20 67.20 69.46 70.15 70.90 71.65 72.40 73.15 73.90 74.65 76.15 76.15 76.95 77.65 78.40 79.15 80.50 81.25 82.00 84.25 85.00 85.75 86.50 87.25 88.00 90.20 90.95 91.70
Cibicidoides
18Q
0.25 0.17 0.06
0.31
0.15 0.24 0.08
0.24
0.15 0.40 0.62 0.37
2.49 2.59 2.40 2.62
2.33 2.38 2.54 2.25 2.27 2.19 2.24 2.32 2.47 2.36 2.95 2.43 2.21 2.27
2.62 2.44 2.02 2.06 2.04 2.24 2.07 2.07 2.13 2.11 2.01 1.97 2.36 2.36 1.97 1.80 1.96 1.95 2.04 1.87 1.53 2.20 1.76 1.97
13C
0.55 0.59 0.63
1.19
1.13 1.16 1.36
0.41
1.38 1.54 2.00 1.95
0.76 0.64 0.57 0.57 0.68 0.62 0.75 0.90 0.81 1.11 0.82 0.71 0.76 0.65 0.66 0.76 0.41 0.30 0.52
0.97 0.75 0.53 0.35 0.60 0.81 0.42 0.56 0.40 0.54 0.68 0.66 0.68 0.37 0.34 0.96 1.10 1.08 1.10 0.81 0.71 1.00 1.33 1.31
Nuttallides
18Q
-0 .32 -0 .38 -0 .10 -0 .43 -0 .59
-0 .02 0.19 0.12 0.24 0.08 0.13 0.12 0.01
-0 .01 0.15
-0 .07 -0 .05 -0 .09 -0 .09
0.27 0.41 0.82 0.44 0.86
2.25
2.28 2.05 1.90
2.10
2.42
2.35 2.34
13C
0.39 0.47 0.60 0.55 0.14
0.92 0.95 1.08 1.13 1.21 1.15 1.15 1.18 1.22 1.23 1.23 1.37 1.33 1.32
0.93 0.94 1.22 1.00 1.19
0.61
0.74 0.75 0.76
0.73
0.40
0.40 0.30
879
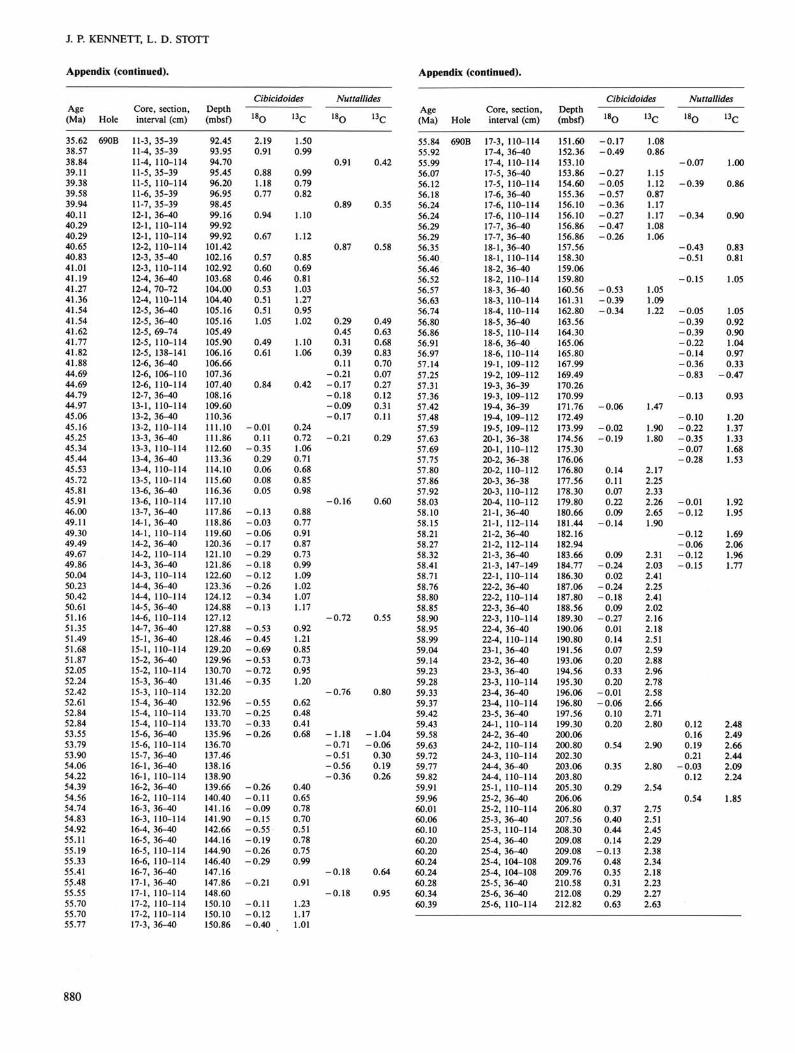
J. P. KENNETT, L. D. STOTT
Appendix (continued). Appendix (continued).
Age Core, section, (Ma) Hole interval (cm)
35.62 690B 11-3,35-39 38.57 38.84 39.11 39.38 39.58 39.94 40.11 40.29 40.29 40.65 40.83 41.01 41.19 41.27 41.36 41.54 41.54 41.62 41.77 41.82 41.88 44.69 44.69 44.79 44.97 45.06 45.16 45.25 45.34 45.44 45.53 45.72 45.81 45.91 46.00 49.11 49.30 49.49 49.67 49.86 50.04 50.23 50.42 50.61 51.16 51.35 51.49 51.68 51.87 52.05 52.24 52.42 52.61 52.84 52.84 53.55 53.79 53.90 54.06 54.22 54.39 54.56 54.74 54.83 54.92 55.11 55.19 55.33 55.41 55.48 55.55 55.70 55.70 55.77
11-4 11-4 11-5 11-5 11-6 11-7 12-1 12-1 12-1 12-2 12-3 12-3 12-4 12-4 12-4 12-5 12-5 12-5 12-5 12-5 12-6 12-6 12-6 12-7 13-1 13-2 13-2 13-3 13-3 13-4 13-4 13-5 13-6 13-6 13-7 14-1 14-1 14-2 14-2 14-3 14-3 14-4 14-4 14-5 14-6 14-7 15-1 15-1 15-2 15-2 15-3 15-3 15-4 15-4 15-4 15-6 15-6 15-7 16-1 16-1 16-2 16-2, 16-3 16-3, 16-4, 16-5, 16-5, 16-6, 16-7, 17-1, 17-1 17-2 17-2 17-3
, 35-39 110-114 35-39 110-114 35-39 35-39 36-40 110-114 110-114 110-114 35-40 110-114 36-40 70-72 110-114 36-40 36-40 69-74 110-114 138-141 36-40 106-110 110-114 36-40 110-114 36-40 110-114 36-40 110-114 36-40 110-114 110-114 36-40 110-114 36-40 36-40 110-114 36-40 110-114 36-40 110-114 36-40 110-114 36-40 110-114 36-40 36-40 110-114 36-40 110-114 36-40 110-114 36-40 110-114 110-114 36-40 110-114 36-40 36-40 110-114 36-40 110-114 36-40 110-114 36-40 36-40 110-114 110-114 36-40 36-40 110-114 110-114 110-114 36-40
Depth (mbsf)
92.45 93.95 94.70 95.45 96.20 96.95 98.45 99.16 99.92 99.92
101.42 102.16 102.92 103.68 104.00 104.40 105.16 105.16 105.49 105.90 106.16 106.66 107.36 107.40 108.16 109.60 110.36 111.10 111.86 112.60 113.36 114.10 115.60 116.36 117.10 117.86 118.86 119.60 120.36 121.10 121.86 122.60 123.36 124.12 124.88 127.12 127.88 128.46 129.20 129.96 130.70 131.46 132.20 132.96 133.70 133.70 135.96 136.70 137.46 138.16 138.90 139.66 140.40 141.16 141.90 142.66 144.16 144.90 146.40 147.16 147.86 148.60 150.10 150.10 150.86
Cibicidoides
18 0
2.19 0.91
0.88 1.18 0.77
0.94
0.67
0.57 0.60 0.46 0.53 0.51 0.51 1.05
0.49 0.61
0.84
-0 .01 0.11
-0 .35 0.29 0.06 0.08 0.05
-0 .13 -0 .03 -0 .06 -0 .17 -0 .29 -0 .18 -0 .12 -0 .26 -0 .34 -0 .13
-0 .53 -0 .45 -0 .69 -0 .53 -0 .72 -0 .35
-0 .55 -0 .25 -0 .33 -0 .26
-0 .26 -0 .11 -0 .09 -0 .15 -0 .55 -0 .19 -0 .26 -0 .29
-0 .21
-0 .11 — 0.12 -0 .40
13C
1.50 0.99
0.99 0.79 0.82
1.10
1.12
0.85 0.69 0.81 1.03 1.27 0.95 1.02
1.10 1.06
0.42
0.24 0.72 1.06 0.71 0.68 0.85 0.98
0.88 0.77 0.91 0.87 0.73 0.99 1.09 1.02 1.07 1.17
0.92 1.21 0.85 0.73 0.95 1.20
0.62 0.48 0.41 0.68
0.40 0.65 0.78 0.70 0.51 0.78 0.75 0.99
0.91
1.23 1.17 1.01
Nuttallides
18Q
0.91
0.89
0.87
0.29 0.45 0.31 0.39 0.11
-0 .21 -0 .17 -0 .18 -0 .09 -0 .17
-0 .21
-0 .16
-0 .72
-0 .76
-1 .18 -0 .71 -0 .51 -0 .56 -0 .36
-0 .18
-0 .18
13C
0.42
0.35
0.58
0.49 0.63 0.68 0.83 0.70 0.07 0.27 0.12 0.31 0.11
0.29
0.60
0.55
0.80
-1 .04 -0 .06
0.30 0.19 0.26
0.64
0.95
Age Core, section, (Ma) Hole interval (cm)
55.84 690B 17-3 55.92 55.99 56.07 56.12 56.18 56.24 56.24 56.29 56.29 56.35 56.40 56.46 56.52 56.57 56.63 56.74 56.80 56.86 56.91 56.97 57.14 57.25 57.31 57.36 57.42 57.48 57.59 57.63 57.69 57.75 57.80 57.86 57.92 58.03 58.10 58.15 58.21 58.27 58.32 58.41 58.71 58.76 58.80 58.85 58.90 58.95 58.99 59.04 59.14 59.23 59.28 59.33 59.37 59.42 59.43 59.58 59.63 59.72 59.77 59.82 59.91 59.96 60.01 60.06 60.10 60.20 60.20 60.24 60.24 60.28 60.34 60.39
17-4 17-4 17-5 17-5 17-6 17-6 17-6 17-7 17-7 18-1, 18-1 18-2, 18-2, 18-3, 18-3, 18-4, 18-5, 18-5, 18-6, 18-6, 19-1, 19-2, 19-3, 19-3, 19-4, 19-4, 19-5, 20-1, 20-1, 20-2, 20-2, 20-3, 20-3, 20-4, 21-1, 21-1, 21-2, 21-2, 21-3, 21-3, 22-1, 22-2, 22-2, 22-3, 22-3, 22-4, 22-4, 23-1, 23-2, 23-3, 23-3, 23-4, 23-4, 23-5, 24-1, 24-2, 24-2, 24-3, 24-4, 24-4, 25-1, 25-2, 25-2, 25-3, 25-3, 25-4, 25-4, 25-4, 25-4, 25-5, 25-6, 25-6,
110-114 36-40 110-114 36-40 110-114 36-40 110-114 110-114 36-40 36-40 36-40 110-114 36-40 110-114 36-40 110-114 110-114 36-40 110-114 36-40 110-114 109-112 109-112 36-39 109-112 36-39 109-112 109-112 36-38 110-112 36-38 110-112 36-38 110-112 110-112 36-40 112-114 36-40 112-114 36-40 147-149 110-114 36-40 110-114 36-40 110-114 36-40 110-114 36-40 36-40 36-40 110-114 36-40 110-114 36-40 110-114 36-40 110-114 110-114 36-40 110-114 110-114 36-40 110-114 36-40 110-114 36-40 36-40 104-108 104-108 36-40 36-40 110-114
Depth (mbsf)
151.60 152.36 153.10 153.86 154.60 155.36 156.10 156.10 156.86 156.86 157.56 158.30 159.06 159.80 160.56 161.31 162.80 163.56 164.30 165.06 165.80 167.99 169.49 170.26 170.99 171.76 172.49 173.99 174.56 175.30 176.06 176.80 177.56 178.30 179.80 180.66 181.44 182.16 182.94 183.66 184.77 186.30 187.06 187.80 188.56 189.30 190.06 190.80 191.56 193.06 194.56 195.30 196.06 196.80 197.56 199.30 200.06 200.80 202.30 203.06 203.80 205.30 206.06 206.80 207.56 208.30 209.08 209.08 209.76 209.76 210.58 212.08 212.82
Cibicidoides
18Q
-0 .17 -0 .49
-0 .27 -0 .05 -0 .57 -0 .36 -0 .27 -0 .47 -0 .26
-0 .53 -0 .39 -0 .34
-0 .06
-0 .02 -0 .19
0.14 0.11 0.07 0.22 0.09
-0 .14
0.09 -0 .24
0.02 -0 .24 -0 .18
0.09 -0 .27
0.01 0.14 0.07 0.20 0.33 0.20
-0 .01 -0 .06
0.10 0.20
0.54
0.35
0.29
0.37 0.40 0.44 0.14
-0 .13 0.48 0.35 0.31 0.29 0.63
13C
1.08 0.86
1.15 1.12 0.87 1.17 1.17 1.08 1.06
1.05 1.09 1.22
1.47
1.90 1.80
2.17 2.25 2.33 2.26 2.65 1.90
2.31 2.03 2.41 2.25 2.41 2.02 2.16 2.18 2.51 2.59 2.88 2.96 2.78 2.58 2.66 2.71 2.80
2.90
2.80
2.54
2.75 2.51 2.45 2.29 2.38 2.34 2.18 2.23 2.27 2.63
Nuttallides
18Q
-0 .07
-0 .39
-0 .34
-0 .43 -0 .51
-0 .15
-0 .05 -0 .39 -0 .39 -0 .22 -0 .14 -0 .36 -0 .83
-0 .13
-0 .10 -0 .22 -0 .35 -0 .07 -0 .28
-0 .01 -0 .12
-0 .12 -0 .06 -0 .12 -0 .15
0.12 0.16 0.19 0.21
-0 .03 0.12
0.54
13C
1.00
0.86
0.90
0.83 0.81
1.05
1.05 0.92 0.90 1.04 0.97 0.33
-0 .47
0.93
1.20 1.37 1.33 1.68 1.53
1.92 1.95
1.69 2.06 1.96 1.77
2.48 2.49 2.66 2.44 2.09 2.24
1.85
880