4542 geodetic network design and strategies followed for ... · geodetic network design and...
TRANSCRIPT
TS 6H - Engineering Surveys I
Jesus Velasco, Juan Prieto, Tomas Herrero and Jose Fabrega
Geodetic network design and strategies followed for drilling a 25 km tunnel for high speed railway in Spain
FIG Congress 2010
Facing the Challenges – Building the Capacity
Sydney, Australia, 11-16 April 2010
1/18
Geodetic network design and strategies followed for drilling a 25 km tunnel
for high speed railway in Spain
Jesus VELASCO, Juan PRIETO, Tomas HERRERO and Jose FABREGA, Spain
Key words: TBM, tunnel breakthrough, underground network, surface network, accuracy,
gyrotheodolite azimuth
SUMMARY
During the last years several large high-speed railway tunnels have been built in Spain. To
solve these projects, technical and scientific problems have been solved from the geodetic and
surveying point of view. These studies have allowed us to set a methodology that optimizes
the performance of this kind of works in the world of Civil Engineering.
We have applied our studies to the Tunnels of Pajares that are the second longest ones in
Spain with a total longitude of about 25 km. The studies summarize the design of the geodetic
networks to support the guidance of the TBMs used as well as the election of the observations
to be done, the instrumental to be used and the observation and computation procedures to be
followed.
A special emphasis has been taken into account for the treatment of the uncertainty of the
coordinates, displacements and breakthrough obtained during the drilling tasks. The article
shows the results obtained and the conclusions that can be followed in order to successfully
complete a similar project.
TS 6H - Engineering Surveys I
Jesus Velasco, Juan Prieto, Tomas Herrero and Jose Fabrega
Geodetic network design and strategies followed for drilling a 25 km tunnel for high speed railway in Spain
FIG Congress 2010
Facing the Challenges – Building the Capacity
Sydney, Australia, 11-16 April 2010
2/18
Geodetic network design and strategies followed for drilling a 25 km tunnel
for high speed railway in Spain
Jesus VELASCO, Juan PRIETO, Tomas HERRERO and Jose FABREGA, Spain
1. INTRODUCTION
During the last years, 25 km long high-speed railway tunnels (Tunnels of Guadarrama and
Tunnels of Pajares) have been built in Spain, being currently the 4th and 7th longest tunnels in
the world. Technical and scientific problems that we have had to solve in these projects, in
geodetic and surveying fields, have allowed us to set a methodology that optimizes the
performance of this kind of works in the world of Civil Engineering.
Pajares tunnels are part of the so called Pajares bypass and they belong to the new high-speed
railway line leading to Asturias from the Castilian plateau and through the Cantabrian
Mountain Rift.
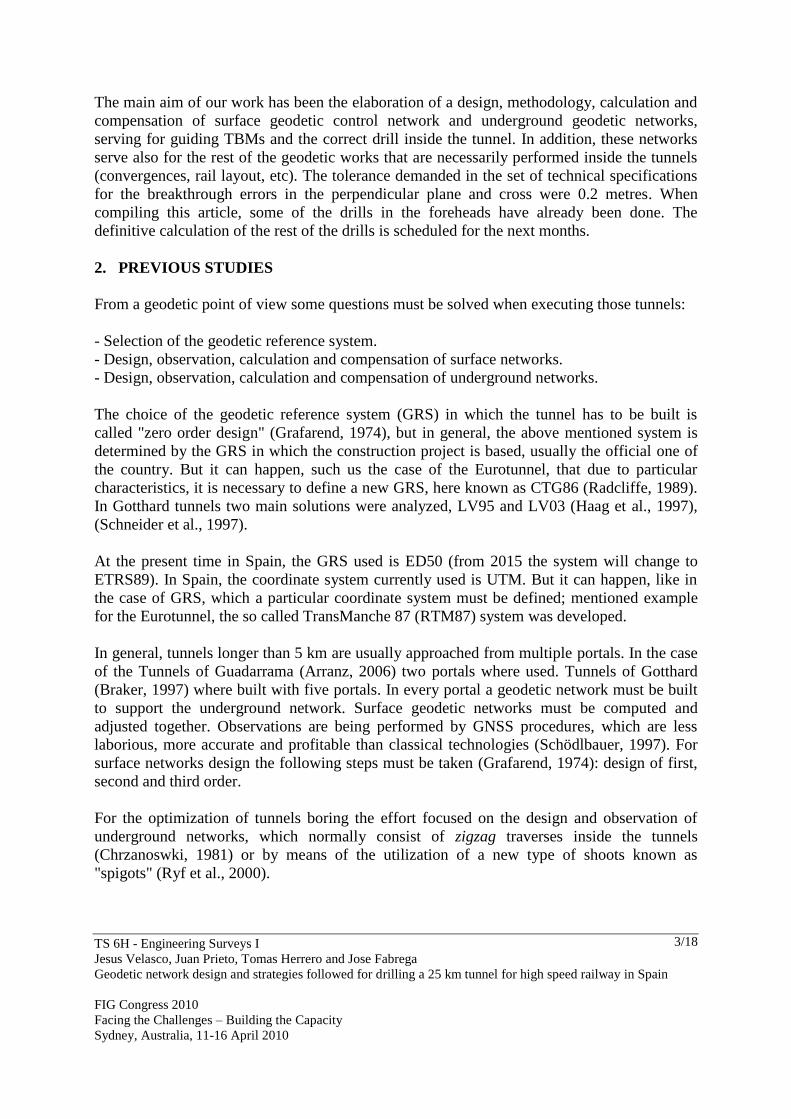
Pajares base tunnels, of about 25 km length, consist of two parallel tubes followed by two 40
meters long parallel viaducts. The distance between the tubes of the tunnels is about 50 meters
with cross-passages every 400 meters, see figure 1.
The boring of these tunnels has been made with five Tunnel Boring Machine (TBMs). Two of
them started from the South end (Pola de Gordón) boring with north direction; another one
started from Buiza, located in an intermediate zone of the project, boring a 5.5 km gallery.
The last two ones connecting the North end with the South end from Telledo. Four of the five
TBMs used were single shielded and one double shielded.
Figure 1.-PajaresTtunnels project overview (modified from adif.es)
ASTURIAS
NORTH
24.6 km
3.9 km
10.3 km
10.4 km
CROSS PASSAGES SECTION
TS 6H - Engineering Surveys I
Jesus Velasco, Juan Prieto, Tomas Herrero and Jose Fabrega
Geodetic network design and strategies followed for drilling a 25 km tunnel for high speed railway in Spain
FIG Congress 2010
Facing the Challenges – Building the Capacity
Sydney, Australia, 11-16 April 2010
3/18
The main aim of our work has been the elaboration of a design, methodology, calculation and
compensation of surface geodetic control network and underground geodetic networks,
serving for guiding TBMs and the correct drill inside the tunnel. In addition, these networks
serve also for the rest of the geodetic works that are necessarily performed inside the tunnels
(convergences, rail layout, etc). The tolerance demanded in the set of technical specifications
for the breakthrough errors in the perpendicular plane and cross were 0.2 metres. When
compiling this article, some of the drills in the foreheads have already been done. The
definitive calculation of the rest of the drills is scheduled for the next months.
2. PREVIOUS STUDIES
From a geodetic point of view some questions must be solved when executing those tunnels:
- Selection of the geodetic reference system.
- Design, observation, calculation and compensation of surface networks.
- Design, observation, calculation and compensation of underground networks.
The choice of the geodetic reference system (GRS) in which the tunnel has to be built is
called "zero order design" (Grafarend, 1974), but in general, the above mentioned system is
determined by the GRS in which the construction project is based, usually the official one of
the country. But it can happen, such us the case of the Eurotunnel, that due to particular
characteristics, it is necessary to define a new GRS, here known as CTG86 (Radcliffe, 1989).
In Gotthard tunnels two main solutions were analyzed, LV95 and LV03 (Haag et al., 1997),
(Schneider et al., 1997).
At the present time in Spain, the GRS used is ED50 (from 2015 the system will change to
ETRS89). In Spain, the coordinate system currently used is UTM. But it can happen, like in
the case of GRS, which a particular coordinate system must be defined; mentioned example
for the Eurotunnel, the so called TransManche 87 (RTM87) system was developed.
In general, tunnels longer than 5 km are usually approached from multiple portals. In the case
of the Tunnels of Guadarrama (Arranz, 2006) two portals where used. Tunnels of Gotthard
(Braker, 1997) where built with five portals. In every portal a geodetic network must be built
to support the underground network. Surface geodetic networks must be computed and
adjusted together. Observations are being performed by GNSS procedures, which are less
laborious, more accurate and profitable than classical technologies (Schödlbauer, 1997). For
surface networks design the following steps must be taken (Grafarend, 1974): design of first,
second and third order.
For the optimization of tunnels boring the effort focused on the design and observation of
underground networks, which normally consist of zigzag traverses inside the tunnels
(Chrzanoswki, 1981) or by means of the utilization of a new type of shoots known as
"spigots" (Ryf et al., 2000).
TS 6H - Engineering Surveys I
Jesus Velasco, Juan Prieto, Tomas Herrero and Jose Fabrega
Geodetic network design and strategies followed for drilling a 25 km tunnel for high speed railway in Spain
FIG Congress 2010
Facing the Challenges – Building the Capacity
Sydney, Australia, 11-16 April 2010
4/18
The greatest source of errors inside the tunnels is due to the lateral refraction. As a
consequence of the experience in the construction of the Channel Tunnel (Johnston, 1998),
(Koritkke, 1990), the results confirmed that a traverse along the axis is the smartest way to
reduce the above mentioned effect. Also new technologies developed to minimize the effect
of lateral refraction have been detailed (Ingesand, 2008), (Bockem et al., 2000).
Following conclusions have been taken using the tests performed by different observation
methods in the access gallery to the central well of Gotthard tunnel: always avoid sights closer
than 1.5 meters from the tunnel walls and the use of a gyrotheodolite. The gyrotheodolite
avoid the lateral refraction errors and checks the traverse angular transmission errors.
The studies of Lewen (2006), Brunner and Grillmayer (2002) hardly describe the
gyrotheodolite and its applications in tunnel control networks. But the question is: how many
axes of gyrotheodolite and how many observations to minimize errors must be done? In
Charznowski (1981), Martusewicz (1993), Jaroz and Baran (1999) the final conclusion is to
observe approximately a gyro-azimuth every kilometre, doing cross observations to minimize
lateral refraction effect.
For the design of the traverses, as we have commented previously, the most suitable are those
that go along the tunnel axis. But the problem is that the tunnel axis is usually occupied by
transportation infrastructures and services inside the tunnel. For this reason, this design is only
useful to make control measures during technical stops in the works. In other case, a zigzag
traverse must cross from gable-wall to gable-wall in order to avoid lateral refraction. This
design permits machinery movements along the tunnel with minimal affection to traverses
(Velasco, 2007).
3. METHODOLOGY AND RESULTS
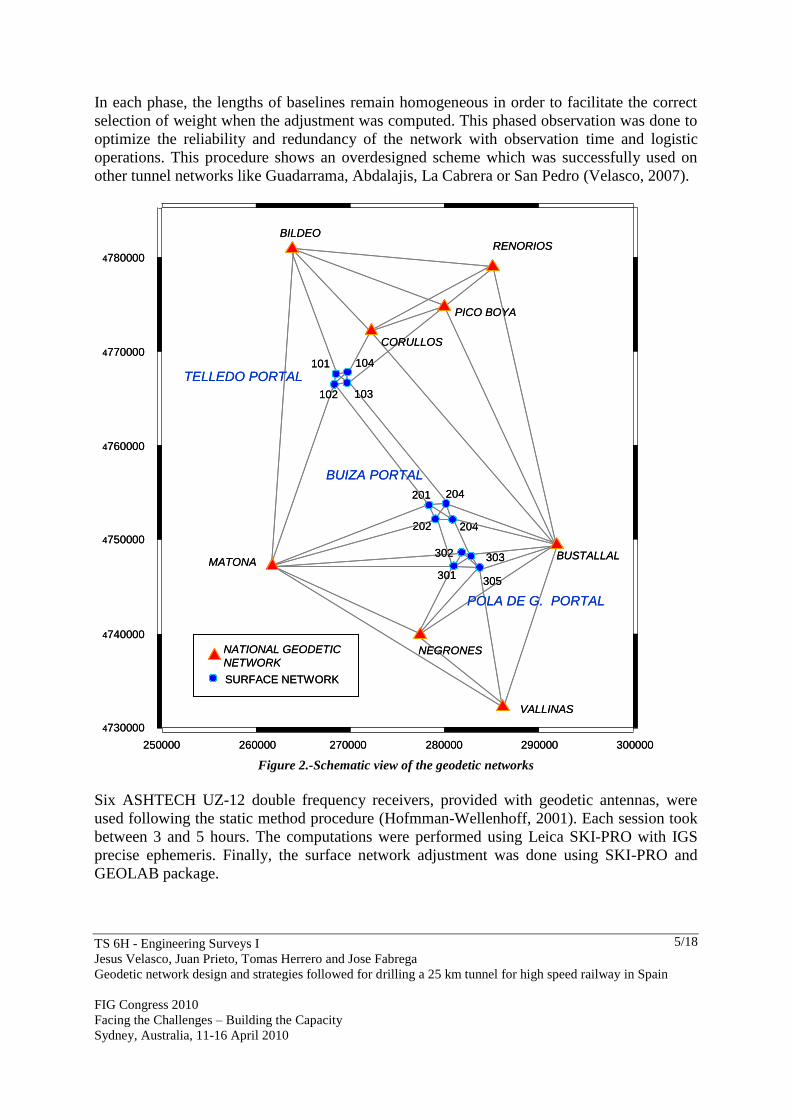
The Tunnels of Pajares have been bored from three tunnel portals. Therefore, three geodetic
surface networks were designed, one per portal, each of them formed by four survey points
linked to each other and observed by means of GNSS technologies (figure 2). Initially the
GNSS observation procedure was designed following certain algorithms (Snay, 1986),
(Unguendoli, 1990) but due to the difficulty of access to a series of survey points, the
observation was finally designed in the following the way:
Phase a. - Observation from four points of the National Geodetic Network to two survey
monuments of each surface network.
Phase b. - Observation from four markers of the National Geodetic Network to the all survey
points of each surface network.
Phase c. – Observation of six survey points (two of each surface network).
Phase d. – Observation of the remaining six survey points (two of each surface network).
Phase e. - Observation from five points of the National Geodetic Network to each of the main
survey monuments of each surface network.
TS 6H - Engineering Surveys I
Jesus Velasco, Juan Prieto, Tomas Herrero and Jose Fabrega
Geodetic network design and strategies followed for drilling a 25 km tunnel for high speed railway in Spain
FIG Congress 2010
Facing the Challenges – Building the Capacity
Sydney, Australia, 11-16 April 2010
5/18
In each phase, the lengths of baselines remain homogeneous in order to facilitate the correct
selection of weight when the adjustment was computed. This phased observation was done to
optimize the reliability and redundancy of the network with observation time and logistic
operations. This procedure shows an overdesigned scheme which was successfully used on
other tunnel networks like Guadarrama, Abdalajis, La Cabrera or San Pedro (Velasco, 2007).
4730000
4740000
4750000
4760000
4770000
4780000
250000 260000 270000 280000 290000 300000
101
201
202
204
204
303
BILDEORENORIOS
PICO BOYA
CORULLOS
BUSTALLALMATONA
NEGRONES
VALLINAS
NATIONAL GEODETIC
NETWORK
SURFACE NETWORK
104
102 103
302
305301
TELLEDO PORTAL
BUIZA PORTAL
POLA DE G. PORTAL
4730000
4740000
4750000
4760000
4770000
4780000
250000 260000 270000 280000 290000 300000
101
201
202
204
204
303
BILDEORENORIOS
PICO BOYA
CORULLOS
BUSTALLALMATONA
NEGRONES
VALLINAS
NATIONAL GEODETIC
NETWORK
SURFACE NETWORK
104
102 103
302
305301
TELLEDO PORTAL
BUIZA PORTAL
POLA DE G. PORTAL
Figure 2.-Schematic view of the geodetic networks
Six ASHTECH UZ-12 double frequency receivers, provided with geodetic antennas, were
used following the static method procedure (Hofmman-Wellenhoff, 2001). Each session took
between 3 and 5 hours. The computations were performed using Leica SKI-PRO with IGS
precise ephemeris. Finally, the surface network adjustment was done using SKI-PRO and
GEOLAB package.
TS 6H - Engineering Surveys I
Jesus Velasco, Juan Prieto, Tomas Herrero and Jose Fabrega
Geodetic network design and strategies followed for drilling a 25 km tunnel for high speed railway in Spain
FIG Congress 2010
Facing the Challenges – Building the Capacity
Sydney, Australia, 11-16 April 2010
6/18
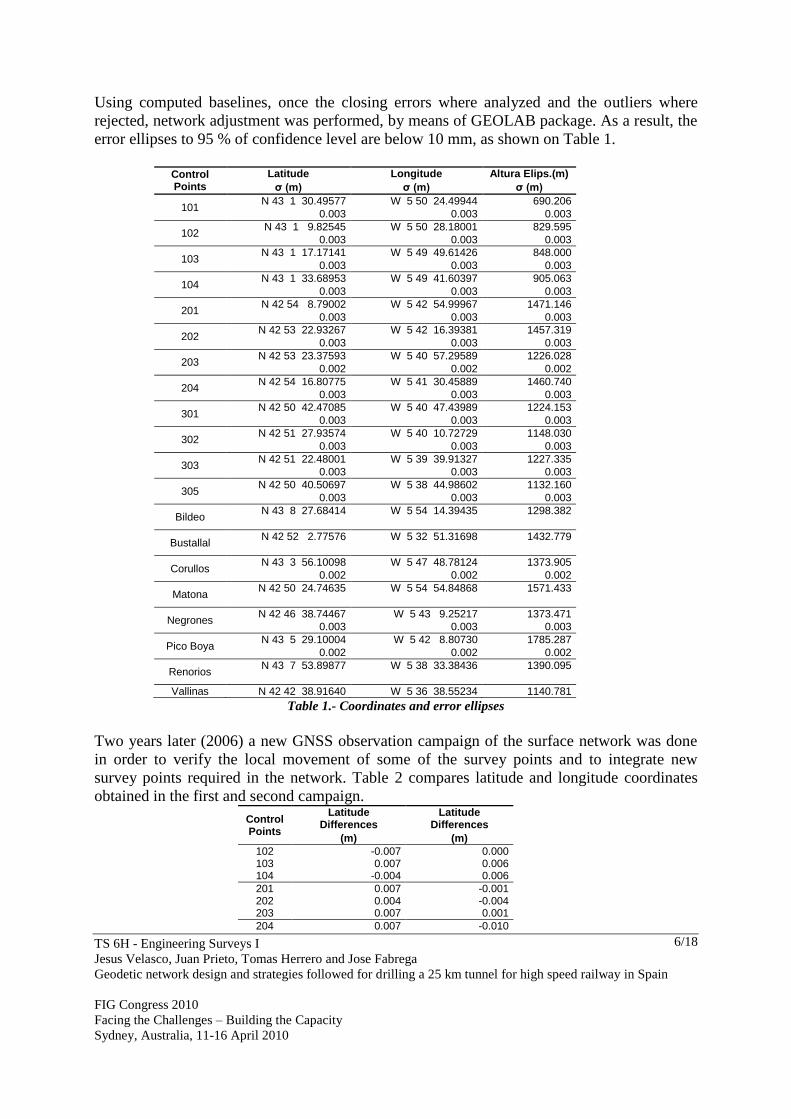
Using computed baselines, once the closing errors where analyzed and the outliers where
rejected, network adjustment was performed, by means of GEOLAB package. As a result, the
error ellipses to 95 % of confidence level are below 10 mm, as shown on Table 1.
Control Points
Latitude Longitude Altura Elips.(m)
σ (m) σ (m) σ (m)
101 N 43 1 30.49577 W 5 50 24.49944 690.206
0.003 0.003 0.003
102 N 43 1 9.82545 W 5 50 28.18001 829.595
0.003 0.003 0.003
103 N 43 1 17.17141 W 5 49 49.61426 848.000
0.003 0.003 0.003
104 N 43 1 33.68953 W 5 49 41.60397 905.063
0.003 0.003 0.003
201 N 42 54 8.79002 W 5 42 54.99967 1471.146
0.003 0.003 0.003
202 N 42 53 22.93267 W 5 42 16.39381 1457.319
0.003 0.003 0.003
203 N 42 53 23.37593 W 5 40 57.29589 1226.028
0.002 0.002 0.002
204 N 42 54 16.80775 W 5 41 30.45889 1460.740
0.003 0.003 0.003
301 N 42 50 42.47085 W 5 40 47.43989 1224.153
0.003 0.003 0.003
302 N 42 51 27.93574 W 5 40 10.72729 1148.030
0.003 0.003 0.003
303 N 42 51 22.48001 W 5 39 39.91327 1227.335
0.003 0.003 0.003
305 N 42 50 40.50697 W 5 38 44.98602 1132.160
0.003 0.003 0.003
Bildeo N 43 8 27.68414 W 5 54 14.39435 1298.382
Bustallal N 42 52 2.77576 W 5 32 51.31698 1432.779
Corullos N 43 3 56.10098 W 5 47 48.78124 1373.905
0.002 0.002 0.002
Matona N 42 50 24.74635 W 5 54 54.84868 1571.433
Negrones N 42 46 38.74467 W 5 43 9.25217 1373.471
0.003 0.003 0.003
Pico Boya N 43 5 29.10004 W 5 42 8.80730 1785.287
0.002 0.002 0.002
Renorios N 43 7 53.89877 W 5 38 33.38436 1390.095
Vallinas N 42 42 38.91640 W 5 36 38.55234 1140.781
Table 1.- Coordinates and error ellipses
Two years later (2006) a new GNSS observation campaign of the surface network was done
in order to verify the local movement of some of the survey points and to integrate new
survey points required in the network. Table 2 compares latitude and longitude coordinates
obtained in the first and second campaign.
Control Points
Latitude Differences
Latitude Differences
(m) (m)
102 -0.007 0.000 103 0.007 0.006 104 -0.004 0.006
201 0.007 -0.001 202 0.004 -0.004 203 0.007 0.001
204 0.007 -0.010
TS 6H - Engineering Surveys I
Jesus Velasco, Juan Prieto, Tomas Herrero and Jose Fabrega
Geodetic network design and strategies followed for drilling a 25 km tunnel for high speed railway in Spain
FIG Congress 2010
Facing the Challenges – Building the Capacity
Sydney, Australia, 11-16 April 2010
7/18
301 0.003 -0.004 302 0.000 0.000
303 0.000 0.011 305 0.003 0.005
2001 0.002 -0.001 3001 0.003 -0.003 3002 -0.006 -0.009
3004 0.004 0.001 3005 -0.003 0.006 3006 0.000 0.003
Table 2.- Differences between the first and second campaign
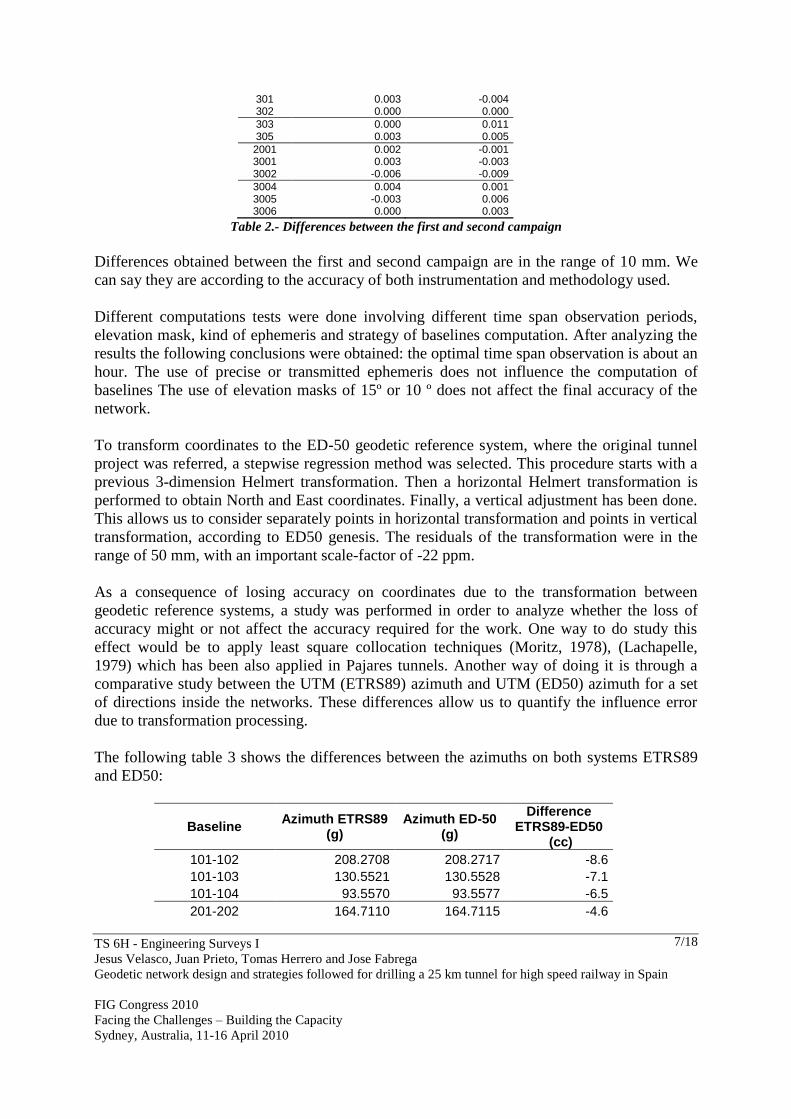
Differences obtained between the first and second campaign are in the range of 10 mm. We
can say they are according to the accuracy of both instrumentation and methodology used.
Different computations tests were done involving different time span observation periods,
elevation mask, kind of ephemeris and strategy of baselines computation. After analyzing the
results the following conclusions were obtained: the optimal time span observation is about an
hour. The use of precise or transmitted ephemeris does not influence the computation of
baselines The use of elevation masks of 15º or 10 º does not affect the final accuracy of the
network.
To transform coordinates to the ED-50 geodetic reference system, where the original tunnel
project was referred, a stepwise regression method was selected. This procedure starts with a
previous 3-dimension Helmert transformation. Then a horizontal Helmert transformation is
performed to obtain North and East coordinates. Finally, a vertical adjustment has been done.
This allows us to consider separately points in horizontal transformation and points in vertical
transformation, according to ED50 genesis. The residuals of the transformation were in the
range of 50 mm, with an important scale-factor of -22 ppm.
As a consequence of losing accuracy on coordinates due to the transformation between
geodetic reference systems, a study was performed in order to analyze whether the loss of
accuracy might or not affect the accuracy required for the work. One way to do study this
effect would be to apply least square collocation techniques (Moritz, 1978), (Lachapelle,
1979) which has been also applied in Pajares tunnels. Another way of doing it is through a
comparative study between the UTM (ETRS89) azimuth and UTM (ED50) azimuth for a set
of directions inside the networks. These differences allow us to quantify the influence error
due to transformation processing.
The following table 3 shows the differences between the azimuths on both systems ETRS89
and ED50:
Baseline Azimuth ETRS89
(g) Azimuth ED-50
(g)
Difference ETRS89-ED50
(cc)
101-102 208.2708 208.2717 -8.6
101-103 130.5521 130.5528 -7.1
101-104 93.5570 93.5577 -6.5
201-202 164.7110 164.7115 -4.6
TS 6H - Engineering Surveys I
Jesus Velasco, Juan Prieto, Tomas Herrero and Jose Fabrega
Geodetic network design and strategies followed for drilling a 25 km tunnel for high speed railway in Spain
FIG Congress 2010
Facing the Challenges – Building the Capacity
Sydney, Australia, 11-16 April 2010
8/18
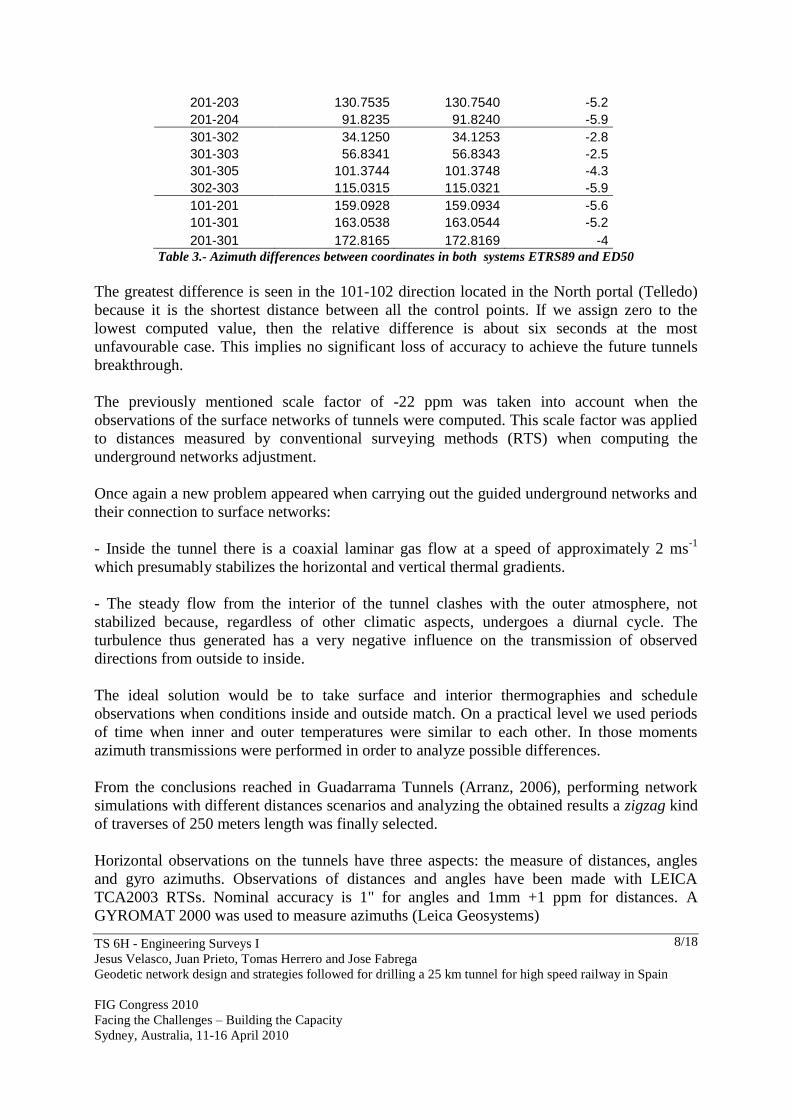
201-203 130.7535 130.7540 -5.2
201-204 91.8235 91.8240 -5.9
301-302 34.1250 34.1253 -2.8
301-303 56.8341 56.8343 -2.5
301-305 101.3744 101.3748 -4.3
302-303 115.0315 115.0321 -5.9
101-201 159.0928 159.0934 -5.6
101-301 163.0538 163.0544 -5.2
201-301 172.8165 172.8169 -4
Table 3.- Azimuth differences between coordinates in both systems ETRS89 and ED50
The greatest difference is seen in the 101-102 direction located in the North portal (Telledo)
because it is the shortest distance between all the control points. If we assign zero to the
lowest computed value, then the relative difference is about six seconds at the most
unfavourable case. This implies no significant loss of accuracy to achieve the future tunnels
breakthrough.
The previously mentioned scale factor of -22 ppm was taken into account when the
observations of the surface networks of tunnels were computed. This scale factor was applied
to distances measured by conventional surveying methods (RTS) when computing the
underground networks adjustment.
Once again a new problem appeared when carrying out the guided underground networks and
their connection to surface networks:
- Inside the tunnel there is a coaxial laminar gas flow at a speed of approximately 2 ms-1
which presumably stabilizes the horizontal and vertical thermal gradients.
- The steady flow from the interior of the tunnel clashes with the outer atmosphere, not
stabilized because, regardless of other climatic aspects, undergoes a diurnal cycle. The
turbulence thus generated has a very negative influence on the transmission of observed
directions from outside to inside.
The ideal solution would be to take surface and interior thermographies and schedule
observations when conditions inside and outside match. On a practical level we used periods
of time when inner and outer temperatures were similar to each other. In those moments
azimuth transmissions were performed in order to analyze possible differences.
From the conclusions reached in Guadarrama Tunnels (Arranz, 2006), performing network
simulations with different distances scenarios and analyzing the obtained results a zigzag kind
of traverses of 250 meters length was finally selected.
Horizontal observations on the tunnels have three aspects: the measure of distances, angles
and gyro azimuths. Observations of distances and angles have been made with LEICA
TCA2003 RTSs. Nominal accuracy is 1" for angles and 1mm +1 ppm for distances. A
GYROMAT 2000 was used to measure azimuths (Leica Geosystems)
TS 6H - Engineering Surveys I
Jesus Velasco, Juan Prieto, Tomas Herrero and Jose Fabrega
Geodetic network design and strategies followed for drilling a 25 km tunnel for high speed railway in Spain
FIG Congress 2010
Facing the Challenges – Building the Capacity
Sydney, Australia, 11-16 April 2010
9/18
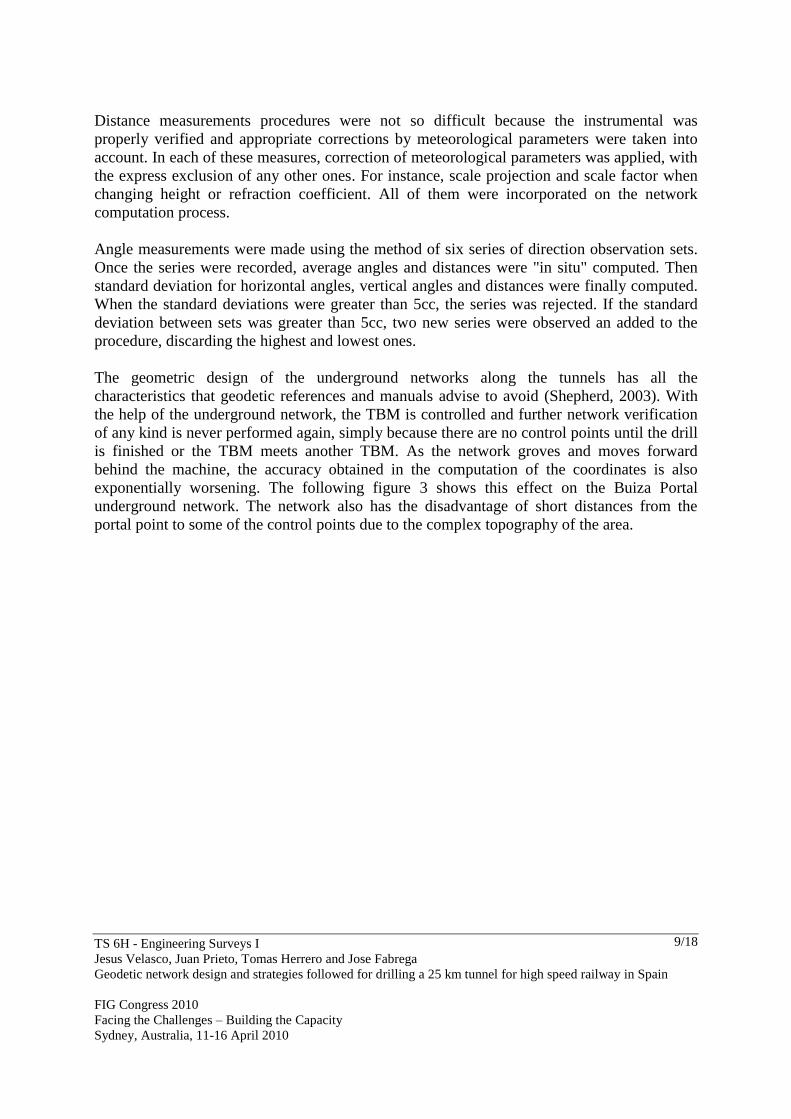
Distance measurements procedures were not so difficult because the instrumental was
properly verified and appropriate corrections by meteorological parameters were taken into
account. In each of these measures, correction of meteorological parameters was applied, with
the express exclusion of any other ones. For instance, scale projection and scale factor when
changing height or refraction coefficient. All of them were incorporated on the network
computation process.
Angle measurements were made using the method of six series of direction observation sets.
Once the series were recorded, average angles and distances were "in situ" computed. Then
standard deviation for horizontal angles, vertical angles and distances were finally computed.
When the standard deviations were greater than 5cc, the series was rejected. If the standard
deviation between sets was greater than 5cc, two new series were observed an added to the
procedure, discarding the highest and lowest ones.
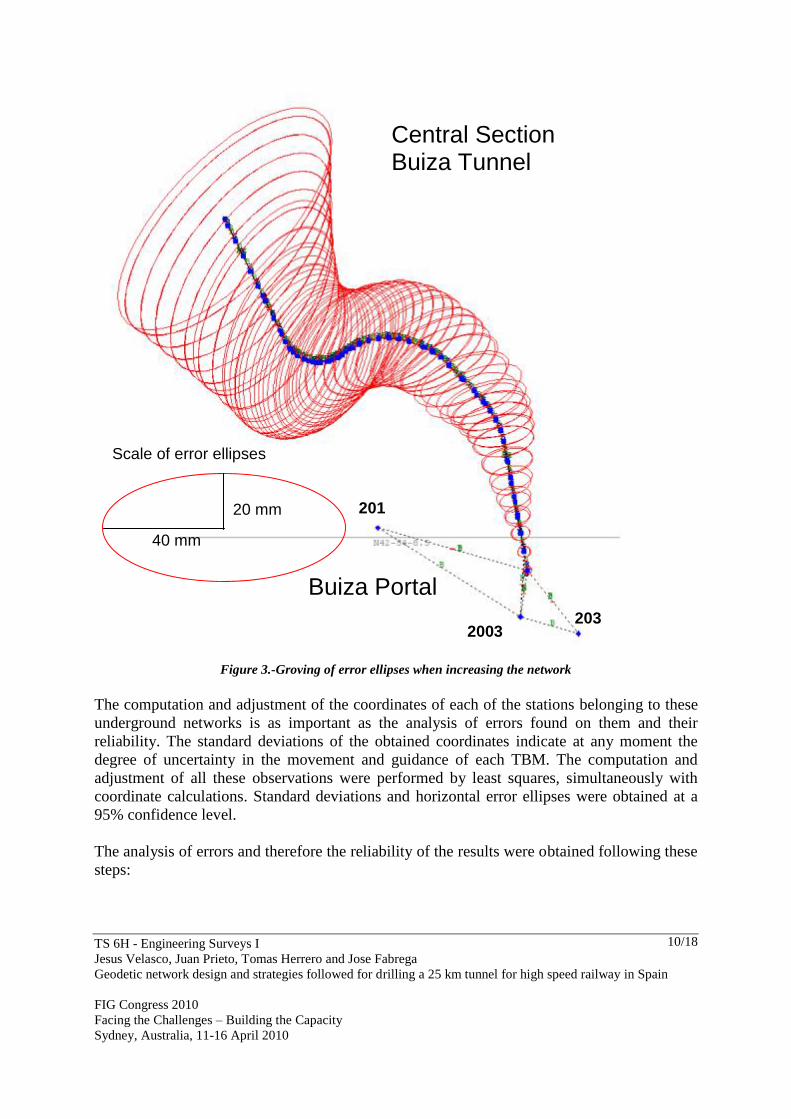
The geometric design of the underground networks along the tunnels has all the
characteristics that geodetic references and manuals advise to avoid (Shepherd, 2003). With
the help of the underground network, the TBM is controlled and further network verification
of any kind is never performed again, simply because there are no control points until the drill
is finished or the TBM meets another TBM. As the network groves and moves forward
behind the machine, the accuracy obtained in the computation of the coordinates is also
exponentially worsening. The following figure 3 shows this effect on the Buiza Portal
underground network. The network also has the disadvantage of short distances from the
portal point to some of the control points due to the complex topography of the area.
TS 6H - Engineering Surveys I
Jesus Velasco, Juan Prieto, Tomas Herrero and Jose Fabrega
Geodetic network design and strategies followed for drilling a 25 km tunnel for high speed railway in Spain
FIG Congress 2010
Facing the Challenges – Building the Capacity
Sydney, Australia, 11-16 April 2010
10/18
Figure 3.-Groving of error ellipses when increasing the network
The computation and adjustment of the coordinates of each of the stations belonging to these
underground networks is as important as the analysis of errors found on them and their
reliability. The standard deviations of the obtained coordinates indicate at any moment the
degree of uncertainty in the movement and guidance of each TBM. The computation and
adjustment of all these observations were performed by least squares, simultaneously with
coordinate calculations. Standard deviations and horizontal error ellipses were obtained at a
95% confidence level.
The analysis of errors and therefore the reliability of the results were obtained following these
steps:
Scale of error ellipses
40 mm
20 mm 201
203 2003
Central Section Buiza Tunnel
Buiza Portal
TS 6H - Engineering Surveys I
Jesus Velasco, Juan Prieto, Tomas Herrero and Jose Fabrega
Geodetic network design and strategies followed for drilling a 25 km tunnel for high speed railway in Spain
FIG Congress 2010
Facing the Challenges – Building the Capacity
Sydney, Australia, 11-16 April 2010
11/18
1.- Selection of appropriate instrumentation based on the estimation of the observing errors:
total station (angle and distances) and gyrotheodolite (azimuths). In addition, each of these
instruments followed a calibration protocol throughout the tunnel construction process.
2.- „A-priori‟ analysis and estimation of the errors due to the methodology of observation used
in the tunnels.
3.- „In situ‟ quality control of the series of observations obtained. Repetition of the series
when required.
4.- Verifying the normal distribution of the errors, once the network has been adjusted by least
squares method. In this phase, the maximum Tau criterion has been applied and then the
observables are properly weighed. This phase is particularly important in the analysis of two
key situations:
a.- Biases were detected during the computation process and isolated in order to avoid
any influence on the correct guidance of TBM. Once biases are corrected and reduced a
final adjustment was performed.
b.- The computed error ellipses gave us the reliability of the results. It was so important
for us to know where we were located as to know the uncertainty.
5.- When the progress of the works allowed, coordinate differences of common points were
obtained from observations done from other drilled tunnels. Those common points connected
directly a pair of tunnels or through cross passages.
Some questions must be considered when adding gyrotheodolite observations to these
networks. Without those azimuth observations the good results of accuracy and reliability
might not have been reached. Angle and distance networks are based initially on the control
points at each portal. As observations in the tunnel advance, errors grove, and accuracy and
reliability of network guidance stations decrease.
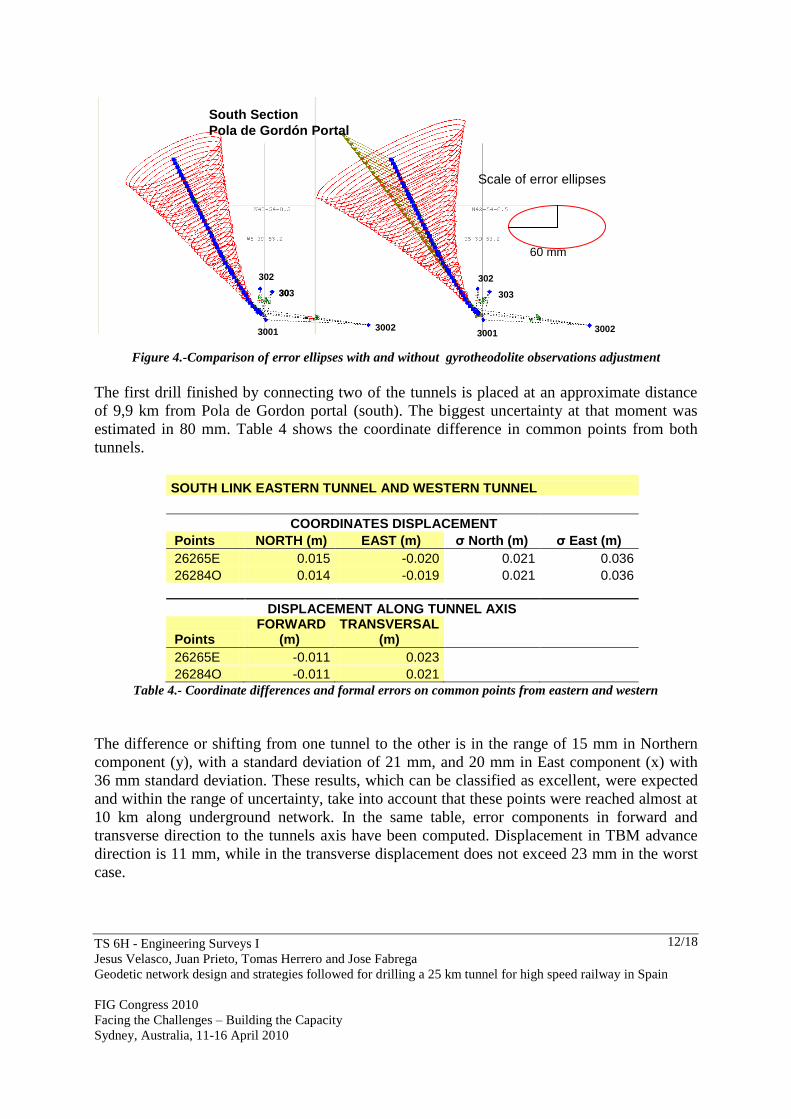
Observations of gyrotheodolite are expected to be from 5 to 8 times worse than those obtained
from RTSs. The great advantage of this instrument is that errors are not transmitted, in other
words, azimuth observations are independent. The following figure 4 shows error ellipses
with and without gyrotheodolite for the same underground network.
TS 6H - Engineering Surveys I
Jesus Velasco, Juan Prieto, Tomas Herrero and Jose Fabrega
Geodetic network design and strategies followed for drilling a 25 km tunnel for high speed railway in Spain
FIG Congress 2010
Facing the Challenges – Building the Capacity
Sydney, Australia, 11-16 April 2010
12/18
Figure 4.-Comparison of error ellipses with and without gyrotheodolite observations adjustment
The first drill finished by connecting two of the tunnels is placed at an approximate distance
of 9,9 km from Pola de Gordon portal (south). The biggest uncertainty at that moment was
estimated in 80 mm. Table 4 shows the coordinate difference in common points from both
tunnels.
SOUTH LINK EASTERN TUNNEL AND WESTERN TUNNEL
COORDINATES DISPLACEMENT
Points NORTH (m) EAST (m) σ North (m) σ East (m)
26265E 0.015 -0.020 0.021 0.036
26284O 0.014 -0.019 0.021 0.036
DISPLACEMENT ALONG TUNNEL AXIS
Points FORWARD
(m) TRANSVERSAL
(m)
26265E -0.011 0.023
26284O -0.011 0.021
Table 4.- Coordinate differences and formal errors on common points from eastern and western
The difference or shifting from one tunnel to the other is in the range of 15 mm in Northern
component (y), with a standard deviation of 21 mm, and 20 mm in East component (x) with
36 mm standard deviation. These results, which can be classified as excellent, were expected
and within the range of uncertainty, take into account that these points were reached almost at
10 km along underground network. In the same table, error components in forward and
transverse direction to the tunnels axis have been computed. Displacement in TBM advance
direction is 11 mm, while in the transverse displacement does not exceed 23 mm in the worst
case.
South Section
Pola de Gordón Portal
3002
302
303
3001
303
3002
302
303
3001
Scale of error ellipses
60 mm
TS 6H - Engineering Surveys I
Jesus Velasco, Juan Prieto, Tomas Herrero and Jose Fabrega
Geodetic network design and strategies followed for drilling a 25 km tunnel for high speed railway in Spain
FIG Congress 2010
Facing the Challenges – Building the Capacity
Sydney, Australia, 11-16 April 2010
13/18
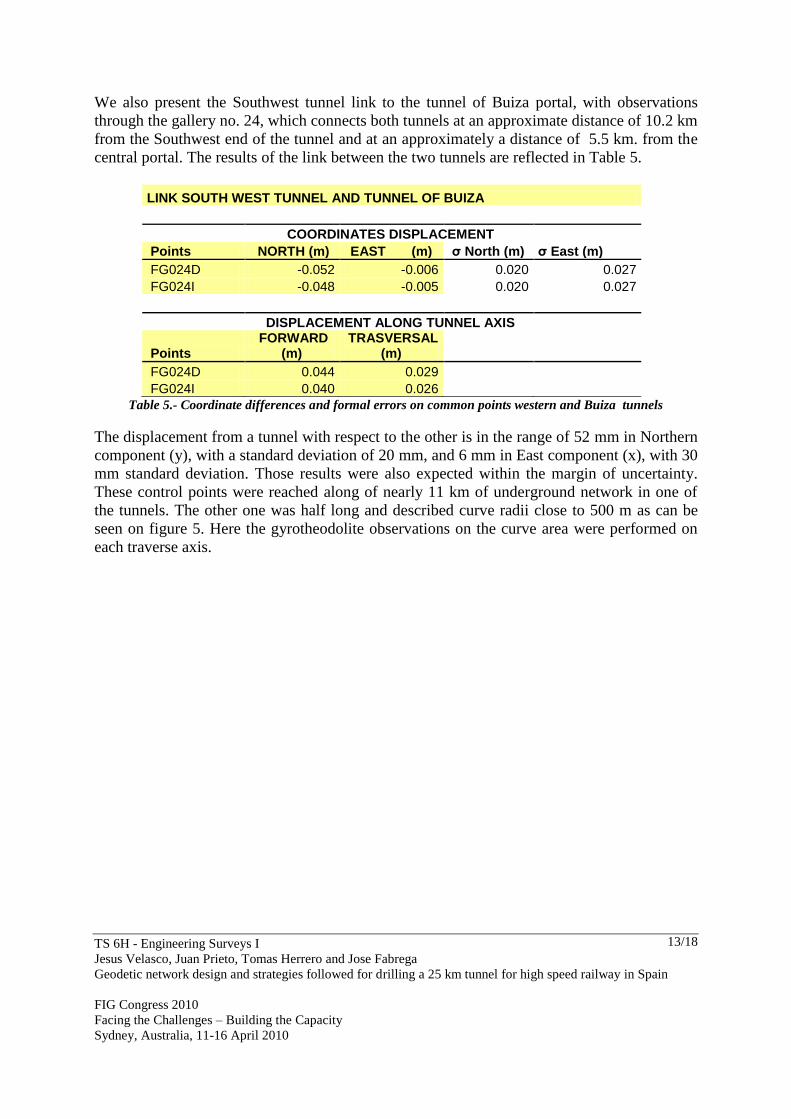
We also present the Southwest tunnel link to the tunnel of Buiza portal, with observations
through the gallery no. 24, which connects both tunnels at an approximate distance of 10.2 km
from the Southwest end of the tunnel and at an approximately a distance of 5.5 km. from the
central portal. The results of the link between the two tunnels are reflected in Table 5.
LINK SOUTH WEST TUNNEL AND TUNNEL OF BUIZA
COORDINATES DISPLACEMENT
Points NORTH (m) EAST (m) σ North (m) σ East (m)
FG024D -0.052 -0.006 0.020 0.027
FG024I -0.048 -0.005 0.020 0.027
DISPLACEMENT ALONG TUNNEL AXIS
Points FORWARD
(m) TRASVERSAL
(m)
FG024D 0.044 0.029
FG024I 0.040 0.026
Table 5.- Coordinate differences and formal errors on common points western and Buiza tunnels
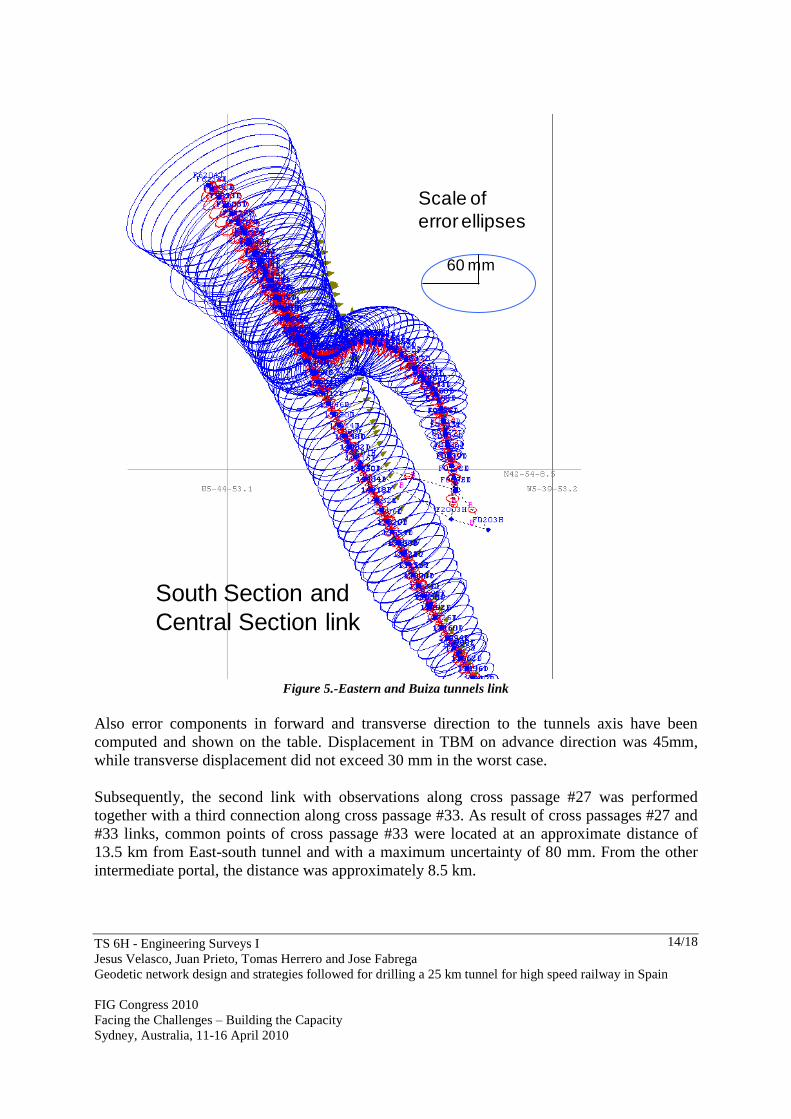
The displacement from a tunnel with respect to the other is in the range of 52 mm in Northern
component (y), with a standard deviation of 20 mm, and 6 mm in East component (x), with 30
mm standard deviation. Those results were also expected within the margin of uncertainty.
These control points were reached along of nearly 11 km of underground network in one of
the tunnels. The other one was half long and described curve radii close to 500 m as can be
seen on figure 5. Here the gyrotheodolite observations on the curve area were performed on
each traverse axis.
TS 6H - Engineering Surveys I
Jesus Velasco, Juan Prieto, Tomas Herrero and Jose Fabrega
Geodetic network design and strategies followed for drilling a 25 km tunnel for high speed railway in Spain
FIG Congress 2010
Facing the Challenges – Building the Capacity
Sydney, Australia, 11-16 April 2010
14/18
Scale of
error ellipses
60 mm
South Section and
Central Section link
Figure 5.-Eastern and Buiza tunnels link
Also error components in forward and transverse direction to the tunnels axis have been
computed and shown on the table. Displacement in TBM on advance direction was 45mm,
while transverse displacement did not exceed 30 mm in the worst case.
Subsequently, the second link with observations along cross passage #27 was performed
together with a third connection along cross passage #33. As result of cross passages #27 and
#33 links, common points of cross passage #33 were located at an approximate distance of
13.5 km from East-south tunnel and with a maximum uncertainty of 80 mm. From the other
intermediate portal, the distance was approximately 8.5 km.
TS 6H - Engineering Surveys I
Jesus Velasco, Juan Prieto, Tomas Herrero and Jose Fabrega
Geodetic network design and strategies followed for drilling a 25 km tunnel for high speed railway in Spain
FIG Congress 2010
Facing the Challenges – Building the Capacity
Sydney, Australia, 11-16 April 2010
15/18
The difference or shifting from both tunnels are in the range of 60 mm in Northern component
(y), with a standard deviation of 27 mm, and 50 mm in this component (x), with standard
deviation 36 mm. Results are within the margin of uncertainty in relation to their respective
portal distances.
Also the same table shows the components of error in forward and transverse directions. The
maximum displacement in TBM advance direction is about 20 mm, while in the transverse
direction reaches no more than 50 mm in the worst case.
4. CONCLUSIONS
It can be said that differences found in each of the points of each link done have produced an
excellent result. After analyzing deviations and error ellipses which indicate the error these
points have been determined with, it can be said that measured values of displacement are as
expected, tolerable and reliable.
The values of the discrepancies found in each tunnel, separately adjusted and checked along
their common cross passage, would be at a maximum value at about 50 mm. Those values are
also consistent with the values that provide the uncertainties computed for these same points
that remain within that range or even higher.
It is important to highlight that errors found in each of the adjustments done are of similar
magnitude to the deviations experienced by comparing these coordinate adjustments two by
two. Theoretically speaking, there would be no possibility of saying that any of these
adjustments are better than the others, being equal displacements and uncertainties, as indeed
expected.
Given the results presented in this communication, the best suitable methodology for this type
of work may have the following characteristics:
1 – Surface network observations must be done by GNSS techniques. Static method in each
survey point must have multiple observations of at least 1 hour which guarantee repeatability
and reliability.
2 – In order to evaluate the loss of accuracy due to the change of geodetic reference system,
azimuths in the sides of surface geodetic network between two systems should be compared.
Computed differences give a quantification of the error due to the transformation of GRS,
assuming the hypothesis that the transformation errors are due to the geodetic reference
system of the project, unless geodetic reference system is a global one.
3 - As the axis of the tunnel has to be free, the underground networks must be designed as
zigzag traverses, in order to minimize lateral refraction error. Optimal traverses shall have 250
m length sides. At least six sets of observations have to be performed.
TS 6H - Engineering Surveys I
Jesus Velasco, Juan Prieto, Tomas Herrero and Jose Fabrega
Geodetic network design and strategies followed for drilling a 25 km tunnel for high speed railway in Spain
FIG Congress 2010
Facing the Challenges – Building the Capacity
Sydney, Australia, 11-16 April 2010
16/18
4 - Gyrotheodolite observations are needed to reduce the loss of accuracy on the transmission
of azimuths in traverses of this length. From 4 km on, observations should be performed every
kilometre, observing two crossed axes, in order to minimize lateral refraction error. On
critical areas, such as curves, the observations must be performed on each traverse axis.
5 - Traverses along tunnel axis with sides of 375 m. are most suitable to control the
underground network and the observation is restricted to times when technical stops
inevitably happen in this type of work.
5. AKNOWLEDGEMENTS
This research has been mainly funded through the collaboration project between the
department of Engineering Surveying and Cartography of the Technical University of Madrid
and the public works enterprises that have been built the Tunnel of Pajares. We are compelled
to acknowledge the surveying teams involved on the tasks shown on this article, specially to J.
Martin, L. Toledano, R. Medina, M. Sierra and J.García, coordinators of those teams. We also
thank ADIF, the Spanish Administrator of Railway Infrastructures, which supports the whole
project for the collaboration on this research.
REFERENCES
Arranz, P. 2006, “La topografía en los túneles de Guadarrama para el Tren de Alta
Velocidad”. Topografía y Cartografía, vol. 23, no. 133, pp3-15.ISSN0212-9280
Böckem, B., Flach, P., Weiss, A. & Hennes, M. 2000, "Refraction influence analysis and
investigations on automated elimination of refraction effects on geodetic measurements",
Paper to XVI IMEKO World Congress, pp. 25. ISBN 3-540-41523-2.
Bräker, F. & Ebneter, F. 1997, “ The Alp Transit Project and the organisation of the survey”,
FIG –Symposium, pp 5-22. 1997.ISBN 87-90145-23-2
Brunner, F.K., Grillmayer, E. 2002, "On the temperature dependence of gyroscopic
measurements using the GYROMAT 2000", FIG XXII International Congress,
Washington DC, USA, pp 11.
Chrzanowski, A. 1981, "Optimization of the Breakthrough Accuracy in Tunnelling Surveys",
The Canadian Surveyor, vol. 35, pp. 5-16.
Grafarend, E.W. 1974, "Optimization of geodetic networks", Bolletino di geodesia a science
affini, vol. 33, no. 4, pp. 351-406.
Haag, R. & Stengele, R. 1997, "The Gotthard-Base-Tunnel. Surveying of a 57 km long
Underground Projekt in the Swiss Alps", FIG-Symposium „Surveying of Large Bridge
and Tunnel Projects in Kopenhagen. pp 22-32 ISBN 87-90145-23-2.
TS 6H - Engineering Surveys I
Jesus Velasco, Juan Prieto, Tomas Herrero and Jose Fabrega
Geodetic network design and strategies followed for drilling a 25 km tunnel for high speed railway in Spain
FIG Congress 2010
Facing the Challenges – Building the Capacity
Sydney, Australia, 11-16 April 2010
17/18
Hofmann-Wellenhoff, B., Lichteneger, H., and Collins, S. J., 2001. GPS Theory and Practice,
5th ed. Springer Verlag Wien New York, 326 pp. ISBN 3-211-83534-2.
Ingensand, H., 2008, "Concepts and Solutions to Overcome the Refraction Problem in
Terrestrial Precision Measurement", Geodesy and Cartography, vol. 34, no. 2, pp. 61-65.
doi: 10.3846/1392-1541.2008.34.61–65.
Jarosz, A. and Baran, I. (1999) Accuracy of Check Surveys - Revisited, 5th Kalgoorlie Mine
Surveying Seminar, Kalgoorlie, Australia, pp.53-64.
Johnston, A. 1998, "Tunnel alignment and lateral refraction", Tunnels and Tunnelling
International, vol. 30, no. 3, pp. 58-60.
Korittke, N. 1990, "Influence of Horizontal Refraction on Traverse Measurements in Tunnels
with Small Diameter", Proceedings of the Second International Workshop on Accelerator
Alignment, pp. 315.
Korittke, N. & Klapperich, H. 1998, "Application of high precision gyrotheodolites in
tunnelling", Tunnels and metropolises: proceedings of the World Tunnel Congress' 98 on
Tunnels and Metropolises: São Paulo, Brazil, 25-30 April, 1998Taylor & Francis, , pp.
823. ISBN 905410 936 X.
Lachapelle,G & Mainville, A. 1982, “Least-squares prediction of horizontal coordinate
distorsion in Canada”, Journal of Geodesy, vol. 56, no. 3, pp. 242-257. doi
10.1007/BF02525585
Leica Geosystems, “Automated High Performance Total Station TCA2003,” [online].
Available: http://www.leica-geosystems.com
Lewén, I. Use of gyrotheodolite in underground control network, Arkitektur och
samhällsbyggnad, Kungliga Tekniska Högskolan..Trita-Git Ex 06-002. ISSN 1653-5227.
Martusewicz, J. 1993, "Optimal Location of Extra Gyroscopic Azimuth in Underground
Traverses", Journal of Surveying Engineering, vol. 119, pp. 137. (doi 10.1061/(ASCE)
0733-9453(1993) 119:4 (137).
Moritz, H. 1978, "Least squares collocation", Rev.Geophy Space Phys, vol. 16, pp. 421-430.
Radcliffe, E. 1989, "Control surveys and setting out for the Channel Tunnel", 3rd UK
National Land Surveying and Mapping Conference and Exhibition. Warwick.
Engineering, vol. 121, no. 1, pp. 13-34.
Ryf, A., Haag, R. & Schätti, I. 2000, "AlpTransit Gotthard-Basistunnel: Aktueller
Projektstand, ingenieurgeodätische Aspekte", XIII.Kurs für Ingenieurvermessung,
München, pp 12.
Schneider, D & Marti,U. 1997, “ Swiss reference systems used for control networks and
surveying of the new railroad tunnels trhough tre Alps”, Symposium FIG, Denmark June
1997. ISBN 87-90145-23-2
TS 6H - Engineering Surveys I
Jesus Velasco, Juan Prieto, Tomas Herrero and Jose Fabrega
Geodetic network design and strategies followed for drilling a 25 km tunnel for high speed railway in Spain
FIG Congress 2010
Facing the Challenges – Building the Capacity
Sydney, Australia, 11-16 April 2010
18/18
Shepherd, L. & Jarosz, A. 2003, "An error analysis of the wall station resection method of
underground control traversing". Proceeding Spatial de Sciences 2003, Inaugural
Conference of Spatial Sciences Institute, Camberra, Australia,22-26 September 2003,
ISBN:0-9588349-8-9 .
Schödlbauer, A. 1997, “The impact of the global positioning system on tunnel surveying”.
FIG-Symposium Surveying of Large Bridge and Tunnel Projects in Kopenhagen.,pp 16-
ISBN 87-90145-23-2
Snay, R.A. 1986, "Network design strategies applicable to GPS surveys using three or four
receivers", Journal of Geodesy, vol. 60, no. 1, pp. 37-50. ISBN 0949-7714.
Unguendoli, M. 1990, "A rational approach to the use of a large number of GPS receivers",
Journal of Geodesy, vol. 64, no. 4, pp. 303-312. ISBN 0949-7714.
Velasco J., Prieto J., 2007, "Uso de las técnicas GNSS en redes para la construcción de
túneles ferroviarios de gran longitud: Aplicación sobre los túneles deTAV Pajares”VI
Jornadas Internacionales de Aplicaciones Geomáticas en Ingeniería, Madrid, Spain.
CONTACTS
Prof. Jesus VELASCO
Department of Engineering Surveying and Cartography
Technical University of Madrid
Carretera de Valencia, km 7
E-28031 Madrid
SPAIN
Tel. +34 91 336 7927
Fax + 34 91 332 2560
Email: [email protected]
Prof. Juan PRIETO
Department of Engineering Surveying and Cartography
Technical University of Madrid
Carretera de Valencia, km 7
E-28031 Madrid
SPAIN
Tel. +34 91 336 6486
Fax + 34 91 332 2560
Email: [email protected]