4.4 security and accountability - nasa · this section describes the security and accountability...
TRANSCRIPT

4.4 Security and Accountability This section describes the security and accountability tools used by DAAC operators: 1. TCP Wrappers 2. Tripwire 3. Cryptographic Management Interface (CMI)
4.4-1 609-EMD-220

This page intentionally left blank.
4.4-2 609-EMD-220

4.4.1 TCP Wrappers TCP Wrappers allow the operator to control access to various network services through the use of access control lists. They also provide logging information of wrapped network services, which can be used to prevent or monitor network attacks. It intercepts incoming network connections and verifies if the connection is allowed before passing the connection onto the actual network daemon. TCP Wrappers allows the operator to monitor and filter incoming requests for the systat, finger, ftp, telnet, rlogin, rsh, exec, tftp, talk, and other network services. Full descriptions of these Unix services can be obtained using the “man” command, e.g., man systat. TCP Wrappers perform the following functions automatically:
• Access control: access can be controlled per host, per service, or combinations thereof.
• Host name spoofing: verifies the client host name that is returned by the address->name DNS server, by asking for a second opinion from a local DNS server.
• Host address spoofing: the wrapper programs can give additional protection against hosts that claim to have an address that lies outside their own network.
• Client username lookups: the protocol proposed in RFC 931 provides a means to obtain the client user name from the client host. The requirement is that the client host runs an RFC 931-compliant daemon. The information provided by such a daemon is not used for authentication purposes but it can provide additional information about the owner of a TCP connection.
• Multiple ftp/gopher/www archives on one host: `daemon@host' access control patterns can be used to distinguish requests by the network address that they are aimed at. Judicious use of the `twist' option (see the hosts_options.5 file supplied with TCP Wrappers, `nroff -man' format) can guide the requests to the right server. These can be servers that live in separate chroot areas, or servers modified to take additional context from the command line, or a combination.
• Sequence number guessing: client username lookup protocol can help to detect host impersonation attacks. Before accepting a client request, the wrappers can query the client's IDENT server and find out that the client never sent that request.
Additional information on TCP Wrappers can be obtained at the following URL:
http://www.alw.nih.gov/Security/prog-firewall.html
TCP Wrappers is used to perform the operator functions listed in Table 4.4.1-1.
4.4.1-1 609-EMD-220
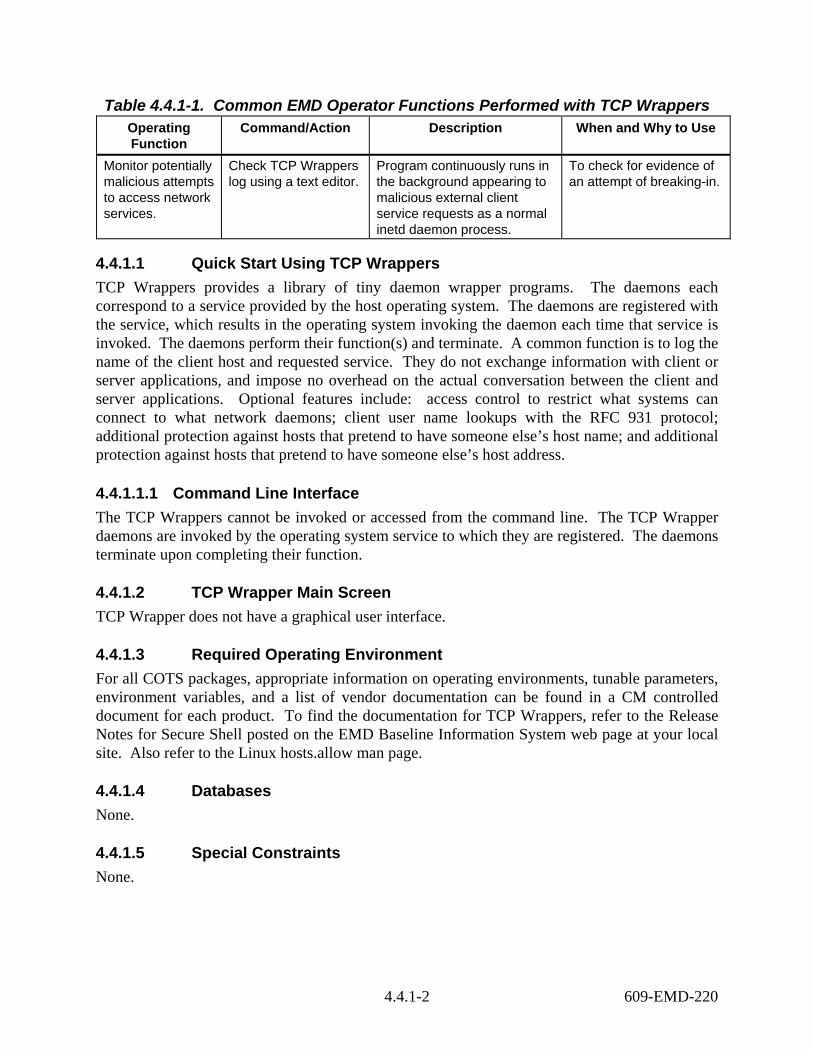
Table 4.4.1-1. Common EMD Operator Functions Performed with TCP Wrappers Operating Function
Command/Action Description When and Why to Use
Monitor potentially malicious attempts to access network services.
Check TCP Wrappers log using a text editor.
Program continuously runs in the background appearing to malicious external client service requests as a normal inetd daemon process.
To check for evidence of an attempt of breaking-in.
4.4.1.1 Quick Start Using TCP Wrappers TCP Wrappers provides a library of tiny daemon wrapper programs. The daemons each correspond to a service provided by the host operating system. The daemons are registered with the service, which results in the operating system invoking the daemon each time that service is invoked. The daemons perform their function(s) and terminate. A common function is to log the name of the client host and requested service. They do not exchange information with client or server applications, and impose no overhead on the actual conversation between the client and server applications. Optional features include: access control to restrict what systems can connect to what network daemons; client user name lookups with the RFC 931 protocol; additional protection against hosts that pretend to have someone else’s host name; and additional protection against hosts that pretend to have someone else’s host address.
4.4.1.1.1 Command Line Interface The TCP Wrappers cannot be invoked or accessed from the command line. The TCP Wrapper daemons are invoked by the operating system service to which they are registered. The daemons terminate upon completing their function.
4.4.1.2 TCP Wrapper Main Screen TCP Wrapper does not have a graphical user interface.
4.4.1.3 Required Operating Environment For all COTS packages, appropriate information on operating environments, tunable parameters, environment variables, and a list of vendor documentation can be found in a CM controlled document for each product. To find the documentation for TCP Wrappers, refer to the Release Notes for Secure Shell posted on the EMD Baseline Information System web page at your local site. Also refer to the Linux hosts.allow man page.
4.4.1.4 Databases None.
4.4.1.5 Special Constraints None.
4.4.1-2 609-EMD-220
4.4.1.6 Outputs Table 4.4.1-2 describes TCP Wrappers output.
Table 4.4.1-2. TCP Wrapper Outputs Output Disposition Description and Format
Event log The disposition of the wrapper logs is determined by the system configuration file parameter for the system log file name. In the ECS Release 4 Development Environment ( host = mss1) the parameter is local3.info and the log file is /etc/syslog.conf.
The Wrapper daemons log the event/service request that caused their invocation. The log provides sufficient information to describe the event/service request and response from the system. Log records are output in ASCII text format, each record containing the following fields: Date Time host Service Response to request Event
Figure 4.4.1.1 shows an example of a log file created by TCP Wrappers. The log file can be examined with available tools like the vi editor. The contents of the log file can be used to generate reports on Service Request activity for the host.
4.4.1-3 609-EMD-220
Figure 4.4.1-1. Example of TCP Wrappers Log
The log file provides the following information for each entry: data and time; host sever name; type of service requested and port that provides that service; answer given to the request connection (connect/refused); client host name.
4.4.1.7 Event and Error Messages None.
4.4.1.8 Reports None.
4.4.1-4 609-EMD-220

4.4.2 Tripwire Tripwire is an intrusion detection tool that aids system administrators and users in monitoring a designated set of files for any changes. File systems may be altered without authorization in a number of ways, including an intruder, an authorized user violating a DAAC policy, or malicious code-altering system executables as others are run. Using Tripwire, unauthorized changes are tracked in a very short amount of time.
Tripwire automates the creation of input lists and output lists of files. Tripwire uses the file tw.config to maintain the list of tested files. File attributes such as file size, ownership, inode number, inode values and timestamps are compared between the input and output lists. For each file, Tripwire computes a digital signature, which is a fixed-sized output generated by a signature function whose input is an arbitrary file. If the contents of a file are changed in any way, the signature also changes. One of the signature functions is to test for the integrity of a file system by generating checksums of files and comparing them with a previously generated database of checksums. Added or deleted files are flagged and reported, as are any files changed from their previously recorded state in the database. When run against system files on a regular basis, any file changes would be spotted when Tripwire is next run, giving system administrators information to enact damage control measures immediately.
Tripwire uses message-digest algorithms (one-way hash functions) to detect changes in a hard-to-spoof manner. This detects significant changes to critical files, including those caused by insertion of backdoor traps or viruses. Tripwire also monitors changes to file permissions, modification times, and other significant changes to inodes as selected by the system administrator on a per file/directory basis. Tripwire performs the following functions automatically:
• Database Generation -- Tripwire initializes the database based upon the entries enumerated in the tw.config file.
• Database Update -- Provides incremental database update functionality on a per-file/directory basis. This obviates having to regenerate the entire database every time a file or set of files change.
• Integrity Checking -- Generates a report of added, deleted, or changed files, comparing all the files described by the tw.config file against the files residing on the file system.
• Interactive Update -- Reports added, deleted, and changed files and prompts the user whether those database entries should be updated. The Interactive Update provides a method for system administrators to keep Tripwire databases ``in sync'' with file systems that change.
Tripwire is used to perform the operator functions listed in Table 4.4.2-1.
4.4.2-1 609-EMD-220

Table 4.4.2-1. Common ECS Operator Functions Performed Operating Function
Command Description When and Why to Use
Change the configuration file.
Edit the specific configuration file using the vi editor.
Specify which file(s) should be monitored.
When another file needs to be monitored. Checks the integrity of the file system specified when the daemon is started.
Compare file signatures with database.
Done by Tripwire “cron” run periodically.
Compares files’ current signatures against the database and emails the operator a notification for changed files.
This activity is a continuous, periodic performed on a configured interval by the “cron” run.
Update the signatures data store.
Done manually in response to “Interactive Update” prompts.
Updates the signature data store when the email notification discloses legitimate changes.
As necessary to maintain a valid data store of signatures.
4.4.2.1 Quick Start Using Tripwire The following command is used to execute Tripwire from the command line prompt (as root):
/etc/tripwire/src/tripwire -v > {filename}
The following is the general syntax of executing Tripwire:
tripwire [ options ... ] >filename Where options are:
-initialize Database Generation mode -init -update entry update entry (a file, directory, or tw.config entry) in the database -interactive Integrity Checking mode with interactive entry updating -loosedir use looser checking rules for directories -d dbasefile read in database from dbasefile (use `-d -' to read from stdin) -c configfile read in config file from configfile (use `-c -' to read from stdin) -cfd fd read in config file from specified fd -dfd fd read in the database file from specified fd -Dvar=value define a tw.config variable (ala @@define) -Uvar undefine a tw.config variable (ala @@undef) -i # or –i all ignore the specified signature (to reduce execution time) -q quiet mode -v verbose mode -preprocess print out preprocessed configuration file -E save as -preprocess -help print out interpretation help message -version print version and patch information
filename is a complete filename (including path) for the output report file.
4.4.2-2 609-EMD-220

Tripwire is automatically invoked on all machines by a “cron” run, which periodically executes Tripwire. The operator receives information from Tripwire by email for files whose current signature does not match the datastore signature. The operator must verify the file changes and update the datastore or report a security violation. Tripwire may be run manually to update the datastore or create reports. The Operator can also generate Tripwire reports via the command line.
The differences between the behaviors of Tripwire started from the “Cron” run and started by the operator result from the use of appropriate parameters on the start command. These parameters are listed and explained below.
4.4.2.2 Tripwire Main Screen Tripwire does not have a GUI. An example of the Tripwire startup message is shown in Figure 4.4.2-1.
4.4.2-3 609-EMD-220

Figure 4.4.2-1. Xterm Window with Tripwire Showing Tripwire Startup Message (example)
4.4.2.3 Required Operating Environment Tripwire runs on all Linux hosts.
For all COTS packages, appropriate information on operating environments, tunable parameters, environment variables, and a list of vendor documentation can be found in a CM controlled document for each product. To find the documentation for Tripwire, refer to the Release Notes posted on the EMD Baseline Information System web page at your local site.
4.4.2-4 609-EMD-220
4.4.2.4 Databases Tripwire uses an internal data store of captured information. The user can update this data store through the command line interface. Reporting information based on the information Tripwire has gathered and placed in this data store is sent by email to the operator.
4.4.2.5 Special Constraints None.
4.4.2.6 Outputs Tripwire generates the outputs presented in Table 4.4.2-2 below in the filename specified on the command line invocation. A sample of the generated report is shown in Section 4.4.2.8, Figure 4.4.2-2.
Table 4.4.2-2. Tripwire Outputs Output Description and Format
Tripwire compares the new datastore with the existing Tripwire datastore stored on the file system, reporting added or deleted files, as well as those files that have changed.
See 4.4.2.8, the Report section, for a sample of Tripwire output.
Email to the operator. Email messages list the files examined by Tripwire whose current signature does not match the file’s entry in the signature file.
Updates to the Tripwire datastore. The operator must review the email mentioned above and determine whether it represents a data corruption problem or the Tripwire signature datastore is out-of-date. If the determination is the data store is out of date, the operator must use Tripwire with the interactive update option and update the signature file.
Security problem notification. If the operator determines the Tripwire email indicates a security violation the operator must log the problem.
4.4.2.7 Event and Error Messages None.
4.4.2.8 Reports Tripwire must be started from the command line interface to request the Tripwire report. A sample of Tripwire output is shown below in Figure 4.4.2-2.
4.4.2-5 609-EMD-220
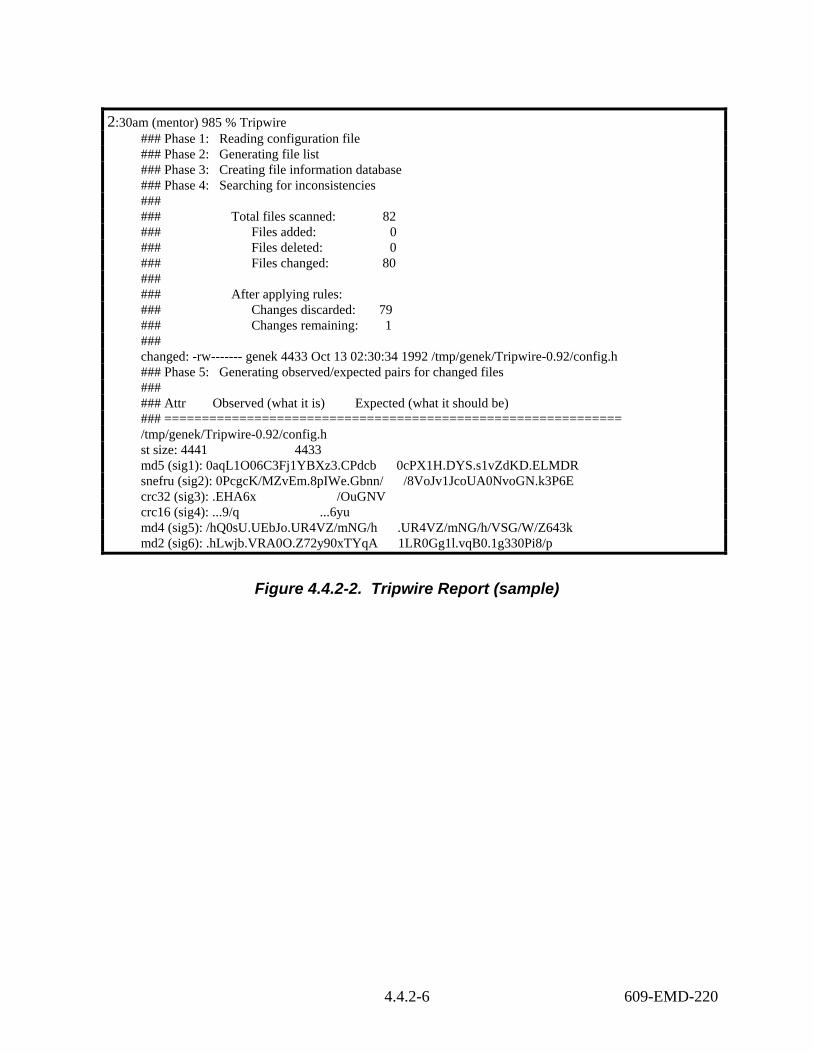
2:30am (mentor) 985 % Tripwire ### Phase 1: Reading configuration file ### Phase 2: Generating file list ### Phase 3: Creating file information database ### Phase 4: Searching for inconsistencies ### ### Total files scanned: 82 ### Files added: 0 ### Files deleted: 0 ### Files changed: 80 ### ### After applying rules: ### Changes discarded: 79 ### Changes remaining: 1 ### changed: -rw------- genek 4433 Oct 13 02:30:34 1992 /tmp/genek/Tripwire-0.92/config.h ### Phase 5: Generating observed/expected pairs for changed files ### ### Attr Observed (what it is) Expected (what it should be) ### ============================================================= /tmp/genek/Tripwire-0.92/config.h st size: 4441 4433 md5 (sig1): 0aqL1O06C3Fj1YBXz3.CPdcb 0cPX1H.DYS.s1vZdKD.ELMDR snefru (sig2): 0PcgcK/MZvEm.8pIWe.Gbnn/ /8VoJv1JcoUA0NvoGN.k3P6E crc32 (sig3): .EHA6x /OuGNV crc16 (sig4): ...9/q ...6yu md4 (sig5): /hQ0sU.UEbJo.UR4VZ/mNG/h .UR4VZ/mNG/h/VSG/W/Z643k md2 (sig6): .hLwjb.VRA0O.Z72y90xTYqA 1LR0Gg1l.vqB0.1g330Pi8/p
Figure 4.4.2-2. Tripwire Report (sample)
4.4.2-6 609-EMD-220

4.4.3 Cryptographic Management Interface (CMI) The Cryptographic Management Interface (CMI) GUI program, EcSeAuthnProg, is used by operations personnel to generate a randomized username and password (though only the password is currently used) given a key. There is one key for each EMD server and is the same as the Program ID stored in a server’s configuration file. This tool is most often used to generate passwords for Sybase and FTP user accounts. It is therefore recommended that access to this tool be restricted to Sybase and Unix System Administrators only.
CMI is used to perform the operator functions listed in Table 4.4.3-1.
Table 4.4.3-1. Common ECS Operator Functions Performed with CMI Operating Function
Command / GUI
Description When and Why to Use
Start CMI program. EcSeAuthnProg This brings up the ConnectAuth GUI.
In order to obtain the user password for a given application key.
Generate password.
CMI Main Screen (ConnectAuth GUI)
This causes the program to generate a randomized username and password.
This is only needed when an EMD server requires a new user account.
4.4.3.1 Quick Start Using CMI The CMI Main Screen is a custom developed GUI utility and should be used only by operations personnel.
To execute CMI from the command line prompt, enter:
> EcSeAuthnProg
4.4.3.2 CMI Main Screen Figure 4.4.3-1 is the CMI GUI Screen, which comes up when the CMI program is run. It contains three fields:
• Application Key field • User Id field • Password field
Operations personnel fill out the first field by entering the application key. In response, CMI returns a user name and password, which are displayed in the associated fields.
4.4.3-1 609-EMD-220
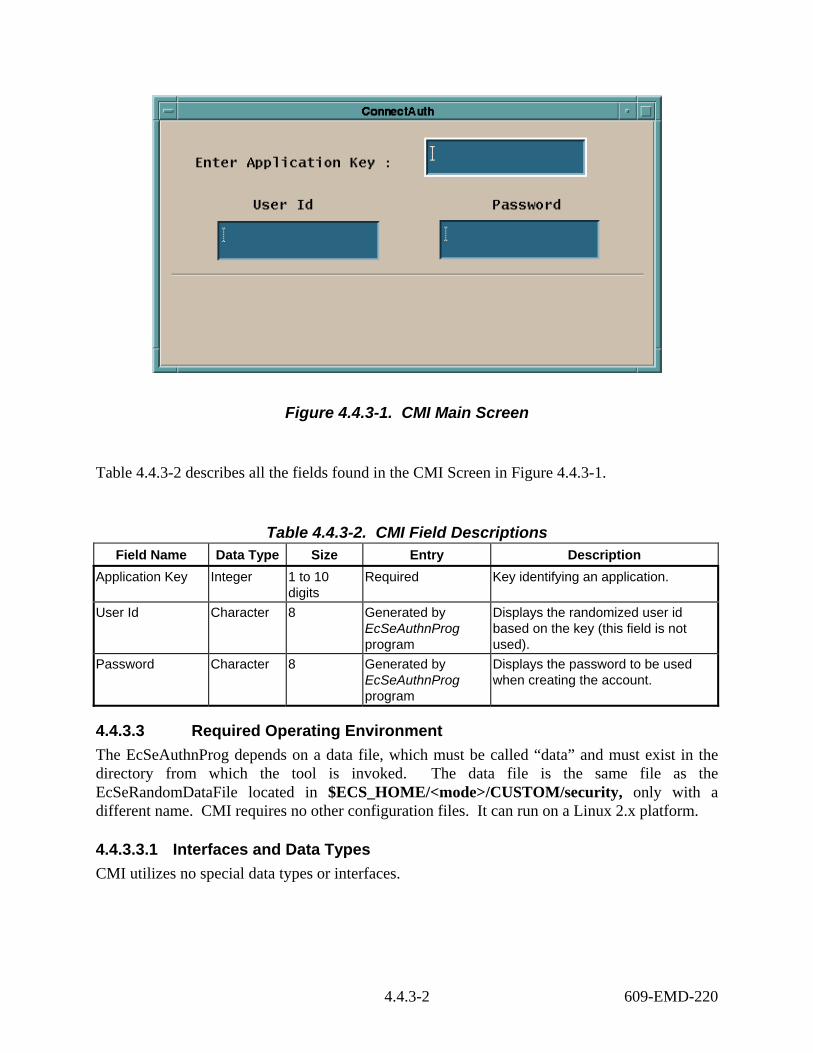
Figure 4.4.3-1. CMI Main Screen
Table 4.4.3-2 describes all the fields found in the CMI Screen in Figure 4.4.3-1.
Table 4.4.3-2. CMI Field Descriptions Field Name Data Type Size Entry Description
Application Key Integer 1 to 10 digits
Required Key identifying an application.
User Id Character 8 Generated by EcSeAuthnProg program
Displays the randomized user id based on the key (this field is not used).
Password Character 8 Generated by EcSeAuthnProg program
Displays the password to be used when creating the account.
4.4.3.3 Required Operating Environment The EcSeAuthnProg depends on a data file, which must be called “data” and must exist in the directory from which the tool is invoked. The data file is the same file as the EcSeRandomDataFile located in $ECS_HOME/<mode>/CUSTOM/security, only with a different name. CMI requires no other configuration files. It can run on a Linux 2.x platform.
4.4.3.3.1 Interfaces and Data Types CMI utilizes no special data types or interfaces.
4.4.3-2 609-EMD-220

4.4.3.4 Databases None.
4.4.3.5 Special Constraints A data file called “data” must exist in the execution directory. The data file must be the same file as the EcSeRandomDataFile.
4.4.3.6 Outputs All information is displayed on the CMI screen.
4.4.3.7 Event and Error Messages The CMI program issues error messages.
4.4.3.8 Reports None.
4.4.3-3 609-EMD-220

This page intentionally left blank.
4.4.3-4 609-EMD-220

4.5 Science Software Integration and Test (SSI&T) This section describes the tools used by DAAC operations personnel who are Science Software Integration and Test (SSI&T) specialists. The function of SSI&T is to prepare the science software received from the Instrument Teams for DAAC production. All the COTS tools/products are documented in separate product specific documentation. These tools are only identified in this section. Operators must verify that COTS documentation matches the product version in use. Finally, there are custom applications that are unique to the SSI&T activity. These tools are described in the following subsections.
4.5-1 609-EMD-220

This page intentionally left blank.
4.5-2 609-EMD-220
4.5.1 Science Software Integration and Test (SSI&T) The SSI&T contains comparison tools, and COTS tools for comparing and analyzing environment programs. All programs can be invoked from the UNIX command line. The HDF file comparison tool is contained in the SSI&T subset of tools.
4.5.1.1 Linux Platform Table 4.5.1-1 lists the SSI&T command line interfaces for the Linux workstation.
Table 4.5.1-1. SSI&T Command Line Interfaces Command Line Interface Description and Format When and Why Used
EcClHdiff HDF file comparison (command line)
Compare 2 HDF files.
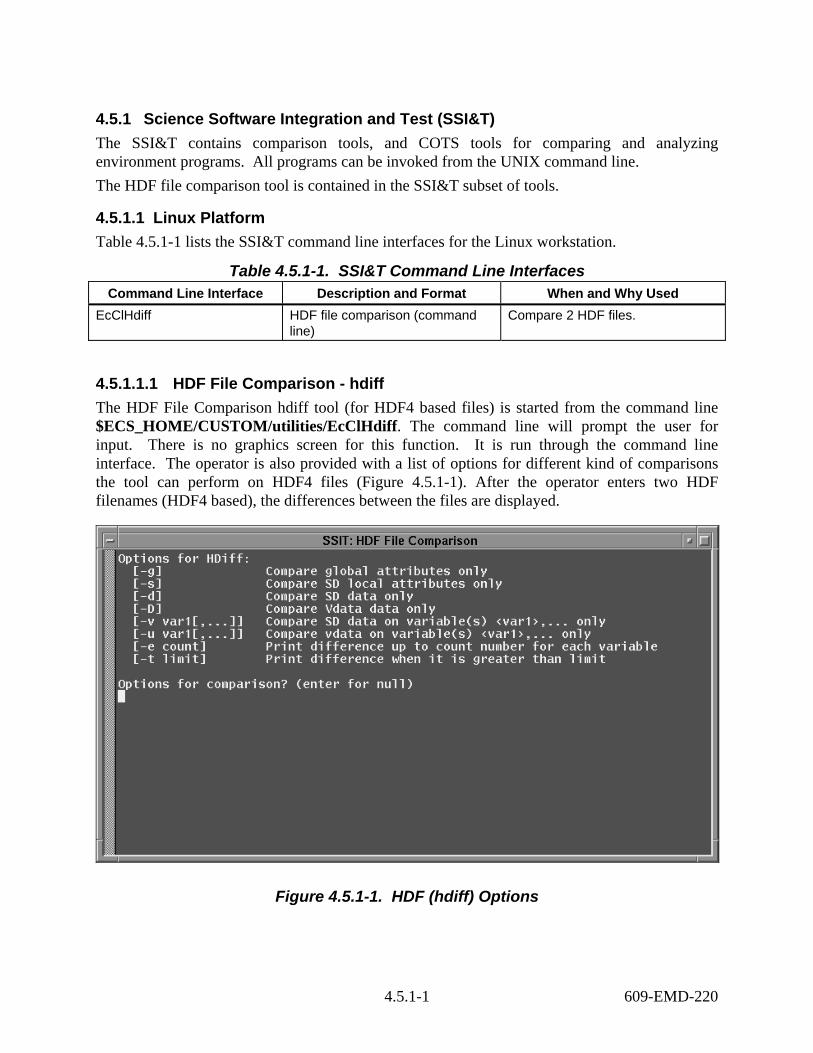
4.5.1.1.1 HDF File Comparison - hdiff The HDF File Comparison hdiff tool (for HDF4 based files) is started from the command line $ECS_HOME/CUSTOM/utilities/EcClHdiff. The command line will prompt the user for input. There is no graphics screen for this function. It is run through the command line interface. The operator is also provided with a list of options for different kind of comparisons the tool can perform on HDF4 files (Figure 4.5.1-1). After the operator enters two HDF filenames (HDF4 based), the differences between the files are displayed.
Figure 4.5.1-1. HDF (hdiff) Options
4.5.1-1 609-EMD-220

The following is an example of the HDiff tool (Figure 4.5.1-2). After asking for options, there will be a prompt asking for the mode of operations. Next, the tool prompts the user for the locations of the HDF files to be compared. Full paths are required. Finally, the user will be prompted for where to store the resulting output as a text file (full path required). Afterward, the user can press ENTER to compare two other files or <q> to quit.
Figure 4.5.1-2. HDiff example output
4.5.1-2 609-EMD-220
4.6 ECS Data Pool Ingest ECS Data Pool Ingest provides the software capability to acquire data by various protocols and transfer the data into the ECS system. The ECS Data Pool Ingest subsystem also stores and manages request information, performs data preprocessing, inserts data into the Online Archive, and copies data into the tape archive. The ECS Data Pool Ingest subsystem provides a GUI which allows the operator to view past ingest activities, monitor and control ingest requests and services, view operator alerts, disposition operator interventions, and modify system and external data provider parameters.
4.6-1 609-EMD-220

This page intentionally left blank
4.6-2 609-EMD-220

4.6.1-1 609-EMD-220
4.6.1 Data Pool Ingest GUI The Data Pool (DPL) Ingest GUI is a web-based interface that allows operators to access and manipulate the DPL Ingest system. Using this GUI, an operator can monitor and fix Ingest requests, view system alerts, and see at a glance the status of the DPL Ingest system in part and in whole. The DPL Ingest GUI also allows in-depth configuration of the entire DPL Ingest system without the operator having to manually configure the DPL Ingest database. It provides a fast and secure way to easily manage the entire DPL Ingest system, complete with full operator permission configuration and management so that only authorized persons may perform actions or change configuration settings. Since the DPL Ingest GUI is a web-based interface, it can be accessed from virtually anywhere there is access to the internal network. No custom software installation is required – all that is needed is a web browser (see Section 4.6.1.28 Browser Requirements). Because this is a web-based application, the DPL Ingest GUI can be run by any number of operators from any number of locations, even remote locations, provided that a remote connection is properly configured. This document shows and explains in detail all of the available features and functionality of the DPL Ingest GUI, from the first login to complex operator actions and configuration, as well as tips for getting extra help.
4.6.1.1 Login Page This page first appears when the application is loaded. The operator will be required to enter a pre-assigned user name and password, as shown in Figure 4.6.1-1. Once the operator is logged in, the home page will be displayed and the application will be enabled. If the authorization scheme has been disabled, the home page (shown in Figure 4.6.1-2) would be displayed immediately instead of the login page, and the operator will not be required to log in.

4.6.1-2 609-EMD-220
Figure 4.6.1-1. Login Page
Using the GUI in Protected Mode
If your DAAC requires a password-protected login with different permission levels, the following applies:
• Sort settings are remembered for each session – that is, every time an operator logs in. They are reset when the operator logs off or a new session is started.
• Filter settings are always remembered for each operator, since these are stored in the database.
Using the GUI in Open Mode
If your DAAC does not require a password-protected login, then each operator essentially uses a single “virtual operator” which has all permissions and stores a single set of filter settings that are shared across all sessions. This means that an operator at one terminal can affect the filter settings of an operator at another terminal. Sort settings are not stored in the database and are therefore remembered for each session. Please note however, that sort settings may be lost if the browser is closed of a new session is otherwise started.

4.6.1-3 609-EMD-220
Session Timeout
Depending on the installation of Tomcat at your particular site, the session timeout can vary and is not configurable through the GUI. Miscellaneous Features
• The Reset Button: Throughout the GUI, you will see “Reset” buttons on some pages. These simply reset the form values so you can start over again – pressing/clicking Reset does not submit any changes to the database.
• Whitespace in forms: In general, whitespace is stripped from most text input fields unless it is meant to contain whitespace, like comment fields. For example, on the Provider Configuration page to add a new Data Provider, all of the input fields are stripped of any accidentally input whitespace when submitted.
4.6.1.2 Home Page The Home Page provides a general overview of the Data Pool Ingest system status, as shown in Figure 4.6.1-2. This page includes the following:
• General system statistics
• The Data Pool Ingest statuses, which may be suspended if active, and resumed if suspended. These include:
o General Ingest Status
o Email Service Status
• The status of the Ingest services, which cannot be changed by the operator, including (see also Figure 4.6.1-2):
o The Notification Service
o The Polling Service
o The Processing Service

4.6.1-4 609-EMD-220
Figure 4.6.1-2. Home Page
4.6.1.2.1 General System Statistics This section provides general information about current requests and granules in the system, as well as the various services and file systems used in processing. Summary information is not included about providers and transfer hosts, though this data can be found on the Provider Status page (Section 4.6.1.10) and the Transfer Host Status page (Section 4.6.1.13). Detail descriptions of the data found in this section is available in Table 4.6.1-1.
4.6.1-5 609-EMD-220
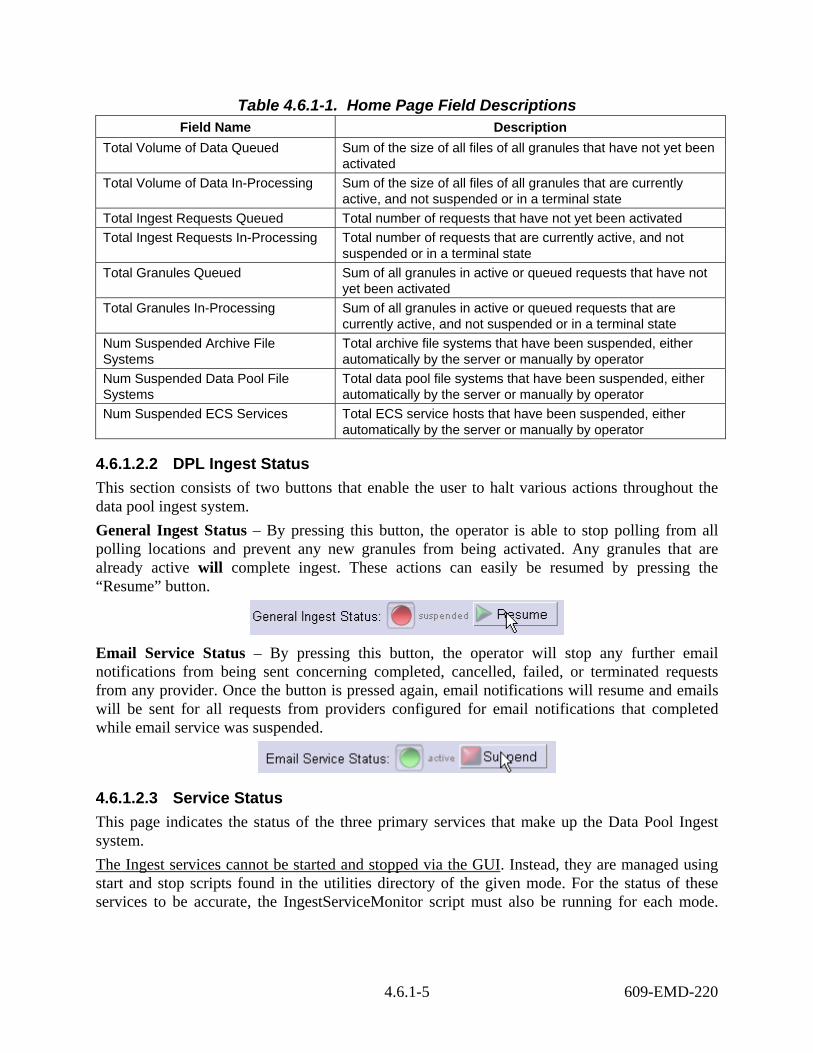
Table 4.6.1-1. Home Page Field Descriptions Field Name Description
Total Volume of Data Queued Sum of the size of all files of all granules that have not yet been activated
Total Volume of Data In-Processing Sum of the size of all files of all granules that are currently active, and not suspended or in a terminal state
Total Ingest Requests Queued Total number of requests that have not yet been activated Total Ingest Requests In-Processing Total number of requests that are currently active, and not
suspended or in a terminal state Total Granules Queued Sum of all granules in active or queued requests that have not
yet been activated Total Granules In-Processing Sum of all granules in active or queued requests that are
currently active, and not suspended or in a terminal state Num Suspended Archive File Systems
Total archive file systems that have been suspended, either automatically by the server or manually by operator
Num Suspended Data Pool File Systems
Total data pool file systems that have been suspended, either automatically by the server or manually by operator
Num Suspended ECS Services Total ECS service hosts that have been suspended, either automatically by the server or manually by operator
4.6.1.2.2 DPL Ingest Status This section consists of two buttons that enable the user to halt various actions throughout the data pool ingest system. General Ingest Status – By pressing this button, the operator is able to stop polling from all polling locations and prevent any new granules from being activated. Any granules that are already active will complete ingest. These actions can easily be resumed by pressing the “Resume” button.
Email Service Status – By pressing this button, the operator will stop any further email notifications from being sent concerning completed, cancelled, failed, or terminated requests from any provider. Once the button is pressed again, email notifications will resume and emails will be sent for all requests from providers configured for email notifications that completed while email service was suspended.
4.6.1.2.3 Service Status This page indicates the status of the three primary services that make up the Data Pool Ingest system. The Ingest services cannot be started and stopped via the GUI. Instead, they are managed using start and stop scripts found in the utilities directory of the given mode. For the status of these services to be accurate, the IngestServiceMonitor script must also be running for each mode.

4.6.1-6 609-EMD-220
This script is installed in the utilities directory of each mode and can be started with the command: EcDlIngestServiceMonitorStart [MODE]. The services are as follows:
• Notification Service Status - Indicates whether the notification service is up or down. If up, no notifications will be sent, but a queue of notifications will be collected and distributed once the service is restarted.
• Polling Service Status - Indicates whether the polling service is up or down. If this service is down, PDRs will not arrive from any configured polling location, but any PDRs that remain in the directories will be added once the service is restarted.
• Processing Service Status - Indicates whether the processing service is up or down. If this service is down, no actions on any requests or granules will start, continue, or complete and Granules will “hang” in their current state.
4.6.1.3 The Navigation Panel Navigation throughout the DPL Ingest GUI is accomplished through an Explorer-like menu in the left pane of the application, as shown in Figure 4.6.1-2 and Figure 4.6.1-3. These menus expand and contract to hide or view menu items under each category. The navigation panel is static; it will not reload every time a new menu item is selected.
Figure 4.6.1-3. Navigation Panel
A Note on the Back and Forward Buttons In order to properly navigate through the application, the operator should not use the browser’s built-in back and forward buttons, as this may cause an error to occur in the application. All

4.6.1-7 609-EMD-220
navigation should be accomplished through use of the navigation panel and list navigators (e.g., custom back and forward buttons for lists of requests and granules). See Figure 4.6.1-4.
Figure 4.6.1-4. Built-in Back/Forward Browser Buttons
Error Pages
When errors occur (e.g., an invalid action was sent), the GUI will display such errors on the page for which it was generated and in most cases the items causing the error will be highlighted in red. An example is trying to resume an already active Provider, as shown in Figure 4.6.1-5.

4.6.1-8 609-EMD-220
Figure 4.6.1-5. Error Indicators
In other cases, the GUI may have trouble processing an operator’s action for an unknown reason. Although this is rare, an error screen will be displayed allowing you to reset your session so that the GUI can properly process further actions. See Figure 4.6.1-6 for an example. This error screen also displays the specific problem so that a detailed error message can be sent to a qualified person for analysis if the error occurs frequently.

4.6.1-9 609-EMD-220
Figure 4.6.1-6. Error Processing Request
4.6.1.3.1 Current Operator Settings The navigation panel also contains a section below the menus that allows the current logged-in operator to perform the following actions (see Figure 4.6.1-7):
• Log out
• Change your password
• Show all of your permissions

4.6.1-10 609-EMD-220
Figure 4.6.1-7. Operator Information Panel
Depending on the settings of the currently logged in operator, various functions of the DPL Ingest GUI will be disabled. An example of how disabled functions will appear is shown in Figure 4.6.1-8.
Figure 4.6.1-8. Disabled Permissions
Operator Actions Explained
Log Out
This allows you to log out of the current session (without closing the browser). The login page will be displayed upon successful logout (see Figure 4.6.1-9).
Figure 4.6.1-9. Log Out Button

4.6.1-11 609-EMD-220
Change Password
Click on “change password” to change the current operator’s password – a box will appear below the link, as shown in Figure 4.6.1-10. Type the new password into the two boxes and click “Ok.”
Figure 4.6.1-10. Operator Password Settings
Show My Permissions
Click on “show my permissions” to view or hide the current permissions – a box will appear below the link, as shown in Figure 4.6.1-11.
Figure 4.6.1-11. Operator Permission Settings
4.6.1.4 Pagination Arrows On the Request Status page and details page, Historical Requests page and details page, and the Open Interventions page and details page, there are a set of pagination arrows used for maneuvering through the lists of requests and granules that are displayed. The maximum number of rows displayed at a time is configurable by the operator. The items on the list that will be displayed on each page will be determined by the current sorting setting (see Section 4.6.1.6.3).
4.6.1-12 609-EMD-220
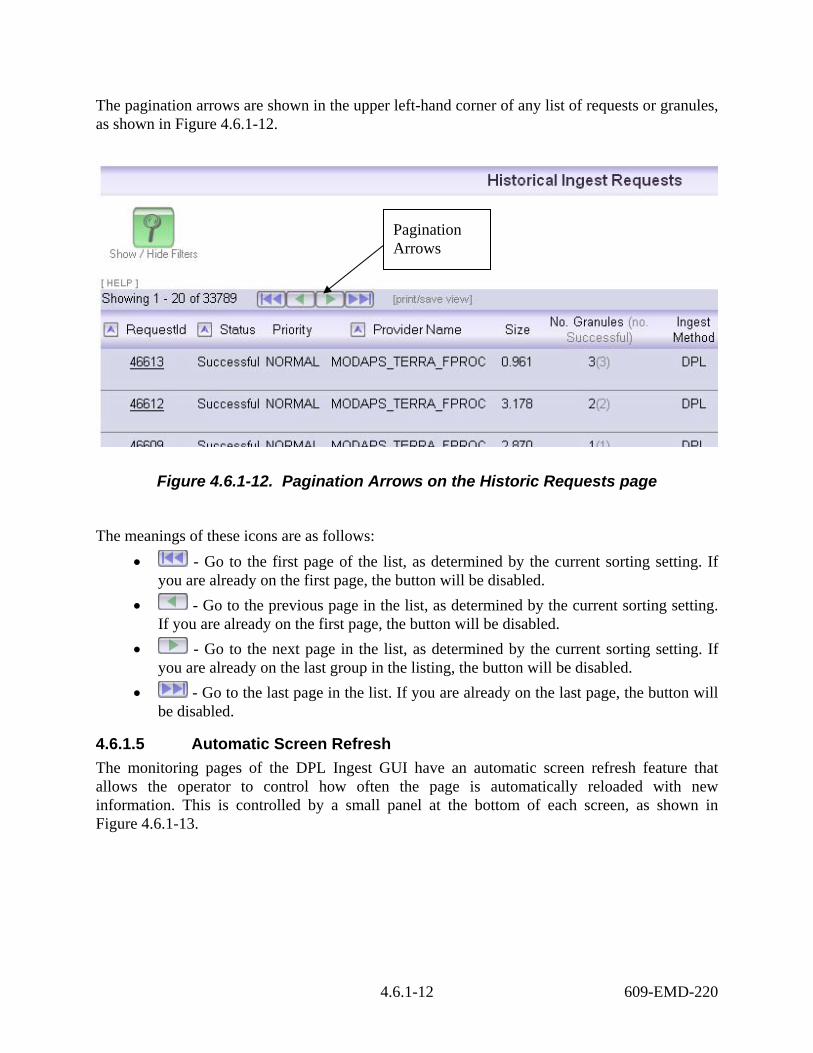
The pagination arrows are shown in the upper left-hand corner of any list of requests or granules, as shown in Figure 4.6.1-12.
Figure 4.6.1-12. Pagination Arrows on the Historic Requests page
The meanings of these icons are as follows: • - Go to the first page of the list, as determined by the current sorting setting. If
you are already on the first page, the button will be disabled. • - Go to the previous page in the list, as determined by the current sorting setting.
If you are already on the first page, the button will be disabled. • - Go to the next page in the list, as determined by the current sorting setting. If
you are already on the last group in the listing, the button will be disabled. • - Go to the last page in the list. If you are already on the last page, the button will
be disabled.
4.6.1.5 Automatic Screen Refresh The monitoring pages of the DPL Ingest GUI have an automatic screen refresh feature that allows the operator to control how often the page is automatically reloaded with new information. This is controlled by a small panel at the bottom of each screen, as shown in Figure 4.6.1-13.
Pagination Arrows

4.6.1-13 609-EMD-220
Figure 4.6.1-13. Auto Refresh Control Panel
The operator may change the refresh rate for any page or completely turn it off. Note that each page has an independent refresh rate and that these settings are remembered for the current session only – they are lost if the operator logs out or the application is restarted. To change the refresh settings, click on the desired rate (or off). The page will reload and the new settings will take effect. A dynamic clock will appear in the upper right-hand corner, informing the operator how long it will be until the next refresh, as shown in Figure 4.6.1-14.
Figure 4.6.1-14. Dynamic Auto-Refresh Clock
Dynamic Auto-Refresh Clock

4.6.1-14 609-EMD-220
The refresh counter will be paused whenever the mouse is in motion. This is to prevent a refresh from occurring when the operator is in the middle of an action, as shown in Figure 4.6.1-15.
Figure 4.6.1-15. Paused Auto-Refresh Clock
Note: Some pages have different available refresh rates. This is designed to reduce the load on the database for certain actions that could affect performance.
4.6.1.6 Ingest Requests Page This page displays the current active ingest requests, as shown in Figure 4.6.1-16. The operator may select any eligible request and perform one of several actions:
• Cancel the request(s) – This is an irreversible action, there is no way to ‘un-cancel’ a request.
• Suspend the request(s) – This action may be performed only if the selected requests are not already suspended or cancelled and is used to stop new granules from being activated. Active granules in suspended requests will continue through processing.
• Resume the request(s) – This action may be performed only if the selected requests are suspended.
• Change the DPL Ingest Priority of the request(s) – Requests in terminal states cannot have their priority changed. A default priority will be assigned to requests based upon the configuration of the request’s provider.
See Section 4.6.1.6.1 below for detailed explanations of each Request action. Table 4.6.1-2 contains descriptions of the Request Status page columns.

4.6.1-15 609-EMD-220
Figure 4.6.1-16. Request Status Page
Table 4.6.1-2. Request Status Page Column Descriptions Field Name Description
Request ID Unique ID for an ingest request Status Status of the request (see Table for list of possible statuses) Priority The precedence which a request will have for activation and various
processing actions. Provider Name Name of the provider from which the request was obtained Size [MB] Sum of the size of all granules in the request Granules Total granules included in the request Granules Completed Processing
Total granules that have reached a successful state
When Queued Time the request was encountered by the polling service Last Update Time of the last change made by the ingest services to the status of the
request or its granules

4.6.1-16 609-EMD-220
Table 4.6.1-3 below describes the allowable actions that can be taken for Requests in their various states. A checkmark ( ) indicates that the action is allowed.
Table 4.6.1-3. Ingest Request Allowed Actions Request Actions Request Status
Suspend Change Priority
Resume Cancel No Actions Allowed
New Validated Active Partially_Suspended Suspending / Suspended Resuming Failed Partial_Failure Canceling Partially_Cancelled Successful
4.6.1.6.1 Request Actions Changing Request Statuses
To change the status of request(s) (cancel, suspend, or resume), select the desired request(s) by checking the boxes on the left side of the request list. You can also select or deselect all the requests by checking the box at the very top of the list. See Figure 4.6.1-17.
Figure 4.6.1-17. Canceling a Request
4.6.1-17 609-EMD-220
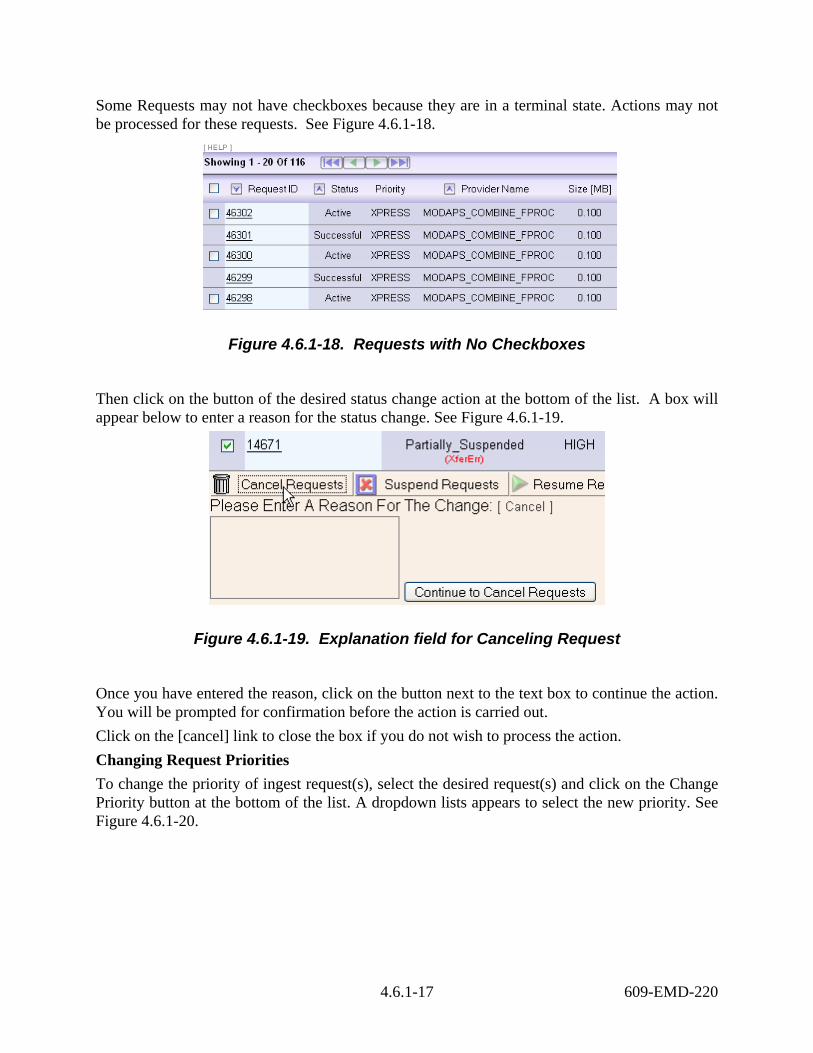
Some Requests may not have checkboxes because they are in a terminal state. Actions may not be processed for these requests. See Figure 4.6.1-18.
Figure 4.6.1-18. Requests with No Checkboxes
Then click on the button of the desired status change action at the bottom of the list. A box will appear below to enter a reason for the status change. See Figure 4.6.1-19.
Figure 4.6.1-19. Explanation field for Canceling Request
Once you have entered the reason, click on the button next to the text box to continue the action. You will be prompted for confirmation before the action is carried out. Click on the [cancel] link to close the box if you do not wish to process the action. Changing Request Priorities To change the priority of ingest request(s), select the desired request(s) and click on the Change Priority button at the bottom of the list. A dropdown lists appears to select the new priority. See Figure 4.6.1-20.

4.6.1-18 609-EMD-220
Figure 4.6.1-20. Changing Request Priorities
Enter a reason for the change in priority. Then select the desired priority from the drop down list and then click the OK button to continue the action. You will be prompted for confirmation before the action is carried out. Click on the [cancel] link to close the box if you do not wish to process the action.
4.6.1.6.2 Filters The request list on the Ingest Requests page can be filtered using the filter panel that appears on the same page. This is opened (or closed) by clicking on the green filter button at the top of the page, as shown in Figure 4.6.1-21. Filter settings are associated with an operator profile and are always remembered, even when logging out of the session. Filter settings are shared among all operators if authentication is not enabled. See Section 4.6.1.25 for more details on how this works.

4.6.1-19 609-EMD-220
Figure 4.6.1-21. Ingest Request List Filter Panel
This panel shows the current filter settings and allows the operator to change them. There are two tabs on this panel, one that provides filter options based upon the attributes of the various requests (Criteria Based Filtering), as shown in Figure 4.6.1-21, and the other that will cause only a single request ID to be displayed (Filter By Request ID), as shown in Figure 4.6.1-22. Under Criteria Based Filtering, there are several different types of filters that can be applied concurrently to the request list. These are as follows:
• Data Providers – By selecting a provider from the drop-down list, only requests from that provider will be displayed in the request list.
• Request Detail Criteria – The operator can either filter by a request state, or by an error state by selecting from the dropdown menu, as shown in Figure 4.6.1-22.
o Request States – If this option is selected, multiple states may be included in the filter by holding down the CTRL key and selecting all of the desired states. Only requests in the selected states will be displayed.
o Error Types – By selecting an error type, only requests in intervention with at least one granule currently in that error state will be displayed. Only one error type may be selected.

4.6.1-20 609-EMD-220
Figure 4.6.1-22. Selecting the Type of Request Detail Criteria
• Target Archives – Multiple archives may be included in the filter by holding down the CTRL key and selecting all of the desired archives. Only requests with granules from data types configured to be sent to the selected archives will be displayed.
• Date Range Criteria – The operator can either filter by the time when a request was last updated or when it was last queued, as shown in Figure 4.6.1-23.
o Last Updated – Only requests that were updated from the “to” and “from” dates will be displayed. The Last Updated date/time of a Request is changed whenever the state of a granule or a request is changed.
o Queued – Only requests that were added to the request list from the given date to the given date will be displayed
o Queued within Last Hour – Only requests that were queued within the last one hour from the current time.
o None – No date range filtering will be applied
Figure 4.6.1-23. Selecting Date Range Criteria
To filter by a single Request ID, press on the “Filter By Request ID” tab. A single field for entering a Request ID number will appear, as shown in Figure 4.6.1-24. The request ID filter can only be applied by itself and not in combination with any other filter attributes.

4.6.1-21 609-EMD-220
Figure 4.6.1-24. Filtering By Request ID
Once the desired filter options are selected, the operator has the option of saving these settings as the default by selecting the “Save As Default Settings” box prior to clicking “Apply Filter” (see Figure 4.6.1-25). Thereafter, the operator can click “Load Default Settings” to load the defaults. If no default is stored, the filters will be set so that all requests will be shown.
Figure 4.6.1-25. Saving Default Filter Settings
Once all settings are selected, press the “Apply Filter” button. A new page will appear showing only the requests meeting the filter criteria. Filtering options will be hidden until the green “Show / Hide Filters” button is pressed again.
4.6.1.6.3 Sorting The request list on the Ingest Requests page can be sorted by clicking on the desired column at the top of the request list, as shown in Figure 4.6.1-26. The direction of the arrow next to the column indicates how that column may be sorted, either in ascending or descending order. All columns, unless they are date columns or the Request ID column, can be sorted in ascending order. The Request ID column is sorted in descending order. Date columns can be sorted in either ascending or descending order, as shown in Figure 4.6.1-27. Unlike filter settings, sort settings are remembered for the session only.

4.6.1-22 609-EMD-220
Figure 4.6.1-26. Request List Sorting
Figure 4.6.1-27. Date Sorts
4.6.1.7 Ingest Request Detail To view the details of an ingest request (which also displays the list of associated granules), click on the desired request ID on the Ingest Request List, as shown in Figure 4.6.1-28.
Figure 4.6.1-28. Viewing Request Details
The Ingest Request Detail page is shown below in Figure 4.6.1-29. Specific sections of this page are described in more detail in the following subsections. Table 4.6.1-4 contains descriptions for the Request Info Panel fields.
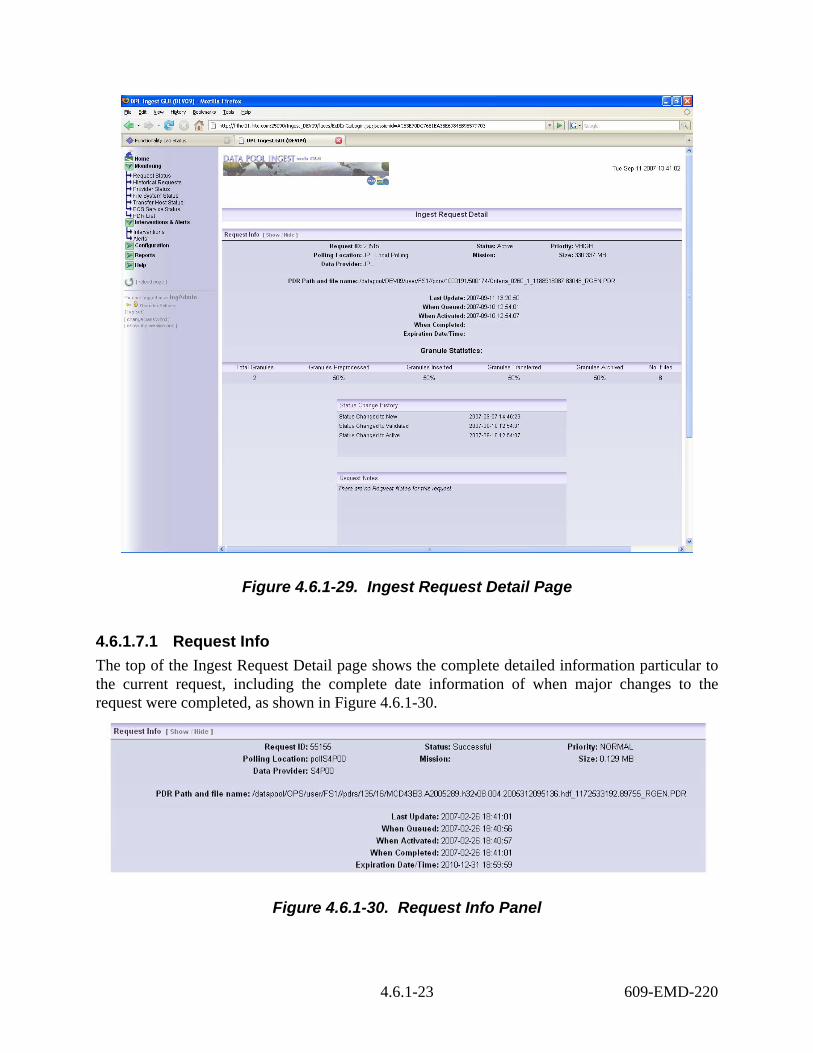
4.6.1-23 609-EMD-220
Figure 4.6.1-29. Ingest Request Detail Page
4.6.1.7.1 Request Info The top of the Ingest Request Detail page shows the complete detailed information particular to the current request, including the complete date information of when major changes to the request were completed, as shown in Figure 4.6.1-30.
Figure 4.6.1-30. Request Info Panel

4.6.1-24 609-EMD-220
Table 4.6.1-4. Request Detail Page – Request Info Panel Field Descriptions Field Name Description
Request ID Unique ID for an ingest request Polling Location Unique name assigned to the polling location from where the request was
obtained Data Provider Unique name assigned to the provider associated with the polling location
where the request was found Status The current state of the request (see Table 4.6.1-3 to see possible request
states) Mission Satellite mission defined in the PDR associated with this request (this is not
defined in most PDRs) Priority The precedence which a request will have for activation and various
processing actions. Size Sum of the size of all granules in the request PDR Path and file name
Temporary location and file name of the PDR after it was copied from the polling location. The PDR can be found in this location until the request completes ingest.
Last Update The last time the status of the request or an associated granule changed When Queued The time the request was added to the request list When Activated The time the request was moved into the “Active” state When Completed The time all the granules in the request reached a terminal state Expiration Date/Time The date and time by which the corresponding ingest request must be
completed
If there is an intervention pending against the request, then there will be a link to the intervention detail page, as shown in Figure 4.6.1-30. Click on the “[view details]” link to navigate to the intervention detail page. More information on intervention details can be obtained in Section 4.6.1.15.
4.6.1.7.2 Granule Statistics This section of the request details shows the overall statistics for all of the granules associated with this request, as shown in Figure 4.6.1-31. Table 4.6.1-5 lists the granule statistics panel field descriptions.
Figure 4.6.1-31. Granule Statistics

4.6.1-25 609-EMD-220
Table 4.6.1-5. Request Detail Page – Granule Statistics Panel Field Descriptions Field Name Description
Total Granules Total number of granules included in the request Granules Preprocessed Percentage of granules that have moved from the preprocessing state to the
archiving state Granules Inserted Percentage of granules that have been inserted into AIM Granules Transferred Percentage of granules transferred from the provider to the temp directories Granules Archived Percentage of granules that have been archived No. Files Total number of files associated with granules in the request
4.6.1.7.3 Status Change History This section shows a complete record of the status changes for the request in a scrollable table, as shown in Figure 4.6.1-32.
Figure 4.6.1-32. Status Change History
4.6.1.7.4 Request Notes Requests notes are annotations that can be useful in tracking changes to the request. These will either be added automatically by the server or manually by the operator. Automatic annotations are added when the operator performs an action on the request or granules in the request. In Figure 4.6.1-33 below, the first request note was automatically added after the operator “IngAdmin” failed one of the request granules. The second annotation was added manually by the operator “IngAdmin” to give more details on why the granule was failed. You can add a request note, but not edit or delete one. To add a request note, click “[Add annotation…]” at the bottom of the annotation list, as shown in the figure below:

4.6.1-26 609-EMD-220
Figure 4.6.1-33. Request Notes
An area will appear below where you can add a new annotation. After you are finished, click “Add this Annotation,” as shown in Figure 4.6.1-34. It will be time stamped after it is added.
Figure 4.6.1-34. New Annotation Text Box
4.6.1.7.5 Granule List Panel This is the list of all granules associated with this request, as shown in Figure 4.6.1-35. By default, this list is sorted in ascending alphabetical order by Granule status, always showing suspended granules first. The operator also has the ability to sort by other criteria, including:
• descending granule states, with suspended granules last
• Granule sequence number

4.6.1-27 609-EMD-220
Figure 4.6.1-35. Granule List
Table 4.6.1-6 lists the granule list panel column descriptions.
Table 4.6.1-6. Request Detail Page – Granule List Panel Column Descriptions Field Name Description
Checkbox column This column may contain a checkbox next to the granule, if the granule is not in a terminal state. This allows an action to be processed for the selected granule(s). The checkbox at the top of the column selects or de-selects all the granules in the list that have checkboxes.
File Detail The column holds a link to display the detailed file information for each granule – this information appears for each granule at the top of the table when clicked on.
Seq. Number The order in which a granule was found in the PDR Ingest Gran ID Unique Identifier assigned to the granule Data Type Data Type found in the PDR describing the granule Version Version found in the PDR describing the granule. The version will be
extracted from the database if none is in the PDR Status Current granule status (see Table 4.6.1-7) and detailed error information Granule Size (MB) Sum of the size of all files associated with the granule No. Files Number of files found associated with the granule in the PDR Last Status Change Date and time the granule’s status was last updated
A Note on Suspended Granules Nearly all granules that encounter a problem during processing will eventually move into the “suspended” state. The only exception is if a granule fails checksum verification each of the configured number of retries. Except in the case of failed checksum verification or a PDR Validation failure, granules are not failed until the operator explicitly takes an action to fail suspended granules.

4.6.1-28 609-EMD-220
Granule Actions The following actions listed in Table 4.6.1-7 may be performed on granules in the granule list, depending on granule state:
Table 4.6.1-7. Granule Allowed Actions Granule Status Status Type Fail / Retry / Retry
From Start Cancel No Actions
Allowed New Queued Transferring / Transferred Active Checksumming / Checksummed Active Preprocessing / Preprocessed Active Archiving / Archived Active Inserting Active Inserted Active Suspending / Suspended Error Resuming Active Canceling Active Cancelled Terminal Successful Terminal Failed Terminal Publishing / Published Terminal
Retry selected granules: This applies only to granules that are currently suspended and retries them from the last known good state of processing. Every time a granule is retried, an annotation is added identifying the time, operator, and action (see Figure 4.6.1-33) . Retry selected granules from START: This applies only to granules that are currently suspended and retries them from the beginning of processing. Every time a granule is retried, an annotation is added identifying the time, operator, and action. Fail selected granules: This applies only to granules that are currently suspended and transitions the granule into a failed state, with the status indicating the type of error that originally caused the suspensions. Error types are determined by what state the granule is in when it is failed. These states are: XferErr (transferring), ChecksumErr (Checksumming), PreprocErr (Preprocessing), ArchErr (Archiving), InsertErr (Inserting), and PubErr (Publishing). NOTE: After a granule is failed, an annotation is added identifying the time, operator, and action. To perform a granule action, select one or more granules by checking the box on the left side of the line for that granule (if available) and click on the desired action button at the top of the granule list. You will then be asked for confirmation before the action is carried out.
4.6.1-29 609-EMD-220
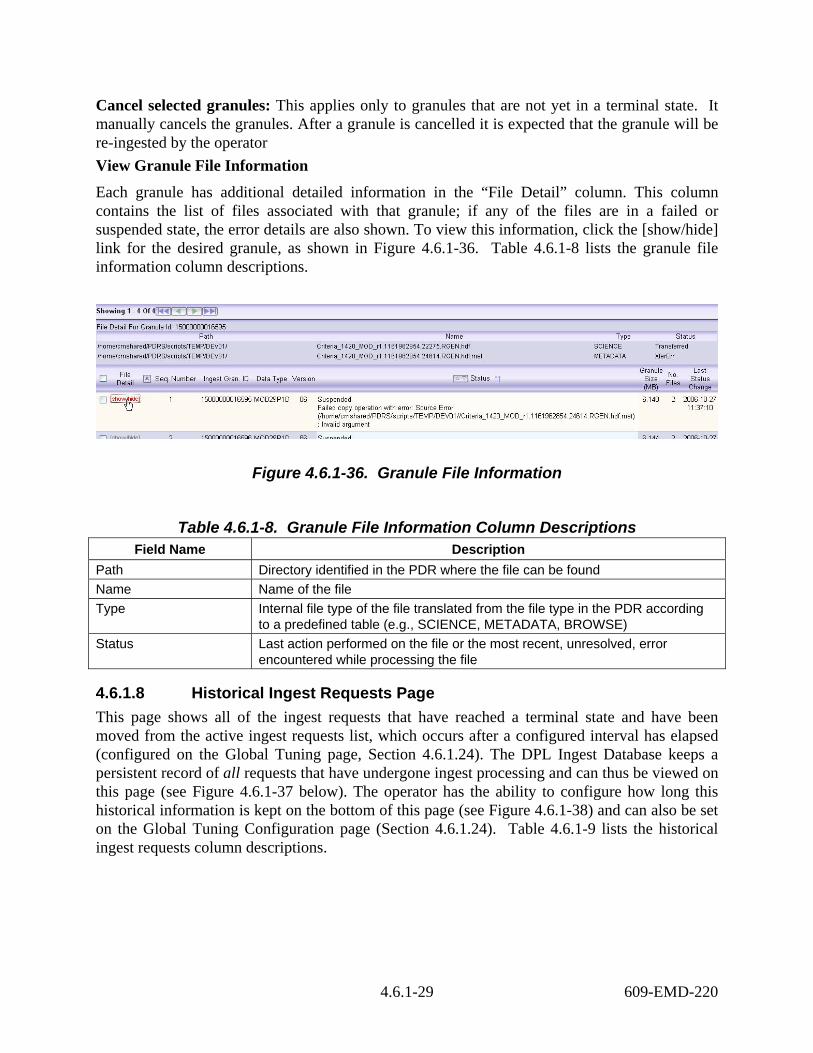
Cancel selected granules: This applies only to granules that are not yet in a terminal state. It manually cancels the granules. After a granule is cancelled it is expected that the granule will be re-ingested by the operator View Granule File Information
Each granule has additional detailed information in the “File Detail” column. This column contains the list of files associated with that granule; if any of the files are in a failed or suspended state, the error details are also shown. To view this information, click the [show/hide] link for the desired granule, as shown in Figure 4.6.1-36. Table 4.6.1-8 lists the granule file information column descriptions.
Figure 4.6.1-36. Granule File Information
Table 4.6.1-8. Granule File Information Column Descriptions Field Name Description
Path Directory identified in the PDR where the file can be found Name Name of the file Type Internal file type of the file translated from the file type in the PDR according
to a predefined table (e.g., SCIENCE, METADATA, BROWSE) Status Last action performed on the file or the most recent, unresolved, error
encountered while processing the file
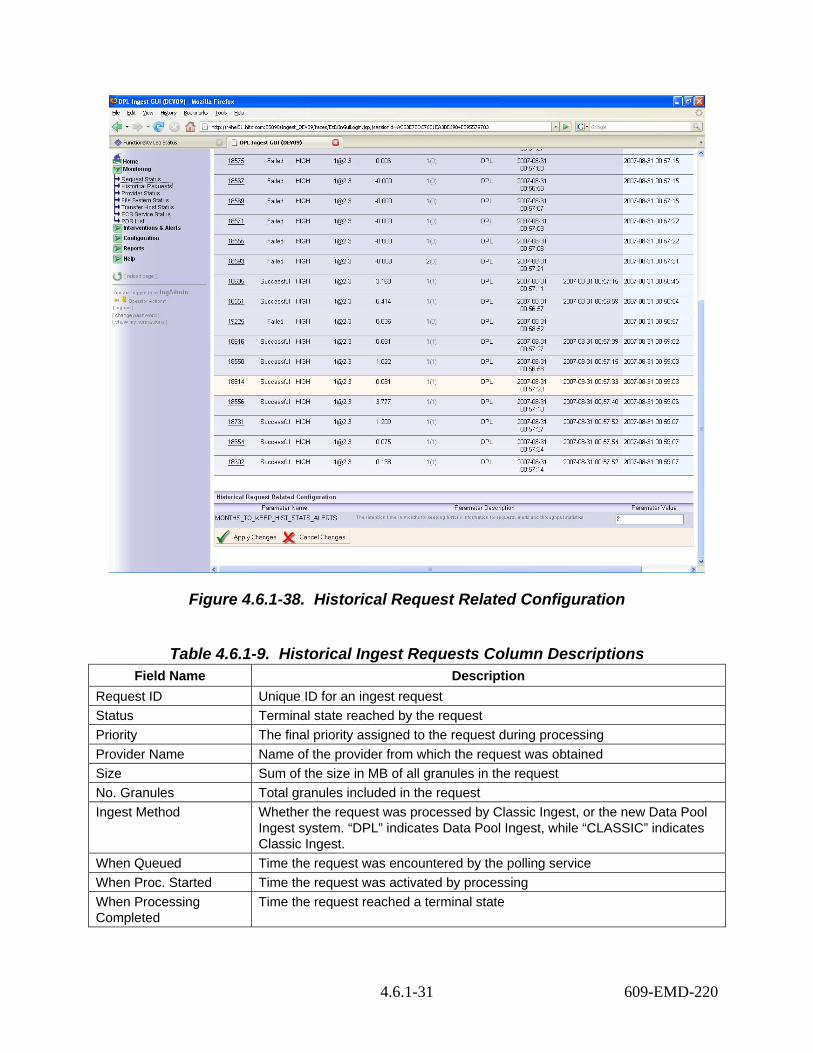
4.6.1.8 Historical Ingest Requests Page This page shows all of the ingest requests that have reached a terminal state and have been moved from the active ingest requests list, which occurs after a configured interval has elapsed (configured on the Global Tuning page, Section 4.6.1.24). The DPL Ingest Database keeps a persistent record of all requests that have undergone ingest processing and can thus be viewed on this page (see Figure 4.6.1-37 below). The operator has the ability to configure how long this historical information is kept on the bottom of this page (see Figure 4.6.1-38) and can also be set on the Global Tuning Configuration page (Section 4.6.1.24). Table 4.6.1-9 lists the historical ingest requests column descriptions.

4.6.1-30 609-EMD-220
Figure 4.6.1-37. Historical Requests Page
4.6.1-31 609-EMD-220
Figure 4.6.1-38. Historical Request Related Configuration
Table 4.6.1-9. Historical Ingest Requests Column Descriptions Field Name Description
Request ID Unique ID for an ingest request Status Terminal state reached by the request Priority The final priority assigned to the request during processing Provider Name Name of the provider from which the request was obtained Size Sum of the size in MB of all granules in the request No. Granules Total granules included in the request Ingest Method Whether the request was processed by Classic Ingest, or the new Data Pool
Ingest system. “DPL” indicates Data Pool Ingest, while “CLASSIC” indicates Classic Ingest.
When Queued Time the request was encountered by the polling service When Proc. Started Time the request was activated by processing When Processing Completed
Time the request reached a terminal state

4.6.1-32 609-EMD-220
4.6.1.8.1 Viewing Historical Request Details To view request details, click on a request ID, which displays a request detail page similar to that for an Active Ingest Request, as shown in Figure 4.6.1-39.
Figure 4.6.1-39. Viewing Historic Request Details
4.6.1.8.2 Printing and Saving Historical Request Lists as Reports The operator can view the entire Historic Request list by clicking the “print/save view” button next to the pagination arrows at the top of the Historic Request List, as shown in Figure 4.6.1-40.
Figure 4.6.1-40. Print/Save View Button
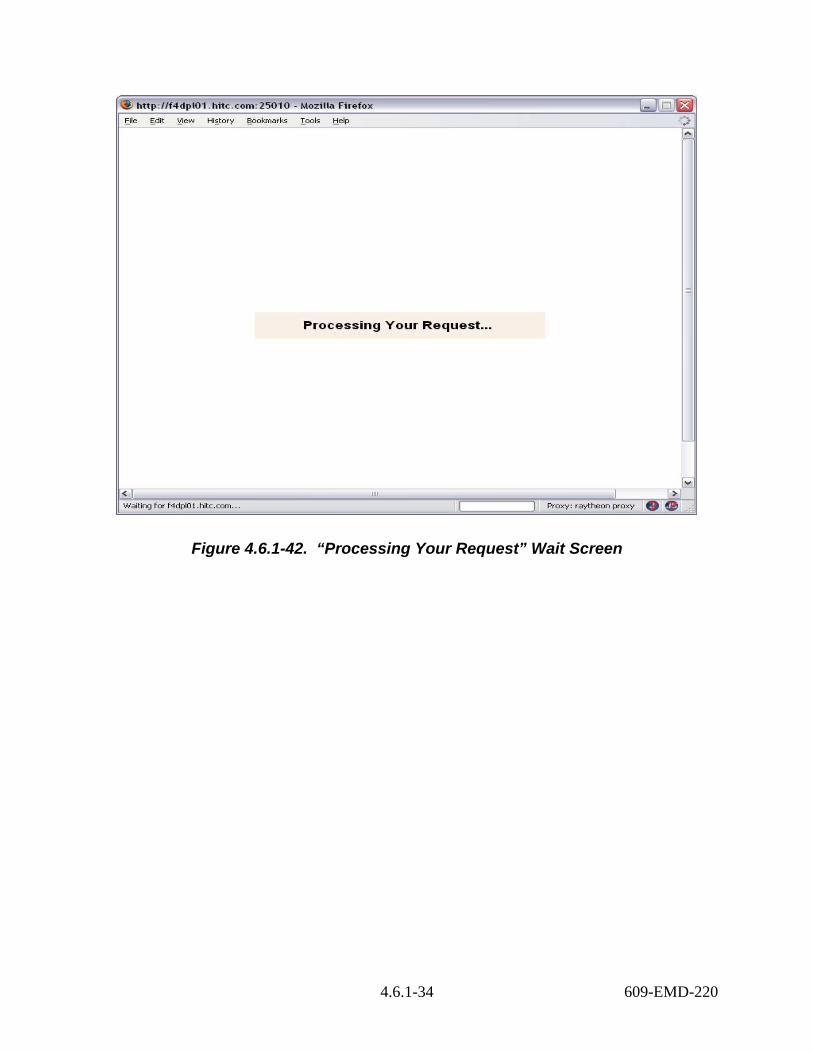
This will display a complete list of all the historic requests, though this list will be restricted by current filter settings. A new window will be opened and you will be prompted to continue, as shown in Figure 4.6.1-41. Because the list could potentially contain thousands of records, it may take several minutes to load the entire list into the browser window. At this point, the window will display “Processing Your Request” (see Figure 4.6.1-42) while the web server retrieves the data – this page may be displayed for several minutes. Once the entire list is loaded, the page will display the list as normal (Figure 4.6.1-43).

4.6.1-33 609-EMD-220
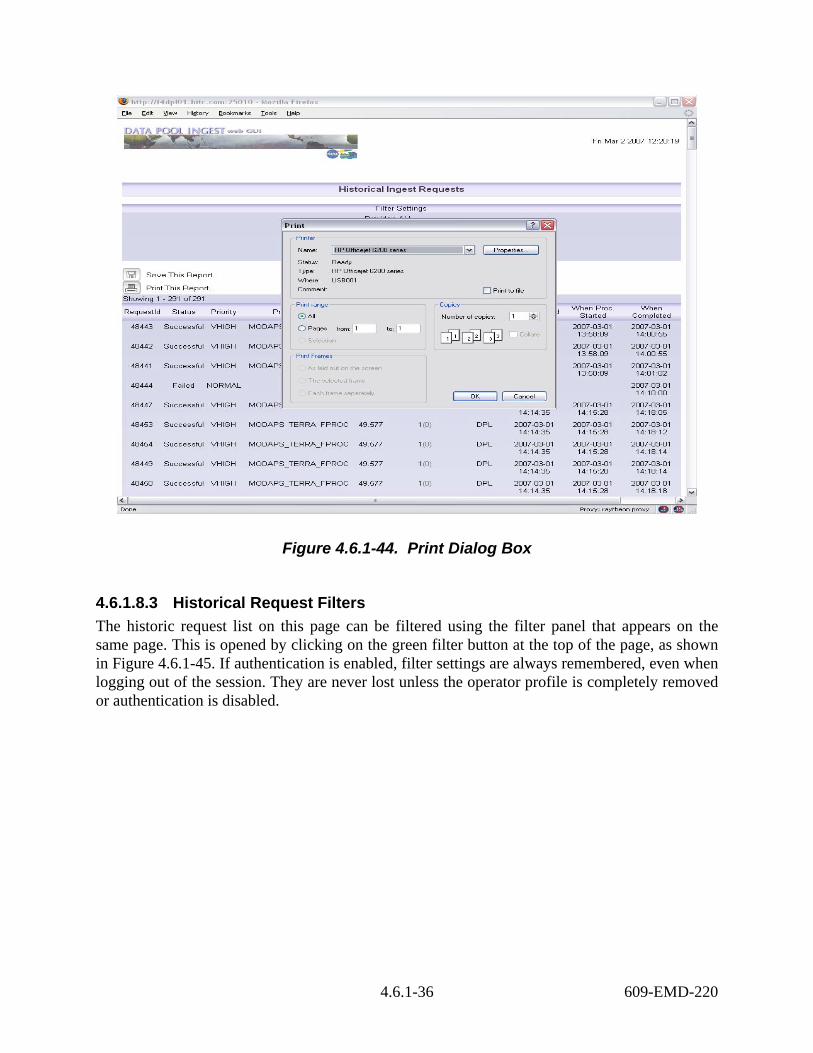
Saving and Printing From here you can save the list as HTML by using the browser’s built-in save functionality (usually File > Save As…). Most browsers will also allow you to save the page as text only. To print, either press the “Print This Report” button directly on the page, or use the menu (File > Print…); this will load your browser’s built-in print dialog box, an example of which is shown in Figure 4.6.1-44.
Figure 4.6.1-41. Prompt to Display Entire Historic Request List
4.6.1-34 609-EMD-220
Figure 4.6.1-42. “Processing Your Request” Wait Screen

4.6.1-35 609-EMD-220
Figure 4.6.1-43. Print/Save View of Historical Ingest Requests
4.6.1-36 609-EMD-220
Figure 4.6.1-44. Print Dialog Box
4.6.1.8.3 Historical Request Filters The historic request list on this page can be filtered using the filter panel that appears on the same page. This is opened by clicking on the green filter button at the top of the page, as shown in Figure 4.6.1-45. If authentication is enabled, filter settings are always remembered, even when logging out of the session. They are never lost unless the operator profile is completely removed or authentication is disabled.

4.6.1-37 609-EMD-220
Figure 4.6.1-45. Filter Panel
This panel shows the current filter settings and allows the operator to change them. There are two tabs on this panel, one that provides filter options based upon the attributes of the various requests (“Combined Filter Settings”), as shown in Figure 4.6.1-45, and the other that will filter by a single request ID (“Request ID Filter Settings”), as shown in Figure 4.6.1-47. Under Criteria Based Filtering, there are several different types of filters that can be applied concurrently to the request list. These are as follows:
• Data Providers – By selecting a provider, only requests from that provider will be displayed in the request list.
• Request States – If this option is selected, multiple states may be included in the filter by holding down the CTRL key and selecting all of the desired states. Only requests in the selected states will be displayed.
• Data Type – By selecting a data type, only requests with granules of the selected data type will be displayed
• Date/Time Range Filter – The operator can either filter by the time when a request was last updated or when it was last queued, as shown in Figure 4.6.1-46.
4.6.1-38 609-EMD-220
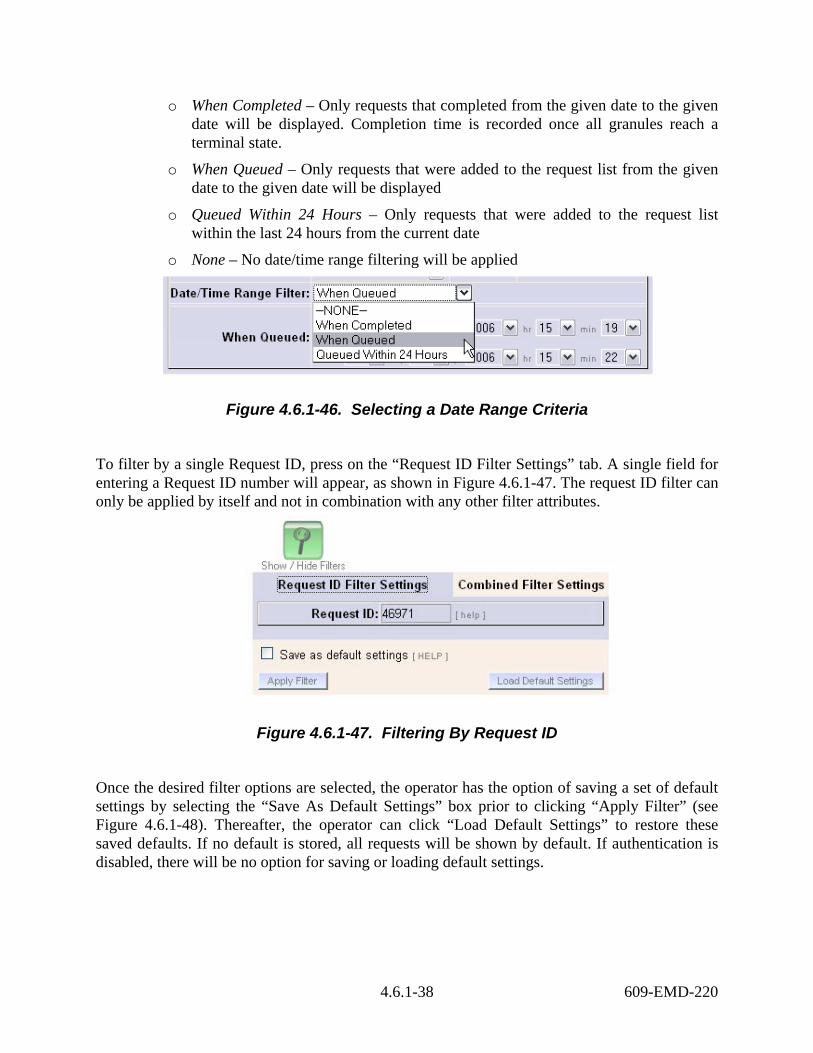
o When Completed – Only requests that completed from the given date to the given date will be displayed. Completion time is recorded once all granules reach a terminal state.
o When Queued – Only requests that were added to the request list from the given date to the given date will be displayed
o Queued Within 24 Hours – Only requests that were added to the request list within the last 24 hours from the current date
o None – No date/time range filtering will be applied
Figure 4.6.1-46. Selecting a Date Range Criteria
To filter by a single Request ID, press on the “Request ID Filter Settings” tab. A single field for entering a Request ID number will appear, as shown in Figure 4.6.1-47. The request ID filter can only be applied by itself and not in combination with any other filter attributes.
Figure 4.6.1-47. Filtering By Request ID
Once the desired filter options are selected, the operator has the option of saving a set of default settings by selecting the “Save As Default Settings” box prior to clicking “Apply Filter” (see Figure 4.6.1-48). Thereafter, the operator can click “Load Default Settings” to restore these saved defaults. If no default is stored, all requests will be shown by default. If authentication is disabled, there will be no option for saving or loading default settings.

4.6.1-39 609-EMD-220
Figure 4.6.1-48. Saving Default Filter Settings
Once all settings are selected, press the “Apply Filter” button. A new page will appear with showing only the requests meeting the filter criteria. Filtering options will be hidden until the green “Show / Hide Filters” button is pressed again.
4.6.1.9 Historical Ingest Request Detail Page The request detail page for a historical request (Figure 4.6.1-49) is similar to the one for an Active Ingest Request, with the request details followed by a granule list. The details on this page are somewhat different in that information pertaining to historical data is shown. Since the request is in a terminal state, no actions can be processed for this request, so action buttons are not present. Tables 4.6.1-10 through 4.6.1-12 contains information for the Historical Ingest Request Detail page such as the request info field descriptions, the request info column descriptions, and the granule list column descriptions.

4.6.1-40 609-EMD-220
Figure 4.6.1-49. Historical Request Detail Page
Page Sections
• Request Info – General information about the request

4.6.1-41 609-EMD-220
Table 4.6.1-10. Historical Ingest Request Detail Page – Request Info Field Descriptions
Field Name Description Request ID Unique ID for an ingest request Status The final state of the request (see Table 4.6.1-3 for a list of possible request
states) Priority The precedence which a request will have for activation and various
processing actions. Provider Unique name assigned to the provider associated with the polling location
where the request was found Size Sum of the size of all granules in the request No. Granules Total number of granules in the PDR Ingest Method Whether the request was processed by Classic Ingest, or the new DataPool
Ingest system No. Files Number of files found associated with the granule in the PDR
• Request Timings – Seconds of time that passed during various processing actions
Table 4.6.1-11. Historical Ingest Request Detail Page – Request Timings Column Descriptions
Field Name Description Time to Xfer Total seconds of time that passed during all granule transfers Time to Checksum Total seconds of time that passed during all granule checksum operations Time to Preprocess Total seconds of time that passed during all granule preprocessing operations Time to Insert Total seconds of time that passed to insert all granules into AIM Time to Archive Total seconds of time that passed to copy all granules into the archive
• Granule List – Detailed granule information

4.6.1-42 609-EMD-220
Table 4.6.1-12. Historical Ingest Request Detail Page – Granule List Column Descriptions
Field Name Description Seq Number The order in which a granule was found in the PDR Ingest Gran ID Unique Identifier assigned to the granule by the DPL Ingest System ECS Gran ID Unique Identifier assigned to the granule for insert in AIM DPL Gran ID Unique Identifier assigned to the granule for registration in the Data Pool Data Type Data Type found in the PDR describing the granule Version Version found in the PDR describing the granule Status Terminal state reached by the granule Granule Size (MB) Sum of the size of all files associated with the granule No. Files Number of files found associated with the granule in the PDR Proc. Start Time of granule activation Proc. End Time granule reached a terminal state Total Proc. Time Total seconds that lapsed in between granule activation and completion Time to Checksum Total seconds that passed during granule checksum across all files Retry Count Number of times the granule was retried (or retried from start)
4.6.1.10 Provider Status Page This page displays the status and information about each configured data provider in the Data Pool Ingest system (see Figure 4.6.1-50a and 4.6.1-50b for a general overview). Table 4.6.1-13 contains the Provider Status page column descriptions.

4.6.1-43 609-EMD-220
Figure 4.6.1-50a. Provider Status Page (General Overview)

4.6.1-44 609-EMD-220
Figure 4.6.1-50b. Provider Status Page (General Overview)
Table 4.6.1-13. Provider Status Page Column Descriptions Field Name Description
Provider Provider name configured to identify an External Data Provider Status Whether the provider is active, suspended by server, or suspended by
operator Polling Locations Total number of active polling locations on the provider, or the number of
polling locations that are suspended out of the total number configured Requests Queued Total number of requests waiting for activation from the provider Requests In-Process Total number of requests that are active and not suspended from the provider Granules Queued Total number and volume (in MB) of granules waiting for activation in
requests from the provider Granules In-Process Total number and volume (in MB) of granules that are active and not
suspended in requests from the provider
4.6.1-45 609-EMD-220
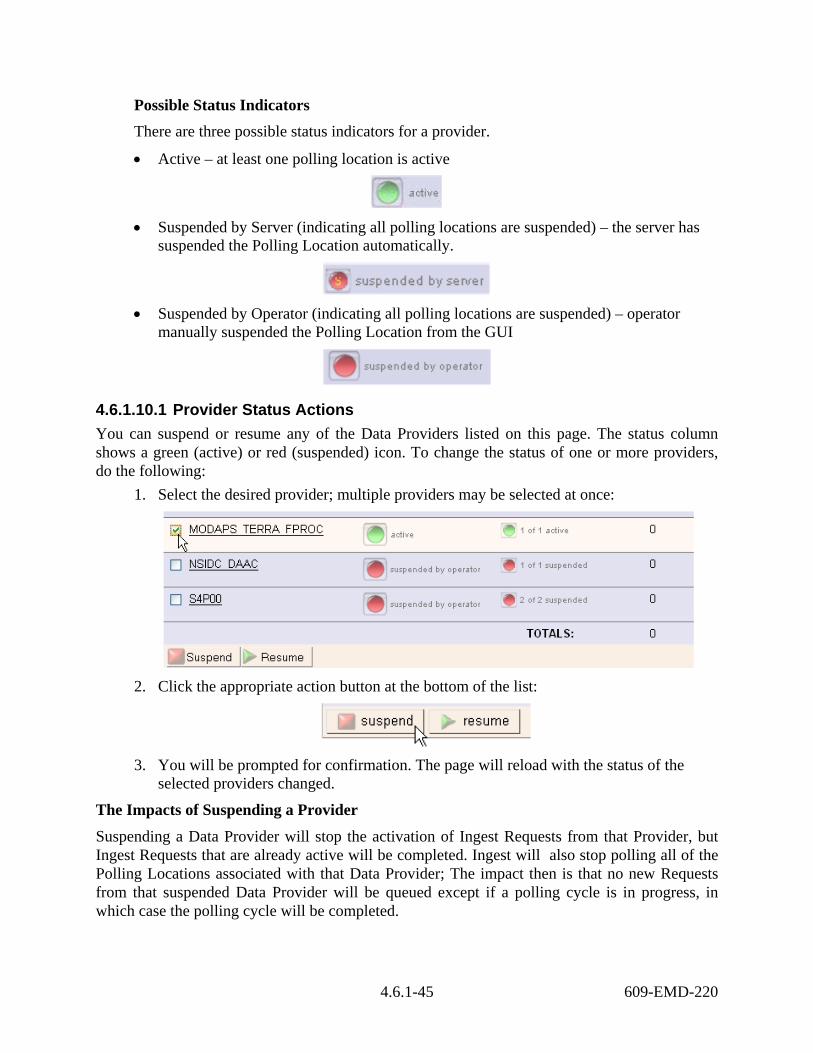
Possible Status Indicators There are three possible status indicators for a provider.
• Active – at least one polling location is active
• Suspended by Server (indicating all polling locations are suspended) – the server has
suspended the Polling Location automatically.
• Suspended by Operator (indicating all polling locations are suspended) – operator
manually suspended the Polling Location from the GUI
4.6.1.10.1 Provider Status Actions You can suspend or resume any of the Data Providers listed on this page. The status column shows a green (active) or red (suspended) icon. To change the status of one or more providers, do the following:
1. Select the desired provider; multiple providers may be selected at once:
2. Click the appropriate action button at the bottom of the list:
3. You will be prompted for confirmation. The page will reload with the status of the
selected providers changed.
The Impacts of Suspending a Provider
Suspending a Data Provider will stop the activation of Ingest Requests from that Provider, but Ingest Requests that are already active will be completed. Ingest will also stop polling all of the Polling Locations associated with that Data Provider; The impact then is that no new Requests from that suspended Data Provider will be queued except if a polling cycle is in progress, in which case the polling cycle will be completed.

4.6.1-46 609-EMD-220
4.6.1.11 Provider Status Detail The detail page of a provider shows the detail information of the Provider, the configured Notification Types, and the individual status of each polling location associated with the provider, as shown in Figure 4.6.1-51, and allows the operator to suspend or resume the Polling Locations accordingly.
Figure 4.6.1-51. Provider Status Detail Page
4.6.1.11.1 General Status This section of the Provider Status Detail page provides an overview of current processing through the provider, as shown in Figure 4.6.1-52. Table 4.6.1-14 contains the general status field descriptions for the Provider Status detail page.

4.6.1-47 609-EMD-220
Figure 4.6.1-52. General Status for a Provider
Table 4.6.1-14. Provider Status Detail Page – General Status Field Descriptions Field Name Description
Provider Unique name for this external data provider General Status Whether the provider is active, or has been suspended either manually by the
operator or automatically by the server Requests Queued Total number of requests waiting for activation from the provider, as well as
the total size of those requests Requests In-Process Total number of requests that are active and not suspended from the
provider, as well as the total size of those requests
4.6.1.11.2 Configured Notification Information Types The Provider Status detail page shows the configured notification types for a provider and its notification method, as shown in Figure 4.6.1-53, Figure 4.6.1-54, and Figure 4.6.1-55. The operator cannot suspend or resume these for an individual provider.
Figure 4.6.1-53. Notification Information
Figure 4.6.1-54. Notification Information w/ SCP active
Figure 4.6.1-55. Notification Information w/ FTP active

4.6.1-48 609-EMD-220
A Data Provider may have SCP, FTP, email, or a combination of these methods of notification. There is no status for an email notification method or for a notification method that is not enabled. If any of the methods are not used, then “No” will appear next to the notification method name. Note that operators or the Ingest Service can suspend all traffic to and from an SCP or FTP Host (e.g., if the host or the connection to the host will be taken down or is experiencing problems). In that case, notifications for a provider that use that host will be shown as suspended. Operators can suspend email notifications as a whole via the Ingest Status page (e.g., when the local e-mail service needs to be shut down for maintenance), in which case all email notifications for all providers will be shown as suspended. For more information on that functionality, see Section 4.6.1.2.2. The overall status of SCP and FTP Hosts is shown on the Transfer Host Status Page (see Section 4.6.1.13). The status of email notifications is shown on the Ingest Status Page (Section 4.6.1.2).
4.6.1.11.3 Polling Location List Each Data Provider has a list of associated Polling Locations, which are directories on SCP, FTP, or local Hosts that can be suspended or resumed. These can be suspended or resumed in order to halt or resume data to be sent through (Ingested from) these providers, without impacting the status of the Host on which that polling location resides (see Figure 4.6.1-56). To suspend or resume a polling location, check the boxes of the desired locations in the list and click the action button at the bottom of the list. You will be prompted for confirmation before the action is carried out. Table 4.6.1-15 contains the polling locations column descriptions for the provider status detail page.
Figure 4.6.1-56. Polling Location List

4.6.1-49 609-EMD-220
Table 4.6.1-15. Provider Status Detail Page – Polling Locations Column Descriptions
Field Name Description Status Whether the polling location is active, suspended by server, or suspended by
operator Source Polling Path Full path of directory being polled Host Type Method being used for polling – Local, FTP, or SCP Host Name Label assigned to the host on which the polling location is found Host Status Whether the host where the polling location is found is active or suspended.
The polling location itself can be suspended, but this does not affect the state of the host.
Address IP address or DNS name where the polling directory can be found
4.6.1.12 File System Status This page displays the status of each of the Archive File Systems and Data Pool File Systems, as shown in Figure 4.6.1-57. Table 4.6.1-16 contains the file systems status page column descriptions.

4.6.1-50 609-EMD-220
Figure 4.6.1-57. File System Status Page Screen Shot
Table 4.6.1-16. File System Status Page Column Descriptions (1 of 2) Field Name Description
Name Unique name assigned to the file system and the directory where the file system is found
Status Whether the file system is active, suspended by operator, or suspended by server
Free Space The amount of free space (in GB) on the File System. Used Space Percentage of space used on the file system and the time this
information was last checked Cache Used Alert Threshold The percentage of used space in the cache at which point an alert
would be raised for the Archive or Data Pool File System. For example, if the threshold was set to 80%, an alert would be raised as soon as more than 80% of the cache was used. No requests or file systems will be suspended as a result of this threshold being reached

4.6.1-51 609-EMD-220
Table 4.6.1-16. File System Status Page Column Descriptions (2 of 2) Field Name Description
Cache Used Suspend Threshold Archive File Systems only
The percentage of used space in the cache at which point the Archive or Data Pool File System would be suspended. For example, if the threshold was set to 90%, the Archive File System would be suspended as soon as more than 90% of the cache was used
Queued Granules Total granules waiting for activation set to ingest on the file system and the sum of the size of those granules
Processing Granules Total granules active set to ingest on the file system and the sum of the size of those granules
Actions on this page:
As with other pages that display services or providers, each of these archive file systems can also be suspended or resumed. The status column shows a green (active) or red (suspended, either by operator or server) icon. To change the status of one or more file systems, do the following:
1. Select the desired Data Pool File System or Archive File System (multiple selections may be made):
2. Click the desired action button at the bottom of the list
3. You will be prompted for confirmation. The page will reload with the status of the selected archives changed.
4. The application will not allow the same action to be taken twice on an Archive File System. For example, an already active status can not be resumed. However, an Archive File system that was suspended by the server may be manually suspended by the operator.
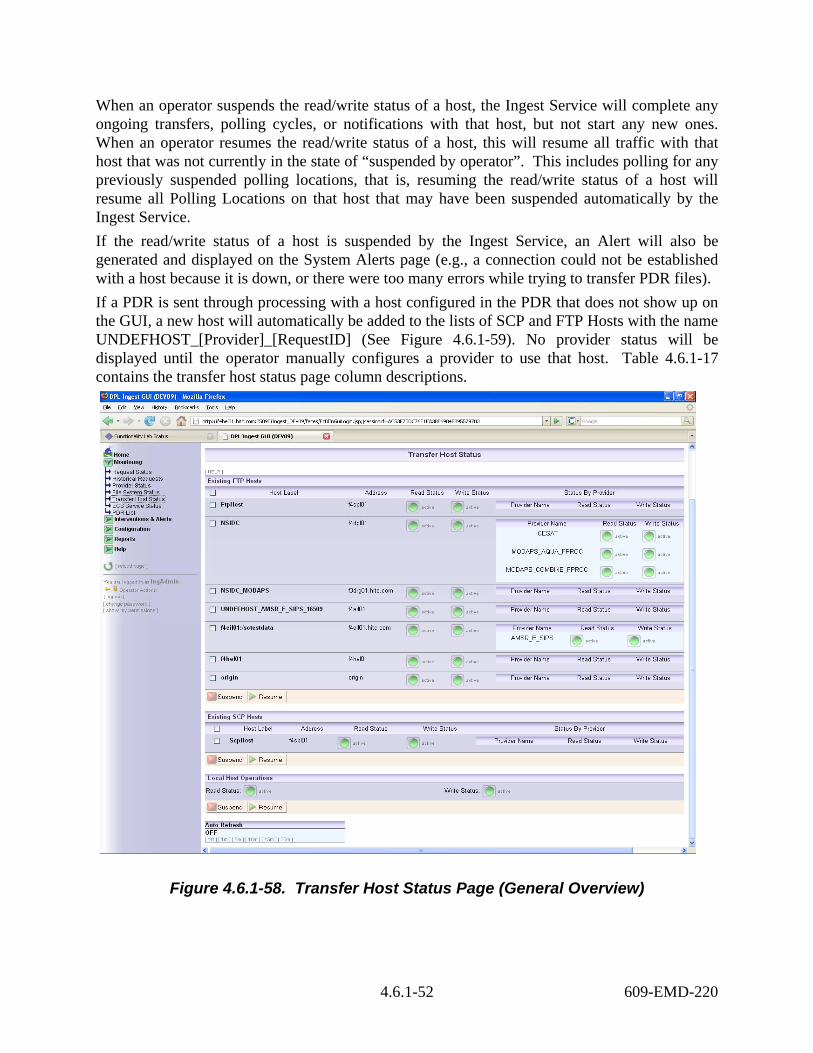
4.6.1.13 Transfer Host Status The Transfer Host Status page shows the status of each configured SCP and FTP host, as well as the status of Local transfers. The read/write status of each host, as well as the read/write status of the providers using that host can be manually suspended or resumed, and may have been suspended by the Ingest Service. See Figure 4.6.1-58 for a general overview.
4.6.1-52 609-EMD-220
When an operator suspends the read/write status of a host, the Ingest Service will complete any ongoing transfers, polling cycles, or notifications with that host, but not start any new ones. When an operator resumes the read/write status of a host, this will resume all traffic with that host that was not currently in the state of “suspended by operator”. This includes polling for any previously suspended polling locations, that is, resuming the read/write status of a host will resume all Polling Locations on that host that may have been suspended automatically by the Ingest Service. If the read/write status of a host is suspended by the Ingest Service, an Alert will also be generated and displayed on the System Alerts page (e.g., a connection could not be established with a host because it is down, or there were too many errors while trying to transfer PDR files). If a PDR is sent through processing with a host configured in the PDR that does not show up on the GUI, a new host will automatically be added to the lists of SCP and FTP Hosts with the name UNDEFHOST_[Provider]_[RequestID] (See Figure 4.6.1-59). No provider status will be displayed until the operator manually configures a provider to use that host. Table 4.6.1-17 contains the transfer host status page column descriptions.
Figure 4.6.1-58. Transfer Host Status Page (General Overview)

4.6.1-53 609-EMD-220
Table 4.6.1-17. Transfer Host Status Page Column Descriptions Field Name Description
Host Label Label assigned to the host on which the polling location is found Address The I.P. address or the canonical name and port number of the host Read Status Whether or not read actions (such as polling location listings) are active,
suspended by operator, or suspended by server on the host Write Status Whether or not write actions (such as transferring notifications) are active or
suspended on the host Status by Provider: Provider Name
Name of a provider with a polling location configured on the host (can not be changed on this page)
Status by Provider: Read Status
Whether or not read actions are active or suspended for a specific provider (can not be changed on this page)
Status by Provider: Write Status
Whether or not write actions are active or suspended for a specific provider (can not be changed on this page)
Actions on this page:
Each of the SCP/FTP hosts, as well as Local Host Operations, can be suspended or resumed. The status columns show a green (active) or red (suspended by server or operator) icon and indicate which operations (read, write, or both) are suspended. The read and write status is also displayed for each provider with a polling location or notification method configured to the host. To change the status of one or more hosts, do the following:
1. Select the desired host; multiple selections may be made
2. Click the Suspend or Resume button at the bottom of the list, as shown in Figure 4.6.1-59. You will be prompted for confirmation. The page will reload with the status of the selected hosts changed.
3. Both read and write status will be suspended as a result of suspending the host. Polling will stop on polling locations that use this host for transfers. No notifications will be sent to the host until it is resumed, at which time all notifications halted during the suspension will be sent.
Figure 4.6.1-59. Suspending an FTP or SCP Host
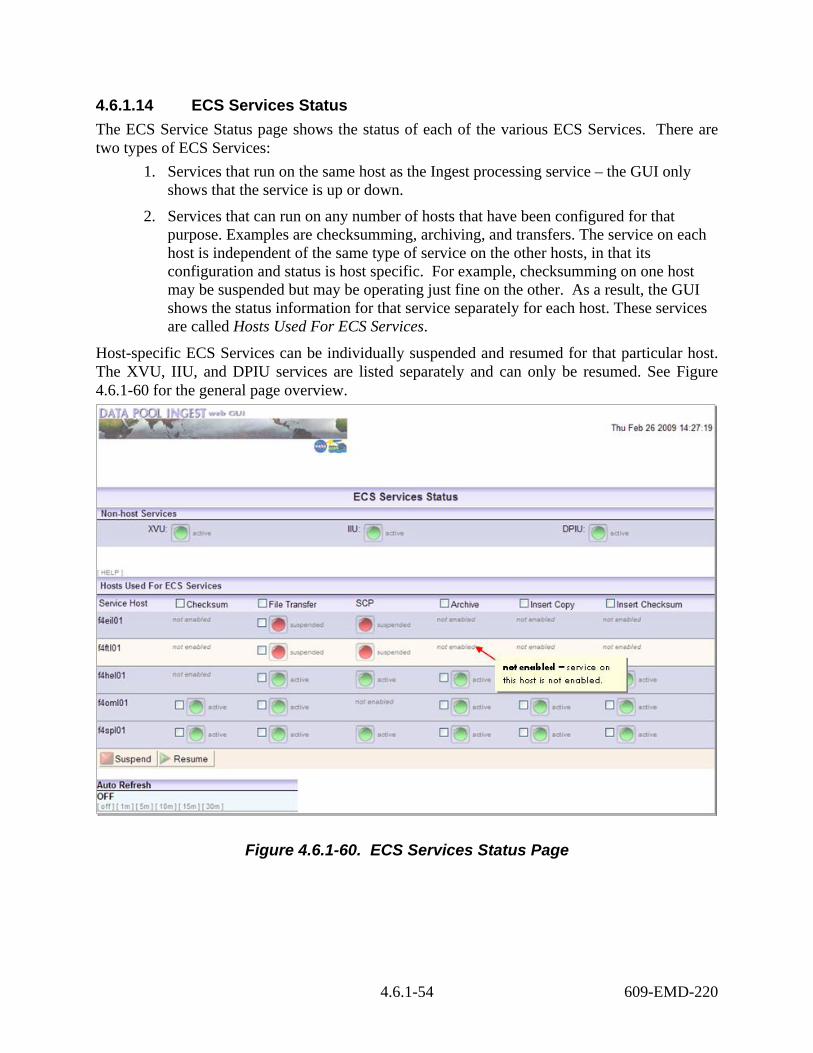
4.6.1-54 609-EMD-220
4.6.1.14 ECS Services Status The ECS Service Status page shows the status of each of the various ECS Services. There are two types of ECS Services:
1. Services that run on the same host as the Ingest processing service – the GUI only shows that the service is up or down.
2. Services that can run on any number of hosts that have been configured for that purpose. Examples are checksumming, archiving, and transfers. The service on each host is independent of the same type of service on the other hosts, in that its configuration and status is host specific. For example, checksumming on one host may be suspended but may be operating just fine on the other. As a result, the GUI shows the status information for that service separately for each host. These services are called Hosts Used For ECS Services.
Host-specific ECS Services can be individually suspended and resumed for that particular host. The XVU, IIU, and DPIU services are listed separately and can only be resumed. See Figure 4.6.1-60 for the general page overview.
Figure 4.6.1-60. ECS Services Status Page
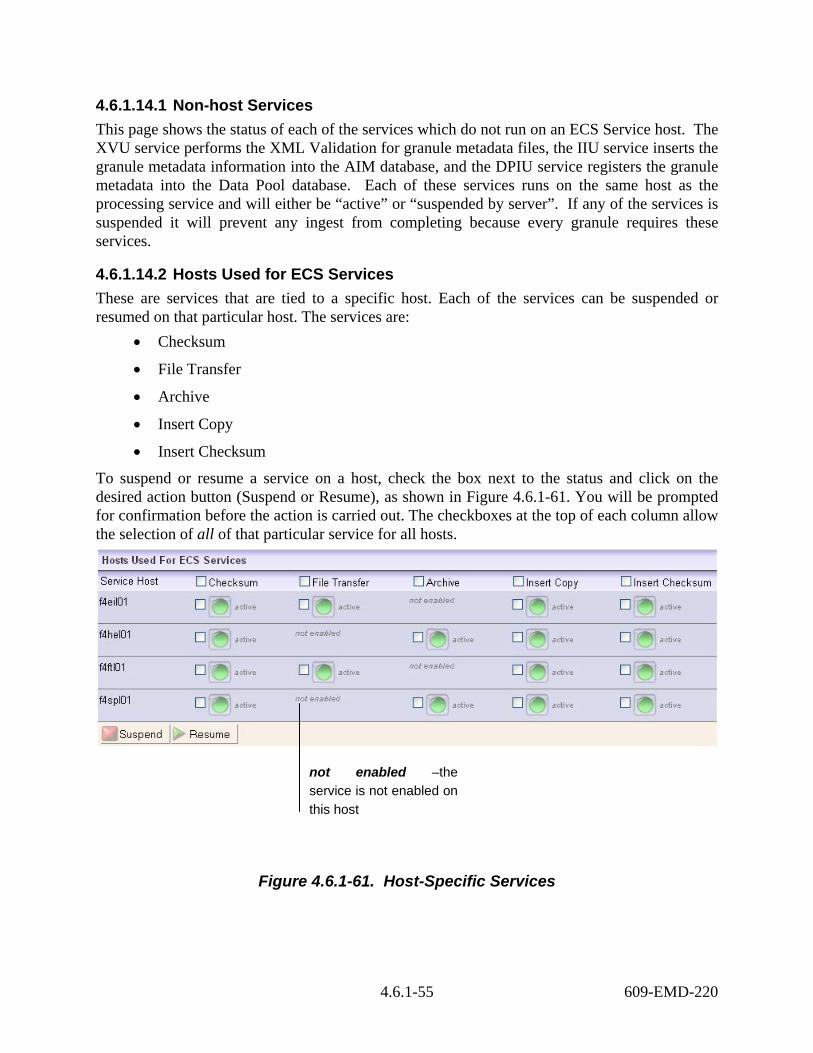
4.6.1-55 609-EMD-220
4.6.1.14.1 Non-host Services This page shows the status of each of the services which do not run on an ECS Service host. The XVU service performs the XML Validation for granule metadata files, the IIU service inserts the granule metadata information into the AIM database, and the DPIU service registers the granule metadata into the Data Pool database. Each of these services runs on the same host as the processing service and will either be “active” or “suspended by server”. If any of the services is suspended it will prevent any ingest from completing because every granule requires these services.
4.6.1.14.2 Hosts Used for ECS Services These are services that are tied to a specific host. Each of the services can be suspended or resumed on that particular host. The services are:
• Checksum
• File Transfer
• Archive
• Insert Copy
• Insert Checksum
To suspend or resume a service on a host, check the box next to the status and click on the desired action button (Suspend or Resume), as shown in Figure 4.6.1-61. You will be prompted for confirmation before the action is carried out. The checkboxes at the top of each column allow the selection of all of that particular service for all hosts.
Figure 4.6.1-61. Host-Specific Services
not enabled –the service is not enabled on this host

4.6.1-56 609-EMD-220
Suspending a service on a host will let all service operations of that type that are currently executing on that host complete on that host, but no new requests for that service will be dispatched to that host. For example, if the Checksum service is suspended for HOST_A, ongoing check summing operations will complete, but then no more check summing operations will be dispatched on that host (regardless of the type of checksum involved). Checksum on other active hosts will continue. Table 4.6.1-18 contains the field descriptions for hosts used for ECS services. As a rule, checksum operations must take place on a different host that the one on which a granule was transferred. If all but one checksum host is suspended, all granules transferred on that same host will go into a suspended state until another checksum host is activated.
Table 4.6.1-18. Field Descriptions for Hosts Used for ECS Services Field Name
Description
Service Host
The label of the host used for the ECS Services
Checksum The status of the Checksum Service File Transfer
The status of the File Transfer Service
Archive The status of the Archive Service Insert Copy The status of the Insert Copy Service Insert Checksum
The status of the Insert Checksum Service
Note that for all of these services, not enabled may appear as the status; this indicates that the service has not been enabled for that host in the ECS Services Configuration page, therefore no real status exists for that service.
4.6.1.15 PDR List The PDR List page shows the PDR information retrieved from the Ingest database. The PDR information is shown in Figure 4.6.1.62) with the first column listing the polling location for the PDR and the second column listing the PDR file name. There is a check box displayed for each of the PDRs listed in the table. By checking the box and applying the Ingest Selected PDRS Again button at the bottom, the corresponding PDR will be re-ingested.
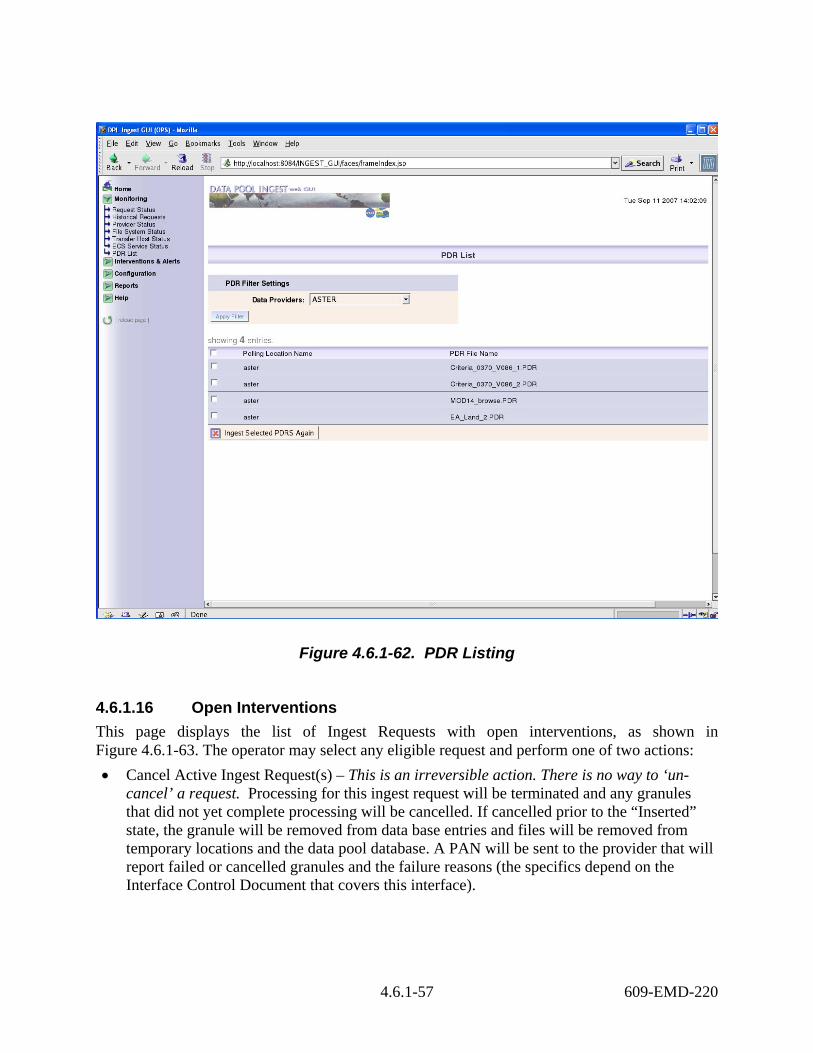
4.6.1-57 609-EMD-220
Figure 4.6.1-62. PDR Listing
4.6.1.16 Open Interventions This page displays the list of Ingest Requests with open interventions, as shown in Figure 4.6.1-63. The operator may select any eligible request and perform one of two actions: • Cancel Active Ingest Request(s) – This is an irreversible action. There is no way to ‘un-
cancel’ a request. Processing for this ingest request will be terminated and any granules that did not yet complete processing will be cancelled. If cancelled prior to the “Inserted” state, the granule will be removed from data base entries and files will be removed from temporary locations and the data pool database. A PAN will be sent to the provider that will report failed or cancelled granules and the failure reasons (the specifics depend on the Interface Control Document that covers this interface).

4.6.1-58 609-EMD-220
• Resume Active Ingest Request(s) – only if the selected requests are suspended. Cancelled Requests can not be resumed. Resuming a request will resume processing for all granules that are currently suspended, restarting each from the last known good state. To disposition individual granules differently, the operator needs to access the intervention detail page. Table 4.6.1-19 contains the descriptions of the open interventions listing page column.
Figure 4.6.1-63. Open Interventions Listing (General Overview)
Table 4.6.1-19. Open Interventions Listing Page Column Descriptions Field Name Description
Request ID Unique Data Pool Ingest identifier assigned to the request in intervention
Provider Name of the provider from which the request was obtained Intervention Type Type of error encountered during processing of at least one of the
request granules (if there are multiple error types encountered in a single request, the type will be “MULTIPLE”)
Worker Name of a worker assigned to address the intervention When Created Time the intervention was generated (which may have been after
several retries after the error was first encountered) When Acknowledged Time the intervention was first viewed by an operator

4.6.1-59 609-EMD-220
The information on this page is similar to the Request Status page (see Section 4.6.1.6). To view intervention details, click on the Request ID link to open the intervention detail page.
4.6.1.17 Request Actions Changing Request Statuses
A request is suspended and goes into Operator Intervention Status when at the completion of its processing; at least one of its granules is suspended because it ran into some error. Note that operators can disposition suspended granules before the request goes into intervention, as explained in Section 4.6.1.7.5 . As a result, when a request goes into intervention, some granules may already be in a failed state (if they have been failed by the operator before). From this page, one can resume suspended requests regardless of the failures. Otherwise, the operator can view the suspended granules of the request and disposition them individually. See the Intervention Detail section below (4.6.1.16) for more details on how Interventions are processed. To perform a request action, select the desired requests by checking the boxes on the left side of the request list. You can also select or deselect all the requests by checking the box at the very top of the list. See Figure 4.6.1-64.
Figure 4.6.1-64. Selecting a Request for Action
Then click on the button of the desired action at the bottom of the list. A box will appear below to enter a reason for the status change. See Figure 4.6.1-65.
Figure 4.6.1-65. Explanation Field for Changing Request Status
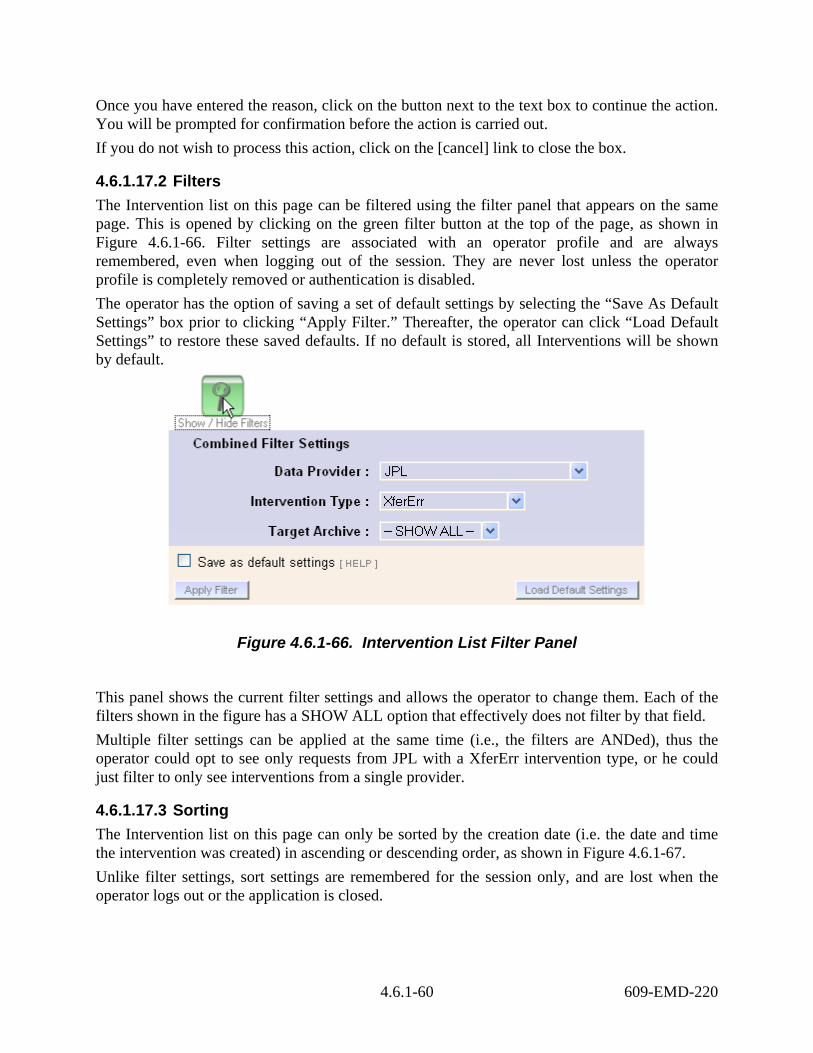
4.6.1-60 609-EMD-220
Once you have entered the reason, click on the button next to the text box to continue the action. You will be prompted for confirmation before the action is carried out. If you do not wish to process this action, click on the [cancel] link to close the box.
4.6.1.17.2 Filters The Intervention list on this page can be filtered using the filter panel that appears on the same page. This is opened by clicking on the green filter button at the top of the page, as shown in Figure 4.6.1-66. Filter settings are associated with an operator profile and are always remembered, even when logging out of the session. They are never lost unless the operator profile is completely removed or authentication is disabled. The operator has the option of saving a set of default settings by selecting the “Save As Default Settings” box prior to clicking “Apply Filter.” Thereafter, the operator can click “Load Default Settings” to restore these saved defaults. If no default is stored, all Interventions will be shown by default.
Figure 4.6.1-66. Intervention List Filter Panel
This panel shows the current filter settings and allows the operator to change them. Each of the filters shown in the figure has a SHOW ALL option that effectively does not filter by that field. Multiple filter settings can be applied at the same time (i.e., the filters are ANDed), thus the operator could opt to see only requests from JPL with a XferErr intervention type, or he could just filter to only see interventions from a single provider.
4.6.1.17.3 Sorting The Intervention list on this page can only be sorted by the creation date (i.e. the date and time the intervention was created) in ascending or descending order, as shown in Figure 4.6.1-67. Unlike filter settings, sort settings are remembered for the session only, and are lost when the operator logs out or the application is closed.

4.6.1-61 609-EMD-220
Figure 4.6.1-67. Intervention List Sorts
4.6.1.17.4 Intervention Related Configuration Panel In addition to being displayed on the Data Pool Ingest GUI, interventions can also be sent as email to a specified operator email address. To set the email address and permit email notification of Interventions, enter an address next to the “NOTIF_INTERV_EMAIL_ADDRESS” parameter, check the box next to the “SEND_INTERVENTION_EMAILS” parameter, and click the “Apply Changes” button, displayed at the bottom of the “Intervention Related Configuration” section, as shown in Figure 4.6.1-68.
Figure 4.6.1-68. Intervention Related Configuration Panel
The configured email address will receive notifications for all interventions as they are opened.
4.6.1.18 Open Intervention Detail Page This page displays all of the information as in the general open intervention listing, as well as the granule list. In addition, actions may be taken for the intervention on this page. This page is shown in Figure 4.6.1-69.
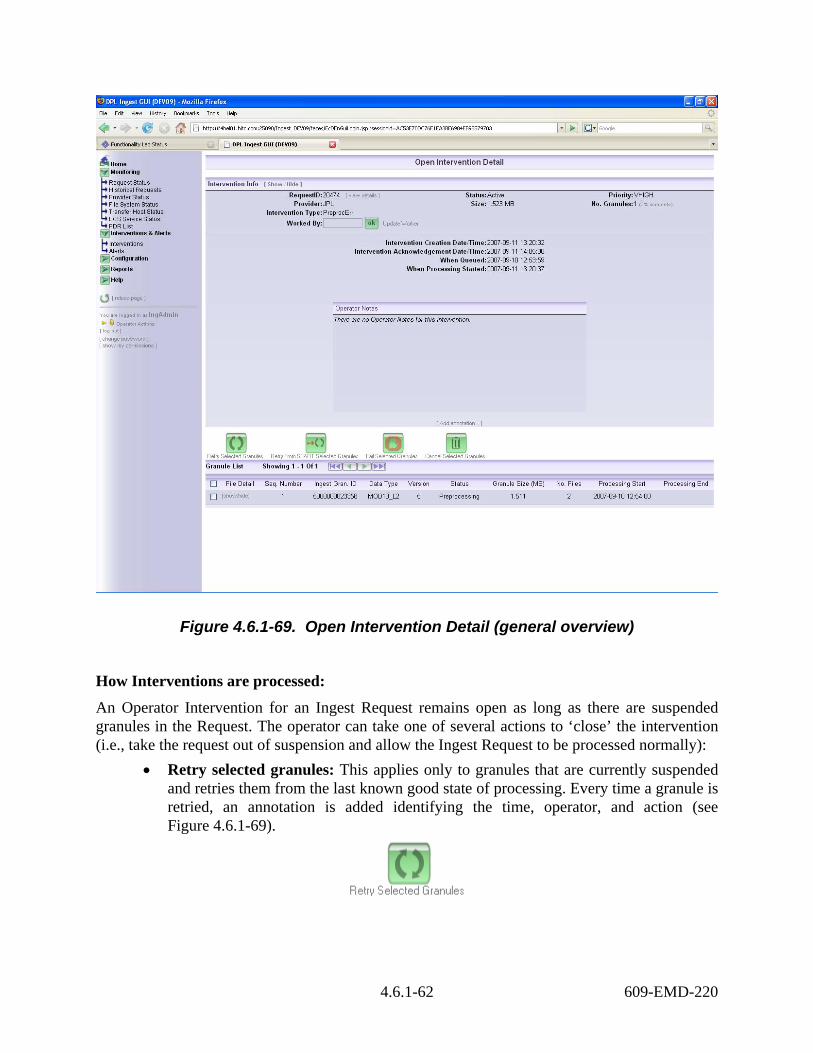
4.6.1-62 609-EMD-220
Figure 4.6.1-69. Open Intervention Detail (general overview)
How Interventions are processed:
An Operator Intervention for an Ingest Request remains open as long as there are suspended granules in the Request. The operator can take one of several actions to ‘close’ the intervention (i.e., take the request out of suspension and allow the Ingest Request to be processed normally):
• Retry selected granules: This applies only to granules that are currently suspended and retries them from the last known good state of processing. Every time a granule is retried, an annotation is added identifying the time, operator, and action (see Figure 4.6.1-69).

4.6.1-63 609-EMD-220
• Retry from START selected granules: This applies only to granules that are currently suspended and retries them from the beginning of processing. Every time a granule is retried, an annotation is added identifying the time, operator, and action.
• Fail selected granules: This applies only to granules that are currently suspended and
transitions the granule into a failed state, with the status indicating the type of error that originally caused the suspensions.
Error types are determined by what state the granule is in when it is failed. These states are: XferErr (transferring), ChecksumErr (Checksumming), PreprocErr (Preprocessing), ArchErr (Archiving), InsertErr (Inserting), and PubErr (Publishing).
NOTE: After a granule is failed, an annotation is added identifying the time, operator, and action.
To perform a granule action, select one or more granules and click on the desired action button at the top of the granule list. The operator will be asked for confirmation before the action is carried out.
• Cancel selected granules: This applies only to granules that are not yet in a terminal
state. It manually cancels the granules. After a granule is cancelled it is expected that the granule will be re-ingested by the operator
Working on an Intervention The operator must have Ingest Control permission to perform any actions on this page. A worker name is not explicitly required on this page because the logged-in operator name will be used by default. However, an operator may override this by entering a different name into the “worked by” text box. This is allowed because more than one operator may be using the same login during a session, though this practice is not recommended if authentication is enabled.

4.6.1-64 609-EMD-220
Closing the Intervention Once all granule issues have been resolved, the open intervention status will automatically be removed. No explicit action on the part of the operator is required to do this. If an open intervention is not resolved after being viewed, it will remain in the open intervention list and can be worked on at any time after navigating to a different page or even logging out of the session. Viewing Request Details: The operator can navigate to the details for a request by pressing the “[view details]” link next to the Request ID in the upper left-hand corner of the page, as shown in Figure 4.6.1-70. More information on the Request Details page can be found in Section 4.6.1.7.
Figure 4.6.1-70. Viewing Request Details from Intervention Details
Information on this page:
Figure 4.6.1-71 explains the various features and information available on this page. The second part of the page, the granule panel, is described in the subsection 4.6.1.18.2.

4.6.1-65 609-EMD-220
Figure 4.6.1-71. Intervention Detail: Request Information Panel Diagram
4.6.1.18.1 Operator Notes This section shows operator notes added by the operator. Operator notes are annotations that can be useful in tracking changes to the request or recording information affecting the intervention. The operator notes are kept separately from the request notes (see Section 4.6.1.7.4), though they will be appended to request notes after the intervention is closed. An operator note can be added, but not edited or deleted. To add an operator note, click [Add annotation…] at the bottom of the annotation list, as shown in Figure 4.6.1-72.
The worker for this intervention can be
changed If no name is filled in the
Click the [view details] link
to go directly to the request
Operator Notes are shown and can be added
here. Each time one is added, a time stamp is
shown, along with the name of the operator
who added the annotation.
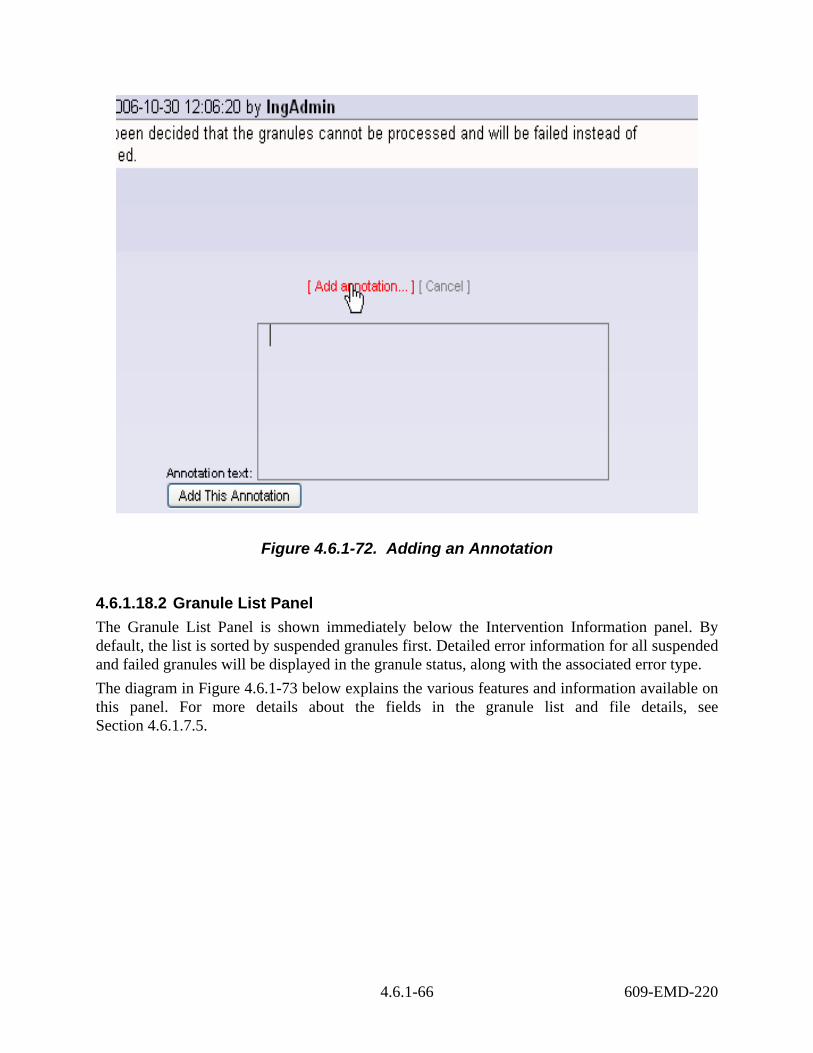
4.6.1-66 609-EMD-220
Figure 4.6.1-72. Adding an Annotation
4.6.1.18.2 Granule List Panel The Granule List Panel is shown immediately below the Intervention Information panel. By default, the list is sorted by suspended granules first. Detailed error information for all suspended and failed granules will be displayed in the granule status, along with the associated error type. The diagram in Figure 4.6.1-73 below explains the various features and information available on this panel. For more details about the fields in the granule list and file details, see Section 4.6.1.7.5.

4.6.1-67 609-EMD-220
Figure 4.6.1-73. Intervention Detail: Granule List Diagram
4.6.1.18.2.1 Granule Details Each granule has detailed file information that can be viewed directly on this screen by clicking the [show / hide] button next to a granule. The information will appear above the granule list in sections identified by the Granule Id. The information includes for each file, the full path, file name, file type associated with the granule, and the file status, as shown in Figure 4.6.1-74.
Navigation toolbar.
Checkboxes to select granules that have not reached terminal states for actions. The top checkbox selects/deselects all granules in the list.
Click here to view the detailed information for the granule.
Detailed error information
Action buttons to retry, retry from start, fail, or cancel selected granules.

4.6.1-68 609-EMD-220
Figure 4.6.1-74. Granule Details
The information can be hid by clicking [show / hide] beside the granule.
4.6.1.19 Alerts This page (Figure 4.6.1-75) displays the Ingest alerts as they are raised in the Ingest database. These warn the operator when the Ingest Service runs into a problem that is with a resource or service it is using. Alerts will usually only be generated after a configured number of retries on the failed action, or after a configured number of occurrences of a particular error. After raising an alert, the Ingest Service will check at regular intervals whether the problem has been resolved and clear the alert if that is the case. Table 4.6.1-20 contains the alerts page column descriptions.
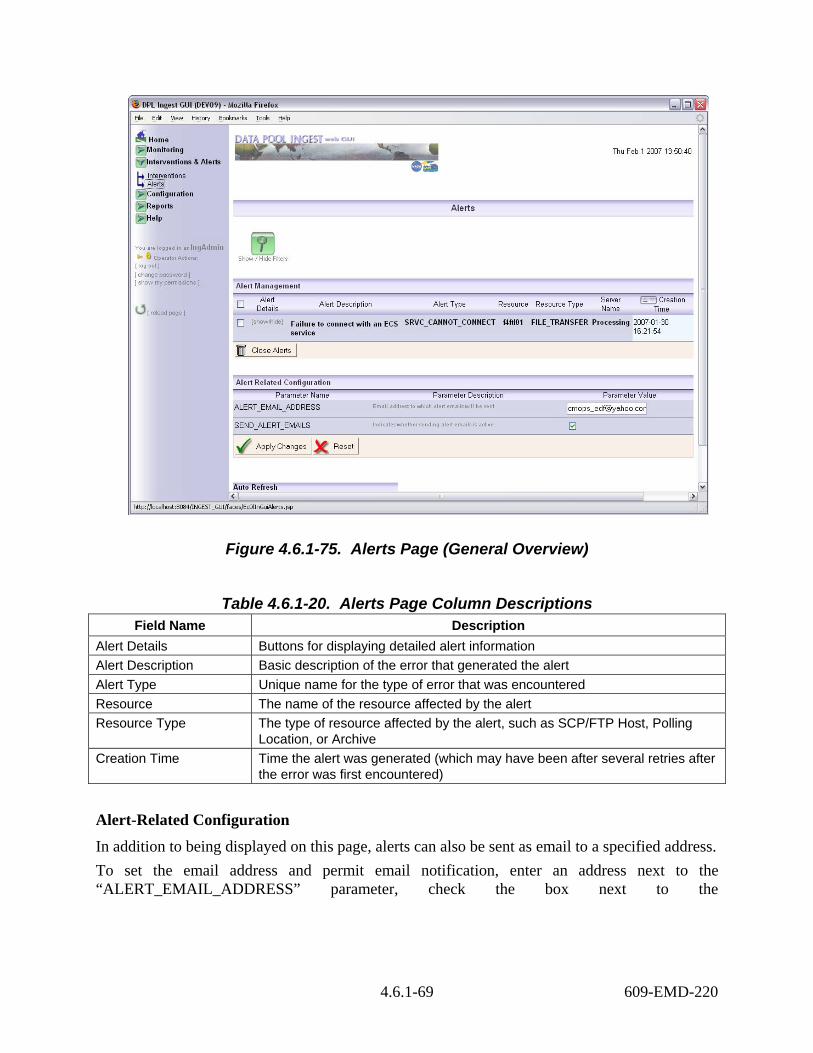
4.6.1-69 609-EMD-220
Figure 4.6.1-75. Alerts Page (General Overview)
Table 4.6.1-20. Alerts Page Column Descriptions Field Name Description
Alert Details Buttons for displaying detailed alert information Alert Description Basic description of the error that generated the alert Alert Type Unique name for the type of error that was encountered Resource The name of the resource affected by the alert Resource Type The type of resource affected by the alert, such as SCP/FTP Host, Polling
Location, or Archive Creation Time Time the alert was generated (which may have been after several retries after
the error was first encountered)
Alert-Related Configuration
In addition to being displayed on this page, alerts can also be sent as email to a specified address. To set the email address and permit email notification, enter an address next to the “ALERT_EMAIL_ADDRESS” parameter, check the box next to the
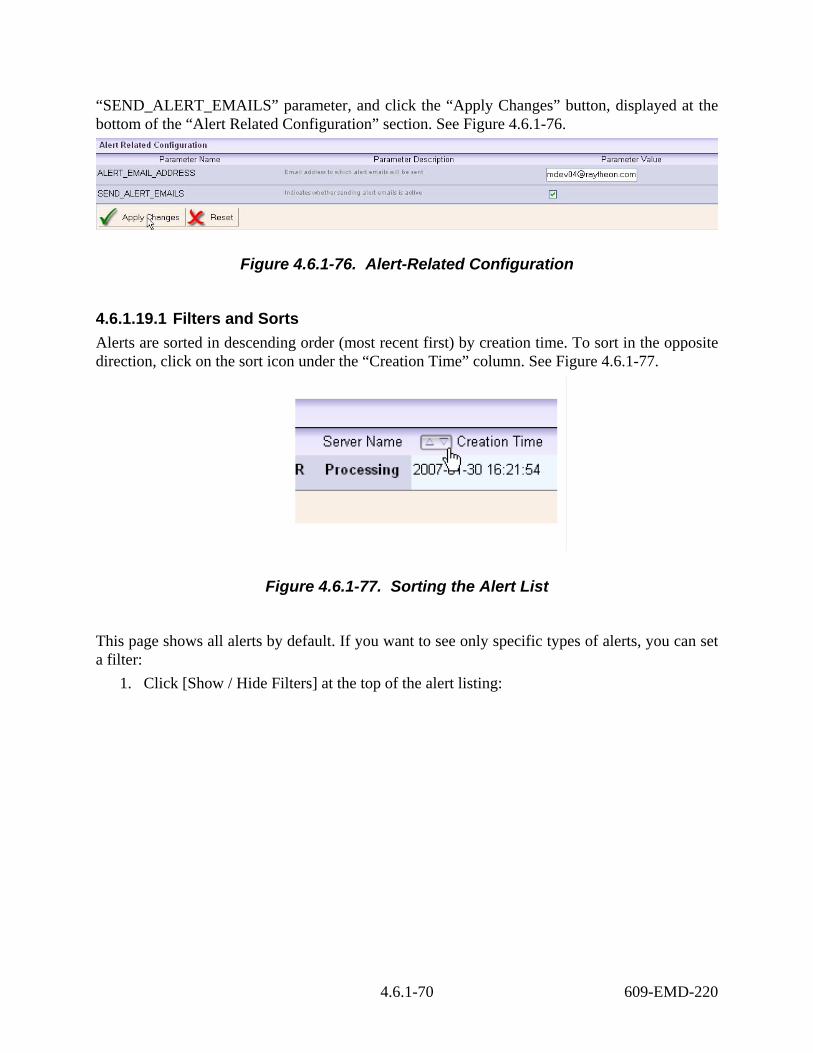
4.6.1-70 609-EMD-220
“SEND_ALERT_EMAILS” parameter, and click the “Apply Changes” button, displayed at the bottom of the “Alert Related Configuration” section. See Figure 4.6.1-76.
Figure 4.6.1-76. Alert-Related Configuration
4.6.1.19.1 Filters and Sorts Alerts are sorted in descending order (most recent first) by creation time. To sort in the opposite direction, click on the sort icon under the “Creation Time” column. See Figure 4.6.1-77.
Figure 4.6.1-77. Sorting the Alert List
This page shows all alerts by default. If you want to see only specific types of alerts, you can set a filter:
1. Click [Show / Hide Filters] at the top of the alert listing:

4.6.1-71 609-EMD-220
2. Click “Apply Filter” to apply the filter:
3. The page will reload; only alerts matching the filter criteria will be shown.
Note that these filters combined (ANDed). Also, each of the drop down lists has a SHOW ALL option, allowing all Alerts for that particular field to be shown.
4.6.1.19.2 Alert Details The details of the alert will appear under the alert description (a new page will not be loaded). To view this detailed information, click [show / hide] under the Alert Details column to expand the detail area:
Click [show / hide] again to hide the details. If the Resource Type for the Alert is an archive or file system, the alert details will show the Data Providers affected by the alert condition, as well as the number of PDRs, ingest granules, total queued data, and total in-process data affected. See Table 4.6.1-21.

4.6.1-72 609-EMD-220
Table 4.6.1-21. Alert Description Details Field Descriptions Row Name Description
Symptom Information about the specific action or item that caused the alert Impact The resource affected by the Alert (if applicable). An example of an
impacted resource would be an SCp or FTP Transfer Host. This field is only shown if the Alert could potentially impact a Resource. Otherwise, for Alerts like “Email Notification is down” or “Login failure for PAN/PDRD transfers”, this field is not shown.
Data Providers affected List of providers that will be suspended as a result of the alert. This is only shown if Data Providers could potentially be affected, for example if connection to a Transfer Host could not be established.
Number of PDRs Total number of PDRs active or queued on a provider affected by the suspended resource. This is only shown if the Alert affects Ingest Requests.
Number of granules Total number of granules active or queued on a provider affected by the suspended resource. This is only shown if the Alert affects Ingest Requests.
Total amount of data queued Sum of the size of the files in the granules that require the file system and will not be activated while it is suspended. This is only shown if the Alert affects Ingest Requests.
Total amount of data processing Sum of the size of the files in the granules that require the file system, but will get “stuck” in an active state as a result of the alert. This is only shown if the Alert affects Ingest Requests.
4.6.1.19.3 Clearing an Alert An alert may be cleared manually at any time, though this should only be done once the operator is certain the problem has been resolved. In response, the Ingest Service will resume using that resource and all the associated resources, for example, the FTP Host to which it could not connect and all the polling locations on that host. The Ingest Service may find that it is still unable to use the resource (e.g., still cannot connect), in which case the alert will be raised again. It is not necessary for an operator to clear an alert manually. Normally, the Ingest Service will test in regular intervals whether the error situation has been resolved and if so, clear the alert automatically. However, it may be appropriate to clear an alert manually, for example, if the operator took some manual steps to resolve the reported problem (such as restarting an ECS Host) and then wants the Ingest Service to try using that resource immediately. To clear an alert from the list manually, do the following:
1. Select the desired alerts from the list by checking the boxes on the line for the Alerts; multiple selections may be made:

4.6.1-73 609-EMD-220
2. Click the “close alerts” icon at the bottom of the alert list. You will be prompted to confirm the clearing of the alert(s):
3. The page will be reloaded with the selected alerts no longer appearing on the list.
4.6.1.20 Provider Configuration Page This page lists all of the Data Providers for the DPL Ingest System, along with selected attributes of each to get a general overview of each provider. From this list, the operator may also add or remove a Data Provider. By clicking on the provider name, the operator may also view the Provider details. This page is shown in Figure 4.6.1-78. Explanations of the fields on this page are found in Table 4.6.1-22.
Figure 4.6.1-78. Provider Configuration Page (General Overview)
4.6.1.20.1 Edit a Provider Page The “Edit a Provider” page shows all of the settings for a data provider, including the notification method and the polling locations, as shown in Figure 4.6.1-79. This page is displayed when the operator clicks the provider name on the Provider Configuration List page (previous section).

4.6.1-74 609-EMD-220
Note: Trailing and leading white space will be removed from values entered into any text fields on this page, or any of the sub pages under it. Table 4.6.1-22 contains the provider configuration detail field descriptions.
Figure 4.6.1-79. Provider Configuration Detail (General Overview)
Table 4.6.1-22. Provider Configuration Detail Field Descriptions (1 of 2) Field Name Entry Description
Name Required Name for an external data provider ProviderType Required Indicates the type of the provider (such as Polling with DR,
Polling without DR, EDOS) Checksum Mandatory Optional Indicates that the Data Provider must provide checksum
information in the PDR. % Files to Checksum Required Percent of requests to checksum for this provider Default Priority Required Default priority for ingest requests for this provider Preprocessing Type Required Type of ingest processing to occur (such as SIPS or
DDIST) Max Active Data Volume
Required Maximum total volume that will be active on a provider if requests for other providers are pending
Max Active Granules Required Maximum total granules that will be active on a provider if requests for other providers are pending

4.6.1-75 609-EMD-220
Table 4.6.1-22. Provider Configuration Detail Field Descriptions (2 of 2) Field Name Entry Description
Transfer Type Required Method used for obtaining files from the external data provider (local, FTP, or SCP with various cipher types)
Notification Method Required Method for providing notifications to the provider (email, SCP, FTP, or combination of SCP/FTP and email)
Email Address Required if email is the notification method
Address to which to send notifications after a granule on the provider completes ingest
Write Login User ID Required if FTP or SCP is the notification method
User Id for getting write permissions on the provider’s notification directory
Write Info: Password Required if FTP or SCP is the notification method
Checkbox displays a password and verify password field that are used to provide access to the provider’s notification directory
Path Required if FTP or SCP is the notification method
Directory where notifications will be sent on the provider
Choose Host Required if FTP or SCP is the notification method
Host where the notification path can be found (list is generated from hosts configured on the Host Configuration page)
Read Login Id Required if a polling location uses FTP or SCP
User Id for getting read permissions on the provider’s polling directories
Read Info: Edit Password
Required if a polling location uses FTP or SCP
Checkbox displays a password and verify password field that are used to provide access to the provider’s polling directories
Existing Polling Locations
A list of pre-existing polling locations is displayed at the bottom of the page. You can add or delete polling locations on this list. For instructions on how to add a Polling Location (when adding a Data Provider), see Section 4.6.1.20.3, steps 12-19. To edit a polling location, select the location name (see Figure 4.6.1-80).
Figure 4.6.1-80. Editing a Polling Location

4.6.1-76 609-EMD-220
A page will appear much like the “Add a Polling Location page,” except all the fields will be populated, as shown in Figure 4.6.1-81. Table 4.6.1-23 contains the polling location detail page field descriptions.
Figure 4.6.1-81. Polling Location Detail
Table 4.6.1-23. Polling Location Detail Page Field Descriptions Field Name Entry Description
Parent Provider Not Editable Name of the provider with which this polling location is associated
Polling Location Name Required Name used to uniquely identify the polling location Source Polling Path Required Directory that will be polled Polling Frequency Required Number of seconds the ingest service will wait between
scanning the polling path for new PDRs DPL Ingest Enabled Optional Indicates whether this polling location is enabled for
ingest via DPL Polling Method Required Transfer method used for obtaining PDRs from the
polling location Host Name Required if using a
remote transfer method
Host where the polling directory is found
Enter the desired modifications and click “Apply Changes.”

4.6.1-77 609-EMD-220
Deleting Polling Locations
To remove a polling location, click the check the box next to the location’s name; multiple selections may be made. Click “Remove Selected Polling Locations”; you will be prompted to confirm the deletion. See Figure 4.6.1-82. Under some circumstances, a Polling Location may not be able to be removed. For example, if there are pending requests with PDRs that use the Polling Location, you will see a database error if you try to remove it. In order to successfully remove a Polling Location, ensure that no requests using this Polling Location are pending and that the Processing Service has been shut down.
Figure 4.6.1-82. Polling Location List
Adding a Polling Location See Section 4.6.1.18.3 for complete details on how to add a Polling Location for a Provider.
4.6.1.20.2 Removing a Data Provider You can only remove an existing Data Provider if all of its Polling Locations have been removed. To remove a provider:
1. Select a provider by checking the box next the provider name; multiple selections may be made:
2. Click the remove button at the bottom of the list:
3. You will be prompted for confirmation. The page will reload and the selected providers
will no longer be displayed.

4.6.1-78 609-EMD-220
4.6.1.20.3 Add a Provider Page
This page enables an authorized operator to add a Data Provider and associated Polling Location. Adding a data provider involves several complex steps. Below is a step-by-step guide to the process involved in adding a provider. Note that EDOS providers have some special rules:
o A Processing Type is not allowed (it is automatically set to NONE in the GUI and is enforced when adding the Provider)
o An EDOS Provide can only use an FTP Transfer Type and an FTP Notification method. This selection is also enforced in the GUI.
The general steps are:
1. Setting the provider’s name and its configuration parameters. If you are not authorized to change configuration parameters, you cannot add a provider.
2. Selecting the notification method and configuring the attributes of each method (if more than one applies). Again, if you are not authorized to change configuration parameters, you cannot configure the notification methods. A provider may have one of the following notification methods:
a. Email only
b. SCP only
c. FTP only
d. Local only (i.e., locally transferred via NFS)
e. Email and FTP
f. Email and SCP
g. Email and Local
3. Adding a Polling Location (this involves several sub-steps – see the detailed instructions below).
Detailed illustrated instructions for adding a provider: 1. On the Provider Configuration page, Press “Add Provider” at the bottom of the existing
provider list:
2. A new page will be loaded, which will guide you through configuring the provider; it
contains a blank form to add your parameters (see Figure 4.6.1-83). Explanations of the fields on this page may be found in Table 4.6.1-22.
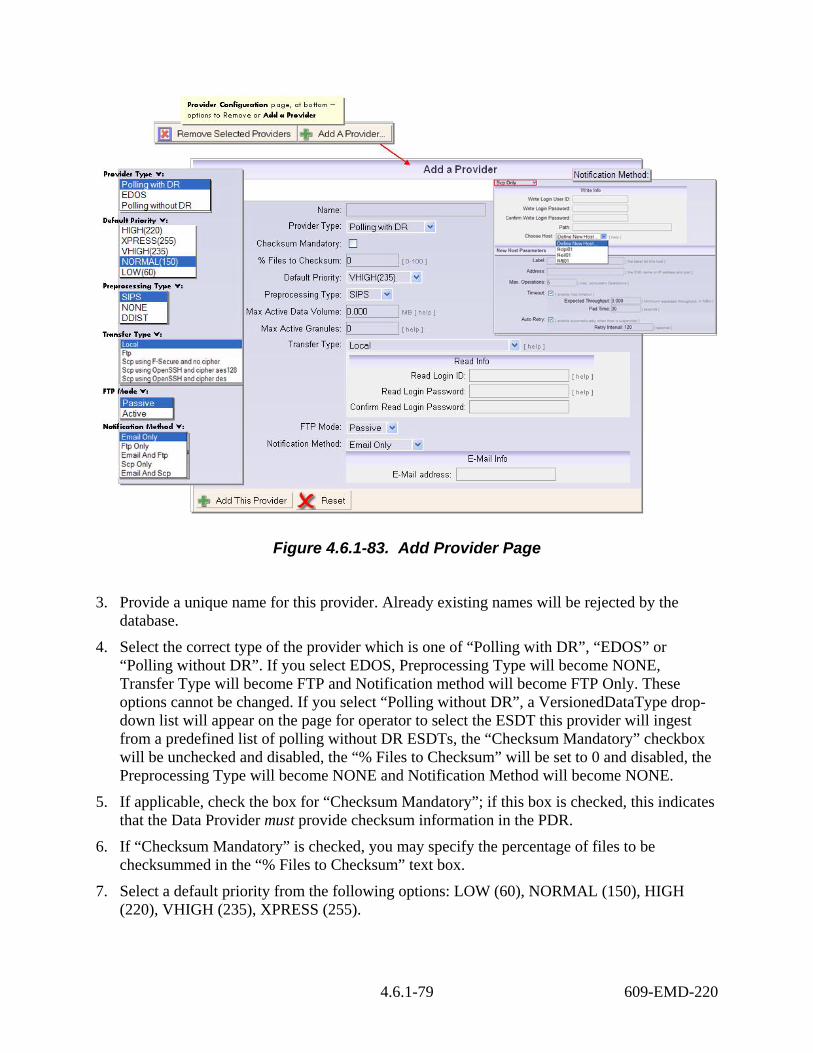
4.6.1-79 609-EMD-220
Figure 4.6.1-83. Add Provider Page
3. Provide a unique name for this provider. Already existing names will be rejected by the database.
4. Select the correct type of the provider which is one of “Polling with DR”, “EDOS” or “Polling without DR”. If you select EDOS, Preprocessing Type will become NONE, Transfer Type will become FTP and Notification method will become FTP Only. These options cannot be changed. If you select “Polling without DR”, a VersionedDataType drop-down list will appear on the page for operator to select the ESDT this provider will ingest from a predefined list of polling without DR ESDTs, the “Checksum Mandatory” checkbox will be unchecked and disabled, the “% Files to Checksum” will be set to 0 and disabled, the Preprocessing Type will become NONE and Notification Method will become NONE.
5. If applicable, check the box for “Checksum Mandatory”; if this box is checked, this indicates that the Data Provider must provide checksum information in the PDR.
6. If “Checksum Mandatory” is checked, you may specify the percentage of files to be checksummed in the “% Files to Checksum” text box.
7. Select a default priority from the following options: LOW (60), NORMAL (150), HIGH (220), VHIGH (235), XPRESS (255).
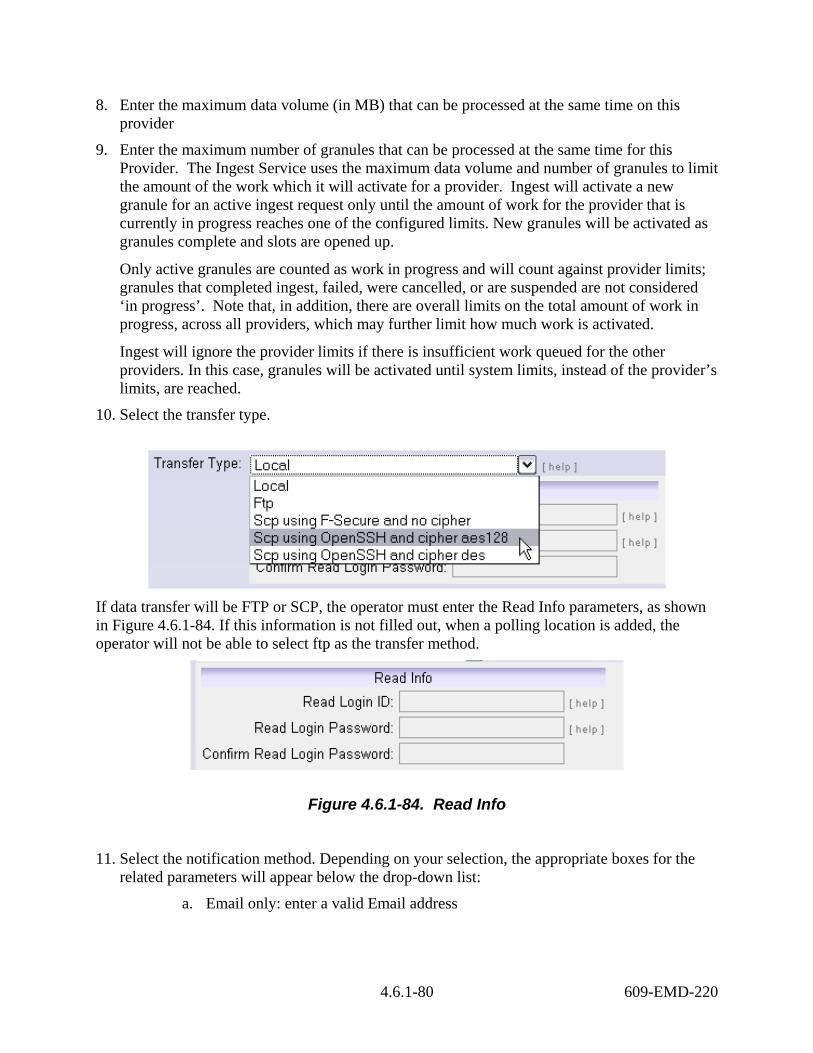
4.6.1-80 609-EMD-220
8. Enter the maximum data volume (in MB) that can be processed at the same time on this provider
9. Enter the maximum number of granules that can be processed at the same time for this Provider. The Ingest Service uses the maximum data volume and number of granules to limit the amount of the work which it will activate for a provider. Ingest will activate a new granule for an active ingest request only until the amount of work for the provider that is currently in progress reaches one of the configured limits. New granules will be activated as granules complete and slots are opened up.
Only active granules are counted as work in progress and will count against provider limits; granules that completed ingest, failed, were cancelled, or are suspended are not considered ‘in progress’. Note that, in addition, there are overall limits on the total amount of work in progress, across all providers, which may further limit how much work is activated.
Ingest will ignore the provider limits if there is insufficient work queued for the other providers. In this case, granules will be activated until system limits, instead of the provider’s limits, are reached.
10. Select the transfer type.
If data transfer will be FTP or SCP, the operator must enter the Read Info parameters, as shown in Figure 4.6.1-84. If this information is not filled out, when a polling location is added, the operator will not be able to select ftp as the transfer method.
Figure 4.6.1-84. Read Info
11. Select the notification method. Depending on your selection, the appropriate boxes for the related parameters will appear below the drop-down list:
a. Email only: enter a valid Email address

4.6.1-81 609-EMD-220
b. FTP only or SCP only (the same form shows up for either): enter the FTP or
SCP Write login information, the path, and select a host from the dropdown list (see next step).
c. Pick an existing, pre-configured FTP host as defined in the FTP Host
Configuration page; a drop-down list will appear with the available configured hosts:
When you select the desired host, an information box is displayed, showing the host’s name, IP address, and other details, as applicable to the type of host (FTP or SCP – see the figures below):

4.6.1-82 609-EMD-220
An example of an SCP host:

4.6.1-83 609-EMD-220
An example of an FTP host:
d. If you are configuring a Polling Location with Transfer Type of “local”, no path or Read Info entry is required.
e. Email and FTP, or Email and SCP: If you select this option, you must enter parameters for both the Read and the Write Info.
12. Now add this provider by clicking the “Add This Provider” button at the bottom of the screen. Note that polling locations can not be added until the provider has been added. You will be prompted to confirm the addition of a new provider.
13. You will be taken back to the Provider Configuration page. Select the new provider to view
its details. At the bottom of the Provider Detail page, click “Add a Polling Location”:
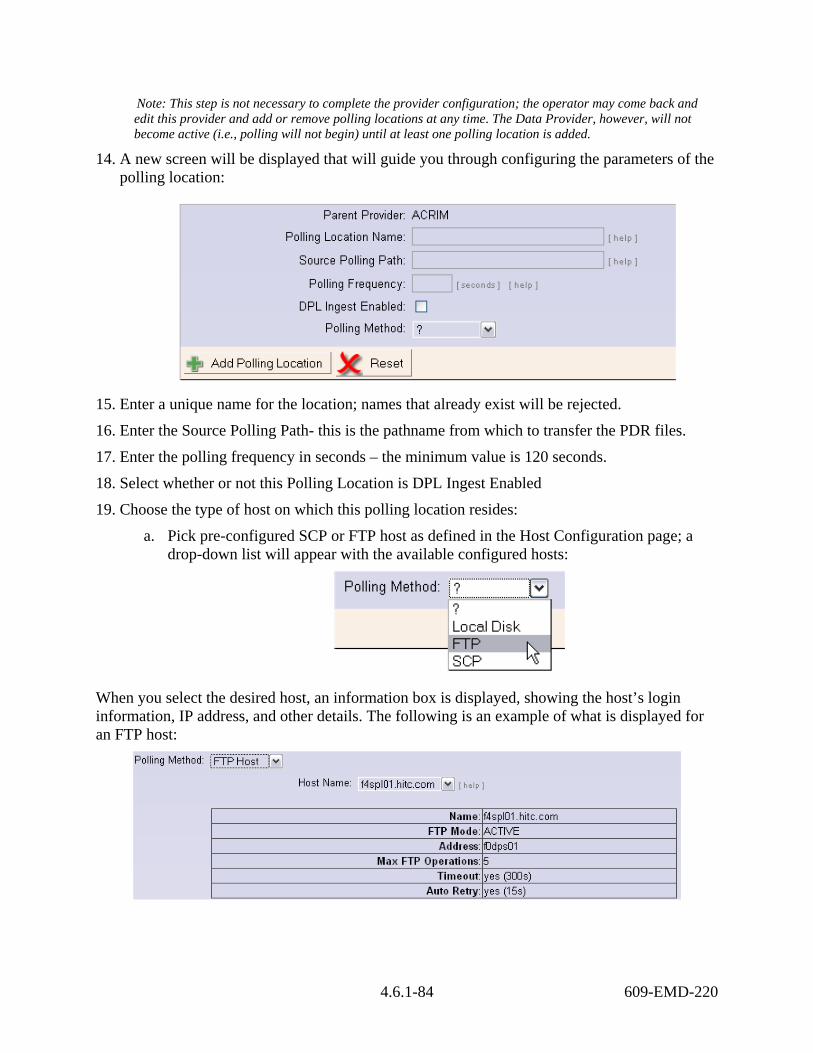
4.6.1-84 609-EMD-220
Note: This step is not necessary to complete the provider configuration; the operator may come back and edit this provider and add or remove polling locations at any time. The Data Provider, however, will not become active (i.e., polling will not begin) until at least one polling location is added.
14. A new screen will be displayed that will guide you through configuring the parameters of the polling location:
15. Enter a unique name for the location; names that already exist will be rejected.
16. Enter the Source Polling Path- this is the pathname from which to transfer the PDR files.
17. Enter the polling frequency in seconds – the minimum value is 120 seconds.
18. Select whether or not this Polling Location is DPL Ingest Enabled
19. Choose the type of host on which this polling location resides:
a. Pick pre-configured SCP or FTP host as defined in the Host Configuration page; a drop-down list will appear with the available configured hosts:
When you select the desired host, an information box is displayed, showing the host’s login information, IP address, and other details. The following is an example of what is displayed for an FTP host:

4.6.1-85 609-EMD-220
The following is an example of what is displayed for an SCP host:
b. Or…configure as a local disk directory; No further information is required (the path
is already provided at the top of the page).
20. When you’re done, click the “Add Polling Location” button at the bottom of the screen. Now
you’re done adding the polling location! Repeat the steps above to add more polling locations.
4.6.1.19 Data Type Configuration Any ECS Collection is eligible for DPL Ingest. ECS collections are added via the DataPool Maintenance GUI. These configuration screens allow DAAC users to override some assumptions about these Data Types. The default assumptions are:
• By default, ECS collections are archived but not inserted into the public Data Pool upon ingest. The operator can change this so all granules associated with an ECS Collection are inserted into the public Data Pool as soon as they complete normal ingest processing for each data type. This would take the place of an unqualified subscription for Data Pool insert and is more efficient.
• The operator can configure a default public and hidden retention time for all Versioned Data Types. Adding a public retention period will guarantee that they remain in the Data Pool for ordering purposes after ingest for the specified time. Otherwise, they will be removed immediately after archiving completes. The operator can override the default retention for individual collections.
This page displays the data types whose configuration has been altered to support non-default options. To change options for these data types, check the box next to each Data Type short name you wish to modify, and set the options in the Modify Selected Data Types panel at the bottom of the list. To set non-default options for other Data Pool data types, select ‘View /

4.6.1-86 609-EMD-220
Configure Additional Data Types’ at the top of the list and select the additional data types from the resulting list. See Figure 4.6.1-85 for a general overview of this page. Explanations of the fields on this page may be found in Table 4.6.1-24.
Figure 4.6.1-85. Data Type Configuration (General Overview)
Editing Data Types
To configure the attributes of any of the listed data types here, check the box next to the desired data types (multiple selections may be made) and enter the new parameters in the form below labeled Modify Selected Data Types and click on Apply Changes, as indicated by the red arrows in Figure 4.6.1-85. Note: Trailing and leading white space will be removed from values entered into any text fields on this page, or any of the sub pages under it.

4.6.1-87 609-EMD-220
Table 4.6.1-24. Data Type Configuration Page Field Descriptions Field Name Entry Description
Short Name.Version ID Not Editable The Short Name and Version Id for the collection Public in Data Pool Editable Indicates whether or not to publish data for this data type
in the public Data Pool following successful Ingest. Ignore Validation Warnings
Editable Determines whether the operator will be notified via email if there are metadata validation warnings for a granule belonging to the given collection.
4.6.1.20 Transfer Host Configuration This page allows the operator to manage SCP, FTP, and local hosts for general use in the Data Pool Ingest system. These hosts can be referenced when defining polling locations or notification hosts. In addition, if the host ip-addresses are referenced within PDRs as the source locations for granule files, DPL Ingest will automatically refer to their definition to obtain time out and retry parameters. The DAAC will be able to define default time-out and retry parameters for SCP or FTP hosts, to be used if a host is referenced that has not been explicitly defined. If a request is sent through processing with a host referenced in the PDR that does not show up on the GUI as a configured host, a new host will automatically be added to the list of SCP/FTP Hosts with the name UNDEFHOST_[Provider]_[RequestID]. Default host configuration parameters will be applied to the new host until the operator chooses to modify them. On the Transfer Host Configuration page, you can add named SCP or FTP hosts and configure them to suit their purpose. You can also edit and remove existing hosts, and change the default parameters for all SCP or FTP hosts and for the LOCAL host. This page is shown in Figure 4.6.1-86. Explanations of the fields on this page may be found in Table 4.6.1-25 and throughout this section.
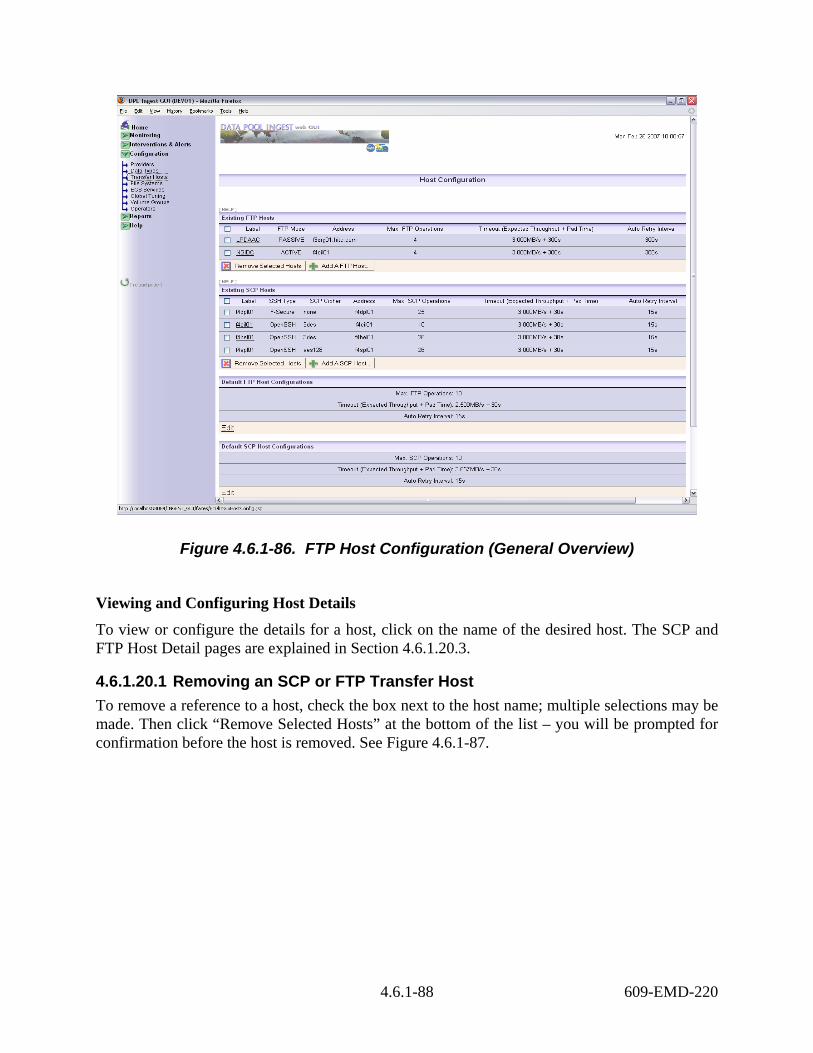
4.6.1-88 609-EMD-220
Figure 4.6.1-86. FTP Host Configuration (General Overview)
Viewing and Configuring Host Details
To view or configure the details for a host, click on the name of the desired host. The SCP and FTP Host Detail pages are explained in Section 4.6.1.20.3.
4.6.1.20.1 Removing an SCP or FTP Transfer Host To remove a reference to a host, check the box next to the host name; multiple selections may be made. Then click “Remove Selected Hosts” at the bottom of the list – you will be prompted for confirmation before the host is removed. See Figure 4.6.1-87.

4.6.1-89 609-EMD-220
Figure 4.6.1-87. Removing SCP/FTP Host
4.6.1.20.2 Adding an SCP or FTP Host To add a named reference to a new host, take the following steps:
1. Click on “Add a [SCP, FTP] Host…” at the bottom of the host list:
2. A new screen will be displayed with blank fields to add the host label (a unique name
YOU give this host), IP address/DNS Name, and configuration parameters, as shown in Figure 4.6.1-88 and Figure 4.6.1-89.

4.6.1-90 609-EMD-220
Figure 4.6.1-88. Adding a New SCP Host

4.6.1-91 609-EMD-220
Figure 4.6.1-89. Adding a new FTP Host
FTP and SCP Hosts have similar but slightly different fields. Table 4.6.1-25 explains these fields.
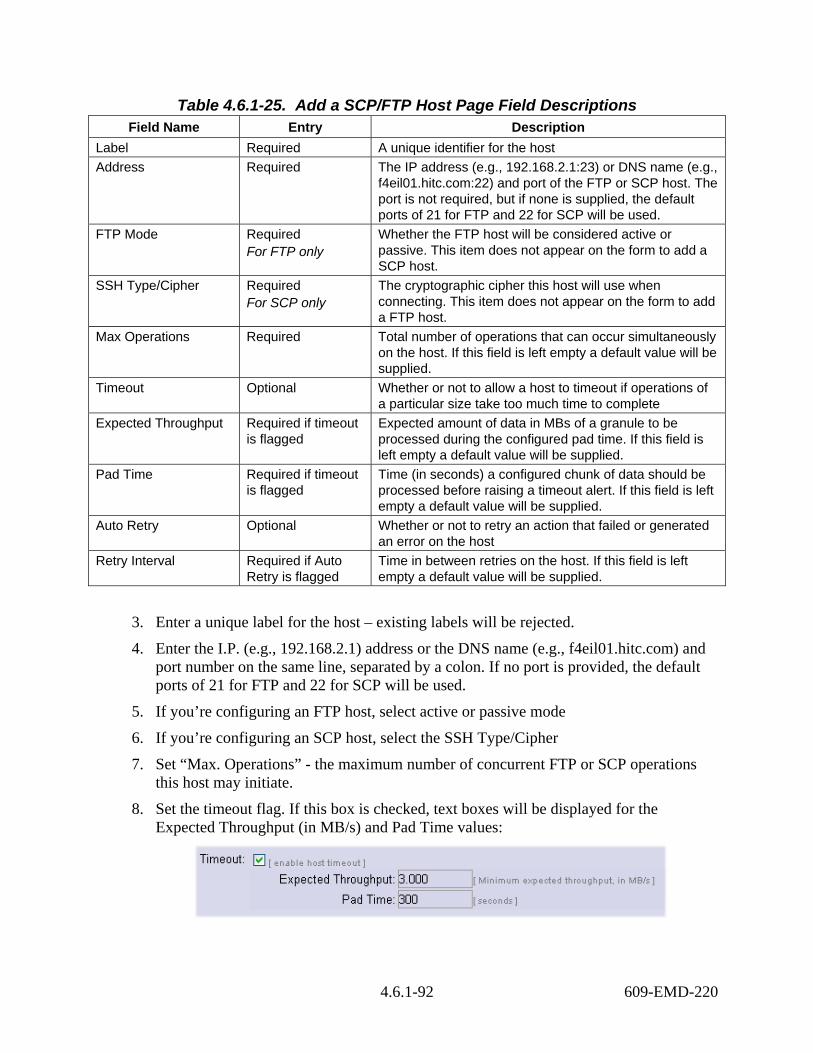
4.6.1-92 609-EMD-220
Table 4.6.1-25. Add a SCP/FTP Host Page Field Descriptions Field Name Entry Description
Label Required A unique identifier for the host Address Required The IP address (e.g., 192.168.2.1:23) or DNS name (e.g.,
f4eil01.hitc.com:22) and port of the FTP or SCP host. The port is not required, but if none is supplied, the default ports of 21 for FTP and 22 for SCP will be used.
FTP Mode Required For FTP only
Whether the FTP host will be considered active or passive. This item does not appear on the form to add a SCP host.
SSH Type/Cipher Required For SCP only
The cryptographic cipher this host will use when connecting. This item does not appear on the form to add a FTP host.
Max Operations Required Total number of operations that can occur simultaneously on the host. If this field is left empty a default value will be supplied.
Timeout Optional Whether or not to allow a host to timeout if operations of a particular size take too much time to complete
Expected Throughput Required if timeout is flagged
Expected amount of data in MBs of a granule to be processed during the configured pad time. If this field is left empty a default value will be supplied.
Pad Time Required if timeout is flagged
Time (in seconds) a configured chunk of data should be processed before raising a timeout alert. If this field is left empty a default value will be supplied.
Auto Retry Optional Whether or not to retry an action that failed or generated an error on the host
Retry Interval Required if Auto Retry is flagged
Time in between retries on the host. If this field is left empty a default value will be supplied.
3. Enter a unique label for the host – existing labels will be rejected.
4. Enter the I.P. (e.g., 192.168.2.1) address or the DNS name (e.g., f4eil01.hitc.com) and port number on the same line, separated by a colon. If no port is provided, the default ports of 21 for FTP and 22 for SCP will be used.
5. If you’re configuring an FTP host, select active or passive mode
6. If you’re configuring an SCP host, select the SSH Type/Cipher
7. Set “Max. Operations” - the maximum number of concurrent FTP or SCP operations this host may initiate.
8. Set the timeout flag. If this box is checked, text boxes will be displayed for the Expected Throughput (in MB/s) and Pad Time values:

4.6.1-93 609-EMD-220
9. Set the Auto Retry flag. If this box checked, a textbox will be displayed to set the Retry Interval value - the number of minutes to wait between retries of this host if it becomes suspended by the server:
10. Click “Add This Host” at the bottom of the screen to add this host. It will now appear
as a new entry in the Transfer Host Configuration page.
4.6.1.20.3 SCP and FTP Host Configuration Detail To view and edit an existing FTP or SCP Transfer Host, click on the name of the desired host on the Host Configuration page. A new page will be displayed, allowing the operator to view and edit (if authorized) the parameters of the host, as shown in Figure 4.6.1-90. Explanations of the fields on this page may be found in Table 4.6.1-26. Note: Trailing and leading white space will be removed from values entered into any text fields on this page, or any of the sub pages under it.
Figure 4.6.1-90. FTP Host Configuration Detail

4.6.1-94 609-EMD-220
Table 4.6.1-26. SCP/FTP Host Configuration Detail Field Descriptions Field Name Entry Description
Label Required A unique identifier for the host Address Required An IP address or the canonical name and port (if needed)
of an FTP host FTP Mode Required
For FTP only Whether the FTP host will be considered active or passive. This item does not appear on the form to add a SCP host.
SSH Type/Cipher Required For SCP only
The cryptographic cipher this host will use when connecting. This item does not appear on the form to add a FTP host.
Max Operations Required Total number of operations that can occur simultaneously on the host. If this field is left empty a default value will be supplied.
Timeout Optional Whether or not to allow a host to timeout if operations of a particular size take too much time to complete
Expected Throughput Required if timeout is flagged
Expected amount of MBs of a granule to be processed during the configured pad time. If this field is left empty a default value will be supplied.
Pad Time Required if timeout is flagged
Time a configured chunk of data should be processed before raising a timeout alert. If this field is left empty a default value will be supplied.
Auto Retry Optional Whether or not to retry an action that failed or generated an error on the host
Retry Interval Required if Auto Retry is flagged
Time in between retries on the host. If this field is left empty a default value will be supplied.
4.6.1.20.4 Local and Default Host Configuration Local Host configuration parameters are used during any local transfer operations. The Max. Local Operations limits how many local copies will occur concurrently. The timeout values apply to each individual local copy operation. Default SCP and FTP Host configuration values are used to fill in default values whenever a new SCP or FTP host is added, or if a field is left empty when updating an existing SCP or FTP host. To edit local host or default SCP or FTP Host configuration, click “Edit” beneath the “Local Host Configuration” or “Default SCP and FTP Host Configuration” sections of the Transfer Host Configuration page. See Figure 4.6.1-91.

4.6.1-95 609-EMD-220
Figure 4.6.1-91. Default and Local Host Configuration
A configuration page will appear exactly like the SCP or FTP Host Configuration Detail page, except the Label will not be an editable field (as shown in Figure 4.6.1-92). Explanations of the fields on this page may be found in Table 4.6.1-26.

4.6.1-96 609-EMD-220
Figure 4.6.1-92. Local Host Configuration
Enter your configuration changes and then press “Apply Changes.”
4.6.1.21 File System Configuration The File System Configuration page allows the operator to configure warning and suspension thresholds for any configured Archive or Data Pool File Systems, as shown in Figures 4.6.1-93 and 4.6.1-94. This page shows both types, starting with the Archive File Systems at the top and Data Pool File Systems at the bottom. Table 4.6.1-27 contains the archive file system configuration page field descriptions and Table 4.6.1-28 contains Data Pool file systems configuration page field descriptions.

4.6.1-97 609-EMD-220
Figure 4.6.1-93. File System Configuration (Archive File Systems only)
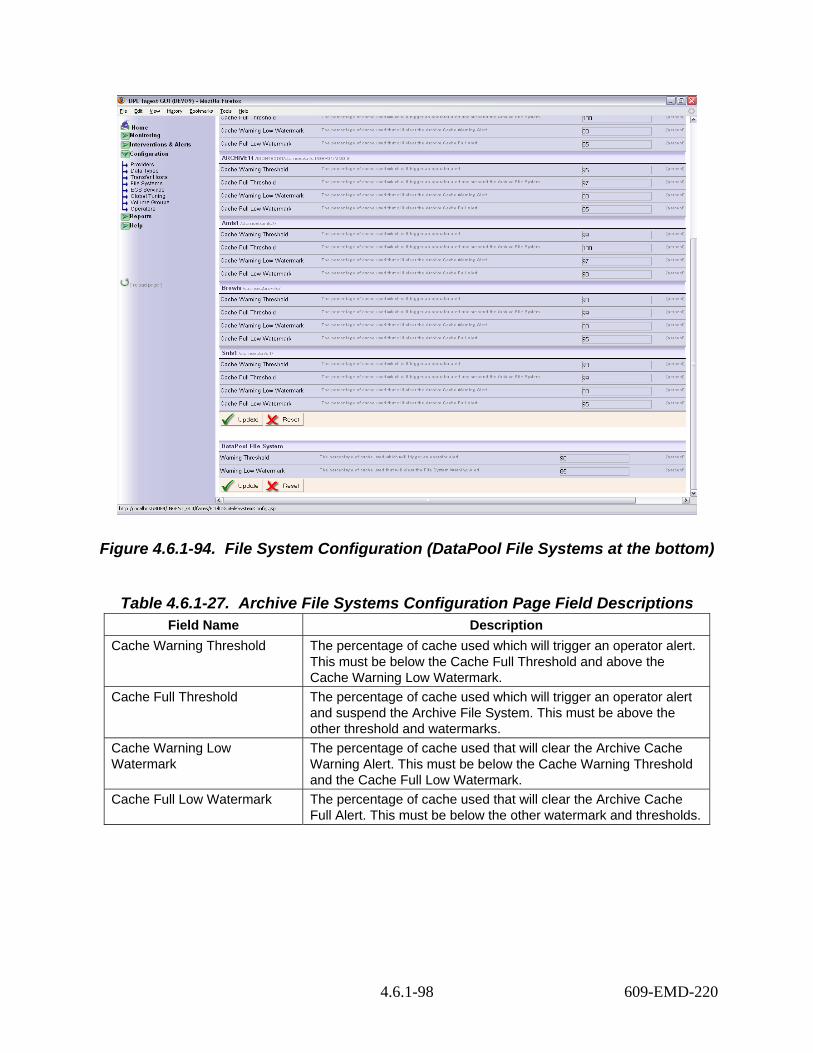
4.6.1-98 609-EMD-220
Figure 4.6.1-94. File System Configuration (DataPool File Systems at the bottom)
Table 4.6.1-27. Archive File Systems Configuration Page Field Descriptions Field Name Description
Cache Warning Threshold The percentage of cache used which will trigger an operator alert. This must be below the Cache Full Threshold and above the Cache Warning Low Watermark.
Cache Full Threshold The percentage of cache used which will trigger an operator alert and suspend the Archive File System. This must be above the other threshold and watermarks.
Cache Warning Low Watermark
The percentage of cache used that will clear the Archive Cache Warning Alert. This must be below the Cache Warning Threshold and the Cache Full Low Watermark.
Cache Full Low Watermark The percentage of cache used that will clear the Archive Cache Full Alert. This must be below the other watermark and thresholds.
4.6.1-99 609-EMD-220
Table 4.6.1-28. DataPool File Systems Configuration Page Field Descriptions Field Name Description
Warning Threshold Warning Threshold The percentage of cache used which will trigger an operator alert
Warning Low Watermark The percentage of cache used that will clear the File System Warning Alert
To modify File System parameters, enter the desired changes in the configurable fields and click “Update” – these buttons are located at the bottom of each of the DataPool and Archive File Systems sections.
4.6.1.22 ECS Service Configuration This page (see Figure 4.6.1-95) allows the operator to configure the parameters of ECS services on a host-specific basis. A default checksum type and algorithm can also be set for use by the checksumming service hosts. Further, this page also allows the operator to select the host from which AIM will be run. This must be configured to ensure proper functionality of the DPL Ingest system. An authorized operator can change any of the fields (they would otherwise be disabled for unauthorized or view-only operators). Note that you cannot suspend or resume these services from this page – you must do this from the ECS Services Status Page (see Section 4.6.1.14). The initial page is a listing page only on which modifications cannot be made. The list shows which services are enabled for each host.

4.6.1-100 609-EMD-220
Figure 4.6.1-95. ECS Service Configuration (general overview)
This page contains three sections: • Checksum Type and Algorithm Configuration – The operator can add, edit, and delete
checksum types and their specific algorithms, and specify if the checksum type will be used as the default type.
• Hosts used for ECS Services – The operator can view, add, and edit the attributes of the ECS Service host and can configure each of the services that run on that host (see Table 4.6.1-29).

4.6.1-101 609-EMD-220
Table 4.6.1-29. ECS Services Configuration Field Description Field Name Description
Name The unique name given for this ECS Service Host Address The IP address or DNS Name and port of the host Comments Any descriptive comment text given for this host. Max. Insert Checksum Operations The maximum number of Insert Checksum Operations
that will be performed by this host (checksum performed before archiving)
Max. Insert Copy Operations The maximum Insert Copy operations that will be performed by this host.
Checksum File Transfer Archive SCP
Each of these ECS Services are indicated as enabled (green checkmark) or disabled (red x) for each host. The numbers under each of the indicators are the number of available slots for this service.
4.6.1.22.1 Adding an ECS Service Host Authorized operators can add new ECS Service Hosts and configure each of their associated services from this page. To add a Service Host, do the following:
• On the ECS Services page, click “Add an ECS Service Host” at the bottom of the list:
• A new page will load with a blank form, as shown in Figure 4.6.1-96.
Table 4.6.1-30 contains the ECS services configuration field.
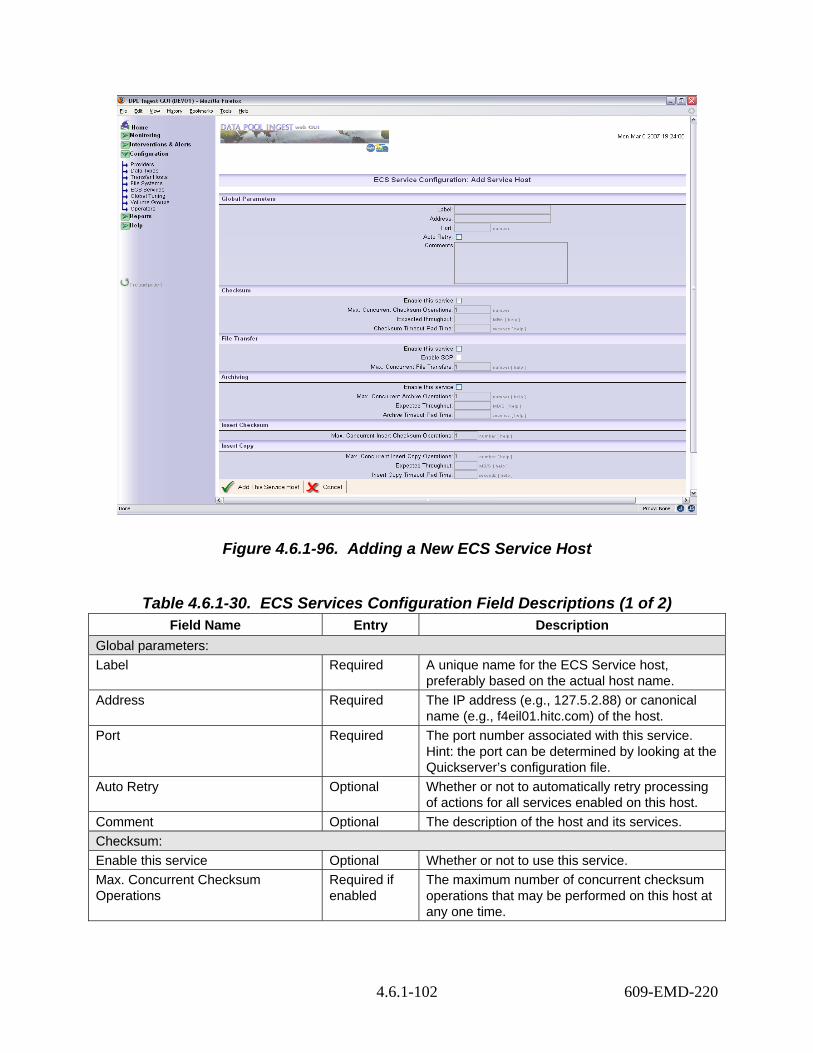
4.6.1-102 609-EMD-220
Figure 4.6.1-96. Adding a New ECS Service Host
Table 4.6.1-30. ECS Services Configuration Field Descriptions (1 of 2) Field Name Entry Description
Global parameters: Label Required A unique name for the ECS Service host,
preferably based on the actual host name. Address Required The IP address (e.g., 127.5.2.88) or canonical
name (e.g., f4eil01.hitc.com) of the host. Port Required The port number associated with this service.
Hint: the port can be determined by looking at the Quickserver’s configuration file.
Auto Retry Optional Whether or not to automatically retry processing of actions for all services enabled on this host.
Comment Optional The description of the host and its services. Checksum: Enable this service Optional Whether or not to use this service. Max. Concurrent Checksum Operations
Required if enabled
The maximum number of concurrent checksum operations that may be performed on this host at any one time.

4.6.1-103 609-EMD-220
Table 4.6.1-30. ECS Services Configuration Field Descriptions (2 of 2) Field Name Entry Description
Checksum (continued): Expected Throughput Required if
enabled The expected data throughput for checksum operations. This is to identify stuck operations,
Checksum Timeout Pad Time Required if enabled
The additional delay for a checksum operation before it is considered timed-out.
File Transfer: Enable this service Optional Whether or not to use this service. Enable SCP Optional Whether or not to use SCP as the file transfer
method. This will only take effect if “Enable this service” is checked.
Max. Concurrent File Transfers Required if enabled
The maximum number of concurrent file transfers that may be executed on this host.
Archiving: Enable this service Optional Whether or not to use this service. Max. Concurrent Archive Operations Required if
enabled The maximum number of concurrent archive operations that may be executed on this host.
Expected Throughput Required if enabled
The expected data throughput for archive operations. This is to identify stuck operations.
Archive Timeout Pad Time Required if enabled
The additional delay for an archive operation before it is considered timed-out.
Insert Checksum: Max. Concurrent Insert Checksum Operations:
Optional The maximum number of concurrent Insert Checksum operations that may be executed on this host.
Insert Copy Max. Concurrent Insert Copy Operations
Required The maximum number of concurrent Insert Copy operations that may be executed on this host.
Expected Throughput Required The expected data throughput for Insert Copy operations. This is to identify stuck operations.
Insert Copy Timeout Pad Time Required The additional delay for an Insert Copy operation before it is considered timed-out.
• Under the Global Parameters section, enter the parameter values for that server:

4.6.1-104 609-EMD-220
You can also add comments here to describe the server’s purpose.
• Configure the parameters for each of the available services on this server. Some services can be enabled or disabled (e.g., Checksum and File Transfer). By default, services are not enabled unless you specifically enabled them by checking “Enable this service” above the parameter boxes:
• Configure the settings for the Checksum service. Note that these are parameters for all
types of checksum operations that run on this host. To add and configure checksum types, go to the main ECS Service Configuration page.
Here and for all other services, there are two time-out parameters that the Ingest Service uses to determine when an operation should be considered overdue (i.e., timed-out) and cancels it. The two parameters are: (1) the expected throughput; (2) the time out pad time.
The Ingest Service will calculate the expected time of the operation for a granule by dividing the granule size by the expected throughput, and then add the time out padding. These parameters are only used to determine when an operation should be considered hung, so both the expected throughput and the time-out padding should be chosen pessimistically to avoid canceling operations that are just slow because of concurrent heavy workload.
• Configure the settings for the File Transfer service. If this service is enabled, then
configure the maximum number of concurrent file transfers. The timeout parameters are configured separately for each of the FTP hosts. If you wan to enable SCP as a transfer service in addition to FTP, check “Enable SCP”:

4.6.1-105 609-EMD-220
• Configure the Archive Service:
• Configure the Insert Checksum Service:
• Configure the Insert Copy Service:
• Click “Add This Service Host” at the bottom. The host will be added and the listing
page will be displayed:
4.6.1.22.2 Editing an ECS Service Host To edit an ECS Service Host and its associated services, click on the name of the host (as shown in Figure 4.6.1-97) and the detail page for that host will be displayed. This page is similar to the “Add ECS Service Host” page and contains all of the same fields. See Section 4.6.1.22 for details on how to configure an ECS Service Host.
Figure 4.6.1-97. Selecting an ECS Service Host to Edit

4.6.1-106 609-EMD-220
4.6.1.22.3 Removing an ECS Service Host To remove an ECS Service Host, check the box next to the host name (as shown in Figure 4.6.1-98) and click “Remove Selected Hosts” at the bottom of the list. A warning will pop up stating that the Server (the Processing Server) must be first shut down, as shown in Figure 4.6.1-99.
Figure 4.6.1-98. Selecting an ECS Service Host for Removal
Figure 4.6.1-99. Warning for Removing ECS Service Host
4.6.1.23 Volume Group Configuration The Volume Group configuration in the DPL Ingest GUI is meant to duplicate the functionality in the decommissioned STMGT GUI tab with some refinements and enhancements. This configuration page is shown in Figure 4.6.1-100. Table 4.6.1-31 contains the volume groups configuration page field descriptions.

4.6.1-107 609-EMD-220
4.6.1.23.1 Volume Group Configuration Page
Figure 4.6.1-100. Volume Groups Configuration (Listing Page)
Table 4.6.1-31. Volume Groups Configuration Page Field Descriptions (1 of 2) Field Name Data
Type Size Entry Description
Volume Group Name Character 255 System Generated
The name of the Volume Group based on a Data Type shortname with version identifier.
Path Character 255 System Generated
The fully qualified Unix path to where data is stored for the specified data type.
Hardware CI Character 16 System Generated
The label of the Archive silo group instance currently responsible for storing data of the specified data type.
Selection Date Character 32 System Generated
A selection date (if applicable) defined for the Data Type version of which there are two volume group history sets: one defined for forward processing and the other for reprocessing data.

4.6.1-108 609-EMD-220
Table 4.6.1-31. Volume Groups Configuration Page Field Descriptions (2 of 2) Field Name Data Type Size Entry Description
New Volume Group Path
Text 255 Operator A hidden field that is displayed when the operator clicks “Modify Selected Volume Groups”.
This page displays the list of currently configured volume groups. This list is displayed all on one page and not broken into chunks. By default, the entries are listed alphabetically by Data Type name. You can search for a desired data type by using the browser’s built-in search function. The bottom of the list has a buttons to add a new volume group configuration or edit multiple selections of existing volume groups. Below are more detailed screen shots that explain the features available on this page.
4.6.1.23.1.1 Column Sorting All columns on the Volume Groups Configuration page can be sorted in ascending or descending order. To sort on a column, click on the up or down arrow at the top of the column, as shown in Figure 4.6.1-101. The sorted column will be highlighted.
Figure 4.6.1-101. Sort-able columns
4.6.1.23.1.2 Modifying Volume Groups Several Volume Groups may be modified at once by checking the boxes next to each Volume Group name and then clicking “Modify Selected Volume Groups…” at the bottom of the list. The checkbox at the very top of the list allows the operator to select all of the Volume Groups on the page, as shown in Figure 4.6.1-102. Operators will not be able to modify more than one volume group at a time when there are Volume Groups selected from a Data Type version that has an alternative Volume Group History Set defined.

4.6.1-109 609-EMD-220
Figure 4.6.1-102. Modify Selected Volume Groups
When the desired Volume Groups are selected, they are highlighted to give a clear visual indication of which Volume Groups will be changed. When the “Modify Selected Volume Groups” button is clicked, a path input field appears below – here you can enter the new path to be applied to all selected Volume Groups. Click “ok” to apply the changes. Before any change takes place, you will be prompted for confirmation.
4.6.1.23.1.3 Adding New Volume Groups To add a new Volume Group, click “Add Volume Group” at the bottom of the list, as shown in Figure 4.6.1-103.
Figure 4.6.1-103. Add Volume Group Button

4.6.1-110 609-EMD-220
This will display the Add Volume Groups page. The list of Volume Groups displayed on this page have already been entered and configured in the STMGT Database. There are two paths one can take when adding a Volume Group:
1. The operator can add volume groups, to a new a Data Type version (a Data Type version that has not already been configured)
2. The operator can add Volume Groups to an existing Data Type version (a Data Type Version that has at least one Volume Group History Set). For example, if a primary volume group exists for AST_L1B.003, the operator may add a backup Volume Group, which would create a Volume Group named AST_L1B.003B (appending a “B” to the original name). If the backup already exists, the operator would not be able to add another backup Volume Group.
See Section 4.6.1.23.1.4 for more details on how Volume Groups get named.
4.6.1.23.1.4 Volume Group Naming Conventions When a Volume Group is added, the name will be created based on the type of Volume Group that was added. There are six types, as explained in Table 4.6.1-32. Note that “R” indicates an alternative Volume Group for reprocessing. There is no explicit suffix for forward processing.
Table 4.6.1-32. Volume Group Naming Volume Group Type Extension Example
Primary none AST_L1B.003 Primary Alternative R AST_L1B.003R Backup B AST_L1B.003B Backup Alternative BR AST_L1B.003BR Offsite O AST_L1B.003O Offsite Alternative OR AST_L1B.003OR
4.6.1.23.2 Add Volume Group Page The Add Volume Group page allows an authorized operator to add a volume group for a new Data Type version or to add new volume group to an existing Data Type version. See Figure 4.6.1-105. To add a Volume Group for a new Versioned Data Type, you must first type in the name of the Versioned Data Type. The sequence is as follows:
1. Click on the Volume Groups tab in the navigation menu
2. Click on Add Volume Group… at the bottom of the list
3. Follow the instructions on the next page. To add a Volume Group for a new Versioned Data Type, click Add Volume Groups For A New Versioned Data Type... at the top page, as show in Figure 4.6.1-105.
4. Manually type in the Versioned Data Type into the text box. Click ok. A new page will load (Figure 4.6.1-104), allowing you to configure the Versioned Data Type as explained below.

4.6.1-111 609-EMD-220
Figure 4.6.1-104. Entering a New Versioned Data Type

4.6.1-112 609-EMD-220
Figure 4.6.1-105. Volume Groups: Add a Volume Group Page
Adding a Volume Group for a New Data Type Version The following rules apply when adding a volume group for a new Data Type Version:
1. The Primary path information must be entered.
2. The addition of Backup Volume Group, Offsite Volume Group, or Alternative Volume Group History Set, are optional and may be entered at a later time, however they can be entered all at once on this page as shown in Figure 4.6.1-106.
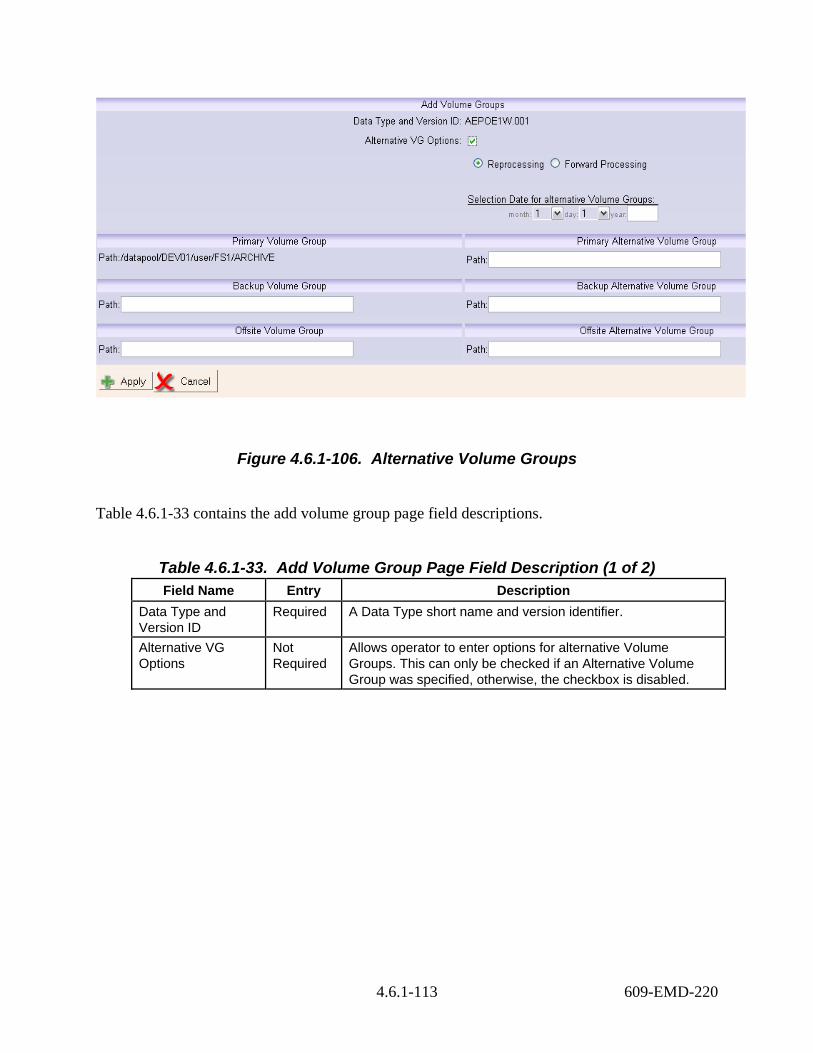
4.6.1-113 609-EMD-220
Figure 4.6.1-106. Alternative Volume Groups
Table 4.6.1-33 contains the add volume group page field descriptions.
Table 4.6.1-33. Add Volume Group Page Field Description (1 of 2) Field Name Entry Description
Data Type and Version ID
Required A Data Type short name and version identifier.
Alternative VG Options
Not Required
Allows operator to enter options for alternative Volume Groups. This can only be checked if an Alternative Volume Group was specified, otherwise, the checkbox is disabled.
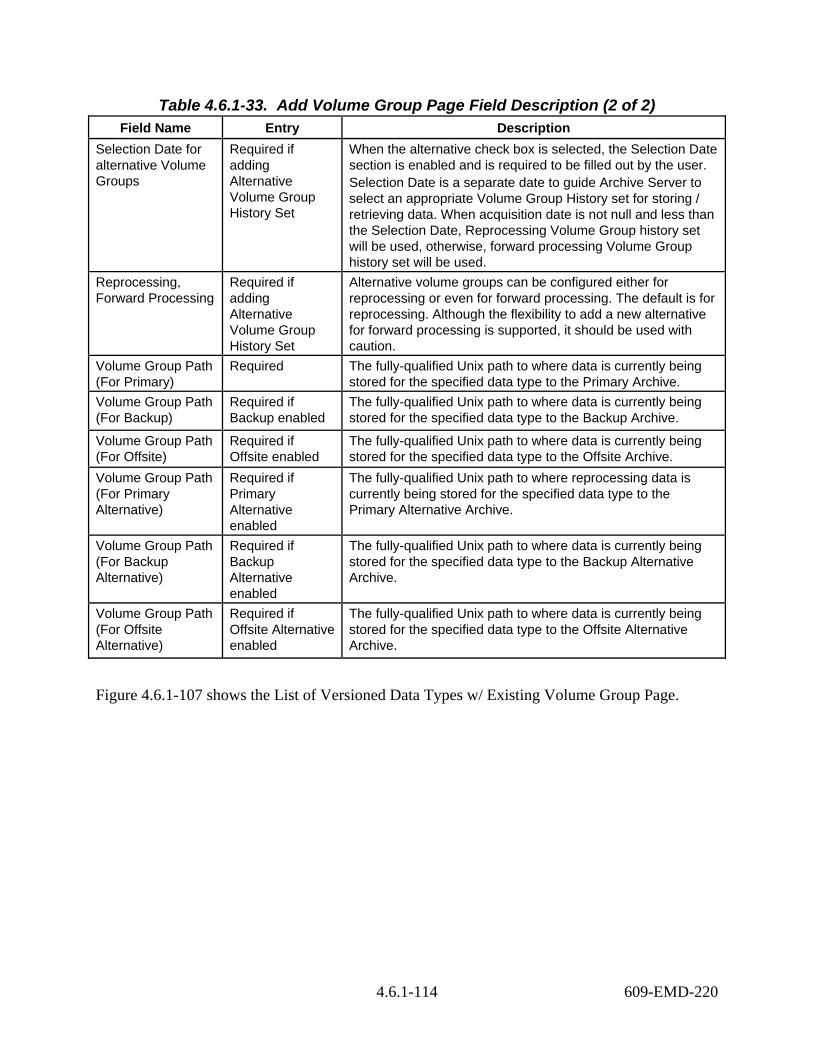
4.6.1-114 609-EMD-220
Table 4.6.1-33. Add Volume Group Page Field Description (2 of 2) Field Name Entry Description
Selection Date for alternative Volume Groups
Required if adding Alternative Volume Group History Set
When the alternative check box is selected, the Selection Date section is enabled and is required to be filled out by the user. Selection Date is a separate date to guide Archive Server to select an appropriate Volume Group History set for storing / retrieving data. When acquisition date is not null and less than the Selection Date, Reprocessing Volume Group history set will be used, otherwise, forward processing Volume Group history set will be used.
Reprocessing, Forward Processing
Required if adding Alternative Volume Group History Set
Alternative volume groups can be configured either for reprocessing or even for forward processing. The default is for reprocessing. Although the flexibility to add a new alternative for forward processing is supported, it should be used with caution.
Volume Group Path (For Primary)
Required The fully-qualified Unix path to where data is currently being stored for the specified data type to the Primary Archive.
Volume Group Path (For Backup)
Required if Backup enabled
The fully-qualified Unix path to where data is currently being stored for the specified data type to the Backup Archive.
Volume Group Path (For Offsite)
Required if Offsite enabled
The fully-qualified Unix path to where data is currently being stored for the specified data type to the Offsite Archive.
Volume Group Path (For Primary Alternative)
Required if Primary Alternative enabled
The fully-qualified Unix path to where reprocessing data is currently being stored for the specified data type to the Primary Alternative Archive.
Volume Group Path (For Backup Alternative)
Required if Backup Alternative enabled
The fully-qualified Unix path to where data is currently being stored for the specified data type to the Backup Alternative Archive.
Volume Group Path (For Offsite Alternative)
Required if Offsite Alternative enabled
The fully-qualified Unix path to where data is currently being stored for the specified data type to the Offsite Alternative Archive.
Figure 4.6.1-107 shows the List of Versioned Data Types w/ Existing Volume Group Page.

4.6.1-115 609-EMD-220
Adding a Volume Group to an existing Data Type Version
Figure 4.6.1-107. List of Versioned Data Types w/ Existing Volume Groups
The following rules apply when adding Volume Groups to an existing Data Type version (e.g., Backup, Offsite, etc.): 1. The Volume Group name will be selected from the Add Volume Group page (see Figure
4.6.1-107). When the link for the desired Versioned Data Type is clicked, the Data Type is displayed at the top of the next page.
2. Any previously added Volume Group will be displayed, but will not be editable. For example, if a Backup Volume Group has already been added, the Volume Group path will be shown, but the operator will not be able to edit this path.
3. Similarly, if any Alternative Volume Groups have been specified, the Alternative VG options and Volume Groups will be displayed, but not editable.
4. If the operator is adding the Alternative Volume Group History Set for the first time, the Alternative Options must be selected and the operator may choose the processing type (Forward Processing or Reprocessing) for the Alternative Volume Group History Set, as well as a selection date to be applied to the Reprocessing Volume Groups.

4.6.1-116 609-EMD-220
Adding Volume Groups
Multiple Volume Groups for a Data Type version may be added at once on the Add Volume Group page. For each volume group you wish to specify, enter a path for that Volume Group, as show in Figure 4.6.1-108.
Figure 4.6.1-108. Adding the Primary Volume Group
4.6.1.23.3 Authorization For DAACs that have security enabled for the DPL Ingest GUI, an operator would have to have Ingest Admin permission to add or configure volume groups as described in this document. No special permissions are needed to view current configurations or generate the Volume Groups History report page.
4.6.1.24 Global Tuning Configuration This page allows the operator to configure the global tuning parameters in the Data Pool Ingest database. The parameters are listed along with their descriptions and a text box to change the values, as show in Figure 4.6.1-109. There are two sections of the Global Tuning page, each editable by different permission levels. The first section, “Global Admin Tuning Parameter Configuration,” is editable with Ingest Admin or Ingest Tuning privileges. The second section, “Global Tuning Parameter Configuration,” requires Ingest Tuning privileges. If the logged in operator does not have permission to edit a section, the fields and buttons for that section will be disabled.

4.6.1-117 609-EMD-220
Figure 4.6.1-109. Global Tuning Configuration Page
Dynamic vs. Static Parameters
Dynamic parameters are those that are applied to the Ingest Service without having to restart it. The Ingest Service will automatically apply these parameters within 1 minute of having been set on the GUI. Static parameters are those that require the Ingest Service to be restarted before a change in the parameter value can take effect. Each parameter on this page is preceded by an icon indicating whether parameter is dynamic or static, as shown in Figure 4.6.1-110.

4.6.1-118 609-EMD-220
Figure 4.6.1-110. Dynamic and Static Configuration Icons
Descriptions of each parameter are displayed on the GUI and will not be included in this document. To modify parameters, fill in the desired values in the appropriate fields and press the “Apply Changes” button.
Note: Parameters must be edited section by section. If parameters are changed in the “Global Admin Tuning Parameter Configuration” section and then the “Apply Changes” button is pressed in the “Global Tuning Parameter Configuration,” modifications in the first section will be ignored.
4.6.1.25 Operator Configuration This page consists of a list of operator names and their current permission settings and allows an Ingest Security operator to configure the authorized users for the Data Pool Ingest GUI. Here operators can be added, edited, or removed. Figure 4.6.1-111 shows the general overview of this page.
Dynamic parameters have a green curled arrow.
Static parameters have the same icon with a red exclamation.

4.6.1-119 609-EMD-220
Figure 4.6.1-111. Operator Configuration Page
Permission Levels Explained:
There are 5 different permission levels. View Only is a special case: if an operator is assigned the View Only permission level, it may not have any other permissions. In any other case, the other 4 levels can be combined together as they represent the ability to manage an exclusive set of properties associated with data pool ingest. For example, an operator may be assigned Ingest Control and Ingest Admin permissions simultaneously, but not View Only and Ingest Admin. See Table 4.6.1-34 for the available permission levels and their descriptions.
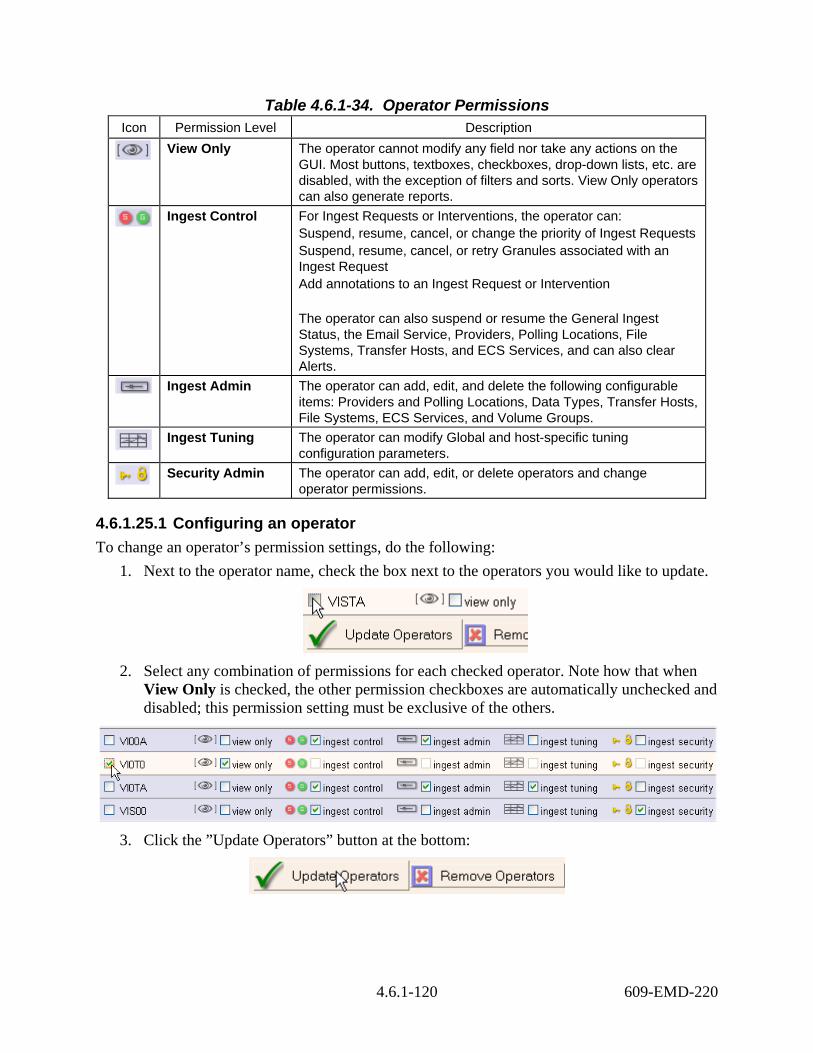
4.6.1-120 609-EMD-220
Table 4.6.1-34. Operator Permissions Icon Permission Level Description
View Only The operator cannot modify any field nor take any actions on the GUI. Most buttons, textboxes, checkboxes, drop-down lists, etc. are disabled, with the exception of filters and sorts. View Only operators can also generate reports.
Ingest Control For Ingest Requests or Interventions, the operator can: Suspend, resume, cancel, or change the priority of Ingest Requests Suspend, resume, cancel, or retry Granules associated with an Ingest Request Add annotations to an Ingest Request or Intervention The operator can also suspend or resume the General Ingest Status, the Email Service, Providers, Polling Locations, File Systems, Transfer Hosts, and ECS Services, and can also clear Alerts.
Ingest Admin The operator can add, edit, and delete the following configurable items: Providers and Polling Locations, Data Types, Transfer Hosts, File Systems, ECS Services, and Volume Groups.
Ingest Tuning The operator can modify Global and host-specific tuning configuration parameters.
Security Admin The operator can add, edit, or delete operators and change operator permissions.
4.6.1.25.1 Configuring an operator To change an operator’s permission settings, do the following:
1. Next to the operator name, check the box next to the operators you would like to update.
2. Select any combination of permissions for each checked operator. Note how that when
View Only is checked, the other permission checkboxes are automatically unchecked and disabled; this permission setting must be exclusive of the others.
3. Click the ”Update Operators” button at the bottom:
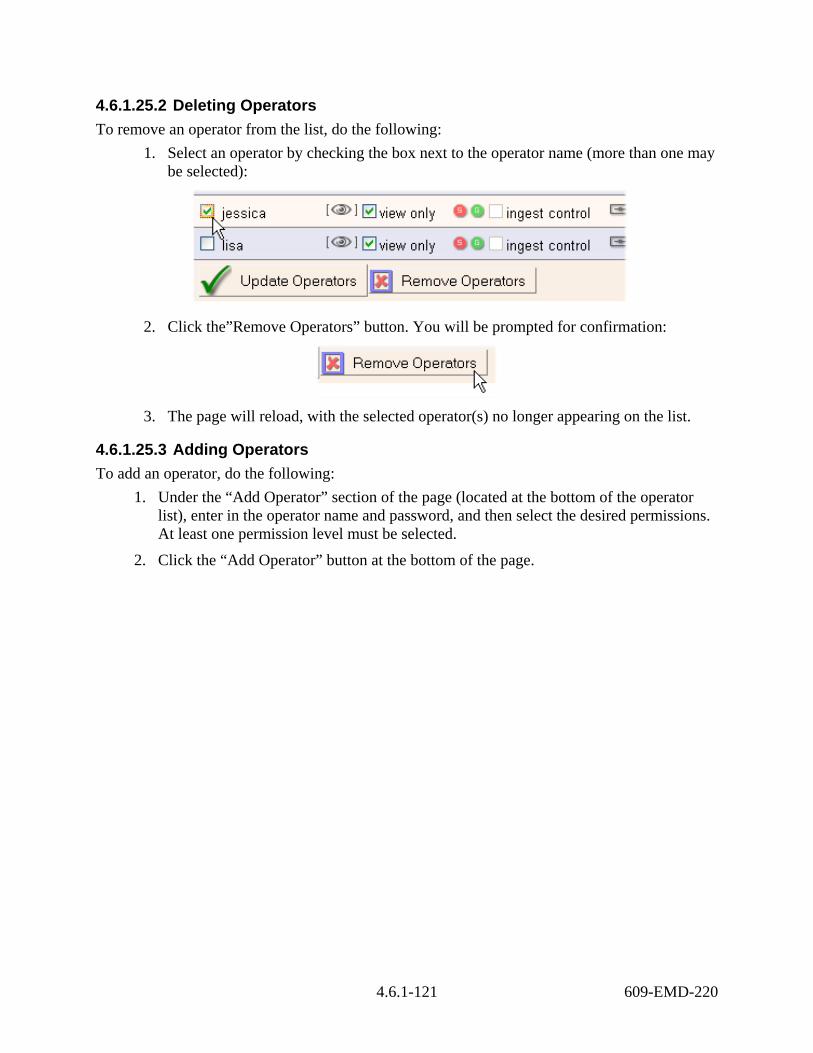
4.6.1-121 609-EMD-220
4.6.1.25.2 Deleting Operators To remove an operator from the list, do the following:
1. Select an operator by checking the box next to the operator name (more than one may be selected):
2. Click the”Remove Operators” button. You will be prompted for confirmation:
3. The page will reload, with the selected operator(s) no longer appearing on the list.
4.6.1.25.3 Adding Operators To add an operator, do the following:
1. Under the “Add Operator” section of the page (located at the bottom of the operator list), enter in the operator name and password, and then select the desired permissions. At least one permission level must be selected.
2. Click the “Add Operator” button at the bottom of the page.

4.6.1-122 609-EMD-220
3. You will be prompted for confirmation. The page will reload with the new operator
added to the list.
4.6.1.26 Reports The reporting capability of the Ingest GUI offers the ability to view detailed reports on data providers and data types, as well as Request summary, Granule summary, and Volume Group history reports. The report pages are located under the Reports menu in the navigation pane.
4.6.1.26.1 Report Formats and Layouts This report pages display the information across several data providers or data types. An example of the Detailed Report page is shown in Figure 4.6.1-112. As with all types of reports, the operator must select a date range (presets are provided for the last 24 and 48 hours), as well as criteria for the search. These include one or more data providers, one or more data types, and one or more final request statuses. All Data Criteria fields are optional, but at least one selection of one field must be made to generate the report.

4.6.1-123 609-EMD-220
Figure 4.6.1-112. Detailed Report Page
4.6.1.26.2 Generating the report Due to the large volume of data that may be in the database, reports can sometime take a while to process and be displayed. Immediately upon pressing the “Generate Report” button, a transitional screen is loaded with the message “Processing Your Request…”, as show in Figure 4.6.1-113.

4.6.1-124 609-EMD-220
Figure 4.6.1-113. Report Page processing a report request
4.6.1.26.3 Fields Generated Reports The various report pages look similar at first glance, but they all produce different fields. The following figures (Figure 4.6.1-114, Figure 4.6.1-115, and Figure 4.6.1-116) display the headers generated for each particular report type. Some example data is also shown along with the headers. Reports containing averages (e.g., “size avg.” on the Request Summary Report) actually contain weighted averages, which is in effect an average of averages. For example, “size avg.” is an average of all of the granules, weighed against the average of all the other averages for each Data Provider. Note that the current search criteria (data and date/time) are always shown at the top of the report output.

4.6.1-125 609-EMD-220
Figure 4.6.1-114. Detailed Report Layout
Figure 4.6.1-115. Request Summary Report Layout

4.6.1-126 609-EMD-220
Figure 4.6.1-116. Granule Summary Report Layout
4.6.1.26.4 Generating the report To generate a report, take the following steps:
1. Select the type of report you wish to see from the navigation panel. For this example, select Detailed, Request Summary, or Granule Summary. Volume Group History is covered in a separate section.
2. The report page will be loaded. Select the date/time range. If you leave the time fields at
0:00, it will be assumed that this will cover the entire 24-hour period:
3. Select the data criteria for the search. Several values of each criterion may be selected to
narrow the search, but at least one field must selected (hold down the Ctrl key to select multiple items):

4.6.1-127 609-EMD-220
4. Click the green button to submit the query and generate the report.
5. A message will appear, alerting the operator that the system is processing the request.
This may take a few seconds.
6. The report will be displayed on the bottom of the page (see Figure 4.6.1-114, Figure 4.6.1-115, and Figure 4.6.1-116 for report output examples).
7. If you want to save the report, use your browser’s “Save Page As…” function to save the page in HTML format.
4.6.1.26.5 Volume Groups History Page The Volume Groups History page displays the history of the configuration changes that have occurred to volume groups, as shown in Figure 4.6.1-117. To view the report for a particular Volume Group, select the Volume Group from the box at the top of the page and click the “retrieve” button. Once this button is clicked, the page will automatically refresh with the report specific to that Volume Group (the page is initially blank when first loaded). Table 4.6.1-35 contains the volume groups history page field descriptions.
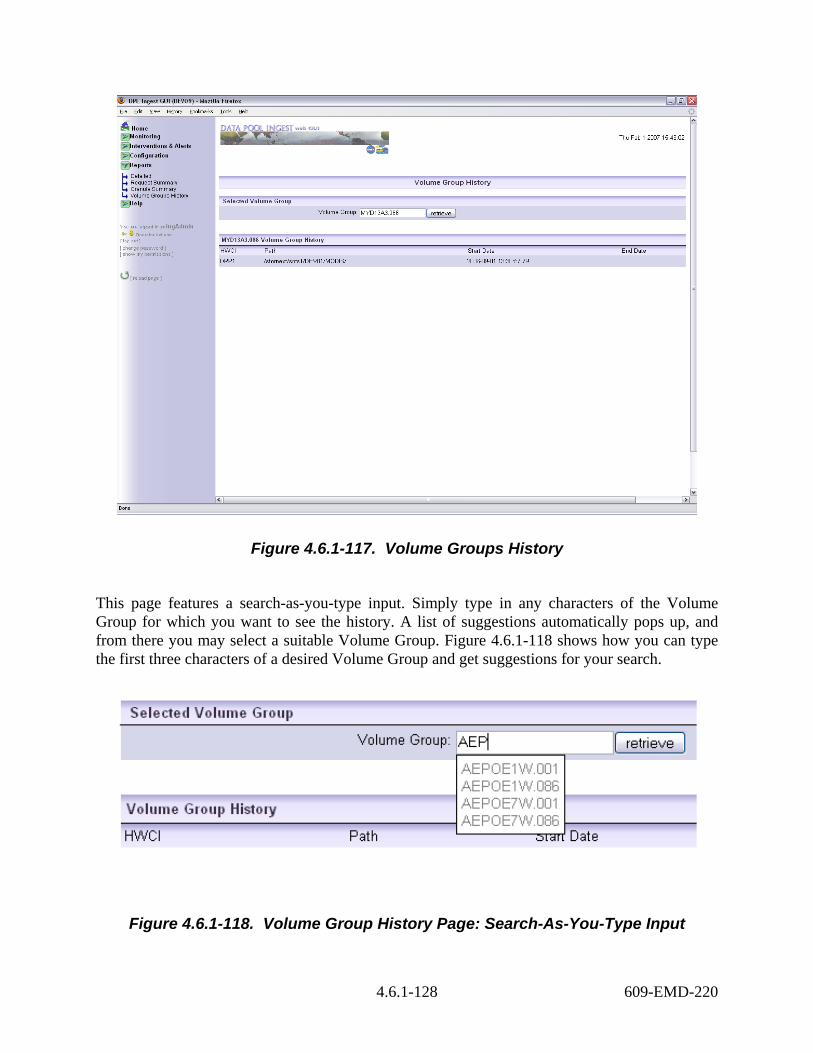
4.6.1-128 609-EMD-220
Figure 4.6.1-117. Volume Groups History
This page features a search-as-you-type input. Simply type in any characters of the Volume Group for which you want to see the history. A list of suggestions automatically pops up, and from there you may select a suitable Volume Group. Figure 4.6.1-118 shows how you can type the first three characters of a desired Volume Group and get suggestions for your search.
Figure 4.6.1-118. Volume Group History Page: Search-As-You-Type Input

4.6.1-129 609-EMD-220
The following figure shows how you can type any sequential characters of the Volume Group and get suggestions for your search (Figure 4.6.1-119).
Figure 4.6.1-119. Search-As-You-Type (Example 2)
Table 4.6.1-35. Volume Groups History Page Field Description Field Name Entry Description
Volume Group (Data Type. Version ID + Volume Group Type Suffix)
Required The name of the Volume Group for which the history report will be generated.
Path System Generated
In reverse chronological order, the fully qualified Unix paths to where data has been stored for the specified data type. The current path is listed first.
HWCI System Generated
The label of the Archive silo group instance that was responsible for storing data of the specified data type.
Start Date System Generated
The date on which this configuration became active for the listed data type.
End Date System Generated
The date on which this configuration was superseded by new configuration information. If blank, this row reflects the current configuration for the volume group. If any row has a blank end date, the volume group is closed, and no further data is accepted for that volume group.

4.6.1-130 609-EMD-220
4.6.1.27 Help Pages and Context Help
4.6.1.27.1 Help Pages The last section found in the navigation bar, the “Help” section, contains information to which the operator can have ready access while operating the Data Pool Ingest GUI. Included in this section are three pages: General Topics, Context Help, and About, as shown in Figure 4.6.1-120.
Figure 4.6.1-120. Help Navigation Section
4.6.1.27.2 General Topics This page includes an index of topics that should be useful to the operator in understanding how the GUI and Data Pool Ingest system work, and is shown in Figure 4.6.1-121. The operator can press on the name of a section from the index in order to jump to the section text.
Figure 4.6.1-121. Help – General Topics
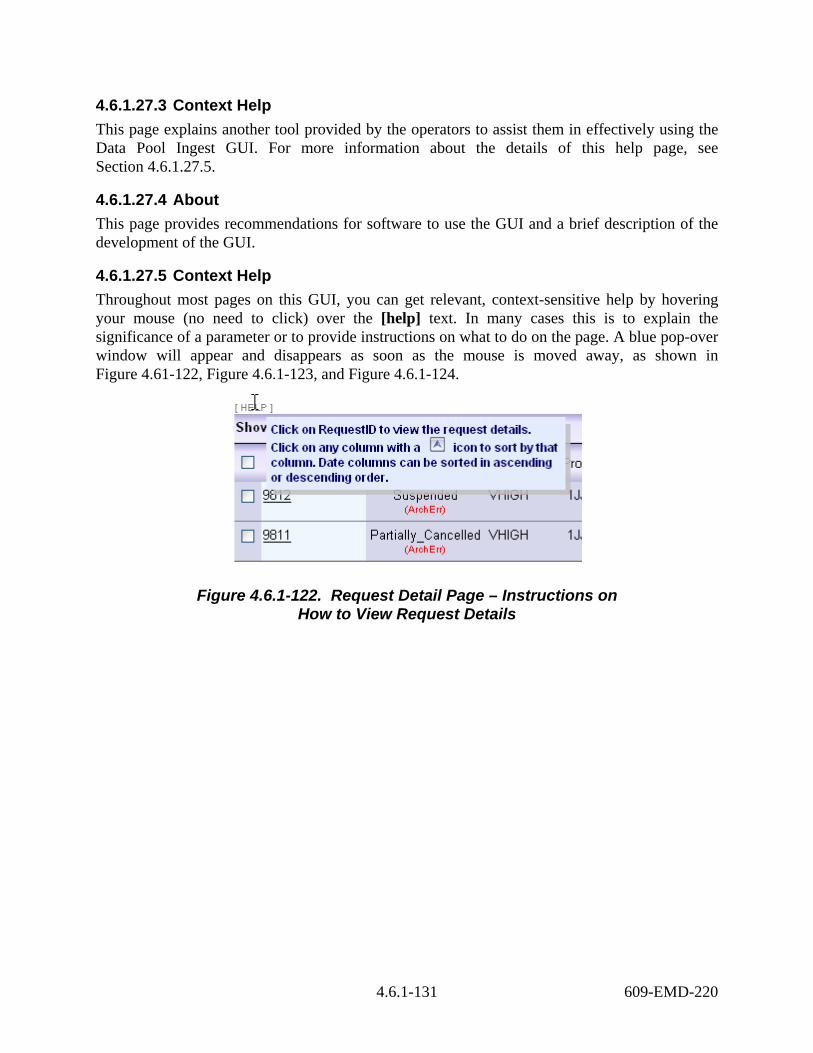
4.6.1-131 609-EMD-220
4.6.1.27.3 Context Help This page explains another tool provided by the operators to assist them in effectively using the Data Pool Ingest GUI. For more information about the details of this help page, see Section 4.6.1.27.5.
4.6.1.27.4 About This page provides recommendations for software to use the GUI and a brief description of the development of the GUI.
4.6.1.27.5 Context Help Throughout most pages on this GUI, you can get relevant, context-sensitive help by hovering your mouse (no need to click) over the [help] text. In many cases this is to explain the significance of a parameter or to provide instructions on what to do on the page. A blue pop-over window will appear and disappears as soon as the mouse is moved away, as shown in Figure 4.61-122, Figure 4.6.1-123, and Figure 4.6.1-124.
Figure 4.6.1-122. Request Detail Page – Instructions on How to View Request Details

4.6.1-132 609-EMD-220
Figure 4.6.1-123. Intervention Monitoring Page – Assistance for Managing Interventions
Figure 4.6.1-124. Provider Detail Configuration Page – Parameter Explanation
4.6.1.28 Browser Requirements The specific browser requirements are stated elsewhere in this document. The recommended browsers are the only ones that should be used, as other browsers may not handle rendering and JavaScript correctly (for example, IE handles some JavaScript differently than Firefox).

4.6.1-133 609-EMD-220
JavaScript must also be enabled to run the application. In most cases, the cache size is automatically set and should be sufficient. Java is not required and need not be enabled in the browser to run the DPL Ingest GUI.

4.6.1-134 609-EMD-220
This page intentionally left blank.