44. origin of seismic reflectors within carbonate-rich
TRANSCRIPT

McKenzie, J.A.. Davies, P.J.. Palmer-JuIson. A ..et a).. 1993. Proceedings of the Ocean Drilling Program, Scientific Results, Vol. 133
44. ORIGIN OF SEISMIC REFLECTORS WITHIN CARBONATE-RICH SEDIMENTS FROM NORTHEASTERN AUSTRALIAN MARGIN1
Richard D. Jarrard2 and Philip A. Symonds3
ABSTRACT
We use continuous velocity records from 12 sites and continuous density records from 9 sites from Ocean Drilling Program (ODP) Leg 133 to examine both direct and indirect controls on seismic reflectors and depth-to-time conversion for the northeastern Australian margin. In these carbonate-rich sediments, the character of both velocity and density appears to be responding primarily to porosity variations and indirectly to lithologic or diagenetic variations. However, we find no consistent empirical relationship between velocity and porosity because of intrasite and intersite variations in style of cementation.
Impedance, the product of velocity and density, is dominated by porosity change throughout the depth range studied, but the mechanism of this control changes: porosity influence on density is an important impedance control in the top 100 meters below seafloor (mbsf), while porosity influence on velocity is most important to deeper impedance variations. This difference arises from the relative insensitivity of velocity to porosity change at the high porosities of the uppermost 50 to 100 mbsf. Because velocity dominates most impedance variations and because velocity and density are locally well correlated, density can be omitted entirely from the calculation of most ODP synthetic seismograms without adverse effects.
Depth-to-time conversion can be based either on matching a synthetic scismogram to the seismic section or on a plot of two-way time vs. depth. Synthetic scismogram character is sensitive not only to the character of velocity variations caused by changes in porosity and diagenesis, but also to wavelet uncertainties and impedance interference patterns. Plots of two-way time vs. depth for these carbonate-dominated sediments are remarkably similar down to 250 mbsf and moderately predictable down to at least 450 mbsf.
INTRODUCTION
Tim e-to-depth and depth-to-tim e conversions are critical elem ents o f Occan Drilling Program (OD P) planning, operations, and drilling interpretations. Sites are chosen on the basis o f seism ic sections, and often target penetration depths are based on tim e-to-depth interpretation o f seism ic horizons. M any seism ic reflectors are not m ajor lithologic boundaries, so it may be difficult to evaluate whether drilling has reached a target horizon. Finally and m ost important, the synthesis o f the w ealth o f drilling data at a site with the three-dim ensional variability detected by seismic surveys requires accurate depth-to- time conversion.
D uring O D P legs, velocity and density logs are routinely used for synthetic seism ogram s and depth-to-tim e conversion, but such logs are only available below -1 0 0 mbsf. In contrast, m easurem ents o f physical properties o f core can be best in about the top 100 mbsf, where the advanced piston corer (APC) yields superior recovery and much less core disturbance than deeper cores obtained with the extended core barrel o r rotary core barrel .Thus, O D P has the potential for a m ore com plete depth-to-tim e conversion and for quality control, based on com parison and m erging o f core and log data.
D uring Leg 133. a rem arkable quantity o f both velocity and density data were gathered. In addition to routine m easurem ents o f velocity and density on a record quantity o f recovered core. 12 sites have velocity logs and nine sites have density logs. A com panion paper (Jarrard el al.. this volum e) details editing and merging o f core and log data that results in 12 m erged velocity logs (Fig. 1) and 9 merged density logs (Fig. 2), with each log extending from the seafloor to within a few m eters o f the bottom o f the hole.
1 McKenzie. J.A.. Davis. P.I., Palmer-Julson, A., et al.. 1993. Proc. ODP, Sci. Results, 133: College Station, TX (Ocean Drilling Program),
" Laniont-Doherty Earth Observatory of Columbia University, Palisades. NY 10964. U.S.A. Present address: Department of Geology and Geophysics. University of Utah. Sail Lake City. UT 84112. U.S.A.
Division of Marine Geosciences. Bureau of Mineral Resources. Geology and Geophysics, P.O. Box 378, Canberra City, ACT 2601, Australia.
Here, we use these m erged logs to address a num ber o f questions. How variable are seismic two-way tim es as a function o f depth? How critical are core velocity m easurements for determ ining such tim e/ depth relationships? Is density information essential for constructing reliable synthetic seism ogram s. o r can they be based on velocities only? How often, on the northeastern Australian margin at least, are seismic reflectors caused by lithologic changes that are readily recognizable in cores? How often are seism ic reflectors caused by interference patterns o f many thin beds, by visually nondescript porosity changes, or by diagenetic horizons? To what extent does porosity control both density and velocity, and does velocity show a consistent relationship to porosity?
The answ ers to these questions have direct concern fo r the northeastern Australian m argin and indirect im plications for seism ic/drilling syntheses in other regions, particularly regions in which the dom inant lithologic com ponent is pelagic carbonate.
DKPTH-TO-TIME CONVERSION
Each velocity log can be converted to a log o f tw o-w ay time as a function o f depth (Fig. 3). If Jarrard et al. (this volume) are correct in concluding that these velocity logs are reliable, then the primary uncertainty in the tw o-w ay-tim e logs is whether the sam pled core and borehole log velocities are representative o f the m uch larger-scale velocity structure seen by seism ic profiling. For layered sediments (such as pelagic carbonates and m ixed terrigenous and carbonate sedim ents), velocities at the borehole are likely to be representative. In contrast, reefs can exhibit substantial lateral variations in vugular porosity along dissolution pathw ays, resulting in local porosities at the borehole that differ from those that m ight be seen by either a nearby borehole o r by a seism ic wave. Fortunately, these occasional differences should not cause system atic bias to the velocity log, and the integrated traveltim e log is relatively insensitive to short-w ave- length velocity excursions.
Accuracy o f the two-way-time plots was independently tested with a chcckshot survey at Site 820 (Davies, M cKenzie, Palmer-Julson, et al., 1991). The two-way seismic traveltime between the shallowest
649

R.D. JARRARD. P.A. SYMONDS
SITE 812 SITE 814 SITE 816 SITE 822
V e l o c i t y ( k m / s )
SITE 817 SITE 823
J .5 2.5 3.5 1.5 2.5 3.5
50
100in
JDE
— 150
Q.a)□
200
250
300
1.5 2.5 3.5 1.5 2.5 3 5
200
400 ■
600
800 ■
1000
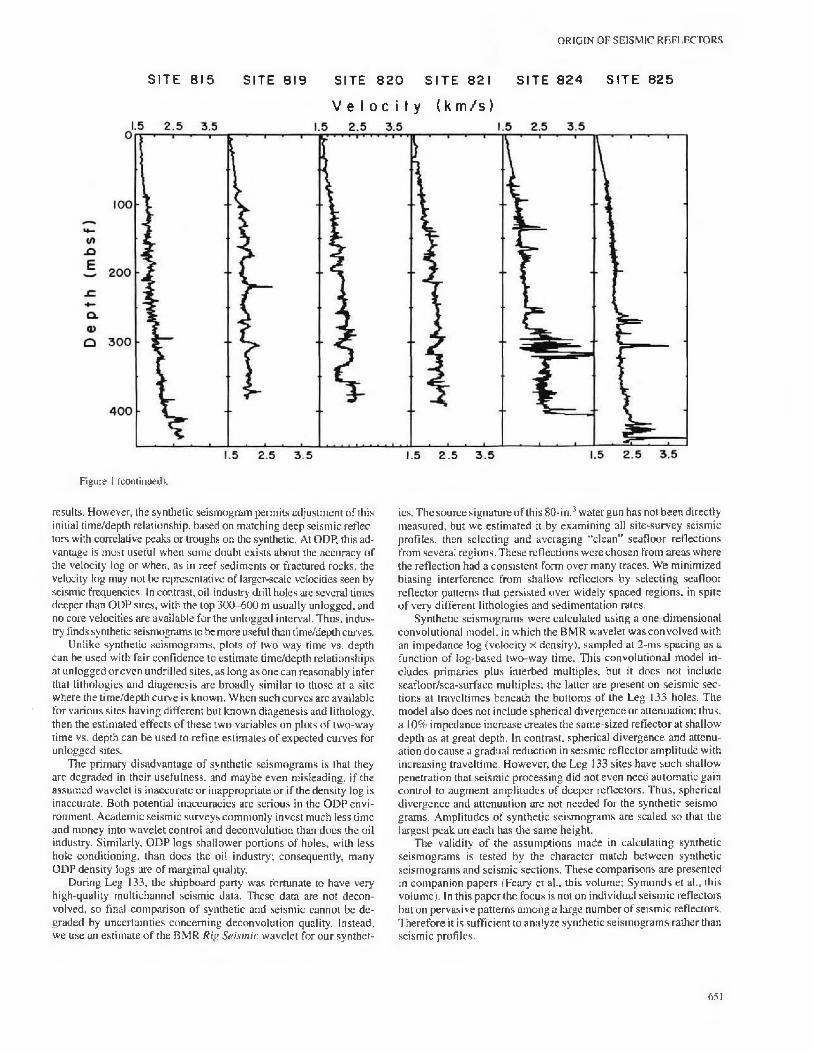
Figure 1. Best estimate of variations of velocity with depih at each site, based on merging of rebound-corrected core velocities with the velocity and pseudovelocity (from resistivity) log (Jarrard et al„ this volume).
(93.8 tnbsf) and deepest (334.6 m bsf) checkshots differs from the log-based tim e by 1.2 ms, approxim ately the accuracy o f individual checkshots and less than the width o f a tim e/depth line in Figure 3.
The two-way-time curves o f Figure 3 are sim ilar in the top 150 m bsf and gradually diverge with greater depth, as the cumulative effects o f i ntersite variations in cem entation and lithology are felt. Clay mineral content has a strong impact on porosity and therefore velocity: the random orientations o f newly deposited platy clay m inerals cause very high porosities o f 50% -90% near the seafloor. Mechanical com paction gradually reorients clay m inerals to a m ore parallel orientation with very low porosity, but the porosity o f clay rich sediments remains higher than that o f sands and carbonates until the overburden is at least0.5 km (Gregory et al„ 1974; Hamilton. 1976). Correspondingly, presence o f clays lowers the velocity o f shallow sediments (e.g., Gregory et al.. 1974; Hamilton, 1979), as is evident in the traveltimes o f Figure 3. Clay m inerals also lower velocity because their rigidity is m uch lower than that o f quartz o r carbonate. For exam ple. Han et al. (1986) found that even a few percent clay is sufficient to substantially decrease the velocity o f sandstones.
Ham ilton (1979) presented em pirical curves o f two-way tim e as a function o f depth for terrigenous and calcareous sediments. At 450 mbsf. he estim ated a two-way tim e in pelagic carbonates o f 475 ms. For terrigenous sedim ents at the same depth, he estim ated a two-way tim e o f 520 ms. In contrast, Carlson et al. (1986) used a different technique to develop a single em pirical curve o f two-way tim e vs. depth, which they inferred to be independent o f lithology. For depths o f <0.5 km, Carlson et al.’s (1986) curve is statistically indistinguishable from H am ilton 's (1979) curve for terrigenous sediments. Site 815, which is predom inantly com posed o f clayey carbonates that are 60% -80% carbonate, has a two-way time at 450 m bsf o f 470 ms, very sim ilar to Ham ilton’s estim ate o f 475 ms for carbonates. Site 823 is m uch richer in clay and averages only about 50% carbonate; its
two-way time of 490 ms is interm ediate between H am ilton’s (1979) pure carbonate and terrigenous curves.
H am ilton's empirical curves are based on deep-sea sediments in which mechanical compaction is the dominant mode o f porosity reduction in the top 200 m. For the pelagic carbonate sediments from Ontong Java Plateau considered by Hamilton (1979). diagenesis begins at about 150 m bsf and increases gradually with depth (M oberly et al., 1986). Schlanger and Douglas (1974) found a sim ilar diagenetic pattern in o ther pelagic carbonates. In contrast, diagenesis is m uch more pervasive in Leg 133 carbonates. Velocity evidence for this diagcncsis comes partly from the observation that two-way tim es o f 430 -4 4 0 ms at 450 m bsf at carbonatc Sites 817 and 825 are -1 0 % less than Ham ilton’s values, while other carbonate sites are even faster (Fig. 3). Primarily, however, diagenesis is evident in both velocity and density logs as a profusion o f mostly thin, very dense and fast beds (Figs. 1 and 2).
The dense and heterogeneous reef lim estones o f Sites 8 12 and 816 exhibit the most extreme departures o f two-way time from the overall carbonate trend (Fig. 3). At both sites, the downward transition from pelagic carbonate to recrystallized reef carbonate occurs at such shallow depths that even by 200 m bsf their two-way times are 2 5 -4 0 ms less than tim es at the other 10 sites. Because the extent o f reef diagenesis, and particularly post-diagenetic porosity, varies so dramatically from site to site (e.g.. Figs. 1 and 2), the reefal carbonate time/depth curves from Sites 812 and 816 should not be used to estimate the time/depth curves that might apply at other, unlogged reef carbonate sites.
SYNTHETIC SEISMOGRAMS
Com pared to tim e/depth curves, synthetic scism ogram s have both advantages and disadvantages as a m eans o f linking site depth to seism ic sections. Each synthetic seism ogram uses the same velocity inform ation as the tim e/depth curve, leading to identical tim e/depth
650
ORIGIN OF SEISMIC REFLECTORS
SITE 815 SITE 819 SITE 8 2 0 SITE 821 SITE 824 SITE 825
V e l o c i t y ( k m / s )
Figure I (continued).
results. However, ihe synthetic seism ogram permits adjustment o f this initial time/depth relationship, based on m atching deep seismic reflectors with correlative peaks o r troughs on the synthetic. At ODP, this advantage is most useful when som e doubt exists about the accuracy of the velocity log o r when, as in reef sediments o r fractured rocks, the velocity log may not be representative o f larger-scale velocities seen by seismic frequencies. In contrast, oil-industry drill holes arc several times deeper than ODP sites, with the top 300-600 m usually unlogged, and no core velocities are available for the unlogged interval. Thus, industry finds synthetic seismograms to be more useful than time/depth curves.
Unlike synthetic seism ogram s. plots o f two-way time vs. depth can be used with fair confidence to estim ate tim e/depth relationships at unlogged o r even undrilled sites, as long as one can reasonably infer that lithologies and diagenesis are broadly sim ilar to those at a site where the tim e/depth curve is known. W hen such curves are available for various sites having different but known diagenesis and lithology. then the estim ated effects o f these two variables on plots o f two-way time vs. depth can be used to refine estim ates o f expected curves for unloggcd sites.
The primary disadvantage o f synthetic seism ogram s is that they are degraded in their usefulness, and m aybe even m isleading, if the assum ed wavelet is inaccurate o r inappropriate o r i f the density log is inaccurate. Both potential inaccuracies are serious in the O D P environm ent. Academ ic seism ic surveys com m only invest m uch less time and m oney into wavelet control and deconvolution than docs the oil industry. Similarly, O D P logs shallow er portions o f holes, with less hole conditioning, than does the oil industry; consequently, many O D P density logs are o f m arginal quality.
During Leg 133, the shipboard party was fortunate to have very high-quality multichannel seismic data. These data are not deconvolved, so final comparison o f synthetic and seism ic cannot be degraded by uncertainties concerning deconvolution quality. Instead, we use an estim ate o f the BMR Rig Seism ic w avelet for our synthet
ics. The source signature o f this 80-in.3 w ater gun has not been directly m easured, but we estim ated it by exam ining all site-survey seismic profiles, then selecting and averaging "clean” seafloor reflections from several regions. These reflections were chosen from areas where the reflection had a consistent form over m any traces. We minim ized biasing interference from shallow reflectors by selecting seafloor reflector patterns that persisted over widely spaced regions, in spite o f very different lithologies and sedim entation rates.
Synthetic seism ogram s were calculated using a one-dim ensional convolutional model, in which the BM R wavelet was convolved with an impedance log (velocity x density), sam pled at 2-m s spacing as a function o f log-based two-w'ay time. This convolutional model includes prim aries plus interbed m ultiples, but it does not include seafloor/sea-surface m ultiples; the latter are present on seism ic sections at traveltim es beneath the bottom s o f the Leg 133 holes. The model also does not include spherical divergence o r attenuation; thus, a 10% im pedance increase creates the sam e-sized reflector at shallow depth as at great depth. In contrast, spherical divergence and attenuation do cause a gradual reduction in seism ic reflector am plitude with increasing traveltime. However, the Leg 133 sites have such shallow penetration that seism ic processing did not even need autom atic gain control to augm ent am plitudes o f deeper reflectors. Thus, spherical divergence and attenuation arc not needed for the synthetic seism ograms. A m plitudes o f synthetic seism ogram s are scaled so that the largest peak on each has the sam e height.
The validity o f the assum ptions made in calculating synthetic seism ogram s is tested by the character m atch betw een synthetic seism ogram s and seism ic sections. These com parisons are presented in com panion papers (Feary et al., this volume; Sym onds et al., this volum e). In this paper the focus is not on individual seism ic reflectors but on pervasive patterns am ong a large num ber o f seism ic reflectors. Therefore it is sufficient to analyze synthetic seism ogram s rather than seism ic profiles.
651
R.D. JARRARD. PA. SYMONDS
SITE 812 SITE 814 SITE 816 SITE 817 SITE 823
D e n s i t y (q / c m 3 )
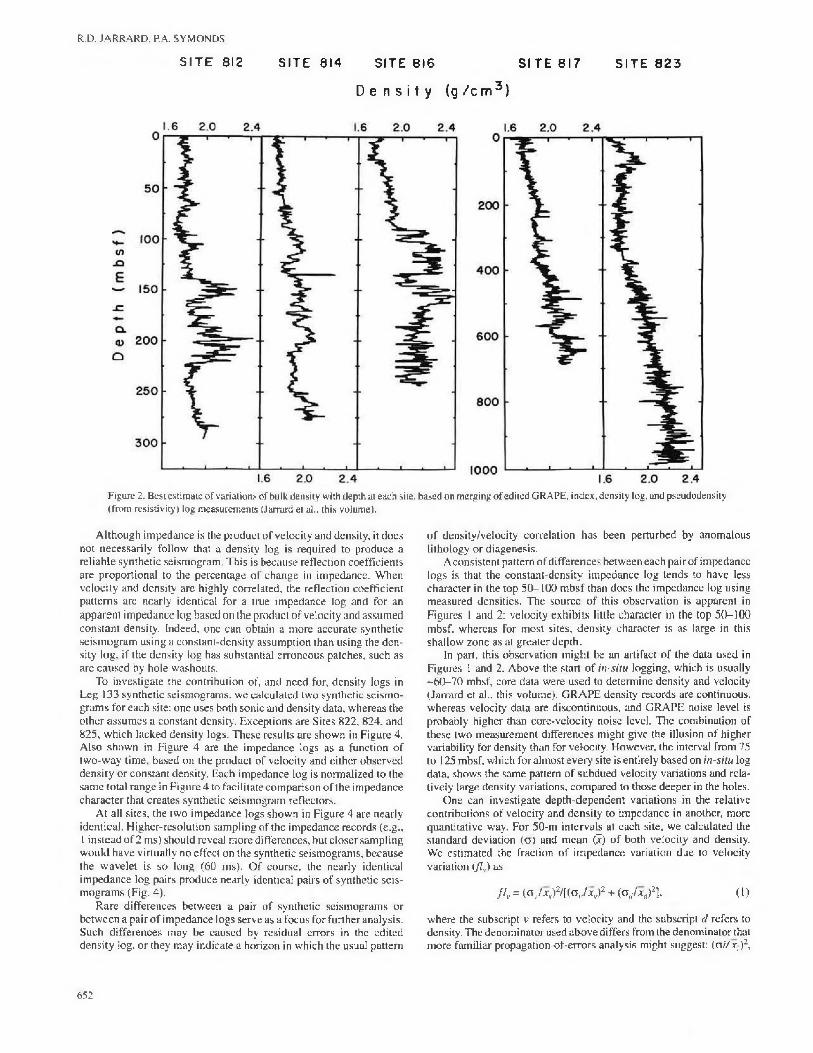
Figure 2. Best estimate of variations of bulk density with depth at each site, based on merging of edited GRAPE, index, density log. and pscudodensity (from resistivity) log measurements (Jarrard et al.. this volume).
Although im pedance is the product o f velocity and density, it docs not necessarily follow that a density log is required to produce a reliable synthetic seismogram. This is because reflection coefficients are proportional to the percentage o f change in impedance. W hen velocity and density arc highly correlated, the reflection coefficient patterns are nearly identical for a true impedance log and for an apparent impedance log based on the product o f velocity and assum ed constant density. Indeed, one can obtain a more accurate synthetic seism ogram using a constant-density assum ption than using the density log. if the density log has substantial erroneous patches, such as are caused by hole washouts.
To investigate the contribution of, and need for, density logs in Leg 133 synthetic seism ogram s, we calculated two synthetic seism ogram s for each site: one uses both sonic and density data, whereas the o ther assum es a constant density. Exceptions are Sites 822. 824. and 825, which lacked density logs. These results are shown in Figure 4. Also show n in Figure 4 are the impedance logs as a function o f tw o-w ay tim e, based on the product o f velocity and either observed density or constant density. Each impedance log is norm alized to the sam e total range in Figure 4 to facilitate com parison o f the im pedance character that creates synthetic seism ogram reflectors.
A t ail sites, the two im pedance logs show n in Figure 4 are nearly identical. H igher-resolution sam pling of the im pedance records (e.g.. 1 instead o f 2 m s) should reveal m ore differences, but closer sam pling w ould have virtually no effect on the synthetic seism ogram s, because the w avelet is so long (60 ms). O f course, the nearly identical im pedance log pairs produce nearly identical pairs o f synthetic seism ogram s (Fig. 4).
R are differences between a pair o f synthetic seism ogram s or betw een a pair o f impedance logs serve as a focus for further analysis. Such differences may be caused by residual errors in the edited density log, or they may indicate a horizon in which the usual pattern
o f density/velocity correlation has been perturbed by anomalous lithology or diagenesis.
A consistent pattern o f differences betw een each pair o f impedance logs is that the constant-density im pcdance log tends to have less character in the top 5 0 -1 0 0 m b sf than does the im pedance log using m easured densities. The source o f this observation is apparent in Figures 1 and 2: velocity exhibits little character in the top 5 0 -100 m bsf. w hereas for m ost sites, density character is as large in this shallow zone as at greater depth.
In part, this observation m ight be an artifact o f the data used in Figures 1 and 2. Above the start o f in-situ logging, which is usually -6 0 -7 0 mbsf, core data were used to determine density and velocity (Jarrard et al., this volume). G R A PE density records are continuous, whereas velocity data are discontinuous, and GRA PE noise level is probably higher than core-velocity noise level. The combination of these two measurement differences might give the illusion o f higher variability for density than for velocity. However, the interval from 75 to 125 mbsf, which for alm ost every site is entirely based on in-situ log data, shows the same pattern o f subdued velocity variations and relatively large density variations, com pared to those deeper in the holes.
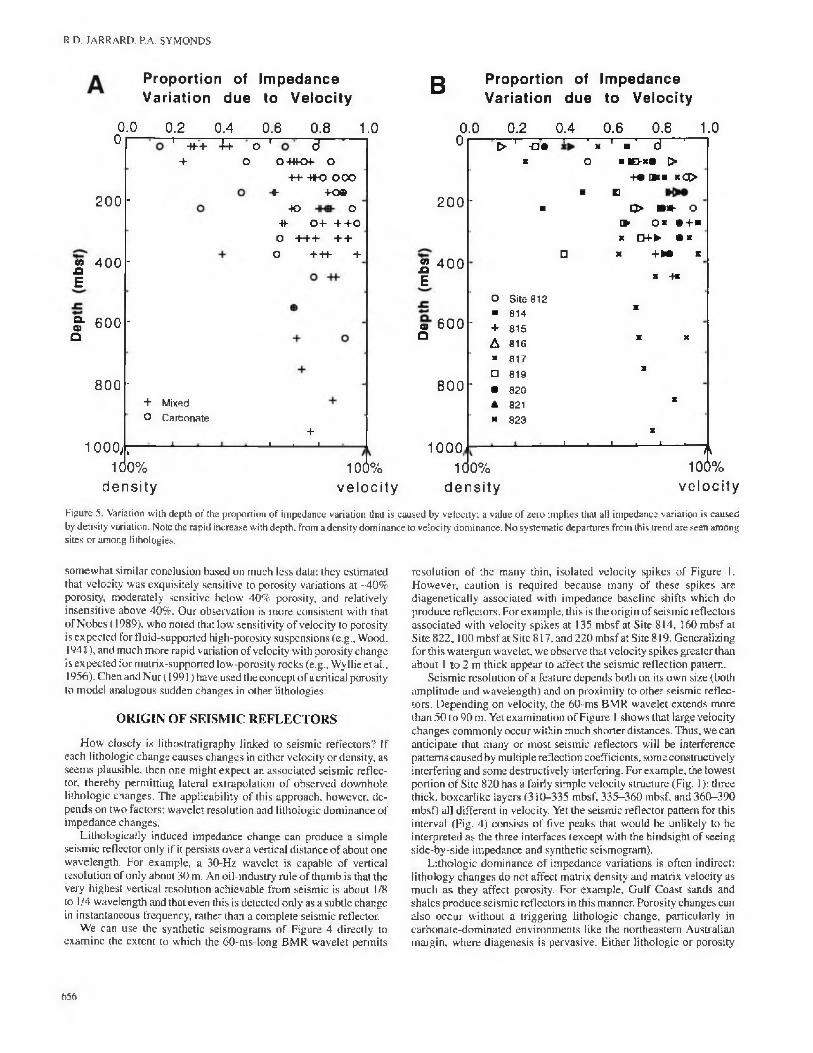
One can investigate depth-dependent variations in the relative contributions o f velocity and density to impcdance in another, more quantitative way. For 50-m intervals at each site, we calculated the standard deviation ( a ) and m ean (I) o f both velocity and density. Wc estim ated the fraction o f im pedance variation due to velocity variation (/?,.) as
//, = «Jv/x,)2/[(Ov/jtv)2 + «sdtxd)2], (1)
where the subscript v refers to velocity and the subscript d refers to density. The denom inator used above differs from the denom inator that m ore fam iliar propagation-of-errors analysis m ight suggest: (a i /x ,)1.
652
SITE 815 SITE 819 SITE 820 SITE 821
D e n s i t y ( g / c m 3 )
ORIGIN OH SEISMIC REFLECTORS
1.6 2.0 2.4 1.6 2.0 2.4
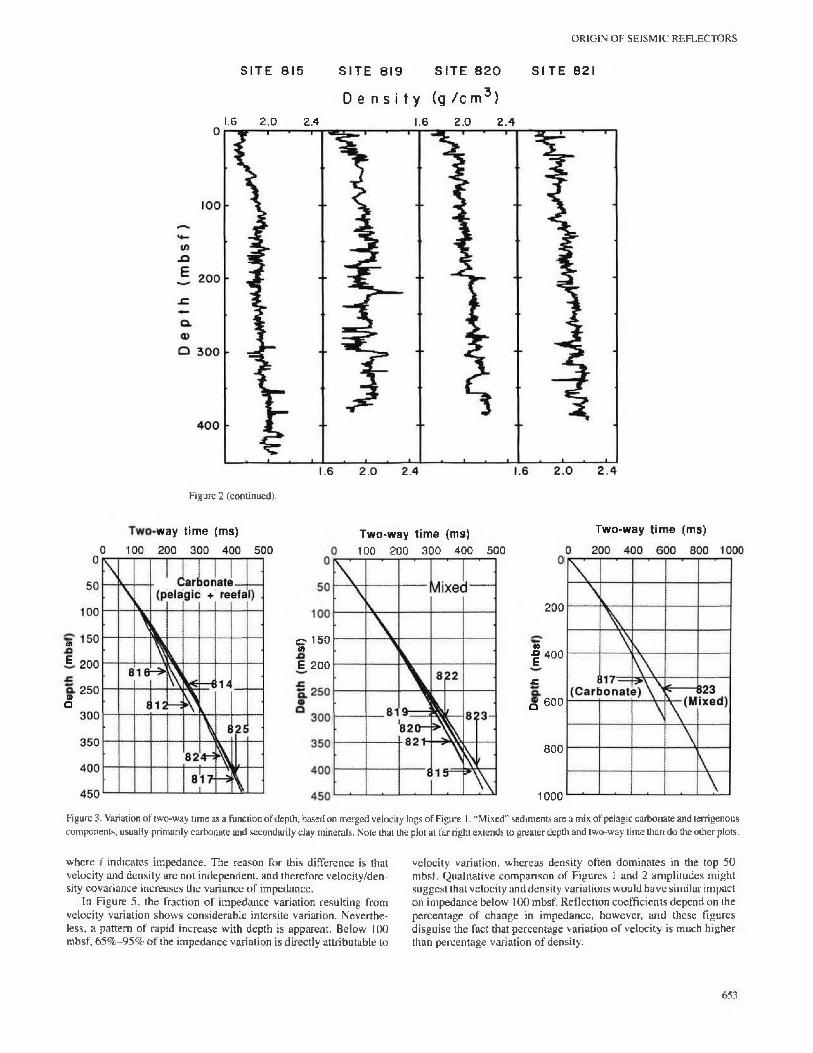
Figure 2 (continued).
«E
a>a
Figured. Variation of two-way time as a function of depth, based on merged velocity logs of Figure I. "Mixed" sediments are a mix of pelagic carbonate and terrigenous components, usually primarily carbonate and secondarily clay minerals. Note that the plot at far right extends to greater depth and two-way time than do the other plots.
where / indicates impedance. The reason for this difference is that velocity and density are not independent, and therefore velocity/density covariance increases the variance o f impedance.
In Figure 5, the fraction o f im pedance variation resulting from velocity variation shows considerable intcrsite variation. N evertheless, a pattern o f rapid increase with depth is apparent. Below 100 mbsf, 65% -95% o f the impedance variation is directly attributable to
velocity variation, whereas density often dom inates in the top 50 mbsf. Qualitative com parison o f Figures 1 and 2 am plitudes might suggest that velocity and density variations would have sim ilar impact on impedance below 100 mbsf. Reflection coefficients depend on the percentage o f change in im pedance, however, and these figures disguise the fact that percentage variation o f velocity is m uch higher than percentage variation o f density.
way time (ms) Two-way time (ms)
200
■| 400
■C£ 600
800
1000
Two-way time (ms)100 200 300 400 500
C- 150 #>E 200
653
R.D. JARRARD. P.A. SYMONDS
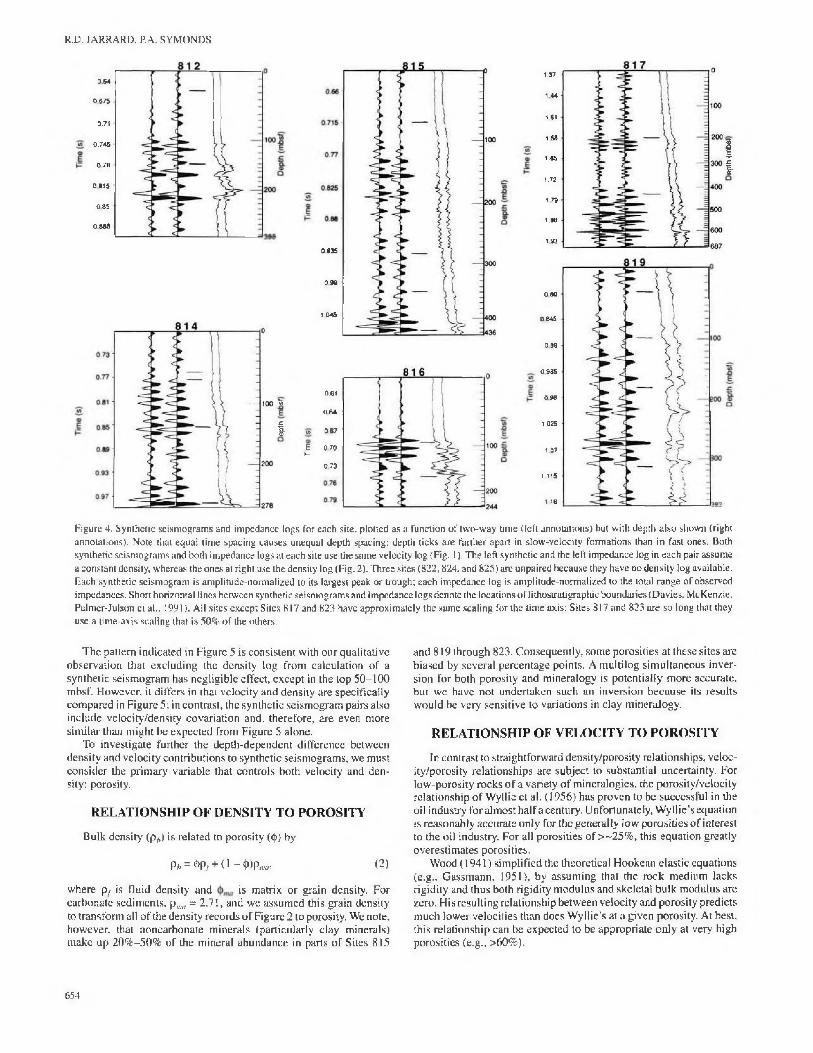
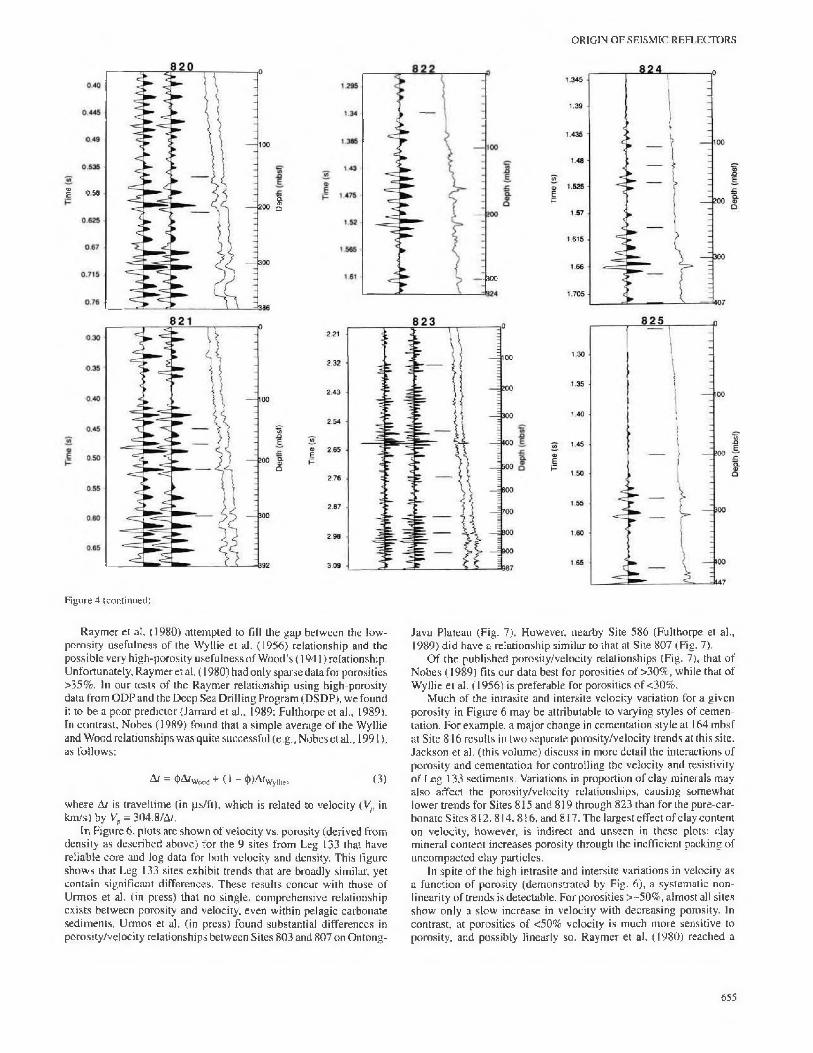
Figure 4. Synthetic seismograms and impedance logs for each site, plotted as a function of Iwo-way time (left annotations) but with depth also shown (right annotations). Note lhat equal lime spacing causes unequal depth spacing: depth ticks are farther apart in slow-velocity formations than in fast ones. Both synthetic seismograms and both impedance logs at each site use the same velocity log (Fig. 1). The left synthetic and the left impedance log in each pair assume a constant density, whereas the ones at right use the density log (Fig. 2). Three sites (822.824, and 825) are unpaired because they have no density log available. Each synthetic scismogram is amplitude-normalized to its largest peak or trough; each impedance log is amplitude-normalized to the total range of observed impedances. Short horizontal lines between synthetic seismograms and impedance logs denote the locations oflithostratigraphic boundaries (Davies. McKenzie. Palmer-Julson et al.. 1991). All sites except Sites 817 and 823 have approximately the same scaling for the lime axis: Sites 817 and 823 are so long lhat they use a time-axis scaling that is 50% of the others.
0 935
0 90
1 045
M lVt
064■Cf » 067
I 070 l-079
T he pattern indicated in Figure 5 is consistent with our qualitative observation lhat excluding the density log from calculation o f a synthetic seism ogram has negligible effect, except in the top 5 0 -100 mbsf. However, it differs in lhat velocity and density arc specifically com pared in Figure 5; in contrast, the synthetic seism ogram pairs also include velocity/density covariation and, therefore, are even more sim ilar than m ight be expected from Figure 5 alone.
To investigate further the depth-dependent difference between density and velocity contributions to synthetic seism ogram s, we must consider the prim ary variable that controls both velocity and density: porosity.
RELATIONSHIP OF DENSITY TO POROSITY
Bulk density (p fc) is related to porosity (<|>) by
P i = <t>P/-+(l - W p * . (2)
where pf is fluid density and is matrix o r grain density. For carbonate sedim ents, p„„, = 2.71, and we assum ed this grain density to transform all o f the density records o f Figure 2 to porosity. We note, however, that noncarbonate m inerals (particularly clay minerals) make up 20% -50% o f the m ineral abundance in parts o f Sites 815
and 819 through 823. Consequently, som e porosities at these sites are biased by several percentage points. A m ultilog sim ultaneous inversion for both porosity and m ineralogy is potentially m ore accurate, but w e have not undertaken such an inversion because its results w ould be very sensitive to variations in clay mineralogy.
RELATIONSHIP OF VELOCITY TO POROSITY
In contrast to straightforward density/porosity relationships, velocity/porosity relationships are subject to substantial uncertainty. For low -porosity rocks o f a variety o f m ineralogies, the porosity/velocity relationship o f W yllie et al. (1956) has proven to be successful in theoil industry for alm ost ha lf a century. U nfortunately, W yllie’s equation is reasonably accurate only for ihc generally low porosities o f interest to the oil industry. For all porosities o f >~25% , this equation greatly overestim ates porosities.
Wood (1941) sim plified the theoretical Hookean elastic equations (e.g., G assm ann, 1951), by assum ing that the rock m edium lacks rigidity and thus both rigidity m odulus and skeletal bulk m odulus are zero. His resulting relationship betw een velocity and porosity predicts m uch lower velocities than does W yllie's at a given porosity. At best, this relationship can be expected to be appropriate only at very high porosities (e.g., >60% ).
064
0 675
0.71
0.745
07 8
0815
085
0885
137
1.44
1 51
1 58
1.85
1.72
1 79
186 1 93
080
0 845
089
0 935
098
1 025
1 07
1 115
1 16
1I
654
ORIGIN OF SEISMIC REFLECTORS
| 058
Figure 4 (continued).
Raym er et al. (1980) attem pted to fill the gap between the low- porosity usefulness o f the W yllie et al. (1956) relationship and the possible very high-porosity usefulness o f W ood’s (1941) relationship. Unfortunately, R aym er et al. (1980) had only sparse data for porosities >35% . In our tests o f the R aym er relationship using high-porosity data from O D P and the D eep Sea D rilling Program (DSDP), w e found it to be a poor predictor (Jarrard et al., 1989: Fulthorpe et al., 1989). In contrast. N obes (1989) found that a sim ple average o f the W yllie and W ood relationships was quite successful (e.g., Nobes et al., 19 9 1), as follows:
At = i()A/Wood + (1 - (ji)A/Wyi|je, (3)
w here At is traveltim e (in |is/ft), which is related to velocity (V;, in km /s) by Vp = 304.8/A/.
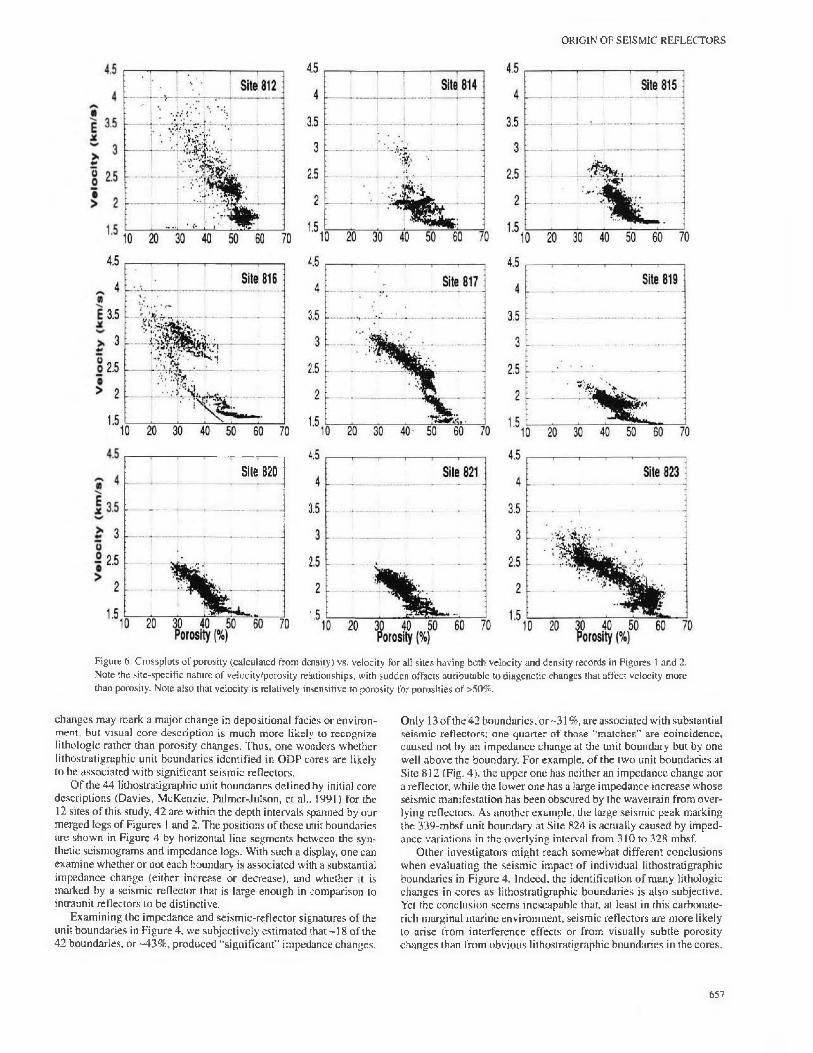
In Figure 6, plots are show n o f velocity vs. porosity (derived from density as described above) for the 9 sites from Leg 133 that have reliable core and log data for both velocity and density. T his figure show s that Leg 133 sites exhibit trends that are broadly similar, yet contain significant differences. T hese results concur with those o f U rm os et al. (in press) that no single, com prehensive relationship exists between porosity and velocity, even within pelagic carbonate sedim ents. Urm os et al. (in press) found substantial differences in porosity/velocity relationships betw een Sites 803 and 807 on Ontong-
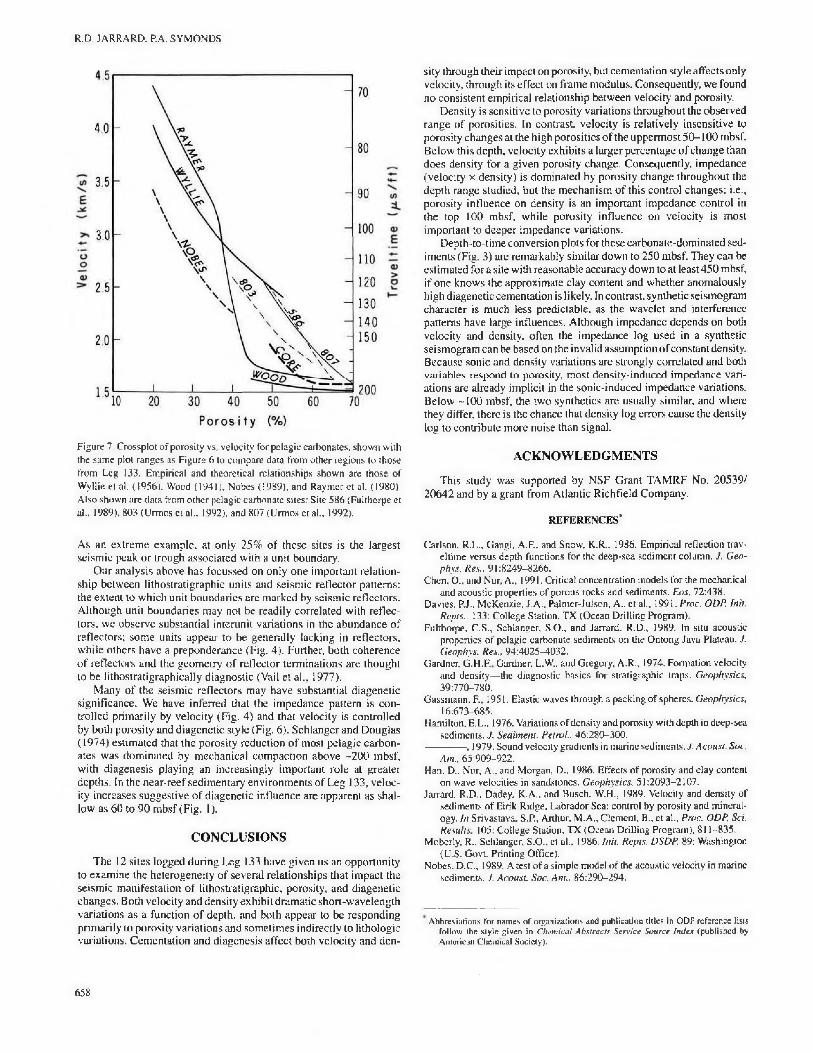
Java Plateau (Fig. 7). However, nearby Site 586 (Fulthorpe et al., 1989) did have a relationship sim ilar to that at Site 807 (Fig. 7).
O f the published porosity/velocity relationships (Fig. 7), that o f N obes (1989) fits our data best for porosities o f >30% , while that o f W yllie e t al. (1956) is preferable for porosities o f <30% .
M uch o f the intrasite and intersite velocity variation for a given porosity in Figure 6 may be attributable to varying styles o f cem entation. For exam ple, a m ajor change in cem entation style at 164 m bsf at Site 816 results in two separate porosity/velocity trends at this site. Jackson et al. (this volum e) discuss in more detail the interactions o f porosity and cem entation for controlling the velocity and resistivity o f Leg 133 sedim ents. Variations in proportion o f clay m inerals may also affect the porosity/velocity relationships, causing som ewhat lower trends for Sites 815 and 819 through 823 than for the pure-car- bonatc S ites 8 1 2 .8 14 ,8 1 6 , and 817. The largest effect o f clay content on velocity, however, is indirect and unseen in these plots: clay m ineral content increases porosity through the inefficient packing of uncom pacted clay particles.
In spite o f the high intrasite and intersite variations in velocity as a function o f porosity (dem onstrated by Fig. 6), a system atic nonlinearity o f trends is detectable. For porosities >~50% , alm ost all sites show only a slow increase in velocity with decreasing porosity. In contrast, at porosities o f <50% velocity is m uch more sensitive to porosity, and possibly linearly so. Raym er et al. (1980) reached a
1o
— wo
655
R.D. JARRARD. P.A. SYMONDS
Proportion of Impedance Variation due to Velocity
0.0 0
0.2 —i—
0.4 0.6T
-H- + T + O + O
wAE
CLQ>Q
200 ■
4 00 -
600 -
800 *
0.8 1.0 3 T
O + H O f O
+ + -HK) OOO »- +o®
-tO O-If O + + + 0o +++ + +
O +-H- +
+ Mixed O Carbonate
1000 /;— 100%
d e n s i t y
+i a___ I—
g Proportion of Impedance Variation due to Velocity
0.0 0
0.2 0.4 0.6 0.8 1.0
200
COnE
©O
4 0 0
600
800 -
1000 ,
> ' -D * ’ x ' ■ ’ d 'X O ■ « - * • >
-m
■+ • » ■ x Ct>
Ot> mm- o
□
» o s • + ■ * □+► • *
x + * • x
o■
■ +
Site 812814815
* -Hi
X
A 816X X
1 X
□817819
1
* • 820A 821
X
' M 823
1 *
XI . 1 . -----
A100%
v e l o c i t y100%
d e n s i t y1 0 6%
v e l o c i t y
Figure 5. Variation with depth of the proportion of impedance variation that is caused by velocity: a value of zero implies that all impedance variation is caused by density variation. Note the rapid increase with depth, from a density dominance to velocity dominance. No systematic departures from this trend are seen among sites or among lithologies.
som ewhat sim ilar conclusion based on much less data: they estimated that velocity was exquisitely sensitive to porosity variations at -40% porosity', m oderately sensitive below 40% porosity, and relatively insensitive above 40%. O ur observation is more consistent with that o f N obes (1989), who noted lhat low sensitivity o f velocity to porosity is expccted for fluid-supported high-porosity suspensions (e.g.. Wood. 1941), and much more rapid variation o f velocity with porosity change is expected for m atrix-supported low-porosity rocks (e.g., Wyllie et al., 1956). Chen and N ur (1991) have used the concept o f a critical porosity to m odel analogous sudden changes in other lithologies.
ORIGIN OF SEISMIC REFLECTORS
H ow closely is lithostratigraphy linked to seism ic reflectors? Ff each lithologic change causes changes in either velocity o r density, as seem s plausible, then one might expect an associated seism ic reflector, thereby permitting lateral extrapolation o f observed dow nhole lithologic changes. The applicability o f this approach, however, depends on two factors: wavelet resolution and lithologic dom inance o f im pedance changes.
Lithologically induced impedance change can produce a simple seism ic reflector only if it persists over a vertical distance o f about one wavelength. For exam ple, a 30-Hz wavelet is capable o f vertical resolution o f only about 30 m. An oil-industry rule o f thum b is that the very highest vertical resolution achievable from seismic is about 1/8 to 1/4 wavelength and that even this is detected only as a subtle change in instantaneous frequency, rather than a complete seismic reflector.
We can use the synthetic seism ogram s o f Figure 4 directly to exam ine the extent to which the 60-m s-long B M R wavelet permits
resolution o f the many thin, isolated velocity spikes o f Figure I. How ever, caution is required because m any o f these spikes are diagenetically associated with im pedance baseline shifts which do produce reflectors. For exam ple, this is the origin o f seism ic reflectors associated with velocity spikes at 135 m bsf at Site 814, 160 m bsf at Site 8 2 2 ,1 0 0 m bsf at Site 817, and 220 m bsf at Site 819. G eneralizing for this w atergun w avelet, we observe that velocity spikes greater than about 1 to 2 m thick appear to affect the seism ic reflection pattern.
Seism ic resolution o f a feature depends both on its ow n size (both am plitude and w avelength) and on proximity to other seism ic reflectors. D epending on velocity, the 60-m s BM R w avelet extends more than 50 to 90 m. Yet exam ination o f Figure I shows that large velocity changes comm only occur within m uch shorter distances. Thus, we can anticipate that many o r m ost seism ic reflectors will be interference patterns caused by m ultiple reflection coefficients, some constructively interfering and some destructively interfering. For exam ple, the lowest portion o f Site 820 has a fairly sim ple velocity structure (Fig. 1): three thick, boxcarlike layers (310-335 mbsf, 335-360 mbsf, and 360-390 m bsf) all different in velocity. Yet the seismic reflector pattern for this interval (Fig. 4) consists o f five peaks that would be unlikely to be interpreted as the three interfaces (except with the hindsight o f seeing side-by-side impedance and synthetic seismogram).
Lithologic dom inance o f im pedance variations is often indirect: lithology changes do not affect m atrix density and matrix velocity as m uch as they affect porosity. For exam ple. G ulf C oast sands and shales produce seism ic reflectors in this manner. Porosity changes can also occur without a triggering lithologic change, particularly in carbonate-dom inated environm ents like the northeastern Australian m argin, where diagenesis is pervasive. E ither lithologic o r porosity
656
ORIGIN OF SEISMIC REFLECTORS
Figure 6. Crossplots of porosity (calculated from density) vs. velocity for all sites having both velocity and density records in Figures I and 2. Note the site-specific nature of velocity/porosity relationships, with sudden offsets attributable to diagenetic changcs that affect velocity more than porosity. Note also that velocity is relatively insensitive to porosity for porosities of >50%.
changcs may mark a m ajor change in depositional facies o r environment, but visual core description is m uch more likely to recognize liihologic rather than porosity changes. Thus, one wonders whether lithostratigraphic unit boundaries identified in O D P cores are likely to be associated with significant seism ic reflectors.
O f the 44 lithostratigraphic unit boundaries defined by initial core descriptions (Davies, M cKenzie, Palmer-Julson, et al., 1991) for the12 sites o f this study. 42 are within the depth intervals spanned by our merged logs o f Figures I and 2. The positions o f these unit boundaries are shown in Figure 4 by horizontal line segments between the synthetic seism ogram s and impedance logs. With such a display, one can exam ine whether o r not each boundary is associated with a substantial impedance change (either increase o r decrease), and w hether it is marked by a seismic reflector that is large enough in comparison to intraunit reflectors to be distinctive.
Exam ining the impedance and seism ic-reflector signatures o f the unit boundaries in Figure 4 , we subjectively estim ated that ~ 18 o f the 42 boundaries, o r -4 3 % , produced “significant" impedance changes.
Only 13 o f the 42 boundaries, o r ~ 3 1 %, are associated with substantial seism ic reflectors; one quarter o f those "m atches” are coincidence, caused not by an im pedance change at the unit boundary but by one well above the boundary. For example, o f the two unit boundaries at Site 812 (Fig. 4). the upper one has neither an im pedance change nor a reflector, while the lower one has a large im pedance increase whose seism ic m anifestation has been obscured by the wavetrain from overlying reflectors. As another exam ple, the large seism ic peak marking the 339-m bsf unit boundary at Site 824 is actually caused by impedance variations in the overlying interval from 310 to 328 mbsf.
O ther investigators m ight reach som ewhat different conclusions when evaluating the seismic impact o f individual lithostratigraphic boundaries in Figure 4. Indeed, the identification o f m any lithologic changes in cores as lithostratigraphic boundaries is also subjective. Yet the conclusion seems inescapable that, at least in this carbonate- rich marginal m arine environm ent, seismic reflectors are m ore likely to arise from interference effects or from visually subtle porosity changes than from obvious lithostratigraphic boundaries in the cores.
Site 820
_ ..... .........
657
R.D. JARRARD. P.A. SYMONDS
Figure 7. Crossplot of porosity vs. velocity for pclagic carbonates, shown with the same plot ranges as Figure 6 to compare data from other regions to those from Leg 133. Empirical and theoretical relationships shown arc those of Wyllie et al. (1956). Wood (1941). Nobes (1989). and Raymer et al. (1980). Also shown are data from other pclagic carbonate sites: Site 586 (Fulthorpe ct al., 1989). 803 (Urmos et al., 1992), and 807 (Urmos et al., 1992).
As an extrem e exam ple, at only 25% o f these sites is the largest seism ic peak or trough associated with a unit boundary.
O ur analysis above has focussed on only one im portant relationship between lithostratigraphic units and seism ic reflector patterns: the extent to w hich unit boundaries are marked by seism ic reflectors. A lthough unit boundaries may not be readily correlated with reflectors, we observe substantial interunit variations in the abundance o f reflectors; som e units appear to be generally lacking in reflectors, while others have a preponderance (Fig. 4). Further, both coherence o f reflectors and the geom etry o f reflector term inations are thought to be lithostratigraphically diagnostic (Vail et al.. 1977).
M any o f the seismic reflectors may have substantial diagenetic significance. We have interred that the im pedance pattern is controlled prim arily by velocity (Fig. 4) and that velocity is controlled by both porosity and diagenetic style (Fig. 6). Schlanger and Douglas (1974) estim ated that the porosity reduction o f most pelagic carbonates w as dom inated by m echanical com paction above -2 0 0 mbsf, w ith diagenesis playing an increasingly im portant role al greater depths. In the near-reef sedim entary environm ents o f Leg 133, velocity increases suggestive o f diagenetic influence are apparent as shallow as 60 to 90 m bsf (Fig. 1).
CONCLUSIONS
The 12 sites logged during Leg 133 have given us an opportunity to exam ine the heterogeneity o f several relationships that impact the seism ic m anifestation o f lithostratigraphic. porosity, and diagenetic changes. Both velocity and density exhibit dram atic short-w avelength variations as a function o f depth, and both appear to be responding prim arily to porosity variations and som etim es indirectly to lithologic variations. Cem entation and diagenesis affect both velocity and den
sity through their impact on porosity, but cementation style affects only velocity, through its effect on frame modulus. Consequendy, we found no consistent empirical relationship between velocity and porosity.
Density is sensitive to porosity variations throughout the observed range o f porosities. In contrast, velocity is relatively insensitive to porosity changes at the high porosities o f the upperm ost 5 0 -1 0 0 mbsf. Below this depth, velocity exhibits a larger percentage o f change than does density for a given porosity change. Consequently, im pedance (velocity x density) is dom inated by porosity change throughout the depth range studied, but the m echanism o f this control changes; i.e., porosity influence on density is an im portant impedance control in the top 100 mbsf, while porosity influence on velocity is most im portant to deeper im pedance variations.
Depth-to-time conversion plots for these carbonate-dom inated sediments (Fig. 3) are remarkably sim ilar dow n to 250 m bsf. They can be estim ated for a site with reasonable accuracy dow n to at least 450 mbsf, if one knows the approxim ate clay content and whether anomalously high diagenetic cementation is likely. In contrast, synthetic seismogram character is m uch less predictable, as the wavelet and interference patterns have large influences. Although impedance depends on both velocity and density, often the impedance log used in a synthetic seism ogram can be based on the invalid assum ption o f constant density. Because sonic and density variations are strongly correlated and both variables respond to porosity, most density-induccd im pedance variations are already implicit in the sonic-induced impedance variations. Below -1 0 0 mbsf, the two synthetics are usually similar, and where they differ, there is the chance that density log errors cause the density log to contribute more noise than signal.
ACKNOWLEDGMENTS
This study was supported by NSF G rant TAM RF No. 20539/ 20642 and by a grant from A tlantic Richfield Company.
REFERENCES’
Carlson. R.L., Gangi. A.F.. and Snow, K.R.. 1986. Empirical reflection traveltime versus depth functions for the deep-sea sediment column. J. Geo- phys. Res., 91:8249-8266.
Chen, O.. and Nur, A., 1991. Critical concentration models for the mechanical and acoustic properties of porous rocks and sediments. Eos, 72:438.
Davies, P.J.. McKenzie, J.A., Palmcr-Julson, A., et al.. 1991. Proc. OOP. Inil.Repts., 133: College Station. TX (Ocean Drilling Program).
Fulthorpe, C.S., Schlanger, S.O.. and Jarrard, R.D., 1989. In situ acoustic properties of pelagic carbonate sediments on the Ontong Java Plateau. J. Geophys. Res., 94:4025-4032.
Gardner. G.H.F.. Gardner. L.W., and Gregory, A.R., 1974. Formation velocity and density—the diagnostic basics for stratigraphic traps. Geophysics, 39:770-780.
Gassmann. F.. 1951. Elastic waves through a packing of spheres. Geophysics, 16:673-685.
Hamilton. E.L., 1976. Variations of density and porosity with depth in deep-sea sediments. J. Sediment. Petrol., 46:280-300.
-------------. 1979. Sound velocity gradients in marine sediments. J. Acoust. Soc.Am.. 65:909-922.
Han. D.. Nur. A., and Morgan, D., 1986. Effects of porosity and clay content on wave velocities in sandstones. Geophysics. 51:2093-2107.
Jarrard, R.D.. Dadey, K.A., and Busch, W.H., 1989. Velocity and density of sediments of Eirik Ridge. Labrador Sea: control by porosity and mineralogy. In Srivastava, S.P., Arthur. M.A., Clement, B., et al., Proc. ODP. Sci. Results. 105: College Station, TX (Ocean Drilling Program), 811-835.
Moberly, R., Schlanger. S.O., et al.. 1986. Init. Repts. DSDP. 89: Washington (U.S. Govt. Printing Office).
Nobes, D.C., 1989. A test of a simple model of the acoustic velocity in marine sediments. J. Acoust. Soc. Am., 86:290-294.
Abbreviations for names of organizations and publication titles in ODP rcfercnce lists follow the style given in Chemical Abstracts Service Source Index (published by American Chemical Society).
658
ORIGIN OF SEISMIC REFLECTORS
Nobes. D.C., Mienert, J., and Dirksen, G.J., 1991. Lithologic control of physical-property inlerrelationships. In Cicsielski, P.F.. Kristoffersen, Y., et al.. Proc. ODP, Sci. Results, 114: College Station. TX (Ocean Drilling Program), 657-669.
Raymer. L.L., Hunt. E.R., and Gardner. J.S., 1980. An improved sonic transit timc-to-porosity transform. Trans. SPWLA 21st Annu. Log. Symp., Pap. P.
Schlanger. S.O.. and Douglas. R.G.. 1974. The pelagic ooze-chalk-limestone transition and its implication for marine stratigraphy. In Hsii, K.J.. and Jenkyns. H.C. (Eds.). Pelagic Sediments: On Land and Under the Sea. Spec. Publ. Int. Assoc. Sedimcntol.. 1:117-148.
Urmos. J., Wilkens. R.H.. Bassinot, F., Lyle. M.. Marsters, J.. and Mayer. L„ in press. Laboratory and well-log velocity and density measurements from the Ontong Java Plateau: new in-situ corrections to laboratory data for pclagic carbonates. In Berger. W.H.. Kroenke. L.W.. Mayer. L.A.. et al.. Proc. ODP. Sci. Results. 130: College Station. TX (Ocean Drilling Program).
Vail. P.R., Mitchum, R.M.. Jr.. Todd, R.G., Widmier, J.M.. Thompson. S.. III. Sangrcc. J.B., Bubb, J.N.. and Hatlelid. W.G., 1977. Seismic stratigraphy and global changes in sea level. In Payton. C.E. (Ed.). Seismic Stratigraphy—Applications to Hydrocarbon Exploration. AAPG. Mem., 26:49-221.
Wood. A.B.. 1941. A Textbook o f Sound: London (G.L. Bell).Wyllie. M.R.J.. Gregory, A.R., and Gardner. L.W., 1956. Elastic wave veloci
ties in heterogeneous and porous media. Geophysics, 21:41 -70.
Date of initial receipt: 12 April 1992 Date of acceptance: 13 September 1992 Ms 133SR-290
659