43610145-rfid & analytics driving agility in apparel
TRANSCRIPT

RFID & Analytics Driving Agility in Apparel Supply Chain
by
Anil Kumar MBA, BSc
and
Peter Huan-Wen Ting MBA, BComm
SUBMITTED TO THE PROGRAM IN SUPPLY CHAIN MANAGEMENT
IN PARTIAL FULFILLMENT OF THE REQUIREMENTS FOR THE DEGREE OF
MASTER OF APPLIED SCIENCE IN SUPPLY CHAIN MANAGEMENT AT THE
MASSACHUSETTS INSTITUTE OF TECHNOLOGY
JUNE 2019
© 2019 Anil Kumar and Peter Huan-Wen Ting. All rights reserved. The authors hereby grant to MIT permission to reproduce and to distribute publicly paper and electronic
copies of this capstone document in whole or in part in any medium now known or hereafter created.
Signature of Author: ____________________________________________________________________ Department of Supply Chain Management
May 10, 2019
Signature of Author: ____________________________________________________________________ Department of Supply Chain Management
May 10, 2019
Certified by: __________________________________________________________________________ Dr. Maria Jesus Saenz Gil De Gomez
Executive Director, Supply Chain Management Blended Program Capstone Advisor
Accepted by: __________________________________________________________________________ Dr. Yossi Sheffi
Director, Center for Transportation and Logistics Elisha Gray II Professor of Engineering Systems Professor, Civil and Environmental Engineering

1
RFID & Analytics Driving Agility in Apparel Supply Chain
by
Anil Kumar
and
Peter Huan-Wen Ting
Submitted to the Program in Supply Chain Management on May 10, 2019 in Partial Fulfillment of the
Requirements for the Degree of Master of Applied Science in Supply Chain Management
ABSTRACT
The apparel industry is facing significant challenges. Today’s consumers have less patience to wait, and omnichannel retailing is the new norm. This requires the entire apparel supply chain to become more agile, which means that stakeholders need to have better visibility, speed and flexibility. While supply chain digitalization helps the industry to become more agile, enabling technology like Radio Frequency Identification (RFID) has not been adopted in scale. This capstone aims to answer how RFID creates value in the apparel supply chain by improving agility. Based on our sponsor’s RFID pilot, we study the technology’s potential in its logistics & distribution and retail stages. Using process analysis, RFID data analysis, and cluster analysis, we identify relevant value drivers for different stakeholders. In the pilot’s context, we find three clusters: fastmoving omnichannel, online long tail and retail longtail, which have different supply chain characteristics. We also connect RFID data, captured at different checkpoints, with existing system data to generate business intelligence for the clusters. The result shows that RFID improves store KPIs such as daily inventory record accuracies and on-shelf availability. In addition, we analyze supply chain policies for the following value drivers: planning, inventory management, replenishment, and store management. In general, RFID provides end-to-end product visibility, which is beneficial for all stakeholders. Also, there are different levers that can be used to improve speed and flexibility for different stakeholders. Overall, the retail store gains most value from RFID initiatives. Nevertheless, significant value can be created for other stakeholders from advanced analytics and appropriate data sharing. Organizations need to leverage analytical tools and techniques to improve supply chain agility. Our findings can be useful for other apparel businesses that currently use the traditional mass manufacturing model and are seeking to improve their supply chain agility.
Capstone Advisor: Dr. Maria Jesus Saenz Gil De Gomez
Title: Executive Director, Supply Chain Management Blended Program

2
TABLE OF CONTENTS
1 INTRODUCTION ............................................................................................................................... 4
1.1 Motivation .......................................................................................................................... 4
1.2 Sponsor Background ........................................................................................................... 6
1.3 Research Question .............................................................................................................. 7
1.4 Project Structure ................................................................................................................ 7
2 LITERATURE REVIEW ....................................................................................................................... 8
2.1 RFID Descriptive.................................................................................................................. 9
2.2 RFID in Apparel Retail Supply Chain .................................................................................. 13
2.3 Operational Excellence Use Cases ..................................................................................... 15
2.4 Business Model Excellence Use Cases ............................................................................... 16
2.5 RFID-driven Business Intelligence to Improve Supply Chain ............................................... 17
3 Conceptualisation ......................................................................................................................... 19
3.1 Process Analysis ................................................................................................................ 19
3.2 Understand RFID Pilot Design ........................................................................................... 21
3.3 Hypothesis Building .......................................................................................................... 23
4 Analysis and Results ...................................................................................................................... 23
4.1 Logistics & Distribution Stage ............................................................................................ 23
4.1.1 Data Exploration and Cleaning .................................................................................. 23
4.1.2 Dimensionality Reduction and Data Preparation ....................................................... 24
4.1.3 Cluster Analysis ........................................................................................................ 26
4.2 Data Interpretation ........................................................................................................... 27
4.3 Retail Store Stage ............................................................................................................. 29
5 DISCUSSION .................................................................................................................................. 31
5.1 Sponsor’s RFID Pilot - Limitations ...................................................................................... 31
5.2 Insights and Management Implications ............................................................................. 32
6 CONCLUSION................................................................................................................................. 36

3
LIST OF FIGURES
Figure 1: Stages of our sponsor’s apparel supply chain and the capstone project scope ........................... 6
Figure 2:Capstone project flow ................................................................................................................ 7
Figure 3: Literature review structure ........................................................................................................ 9
Figure 4: The sponsor’s RFID pilot .......................................................................................................... 22
Figure 5: Sample correlation matrix ....................................................................................................... 25
Figure 6: Scree plot to determine the optimal factors ............................................................................ 25
Figure 7: Exploratory factor analysis factor table ................................................................................... 26
Figure 8: Inventory accuracy snapshot in 5 stores .................................................................................. 30
Figure 9: Cluster-wise inventory accuracy .............................................................................................. 30
Figure 10: Pilot stores' shelf availability ................................................................................................. 30
Figure 11: Cluster-wise shelf availability................................................................................................. 31
LIST OF TABLES
Table 1: Forms of inter-firm relationships, adapted from Hammervoll, 2009 .......................................... 12
Table 2: Value Added Indicators for RFID implementation ..................................................................... 15
Table 3: Final list of features used for analysis at style-color-size level ................................................... 24
Table 4: Cluster analysis summary ......................................................................................................... 27
Table 5: Value potential for different stakeholders ................................................................................ 34

4
1 INTRODUCTION
1.1 Motivation
The apparel industry, and retail in general, is in turbulent times. The retail apocalypse (Taylor, 2018),
notable bankruptcies (Corkery, 2018), and millennials seeking experiences over products (Germano, 2016)
are all signs of a challenging retail space. In this consumer-driven environment, it is more important than
ever for retailers to provide products whenever and wherever consumers want. Today’s consumers have
less patience to wait, and omnichannel retailing is the new norm. This requires retailers to be agile (Gligor,
2015), which means that they need to have better visibility, speed and flexibility (Hwang & Rho, 2016).
However, to achieve agility, the entire supply chain – not just the retailers – need to change.
Despite all the challenges, the global apparel market is a growing industry with a projected value of
1.5 trillion dollars in 2020 according to Statista (2019). Its supply chain consists of companies and
individual participants collaborating across well-established processes: planning, product design &
development, raw materials sourcing, manufacturing, distribution center operations & freight forwarding,
and transportation. With many processes and stakeholders involved, the traditional apparel
manufacturing end-to-end lead time is long: it can take over a year to make a garment from design to
retail delivery. The traditional process is also inflexible, as it optimizes on mass production at inexpensive
offshore production countries. In contrast, the fast fashion model, a subsector of the industry, provides
shorter production cycle and more flexibility through optimizing on speed instead of cost. And supply
chain digitalization is one of the important levers used by fast fashion players. Although not all apparel
retailers need to adopt the fast fashion model, it still sets a good example of the changes needed to
compete today. That is, the apparel supply chain needs to be transparent (Budd, Knizek, & Tevelson, 2012)
and undergo digital network transformation. A digital supply chain enables business process automation,
organizational flexibility, and digital management of assets, all of which are important to the future of

5
supply chain. Furthermore, to create, capture, and deliver value, apparel industry participants need to
move past organizational silos and form a true end-to-end digital transformation strategy. While supply
chain digitalization is commonly accepted as necessary by the industry, enabling technology like Radio
Frequency Identification (RFID), is not often adopted. Why can the apparel industry not duplicate what
fast fashion retailers have done?
Traditional mass apparel is an analogue industry, with products often being inexpensive physical
garments. To achieve supply chain digitalization, products should be digitized to enable advanced
analytics and full supply chain transparency. One way to achieve this is to affix RFID tags to garments,
giving individual items unique digital IDs. RFID was invented over 80 years ago, and it generated the
industry’s attention around the early 2000s for the use case to improve transparency. Unlike the barcode,
which was the dominant technology in use, RFID can be read without the need for line of sight. However,
RFID was considered “hyped” due to its “credibility gap” (Lee, 2007). Pilot successes varied, and a wide
range of limitations and perceived limitations continued to hinder RFID’s proliferation (Fish, 2017).
Historically, cost would also have been an inhibitor, as retailers need to invest not only in the
infrastructure (e.g. sensors) but also in the tags. Thus, successful pilots and implementations so far are
found mostly with largest retailers like Wal-Mart and Macy’s, or with single brand retailers like Zara and
Lululemon (Caro & Sadr, 2019) who either have strong controls over their supply chains or are highly
vertically integrated. Unfortunately, the same cannot be said for the rest of the industry.
As RFID technology continues to mature, its price point is now at a level where it can be dispersed at
the item level relatively inexpensively. This means that wider adoption is now feasible, and there is
renewed industry interest in exploring RFID’s value creation potential for the apparel supply chain. When
applied in scale, RFID can not only enable end-to-end transparency but also encourage collaboration
through value sharing and trust (MIT CTL, 2018). Furthermore, the technology’s greatest potential is in its

6
ability to enable omnichannel retailing (Caro & Sadr, 2019) for all supply chain stakeholders. Therefore,
our project sponsor has a strong interest in validating RFID’s value creation.
1.2 Sponsor Background
This capstone’s sponsor is a leading apparel and consumer goods sourcing company that provides
end-to-end supply chain and logistics solutions for Western brands and retailers. With a network of
thousands of suppliers and factories across the globe, millions of goods pass through the sponsor’s supply
chain every year. Using its scale, experience, and leverage, the sponsor excels in apparel mass
manufacturing by optimizing production in its global manufacturing network for customers. Furthermore,
our sponsor defines the apparel manufacturing cycle in 4 major stages: design, production, logistics &
distribution, and retail, as shown in Figure 1.
Figure 1: Stages of our sponsor’s apparel supply chain and the capstone project scope
Due to the industry-wide needs for better agility as described earlier, our sponsor is keen to explore
ways to increase agility for itself and its supply chain partners, i.e. factories, transshipment warehouses,
distribution centers, and retailers. In this context, our sponsor initiated a RFID pilot to understand how
RFID creates value for different stakeholders and increases agility within its ecosystem. While there are
numerous well-documented RFID benefits in all stages (Rizzi, Romagnoli, & Thiesse, 2016; Choi, Yang,

7
Yang, & Cheung, 2015; Hardgrave, Aloysius, & Goyal, 2013; Condea, Thiesse, & Fleisch, 2012; Azevedo, &
Carvalho, 2012), we examine the value creation in logistics & distribution and retail stages based on our
sponsor’s pilot.
1.3 Research Question
In the traditional mass apparel industry, how can RFID create value by improving agility through
increased visibility, speed and flexibility?
1.4 Project Structure
Figure 2 highlights our capstone research approach. This report follows the same structure to present
the flow and findings in a holistic perspective.
Figure 2:Capstone project flow

8
We start with a literature review focused on understanding the rich literature surrounding RFID’s
supply chain applications and looking at different business use cases, adoption challenges, and the value
potential. Next, we move to the conceptualization phase where we study our sponsor’s business model,
processes and the context of the RFID pilot. With the understanding of the scope, design and timeline of
the pilot, we develop our hypothesis to validate during the capstone project. In the analysis and results
section, we focus on the quantitative analysis to validate our hypothesis and capture the results. While
machine learning approach helps in both explanation and prediction, we focus primarily on the
explanation part. We use basic machine learning tools to cluster the SKUs and explain the key
characteristics of different clusters. Finally, we end with the discussion section focusing on key insights,
limitations and other considerations to drive value from RFID implementation.
2 LITERATURE REVIEW
In this section, we first review the evolution of RFID versus barcode to understand the reason behind
RFID’s slow adoption. Next, we study RFID’s perceived benefits, as well as the comprehensive use cases
for the apparel retail supply chain. Overall, the literature suggests that RFID’s benefits are found in two
categories: operational excellence and business model excellence. Furthermore, in the context of the
apparel supply chain, business model excellence is realized in supporting the fast fashion and omnichannel
business models. This leads to our hypothesis that RFID is essential for gathering more supply chain data
points, and data-driven supply chain policies will increase visibility, speed and flexibility. Figure 3 outlines
the structure of our literature review.

9
Figure 3: Literature review structure
2.1 RFID Descriptive
Radio frequency Identification (RFID) is a wireless sensing
technology that captures information. An RFID system
consists of tags, readers, servers and middleware. Since it is
a key technology for automatic identification and data
capture, it has attracted the interests of users in multiple
areas such as smart shopping, supply chain management, food tracking, etc.
RFID vs. Barcodes
Despite being termed the rightful successor of the barcode, the barcode is still more ubiquitous than
RFID in the supply chain. The key reasons for RFID’s slower adoption are:

10
• Co-existence of RFID and Barcodes
• Limitations of RFID’s performance
• Time for adoption or diffusion
Co-existence of RFID and Barcodes
The co-existence of both technologies, especially when an organization currently depends on
barcode-enabled processes and capabilities, leads to slower adoption of RFID (Schmidt, Thoroe, &
Schumann, 2013). To facilitate faster adoption of RFID, a migration strategy is needed to promote RFID
while supporting existing barcode processes. There should be a transition framework based on the
principles of co-existence, hybridization, and convergence (Schmidt et al., 2013). Finally, to manage the
transition between incumbent and emerging technologies, there need to be interfaces to bridge the gap
between barcode and RFID protocols at the object, device, operation and information levels. In short,
without a proper transition strategy, the RFID’s adoption will be slow.
Limitations of RFID’s performance
In addition to the migration challenge, the sub-optimal performance of RFID is another cause for
its muted initial adoption. Since RFID uses wireless configuration, data transmissions are susceptible to
multiple forms of interference such as tag-to-tag, reader-to-tag, and reader-to-reader interference
(Zhang, Ferrero, Gandino, & Rebaudengo, 2016), which often leads to less than 100% accuracy. To
improve performance, the installation of readers and the placement of tags need to be managed carefully,
as factors like metal surface, moisture, antennae orientation, and interference can affect read accuracy
(Reyes, Li, & Visich, 2016). There have been significant improvements in this area, and advanced protocols
and guidelines are available to counter the performance limitations (Zhang et al., 2016), which should be
adopted in implementations.

11
Time for adoption or diffusion
Another factor behind RFID’s slower adoption is the adoption or diffusion process itself. In general,
RFID adoption processes can be split into 3 phases: evaluation, validation, and implementation. The
overall processes are influenced by the following factors: 1) organizational factors including internal and
external drivers, 2) management leadership, and 3) various operational factors such as use case definition,
cost, and technology understanding (Reyes et al., 2016). All these factors need to be managed during the
evaluation phase to lead to a successful implementation.
RFID’s perceived benefits
RFID’s benefits can be seen in three areas:
• Data capture efficiency
• Convergence with emerging technology
• Value creation by fostering new interactions with partners
Data capture efficiency
Compared to barcodes, RFID offers the additional granular (item level) data capture capability
since it doesn’t need line of sight. This also means that numerous additional checkpoints can be added
throughout the supply chain with ease. On a small scale, RFID will act as a catalyst for improving visibility
and overall supply chain performance. On a large scale, RFID can enable an intelligent network powered
by Internet of things (IOT), and physical objects can be transformed from static to dynamic objects
(Dimitriou, 2016).
Convergence with emerging technology
RFID offers multiple functionalities which provide building blocks for IOT and Industry 4.0. The
“smart” concept has become pervasive in both product and service supply chain. Furthermore, IOT has
spurred a significant drive towards “smart” concepts such as smart retailing and self-service stores

12
(Pantanoa & Timmermans, 2014). As the IOT based offerings continue to evolve, supply chains need to be
more agile and dynamic. This requires faster transaction and operations data systems (Townsend, Quoc,
Kapoor, Hu, Zhou, & Piramuthu, 2018) that can be supported by RFID.
Value creation by fostering new interactions with partners
Improving internal organizational capabilities brings supply chain cost efficiency. On top of that,
an organization can create a sustainable competitive advantage by effectively collaborating with external
partners. There are different forms of inter-firm cooperation with slightly different value creation logic,
and organizations should strive to move from the logistics integration to the bilateral learning in order to
create higher value (Hammervoll, 2009). Table 1 summarises these two different forms of relationship.
Table 1: Forms of inter-firm relationships, adapted from Hammervoll, 2009
Relationship Forms Example Objective Value Creation Logic Logistics integration Planning and inventory
coordination How actions at buying -selling interface optimizes others cost drivers
Sequential interdependence - one's action precede others
Bilateral learning Product design connected to customer interactions
How to make a joint contribution to increase customer experience
Reciprocal interdependence - ongoing mutual adjustments by both party
While logistics integration is common in industry, bilateral learning is not so common. Since RFID
technology offers transparency and boundary permeability, it can support inter-organizational
information systems that not only facilitate logistics integration but also advance the relationship towards
bilateral learning. Despite this fact, many companies are reluctant to test and implement RFID system
with their partners because of several managerial and technical challenges (Hwang & Rho, 2016). Two key
questions that needs to be answered to establish better inter-firm collaboration are: 1) what RFID’s
strategic value for all supply chain partners is, and 2) how to appropriate values (Lieberman, Garcia-Castro,

13
& Balasubramanian, 2016). The authors pointed out that if an RFID system is implemented across
partners, it increases the quality of information shared, thereby improve visibility and agility which in turn
increases inter-organizational trust.
2.2 RFID in Apparel Retail Supply Chain
RFID was projected to be part of the global business
environment in late 2000’s. However, the adoption in the
apparel retail sector has been muted for a long time (Fish,
2017). Walmart’s initiative to tag its SKUs with RFID in late
2003 gave a big push towards wider adoption of RFID in
supply chain, and companies started to test out the RFID enabled supply chain (Reyes et al., 2016). This is
understandable, as RFID can provide the following benefits in the retail supply chain (Vlachos, 2014).
1. Distribution efficiency: RFID can improve performance through better inventory tracking in
transit and in warehouse. This increases availability in store, reduce waste, increase sales in stores
and increase overall supply chain performance.
2. Reduced bullwhip effect: The cause of increased bullwhip effect is attributed to multiple factors
like supply chain policies, gaming principle, or market fluctuations. Increased visibility and
transparency have been one of the most effect strategies to reduce the bullwhip effect.
3. Intelligent replenishment policies: The replenishment policies based on barcodes are very
simplistic. We observed similar behaviors during our sponsor’s RFID pilot. The sub-optimal
replenishment policies often lead to reduced sales revenue or increased cost because of re-
distribution of inventory. Timely RFID data offers additional benefit to create intelligent
replenishment policies.
14
4. Intelligent store: RFID can help in easy monitoring of the exposure, availability and movement of
items in store.
5. Labor efficiency: Cycle counting, and inventory reconciling is often a time-consuming activity in
store and warehouse. RFID can significantly increase labor efficiency by automating the non-
customer facing tasks.
6. Customer centricity: Customer buying patterns across different channels help generate good
insights which can foster supply chain innovation. The insights can then be used to create better
product and service offerings for customers.
Despite the obvious benefits, the adoption of RFID in retail supply chain has remained low. However,
multiple research and pilot were conducted by companies in this area. The areas that dominated the
research are cost-benefit analysis of RFID investments, process optimization, inventory management, and
logistics and distribution management (Musa & Dabo, 2016).
One limitation of the cost benefit analyses of RFID investments is that the analytical model,
simulation, and case studies were conducted in context of the scale of the operations of the firm but not
in context of flow density of goods in supply chain (Musa & Dabo, 2015). Flow density parameters such as
volume, variability, velocity etc. can have different impacts on the different supply chain clusters, which
can make the cost benefit analysis more impactful and meaningful.
Over time, detailed use cases have been created to capture the benefit of RFID which can be grouped
in two broad categories:
• Operational excellence use cases
• Business model excellence use cases

15
2.3 Operational Excellence Use Cases
In theory, item-level tagging can transform the retail
store operations and bring high efficiency to the supply chain
(Rizzi et al., 2016). Most use cases center on better inventory
control, stock-out reduction, reduce shrinkage, and lower
labour costs.
An extensive set of 60 value added indicators (VAIs) enabled by RFID have been identified, which
can enhance the overall value in the fashion and apparel industry (Bertolini, Romagnoli, & Weinhard,
2017). In our sponsor’s supply chain context, these RFID enabled VAIs broadly fall under the 8 use cases
shown in Table 2.
Table 2: Value Added Indicators for RFID implementation
Key Area Use-cases Store Operation Efficiency Store Management to increase store efficiency Logistics and Distribution Efficiency Logistics
Inventory and Supply Chain Management Factory / Upstream Management Strategic Sourcing
Product Journey Customer Experience Management Brand Protection
Customer Relationship Management Marketing and Promotion Management
In addition to the intra-organization use cases, inter-firm operation excellence use cases have also
been researched in detail to answer questions such as:
• How can RFID help manage joint replenishment and delivery in retail supply chain?
• How can RFID support optimal scheduling and coordination with upstream raw material supplier
in garment supply chain?
• How can RFID help reduce the bullwhip effect in the inter-firm supply chain?

16
2.4 Business Model Excellence Use Cases
In addition to value captured through operational
excellence enabled by RFID, firms can adopt different
business models and create higher value across the supply
chain (Hammervoll, 2009). For instance, retailers have
started to use innovative means to collaborate with
upstream suppliers and consumers to co-create value through IOT (Balaji & Roy, 2017). Elements of IOT
include the integration of smart devices, unit-level tagging using RFID or QR (Quick Response) Code, and
powerful analytics engines to convert big data to insights. Two use cases from business model perspective
are relevant to our project: Fast fashion and Omnichannel business models.
Emergence of fast fashion model: IOT tools and technologies are critical to support the fast fashion
business model, which is characterized by short design-to-receive cycle and quick response to consumer
demands (Watson & Yan, 2013). In apparel retail, while no one wants to be associated with the stigma of
“slow fashion”, the truly fast fashion retailer has been able to outperform many in the industry with
increased speed and flexibility. Zara, H&M and Forever 21 are some example of fast fashion retailers
(Watson & Yan, 2013). Electronic communication, frequent delivery, reduced shelf life, and high sales to
exposure ratio are few key hallmarks of this business model, which requires a dynamic information
management system.
Omnichannel as the tipping point: Omnichannel in retail has become pervasive. This model requires
better inventory visibility and accuracy and can become a tipping point for the RFID’s adoption (Fish,
2017). Most organizations have either set up or are in the process of establishing omnichannel capabilities
to collectively capture a wider net of consumers, and at the same time offer a greater customer value
proposition (Saghiri, Wilding, Mena, & Bourlakis, 2017). One key facet of an effective omnichannel

17
fulfilment is complete, accurate, and consistent visibility of products across multiple channels. In this
regard, RFID has long been touted as one of the key integration technologies to support integrated
omnichannel fulfilment. However, the technology needs to be supported by new processes and structures
covering order entry, order preparation, route planning, shipment, and return management (Saghiri et
al., 2017).
One additional factor that impacts the omnichannel business mode is the capability to manage
daily inventory record inaccuracies (IRI). Retailers still commonly use a centralized decision support
system to serve both in-store and on-line customers from a single distribution center. These systems often
ignore the continuously changing inventory record inaccuracies, and the system inventory record present
a wrong picture leading to sub-optimal supply chain performance (Kull, Barratt, Sodero, & Rabinovich,
2013). The authors concluded that the daily inventory record inaccuracy impacts the inventory
management policies and results in increased system inventory but reduced fill rate. As a mitigation
factor, frequent cycle counting can significantly reduce the impact of daily IRI. RFID enabled system, with
its automation ability, increases the frequency of cycle count and thereby reduces the daily IRI, leading to
higher supply chain performance.
2.5 RFID-driven Business Intelligence to Improve Supply Chain
RFID drives innovation primarily from the visibility
perspective where the economies of capturing more data
from additional checkpoints in the supply chain has become
very favorable (Garrido et al., 2012). As the volume and
velocity of data is increasing, managers are seeking more
effective ways to exploit the data created within their organization and partner ecosystem (Chen, Preston,
& Swink, 2015). Anecdotal evidence has shown that the insight generated from additional data has helped

18
to transform business strategy and to drive operational excellence. As the result, there is a growing push
towards employing an array of powerful analytical techniques (Chen, Preston, & Swink, 2015). With the
rapid growth of big data, advanced data techniques from data mining and machine learning are used to
generate valuable insights.
Impact of business intelligence on store operation
Store managers continuously strive towards meeting the changing consumer preference,
managing assortments, and driving sales. To enable this, they need to build business intelligence
capabilities to handle big data. Business intelligence systems built on RFID help to generate insights to
improve store operations. They also open scope to connect data collected from additional sensors to
enrich the insights about customer buying behaviors and preferences (Al-Kassab, Thiesse, & Buckel, 2013).
Impact of business intelligence on logistics and distribution
The emerging trend towards omnichannel, i.e. convergence of physical and online retailing,
requires new supply chain capabilities to meet uncertainty and complexity. In order to meet the
complexity, it is important to deploy intelligent systems to help manage the dynamic demand-supply
situation.
Impact of business intelligence on manufacturing and upstream suppliers
RFID can bring significant benefits to manufacturers by optimizing production scheduling and
reducing overall lead times (Choi et al., 2015). Capturing the customer insight and reducing the overall
design-to-manufacture lead time can bring additional competitive advantage and improve profitability.
Through literature review, we understand the richness of the RFID-related literature. There are
advanced RFID use cases available which can form the basis for implementation. In addition, retail

19
business model is shifting towards omnichannel, which increases supply chain complexity. Also, fashion
retailers are collaborating with suppliers to reduce the design-to-shelf lead time to match the changing
consumer preference. Increasing agility through improved speed and flexibility in such environment
becomes the competitive lever to manage the supply-demand dynamics. In order to meet this,
organizations have developed advanced decision support systems capable to handle big data captured
through RFID system. In this capstone, we validate the understanding that RFID can create value by
improving agility in the apparel supply chain through our sponsor’s pilot. In the logistics & distribution
stage, we test that advanced analytics using additional data points from RFID helps to formulate supply
chain policies that improve overall speed and flexibility. In retail, we assess RFID’s use cases such as
increased inventory visibility and product shelf exposure, which lead to flexibility and support for the
omnichannel model.
3 Conceptualisation
We approached the question of how RFID can create value by improving agility through increased
speed and flexibility, and through the lens of our sponsor’s ecosystem. First, we conducted structured
interviews with business stakeholders to understand their pain points and perceived RFID value creation
potential. Next, we studied the standard operating procedures (SOP) to understand the context.
3.1 Process Analysis
Our sponsor defines the apparel manufacturing cycle in 4 major stages: design, production, logistics
& transportation, and retail. In this section, we investigate how RFID creates value in the 4 stages based
on interviews with our sponsor.

20
Design: Traditional apparel design is a lengthy process, involving many rounds of product sampling. The
apparel industry is moving towards digital design and sampling, which greatly reduces design lead time
by reducing or removing sample shipping time. With the digital design infrastructure in place, RFID can
further improve agility of the design stage by capturing demand signals which designers can incorporate.
Production: Azevedo and Carvalho (2012) suggested that RFID creates value in the production stage
through better management of raw materials, semi-finished components, and finished garments which
ultimately improves agility. In our sponsor’s environment, finished apparel are sourced from contract
manufacturers that also have other customers. While the suppliers are external parties, we interviewed
one factory as well as our sponsor’s sourcing team to understand the inter-firm information flow. We
identified the following areas which potentially could improve supply chain agility:
1. Information sharing: There are multiple manual touch points in exchanging order and shipment
information with suppliers.
2. Status update of Work-in-Progress (WIP) orders: WIP information is not digitized, and hence not
shared seamlessly between the parties.
3. High lead time between finished production and shipping stage: Garments need to be inspected
completely before getting shipping clearance which increases the lead time by around a week.
4. Single period order: Most orders are placed in bulk for the entire season, and there is no continuous
replenishment based on actual sales.
Logistics & Distribution: This stage includes the transshipment warehouse, distribution warehouse, and
shipment to the stores. The logistics services are provided by 3PL service providers. Key process areas that
impact the agility of supply chain are:
1. Warehouse process: The transshipment warehouse process includes multiple manual steps for
inspection, sorting, repacking and shipping.

21
2. Store replenishment process: Our sponsor uses a one-to-one replenishment policy (replenishment is
triggered when an item is sold) which might not be optimal.
3. Omnichannel: Our sponsor aims to move toward the omnichannel fulfilment model. Currently, all
online orders are primarily shipped from a replenishment warehouse. However, if a product is not
available in the warehouse, a machine learning algorithm is used to determine the optimal store to
fulfill the order. Nevertheless, the lack of inventory accuracy impacts the fulfillment lead time.
4. Inventory management: Since cycle count is a manual activity, it is currently conducted infrequently
(approximately every two months) in warehouses and stores. This results in inventory inaccuracy
building up over time between cycle counts.
Retail: Based on the interview with a store manager, we captured following insights which can help
improve the agility in the store:
1. On-shelf availability: Retail sales staff are expected to maintain on-shelf availability for different size-
color combination. However, there is no system support to manage the exposure of item on-shelf and
to capture the KPI.
2. Inventory accuracy: Stock take is a manual process which is accurate but time consuming. Inventory
inaccuracy builds over time, and there is a potential to reduce the inaccuracies by increasing the stock
take frequency through automating the process with RFID.
In short, we find support that RFID improves agility in all stages of our sponsor’s apparel supply chain.
3.2 Understand RFID Pilot Design
To probe RFID’s value creation potential in the supply chain, our sponsor conducted a pilot study with
one of its own retail brands where our sponsor controls the supply chain end-to-end. This retail brand has
presence in China, South Korea, Taiwan, and Hong Kong with several hundred stores. While the brand acts
like a fast fashion brand, its supply chain still follows the traditional mass manufacturing model.

22
The pilot included products sourced from 32 suppliers (factories), 1 transshipment warehouse, 1
replenishment warehouse, and 5 retail stores in Shanghai. Everything in the 5 stores was RFID tagged,
which included around 300 styles and 8000 pieces of garments. Handheld scanners were used to read
RFID at the following checkpoints:
• 1 factory at the end of the production line and at outbound
• Transshipment warehouse inbound and outbound
• Replenishment warehouse inbound and outbound
• Retail stores inbound and in store
Daily stock take was conducted in retail stores for 3 months.
Figure 4 is a summary of the sponsor’s RFID pilot.
Figure 4: The sponsor’s RFID pilot
Our sponsor’s pilot covers use cases related to transportation and retail stages. Since the project’s
focus is on capturing data for limited use cases, we aligned our analysis accordingly.
23
3.3 Hypothesis Building
In this capstone project, we validated how inventory visibility and data insights captured during the
RFID pilot help improve agility in the logistics & distribution and store stages. The hypotheses are:
1. Logistics & Distribution: Advanced analytics using the machine learning approach will help to identify
the right supply chain execution policies that improve the overall agility.
2. Retail store: RFID implementation in store can significantly improve the overall store performance.
Increased visibility will enable better flexibility in meeting consumer requirements both in the retail
and online channels.
4 Analysis and Results
4.1 Logistics & Distribution Stage
To validate our hypothesis that advanced analytics will help identify the right supply chain execution
policies to improve agility, we used the machine learning approach. Using our sponsor’s inventory and
point-of-sales (POS) reports from the same period the RFID pilot was conducted, we performed a cluster
analysis and found three statistically significant clusters. These clusters have different characteristics in
speed of sales, inventory accuracy, and on-shelf availability in the retail environment. With the right
targeted policies, our sponsor can further improve agility.
4.1.1 Data Exploration and Cleaning
We started our analysis with data exploration and cleaning. In our initial exploration, we already found
useful insights suggesting policy improvement opportunities. For instance, only a small fraction of our
sponsor’s products is fast moving, and this validates our prior intuition that the inventory replenishment

24
policy can be improved. We also experimented with different unit of analysis, and then performed feature
engineering to group features into major categories: sales density, sales variability, lead time and product
attributes. Table 3 is the list of features we began our analysis with. Finally, we performed our analysis at
the style-color-size level which is the same unit of analysis our sponsor uses. This was a decision to help
our sponsor interpret the findings. At the initial stage, we had 6023 observations.
Table 3: Final list of features used for analysis at style-color-size level
4.1.2 Dimensionality Reduction and Data Preparation
Our initial cleaned data had 50 features, which would have been difficult to interpret. Thus, it was
necessary to perform dimensionality reduction. As the initial data was a combination of numerical and
categorical features, we first one-hot encoded the categorical features, converting them to dummy
variables for later analysis. Then, we preprocessed our data with z-score standardization to improve
performance of our cluster analysis (Mohamad & Usman, 2013). Next, we performed a correlation analysis
on the features and dropped the highly correlated ones (correlation > 0.8), as these features offered
different views of the same information. Figure 5 is an example of the feature correlation heatmap used
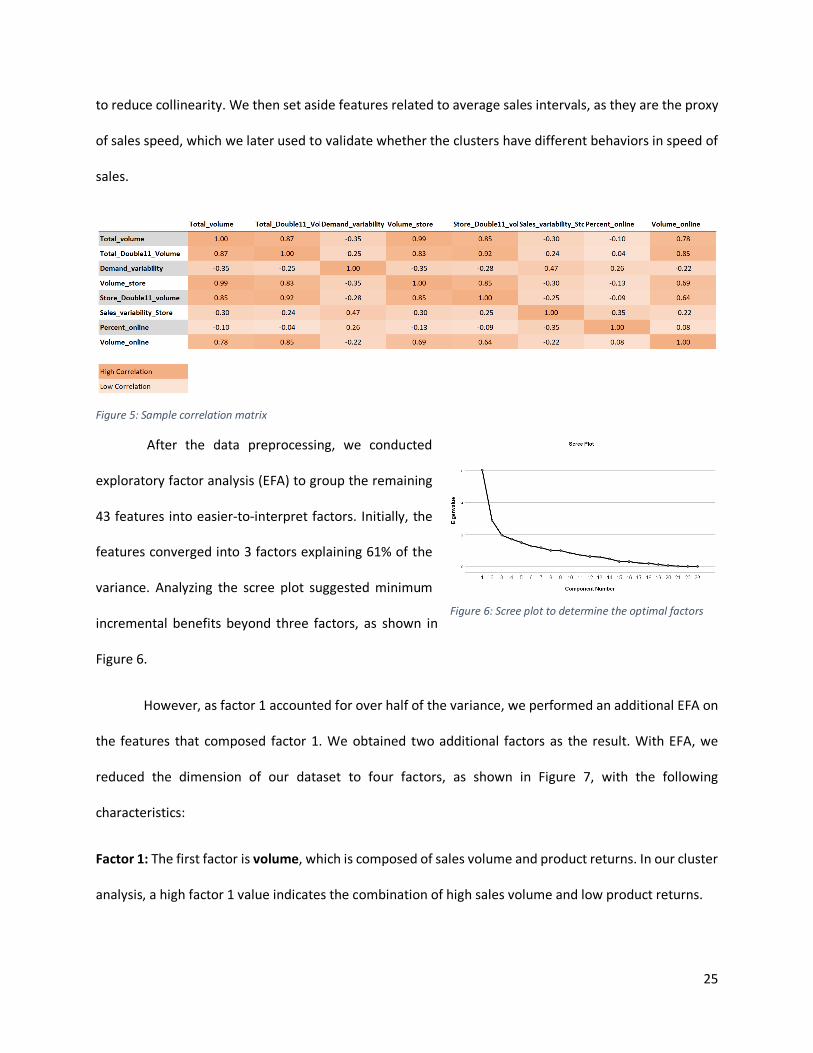
25
to reduce collinearity. We then set aside features related to average sales intervals, as they are the proxy
of sales speed, which we later used to validate whether the clusters have different behaviors in speed of
sales.
Figure 5: Sample correlation matrix
After the data preprocessing, we conducted
exploratory factor analysis (EFA) to group the remaining
43 features into easier-to-interpret factors. Initially, the
features converged into 3 factors explaining 61% of the
variance. Analyzing the scree plot suggested minimum
incremental benefits beyond three factors, as shown in
Figure 6.
However, as factor 1 accounted for over half of the variance, we performed an additional EFA on
the features that composed factor 1. We obtained two additional factors as the result. With EFA, we
reduced the dimension of our dataset to four factors, as shown in Figure 7, with the following
characteristics:
Factor 1: The first factor is volume, which is composed of sales volume and product returns. In our cluster
analysis, a high factor 1 value indicates the combination of high sales volume and low product returns.
Figure 6: Scree plot to determine the optimal factors

26
Factor 2: The second factor is variability, which is composed of sales variability metrics. A high factor 2
value indicates high weekly variability of sales.
Factor 3: The third factor is sales channel, which is composed of online sales percentage metrics. A high
factor 3 value indicates that products are mostly sold online, whereas a low value indicates that products
are mostly sold in physical stores.
Factor 4: The last factor is product attribute, which is composed of price and product category. A high
factor 4 value indicates that products are either of high value or likely in the outerwear category, whereas
a low value indicates that products are likely inexpensive or in other product categories.
Figure 7: Exploratory factor analysis factor table
4.1.3 Cluster Analysis
With the dimensionality reduced from the exploratory factor analysis, we transformed our data with
the new factors. Then, we performed a cluster analysis on the transformed data using the k-means
algorithm for its popularity and simplicity. To find the optimal number of clusters, we used the elbow
method and silhouette method tests and found 3 clusters. The cluster centroids converged after 23
iterations. Finally, we used the ANOVA test and confirmed that the clusters are statistically significant (p
< 0.001). Table 4 is the summary of our cluster analysis.

27
Table 4: Cluster analysis summary
From the cluster analysis, we obtained two large clusters each with over 2500 observations of
style-color-size combination and a small cluster with 403 observations. We also performed a post-hoc
Tukey test and confirmed that all four factors (volume, variability, sales channel, and product attribute)
are statistically different between the groups with p values less than 0.001. Finally, to validate that clusters
have different sales speed, we performed another Tukey test using the average sales interval as a proxy
of sales speed. We found that cluster 1 has different speed compared to the other two clusters (p < 0.001).
However, the difference in sales speed was not clear between cluster 2 and 3, with a p value of 0.357.
Nevertheless, both cluster 2 and 3 are slow-selling, with long average sales intervals.
4.2 Data Interpretation
By comparing the relative value of the cluster centroids, we defined the clusters as follows:
Cluster 1 is a small cluster with products that have high sales volume, low weekly sales variability, use
both online and offline channels, and are not very expensive. Also, this cluster has high sales speed with
short average sales interval. In other words, it is a “fast moving omnichannel” cluster.

28
Cluster 2 is a large cluster with products that have low sales volume and moderate weekly sales variability,
use mainly online channel, and are inexpensive. Products in cluster 2 are slow moving with the longest
average sales internal. Thus, it is an “online longtail” cluster.
Cluster 3 is another large cluster with products that have low sales volume and high weekly sales
variability, use mostly offline channel, and are moderately priced. This cluster also has slow-moving
products with long average sales interval. It is a “retail longtail” cluster.
Supply chain policies to improve agility for each cluster:
The machine learning techniques built on big data help to create predictive and agile supply chain
policies by minimizing uncertainties and oscillations in the supply chain flow. There is evidence that
companies utilize these techniques to design policies to reduce demand uncertainty, improve
omnichannel fulfilment, and optimize inventory. However, considering the limited scope and data
captured during our study, we focus only on a subset of strategies that can be used for these clusters
based on their characteristics.
Fast moving omnichannel: Products in this cluster are of low to moderate price range and are sold
through multiple channels. The fulfilment speed in this cluster is often impacted by system inventory
inaccuracy. Currently, most of the products are shipped from a centralized distribution center (DC), but
there is a potential for faster fulfillment through planned shipments from the nearest store. It is possible
for our sponsor to employ an advanced algorithm to decide where to fulfill orders from, provided that the
daily inventory inaccuracy can be reduced using RFID.
Online longtail: There is anecdotal evidence that the order-to-delivery lead times for these products are
high. In addition, products are currently offered online only when they are available in the DC, which can
be few weeks after initial factory shipments. This cluster’s sales performance can be increased through

29
the combination of early product exposure online and reduced order fulfillment lead times, which RFID
can support.
Retail longtail: These products are often from previous seasons or have higher initial allocated inventory.
While our sponsor’s inventory allocation algorithm considers historical sales data, it lacks the ability to
use real-time product movement data captured by RFID. With additional insights, RFID can help to
improve inventory allocation and balancing policies for the SKUs in this cluster, improving flexibility.
4.3 Retail Store Stage
The use cases for this stage is centered around store on-shelf and inventory management. During the
RFID pilot, our sponsor identified multiple store KPIs that can be improved such as store shelf
replenishment, out-of-stock SKU management, and misplaced merchandise management. The RFID data
captured at retail brings out significant benefits in store operations in terms of increased visibility, high
availability of item-on-shelf, increased inventory accuracy, and reduced effort.
Data Capture:
During the pilot, all merchandise SKUs (style-color-size) in 5 pilot stores were tagged with RFID. In this
period, daily stock take was conducted using RFID handheld scanners. This exercise provided item visibility
both on the shelf and in the backroom. Although our sponsor’s ERP system was not synched with the RFID
data read, the differences were recorded to measure the gap and to estimate the value potential.
Data explorations and analysis:
Inventory management in store – In our sponsor’s current practice, physical stock take is performed bi-
monthly in stores, and the inventory inaccuracy builds up over time. Based on anecdotal evidence, the
inventory accuracy is approximately 95% in the stores. If the correct SOP is followed, the accuracy of

30
detailed RFID-enabled inventory count can reach up to 99% (Bertolini, Bottani, Ferretti, Rizzi, & Volpi,
2012), which is a significant improvement.
During the pilot, the average inventory accuracy,
measured as the difference between ERP records and RFID
reads, varied across stores and time periods. On average,
the system inventory accuracy was around 96% as shown
in Figure 8. In general, the inventory accuracy increases
immediately following stock takes, but it slowly degrades
over time.
In a cluster-wise inventory accuracy comparison using data
from one store, we found that the rate of inventory
accuracy degradation differs between the clusters as
shown in Figure 9. For the fast moving omnichannel cluster,
which is characterized by high volume and high product
returns, the accuracy declines faster than the other
clusters. This is where RFID can create value. According to Kull et al. (2013), RFID plays a significant role in
reducing the daily inventory record inaccuracies (IRI) as we discussed in prior section.
Shelf availability: In our sponsor’s retail stores, regular
checks are expected to ensure that the required number of
sizes for each style-color combination is always available on
the shelf. At the minimum, there should be one of each size
available. RFID can significantly increase on-shelf availability
Figure 8: Inventory accuracy snapshot in 5 stores
Figure 9: Cluster-wise inventory accuracy
Figure 10: Pilot stores' shelf availability

31
through managing avoidable stock-outs, and as the result,
sales volume can potentially improve 4-5% (Bottani,
Eleonora, Montanari & Romagnoli 2016). On average, our
sponsor’s shelf availability at the style-color-size level was
around 85% during the pilot as shown in Figure 10, and the
availability varied for selected SKUs. Again, this can be
significantly improved using RFID-enabled in-store solutions. Figure 11 illustrates that there was no
significant difference cluster-wise for the shelf availability. This highlights that RFID in general can provide
value by increasing product exposure for all clusters, thus improving sales speed.
Omnichannel fail rate: From the pilot, we observed that the omnichannel fail rate can be reduced by as
much as 10% using RFID. In our sponsor’s context, fail rate is defined as the time lost from not finding the
SKU in the assigned store. Because of sub-optimal system inventory accuracy, the fulfillment of online
order from store becomes quite challenging, resulting in delays and lost sales.
5 DISCUSSION
5.1 Sponsor’s RFID Pilot - Limitations
Our capstone project has the following limitations:
1. RFID pilot scope - Our sponsor’s pilot did not include design and production stages within its scope.
Hence, we were unable to analyze the inter-firm relationships. While RFID enables different patterns
of interactions between supply chain partners, these new patterns were not captured during this
phase of the pilot.
Figure 11: Cluster-wise shelf availability
32
2. RIFD project data – While good data was captured at the retail store level, insufficient data was
captured for the logistics & distribution stage. Furthermore, we were unable to obtain control group
data to compare the difference between RFID-enabled flow and existing setup. In addition, data for
only one season was used for our capstone, which may introduce bias in our analysis and result.
3. Pilot timeline versus our capstone project timeline – Our capstone project timeline coincided with
the initial evaluation timeline of our sponsor’s pilot. Limited use cases were identified for this initial
project, which limited our ability to do a thorough end-to-end quantitative analysis
5.2 Insights and Management Implications
Through the experience with our sponsor’s RFID pilot, we feel that greater opportunities to capture
value exist if the pilot follows certain best practices as suggested by the literature. The following factors
help in the successful implementation of the RFID pilot:
1. Define analytics strategy using RFID data to support omnichannel supply chain – Omnichannel
model requires an intelligent decision support system. The support system helps to increase demand
forecast accuracy and manage the supply and demand variability. Machine learning approaches like
clustering, neural networks, and simulation help to analyze the consumer behaviors, realize high
forecast accuracy, and optimize cost and lead times (Pereira, Oliveira, Santos, & Frazzon, 2018).
Defining the analytics strategy prior to RFID experiment design ensures the right set of quality data is
captured to support omnichannel use cases.
2. Define strategy to leverage RFID enabled business intelligence in stores – Since RFID provides
granular information, multiple data-driven applications are feasible to improve internal operations,
management decisions and customer services (Al-Kassab et al., 2013). Examples include: 1) measuring
and optimizing exposure and replenishment’s impact on turnover, 2) managing suitable product
rotations between shelf and backroom to reduce product degradation without impacting sales, 3)

33
tracking the compliance of visual merchandising, and 4) improving employee productivity to interact
with customers. The pilot should be designed with the data-driven applications in mind.
3. Include supply chain partners in the study – A RFID enabled information sharing system improves
agility and mutual trust in inter-firm supply chain interactions (Hwang & Rho, 2016). If partners are
cooperatively engaged to re-define the shared information system and connected processes, higher
value can be captured. In addition, understanding the technical challenges related to interoperability
of data, Electronic Produce Code (EPC) standards, and RFID’s impact on existing IT infrastructure help
to involve supply chain partners, thus improving the outcome.
4. Manage technological challenges of RFID system – The inability to capture accurate RFID data due to
infrastructure limitations and sub-optimal configurations reduces the perceived benefits and hinders
wider project implementations. As discussed in the literature review section, RFID read accuracies are
often impacted by interference which can be mitigated by deploying the right protocols, reader
configuration, and middleware (Zhang et al., 2016).
Table 5 presents a summary of relevant value drivers for our sponsor based on discussions with the
sponsor, literature review, and our analysis. Considering the limited scope of the sponsor’s pilot, we focus
on the following value drivers:
1. Forecasting and Planning
2. Inventory Management
3. Stock Replenishment
4. Improve Shelf Availability & Exposure

34
Table 5: Value potential for different stakeholders
In general, RFID provides end-to-end product visibility which is beneficial for all stakeholders. It also
improves supply chain performance by enabling more granular KPIs. However, there are different levers
that can be used to improve speed and flexibility for different stakeholders.
The levers for speed are:
• Manufacturing: Reduced lead time between inspection and shipment, as well as time gained from
early product exposure.
• Transportation: A multi-stage joint replenishment and delivery model which facilitates optimal
routing and reduced shipment lead time.
• Warehouse: Omnichannel order fulfillment time by identifying optimal shipping locations and
reducing fail rate (time lost from not finding the SKU in the assigned shipping location).
• Store: Time spent in locating items, replenishing stock, and managing returns.
Visib
ility
Spee
d
Flex
ibili
ty
Visib
ility
Spee
d
Flex
ibili
ty
Visib
ility
Spee
d
Flex
ibili
ty
Visib
ility
Spee
d
Flex
ibili
ty
Forecasting and Planning 3 3 3 1 0 0 2 0 0 3 3 3
Inventory Management 1 1 1 2 2 2 3 3 2 3 3 3
Stock Replenishment 2 2 2 2 2 2 3 3 3 2 2 2
Improve Shelf Availability & Exposure
1 1 1 1 1 1 1 1 1 3 3 3
RFID Enabled Initiatives
Value for Different Stakeholder
Manufacturing Transportation Warehouse Store
35
The levers for flexibility are:
• Manufacturing: Right mix as per demand signals.
• Transportation: Proper stock redistribution.
• Warehouse: Ability to offer products wherever and whenever customers want.
• Store: Flexibility to adjust product mix according to customer demand signals.
According to literature and our observation from the pilot, the retail store stands to gain the
maximum value from increased visibility, speed and flexibility. Nevertheless, significant value can be
created for other stakeholders as well.
1. Forecasting and Planning – Fashion products have short lifecycles which increase forecasting and
planning complexity. However, forecast accuracy can be improved using advanced machine learning
algorithms (Loureiro, Miguéis, & da Silva, 2018). In our analysis, we found that SKUs in different
clusters exhibit different characteristics. By using quantitative variables like volume and price, and
categorical variables like color, product family, store location, and season, etc., more robust forecasts
can be created to answer (Loureiro et al. 2018), for various geographies, channels, and time periods:
1) how do events like Double 11 impact sales of different SKUs?
2) which color and size mix sells better?
3) how does long tail behave differently?
With collaboration and information sharing, both the manufacturer and the retail store can gain high
value through increased visibility of consumer demand and changing preference. And they also
benefit from improved speed and flexibility based on the levers identified earlier.
2. Inventory Management – In our analysis, we found that daily inventory record inaccuracies (IRI) are
highly variable across stores and between clusters. During the RFID pilot, we confirmed that RFID
reduces the average time to perform stock take from 36 to approximately 1 man-hour. This enables

36
more frequent system inventory updates, thereby reducing IRI. Having a network wide accurate
system inventory helps to improve speed and provide flexibility to fulfill omnichannel orders. Thus,
RFID can provide high value to both warehouse and store in terms of increased visibility.
3. Stock Replenishment – With the increasing consumer preference to buy and pick up assortments
from multiple channels, there is a growing need to have flexibility for store replenishment and online
order fulfillment. There is a possibility to use stores as fulfillment centers which can replenish both
nearby stores and online orders. The product flow analysis based on additional data captured through
RFID can help identify new nodes and routing models, which will increase both speed and flexibility.
In such a scenario, all stakeholders will gain high value.
4. Improve Shelf Availability & Exposure – As discussed in the analysis and results section, we found
substantial opportunity in store to improve on-shelf availability. A RFID system enables the
automation of backroom replenishment, in-store promotion, and cross-marketing strategies, which
increases the sales volume in store. For this value driver, the retail store gains the most value from
improved store performance as highlighted in the levers.
6 CONCLUSION
In this capstone project, we validated that RFID indeed creates value for all apparel manufacturing
stages defined by our sponsor through qualitative and quantitative approaches. Within the scope of the
sponsor’s pilot, we showed that significant improvements in retail store can be achieved through
increased inventory visibility and exposure. In the logistics & distribution stage, we demonstrated that
advanced analytics using the machine learning approach, combined with additional data points from RFID,
can help to form supply chain execution policies that improve the overall supply chain agility. Although
the pilot was limited in scope, the learnings can nevertheless be applied to our sponsor’s other businesses.

37
In addition, they can be useful for other businesses in the apparel supply chain that use the traditional
mass manufacturing model seeking to improve supply chain agility.
Future Research
Our research was limited by data, and data that span over multiple years would have generated
insights with less bias and higher confidence, which our sponsor should consider for future research. In
addition, combined with the right questions and the additional supply chain checkpoints, our sponsor or
future researchers can conduct experiments that will quantitatively demonstrate RFID’s value creation
across all stages of the apparel supply chain between multiple stakeholders. This is an area that still needs
more development.

38
REFERENCES
Al-Kassab, J., Thiesse, F., & Buckel, T. (2013). RFID-Enabled Business Process Intelligence in Retail Stores: A Case Report. Journal of Theoretical and Applied Electronic Commerce Research, 8(2), 19–20. https://doi.org/10.4067/S0718-18762013000200010
Azevedo, S. G., & Carvalho, H. (2012). Contribution of RFID technology to better management of fashion supply chains. International Journal of Retail & Distribution Management, 40(2), 128-156. doi:10.1108/09590551211201874
Balaji, M. S., & Roy, S. K. (2017). Value co-creation with Internet of things technology in the retail industry. Journal of Marketing Management, 33(1/2), 7–31. https://doi.org/10.1080/0267257X.2016.1217914
Bertolini, M., Bottani, E., Ferretti, G., Rizzi, A., & Volpi, A. (2012). Experimental evaluation of business impacts of RFID in apparel and retail supply chain. International Journal of RF Technologies: Research & Applications, 3(4), 257–282
Bertolini, M., Romagnoli, G., & Weinhard, A. (2017). Proposing a Value-Added Indicators framework for the apparel and fashion sector: Design and empirical evaluation. International Journal of RF Technologies, 8(3), 143-164. doi:10.3233/rft-171674
Bottani, E., Montanari, R., & Romagnoli, G. (2016). Improving sales turnover in fashion retailing by means of an RFID-based replenishment policy. International Journal of RF Technologies: Research & Applications, 7(1), 65–86. https://doi.org/10.3233/RFT-150072
Budd, J., Knizek, C., & Tevelson, B. (2012). The Demand-Driven Supply Chain: Making It Work and Delivering Results. Boston Consulting Group.
Caro, F., & Sadr, R. (2019). The Internet of Things (IoT) in retail: Bridging supply and demand. Business Horizons, 62(1), 47-54. doi:10.1016/j.bushor.2018.08.002
Chen, D. Q., Preston, D. S., & Swink, M. (2015). How the Use of Big Data Analytics Affects Value Creation in Supply Chain Management. Journal of Management Information Systems, 32(4), 4–39. https://doi.org/10.1080/07421222.2015.1138364
Choi, S. H., Yang, Y. X., Yang, B., & Cheung, H. H. (2015). Item-level RFID for enhancement of customer shopping experience in apparel retail. Computers in Industry, 71, 10–23. https://doi.org/10.1016/j.compind.2015.03.003
Condea, C., Thiesse, F., & Fleisch, E. (2012). RFID-enabled shelf replenishment with backroom monitoring in retail stores. Decision Support Systems, 52(4), 839-849. doi:10.1016/j.dss.2011.11.018
Corkery, M. (2018, October 14). Sears, the Original Everything Store, Files for Bankruptcy. Retrieved October 20, 2018, from https://www.nytimes.com/2018/10/14/business/sears-bankruptcy-filing-chapter-11.html
39
Dimitriou, T. (2016). Key evolving RFID systems: Forward/backward privacy and ownership transfer of RFID tags. Ad Hoc Networks, 37, 195-208. doi:10.1016/j.adhoc.2015.08.019
Fish, L. (2017). A Historic Perspective on RFID Implementation over the Past Decade with a Focus on Apparel Retailers: Are we at the ‘Tipping Point’? Conference: Proceedings of the Northeast Decision Sciences Institute 2017.Springfield, MA
Germano, S. (2016, January 08). Millennial Shoppers Don't Fit the Norm. Retrieved August 20, 2018, from https://www.wsj.com/articles/millennial-shoppers-dont-fit-the-norm-1452213218
Gligor, D. M. (2015, October 22). The five dimensions of supply chain agility. Retrieved from https://www.supplychainquarterly.com/topics/Strategy/20151022-the-five-dimensions-of-supply-chain-agility/
Hammervoll, T. (2009). Value-Creation Logic in Supply Chain Relationships. Journal of Business-to-Business Marketing, 16(3), 220.
Hardgrave, B. C., Aloysius, J. A., & Goyal, S. (2013). RFID-Enabled Visibility and Retail Inventory Record Inaccuracy: Experiments in the Field. Production and Operations Management, 22(4), 843-856. doi:10.1111/poms.12010
Hwang, Y.-M., & Rho, J.-J. (2016). Strategic value of RFID for inter-firm supply chain networks: An empirical study from a resource and social capital perspective. Information Development, 32(3), 509–526. https://doi.org/10.1177/0266666914556910
Kull, T. J., Barratt, M., Sodero, A. C., & Rabinovich, E. (2013). Investigating the Effects of Daily Inventory Record Inaccuracy in Multichannel Retailing. Journal of Business Logistics, 34(3), 189–208. https://doi.org/10.1111/jbl.12019
Lee, H. (2007). Peering through a glass darkly. International Commerce Review, 7(1), 60-68.
Lieberman, M. B., Garcia-Castro, R., & Balasubramanian, N. (2016). Measuring value creation and appropriation in firms: The VCA model. Strategic Management Journal, 38(6), 1193-1211. doi:10.1002/smj.2565
Loureiro, A. L. D., Miguéis, V. L., & da Silva, L. F. M. (2018). Exploring the use of deep neural networks for sales forecasting in fashion retail. Decision Support Systems, 114, 81–93. https://doi.org/10.1016/j.dss.2018.08.010
MIT CTL (2018, November). “Future of Retail” Roundtable – insights summary. Retrieved March 9, 2019, from https://digitalsc.mit.edu/the-future-of-retail/
Mohamad, I. B., & Usman, D. (2013). Standardization and Its Effects on K-Means Clustering Algorithm. Research Journal of Applied Sciences, Engineering and Technology, 6(17), 3299-3303. doi:10.19026/rjaset.6.3638
Musa, A., & Dabo, A.-A. (2016). A Review of RFID in Supply Chain Management: 2000-2015. Global Journal of Flexible Systems Management, 17(2), 189–228. https://doi.org/10.1007/s40171-016-0136-2

40
Pantano, E., & Timmermans, H. (2014). What is smart for retailing? Procedia Environmental Sciences, 22, 101–107. doi:10.1016/j.proenv.2014.11.010
Pereira, M. M., Oliveira, D. L., Santos, P. P., & Frazzon, E. M. (2018). Predictive and Adaptive Management Approach for Omnichannel Retailing Supply Chains. IFAC-PapersOnLine, 51(11), 1707-1713. doi:10.1016/j.ifacol.2018.08.210
Reyes, P. M., Li, S., & Visich, J. K. (2016). Determinants of RFID adoption stage and perceived benefits. European Journal of Operational Research, 254(3), 801–812. https://doi.org/10.1016/j.ejor.2016.03.051
Rizzi, A., Romagnoli, G., & Thiesse, F. (2016). A new framework for RFID use cases in fashion and apparel retailing. International Journal of RF Technologies, 7, 105-129.
Saghiri, S., Wilding, R., Mena, C., & Bourlakis, M. (2017). Toward a three-dimensional framework for omni-channel. Journal of Business Research, 77, 53-67. doi:10.1016/j.jbusres.2017.03.025
Schmidt, M., Thoroe, L., & Schumann, M. (2013). RFID and Barcode in Manufacturing Logistics: Interface Concept for Concurrent Operation. Information Systems Management, 30(2), 100.
Statista. (2019). Global Apparel Market - Statistics & Facts. Retrieved from https://www.statista.com/topics/5091/apparel-market-worldwide/
Taylor, K. (2018, July 03). These haunting photos of the retail apocalypse reveal a new normal in America. Retrieved August 17, 2018, from https://www.businessinsider.com/the-american-retail-apocalypse-in-photos-2017-3
Townsend, M., Quoc, T. L., Kapoor, G., Hu, H., Zhou, W., & Piramuthu, S. (2018). Real-Time business data acquisition: How frequent is frequent enough? Information & Management, 55(4), 422-429. doi:10.1016/j.im.2017.10.002
Vlachos, I. P. (2014). A hierarchical model of the impact of RFID practices on retail supply chain performance. Expert Systems with Applications, 41(1), 5-15. doi:10.1016/j.eswa.2013.07.006
Watson, M. Z., & Yan, R.-N. (2013). An exploratory study of the decision processes of fast versus slow fashion consumers. Journal of Fashion Marketing and Management; Bradford, 17(2), 141–159. http://dx.doi.org/10.1108/JFMM-02-2011-0045
Zhang, L., Ferrero, R., Gandino, F., & Rebaudengo, M. (2016). Investigation of Interference Models for RFID Systems. Sensors,16(2), 199. doi:10.3390/s16020199