4.3 boxplots and iqr practiceiqr = 3 - 1 = 2 min = 64 q1 = 75 med = 80 q3 = 86 max = 93 iqr = 86 -...
TRANSCRIPT
4.3BoxplotsandIQR
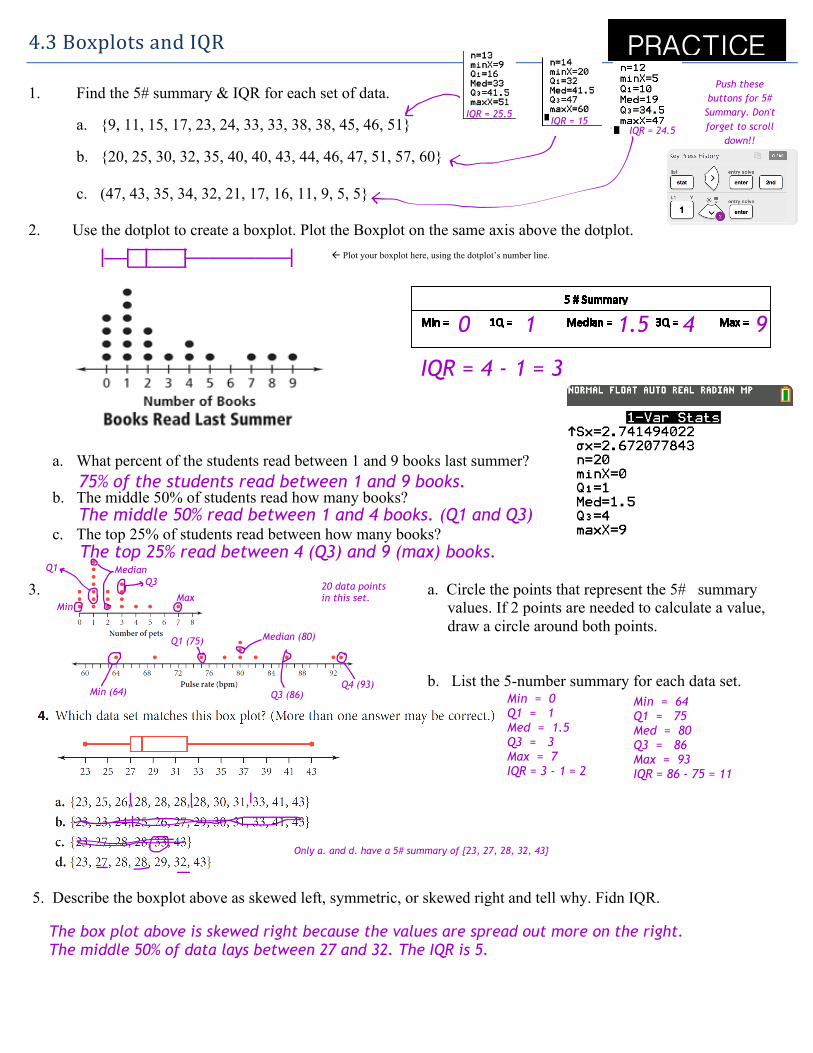
1. Find the 5# summary & IQR for each set of data.
a. {9, 11, 15, 17, 23, 24, 33, 33, 38, 38, 45, 46, 51}
b. {20, 25, 30, 32, 35, 40, 40, 43, 44, 46, 47, 51, 57, 60}
c. (47, 43, 35, 34, 32, 21, 17, 16, 11, 9, 5, 5}
2. Use the dotplot to create a boxplot. Plot the Boxplot on the same axis above the dotplot.ß Plot your boxplot here, using the dotplot’s number line.
a. What percent of the students read between 1 and 9 books last summer?
b. The middle 50% of students read how many books?
c. The top 25% of students read between how many books?
3. a. Circle the points that represent the 5# summary values. If 2 points are needed to calculate a value,
draw a circle around both points.
b. List the 5-number summary for each data set.
5. Describe the boxplot above as skewed left, symmetric, or skewed right and tell why. Fidn IQR.
PRACTICE
0 1 1.5 4 9
| | | | |_____ _________
75% of the students read between 1 and 9 books.
The middle 50% read between 1 and 4 books. (Q1 and Q3)
MedianQ1
Max
Q3
Min
20 data points in this set.
Min (64)
Q1 (75) Median (80)
Q3 (86)Q4 (93)
The top 25% read between 4 (Q3) and 9 (max) books.
Only a. and d. have a 5# summary of {23, 27, 28, 32, 43}
__ _____
Min = 0 Q1 = 1 Med = 1.5 Q3 = 3 Max = 7 IQR = 3 - 1 = 2
Min = 64 Q1 = 75 Med = 80 Q3 = 86 Max = 93 IQR = 86 - 75 = 11
The box plot above is skewed right because the values are spread out more on the right. The middle 50% of data lays between 27 and 32. The IQR is 5.
IQR = 25.5IQR = 15
Push these buttons for 5#
Summary. Don't forget to scroll
down!!IQR = 24.5
IQR = 4 - 1 = 3
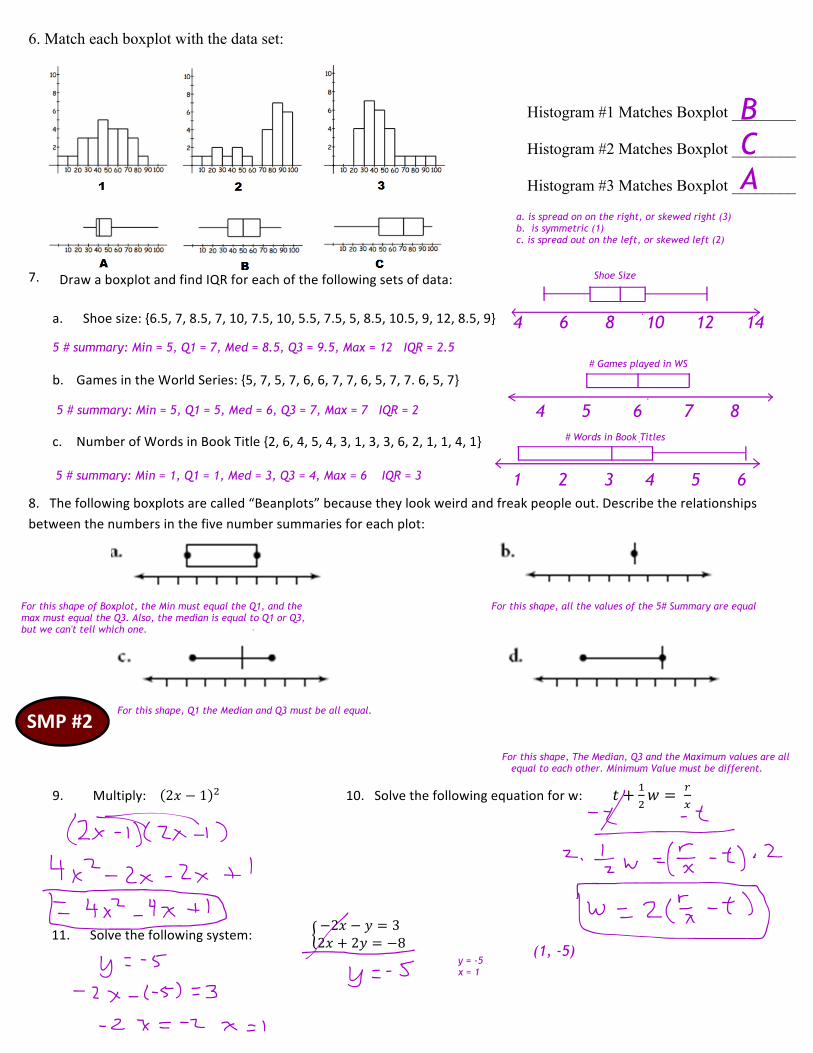
6. Match each boxplot with the data set:
Histogram #1 Matches Boxplot ________
Histogram #2 Matches Boxplot ________
Histogram #3 Matches Boxplot ________
a. Shoesize:{6.5,7,8.5,7,10,7.5,10,5.5,7.5,5,8.5,10.5,9,12,8.5,9}
b. GamesintheWorldSeries:{5,7,5,7,6,6,7,7,6,5,7,7.6,5,7}
c. NumberofWordsinBookTitle{2,6,4,5,4,3,1,3,3,6,2,1,1,4,1}
8. Thefollowingboxplotsarecalled“Beanplots”becausetheylookweirdandfreakpeopleout.Describetherelationshipsbetweenthenumbersinthefivenumbersummariesforeachplot:
9. Multiply: 2! − 1 % 10. Solvethefollowingequationforw: & + (%) = ,-
11. Solvethefollowingsystem:−2! − . = 32! + 2. = −8
SMP#2
For this shape of Boxplot, the Min must equal the Q1, and the For this shape, all the values of the 5# Summary are equal max must equal the Q3. Also, the median is equal to Q1 or Q3, but we can't tell which one.
For this shape, Q1 the Median and Q3 must be all equal.
For this shape, The Median, Q3 and the Maximum values are all equal to each other. Minimum Value must be different.
B C A
a. is spread on on the right, or skewed right (3)b. is symmetric (1)c. is spread out on the left, or skewed left (2)
4 5 6 7 8
| | | | |
| | |
4 6 8 10 12 14
Shoe Size
| | | |# Words in Book Titles
# Games played in WS
(1, -5)y = -5 x = 1
5 # summary: Min = 5, Q1 = 7, Med = 8.5, Q3 = 9.5, Max = 12 IQR = 2.5
1 2 3 4 5 65 # summary: Min = 1, Q1 = 1, Med = 3, Q3 = 4, Max = 6 IQR = 3
5 # summary: Min = 5, Q1 = 5, Med = 6, Q3 = 7, Max = 7 IQR = 2
7. Drawaboxplotand find IQR foreachofthefollowingsetsofdata: