41164r04 - digital library/67531/metadc781061/m2/1/high... · mechanical engineering department ......
TRANSCRIPT
Report 41164R04
ADAPTIVE FULL-SPECTRUM SOLAR ENERGY SYSTEMS Cross-Cutting R&D on adaptive full-spectrum solar energy systems for more efficient and
affordable use of solar energy in buildings and hybrid photobioreactors
Semi-Annual Technical Progress Report For Period Ending August 2, 2003
Byard D. Wood, Project Director Mechanical Engineering Department Mail Stop 312 University of Nevada, Reno Reno, NV 89557
Jeff D. Muhs, Principal Investigator Oak Ridge National Laboratory 2360 Cherahala Blvd. Bldg. NTRC, MS 6472 Knoxville, TN 37932
PREPARED FOR
NATIONAL ENERGY TECHNOLOGY LABORATORY THE UNITED STATES DEPARTMENT OF ENERGY
DOE Award Number DE-FC26-01NT41164
Energy Crosscutting Science Initiative Office of Energy Efficiency and Renewable Energy
Date Published – January 2003

ii
ABTRACT This RD&D project is a three year team effort to develop a hybrid solar lighting (HSL) system that transports day light from a paraboloidal dish concentrator to a luminaire via a large core polymer fiber optic. The luminaire can be a device to distribute sunlight into a space for the production of algae or it can be a device that is a combination of day lighting and fluorescent lighting for office lighting. In this project, the sunlight is collected using a one-meter paraboloidal concentrator dish with two-axis tracking. The secondary mirror consists of eight planar-segmented mirrors that direct the visible part of the spectrum to eight fibers (receiver) and subsequently to eight luminaires. This results in about 8,200 lumens incident at each fiber tip. Each fiber can illuminate about 16.7 m2 (180 ft2) of office space. The IR spectrum is directed to a thermophotovoltaic array to produce electricity. This report describes several investigations of various aspects of the system. Taken as a whole, they confirm significant progress towards the technical feasibility of this technology.
DISCLAIMER This report was prepared as an account of work sponsored by an agency of the United States Government. Neither the United States Government nor any agency thereof, nor any of their employees, makes any warranty, express or implied, or assumes any legal liability or responsibility for the accuracy, completeness, or usefulness of any information, apparatus, product or process disclosed, or represents that its use would not infringe on privately owned rights. Reference herein to any specific commercial product, process, or service by trade name, trademark, manufacturer, or otherwise does not necessarily constitute or imply its endorsement, recommendation, or favoring by the United States Government or any agency thereof. The views and opinions of authors expressed herein do not necessarily state or reflect those of the United States Government or any agency thereof.
PREFACE This report is a joint effort between Oak Ridge National Laboratory and the University of Nevada, Reno, and as such it satisfies the reporting requirements for the University and ORNL as the M&O for this project. The report starts May 1st, 2003, the revised beginning of Budget Period Two and goes through August 1, 2003.

iii
TABLE OF CONTENTS PageLIST OF FIGURES. . . . . . . . . . . . . . . . . . . . . . . . . . . . . . . . . . . . . . . . .. . . . . . . . . . . . . . . . iv PARTICIPATING ORGANIZATIONS . . . . . . . . . . . . . . . . . . . . . . . . . . . . . . . . . . . . . . . . v EXECUTIVE SUMMARY. . . . . . . . . . . . . . . . . . . . . . . . . . . . . . . . . . . . . . . . .. . . . . . . . . . vi PROJECT DESCRIPTION. . . . . . . . . . . . . . . . . . . . . . . . . . . . . . . . . . . . . . . . .. . . . . . . . . . 1 SCOPE OF WORK . . . . . . . . . . . . . . . . . . . . . . . . . . . . . . . . . . . . . . . . .. . . . . . . . . . . . . . . . 1 PROGRESS TOWARDS PROJECT OBJECTIVES . . . . . . . . . . . . . . . . . . . . . . . . . . . . . . 2
High-Lumen Test System . . . . . . . . . . . . . . . . . . . . . . . . . . . . . . . . . . . . . . . . . . . . . 2 Non-Imaging Device and TPV Array Testing. . . . . . . . . . . . . . . . . . . . . . . . . . . . . . 3 Prediction of Attenuation Loss for POFs. . . . . . . . . . . . . . . . . . . . . . . . . . . . . . . . . . 5 Design Optimization, TRNSYS HLS Model Update, and Fiber Transmission Testing. . . . . . . . . . . . . . . . . . . . . . . . . . . . . . . . . . . . . . . . . . . . . . . . . . . . . . . . . . . . Collector/Receiver. . . . . . . . . . . . . . . . . . . . . . . . . . . . . . . . . . . . . . . . . . . . . . . . . . . Header Design, Mass Transfer, Buffering Solution and New Tracker/Collector & Long-Term Growth Test. . . . . . . . . . . . . . . . . . . . . . . . . . . . . . . . . . . . . . . . . . . . . .
7
13
14 CONCLUSIONS. . . . . . . . . . . . . . . . . . . . . . . . . . . . . . . . . . . . . . . . .. . . . . . . . . . . . . . . . . . 24 DISTRIBUTION. . . . . . . . . . . . . . . . . . . . . . . . . . . . . . . . . . . . . . . . . . . . . . . . . . . . . . . . . . 24

iv
LIST OF FIGURES PageFig. 1 Expanded fiber core . . . . . . . . . . . . . . . . . . . . . . . . . . . . . . . . . . . . . . . . . . . . . . . 2 Fig. 2 Temperature vs. Time for 6/10/03 . . . . . . . . . . . . . . . . . . . . . . . . . . . . . . . . . . . . 3 Fig. 3 Non-Imaging Device with broken mirror. . . . . . . . . . . . . . . . . . . . . . . . . . . . . . . 4 Fig. 4 Cooling circuit and thermocouples on top of NI tube. . . . . . . . . . . . . . . . . . . . . 4 Fig. 5 Light distribution on the same top-floor plan. . . . . . . . . . . . . . . . . . . . . . . . . . . . 5 Fig. 6 Light distribution on the two-story floor plan. . . . . . . . . . . . . . . . . . . . . . . . . . . 5 Fig. 7 The sketch of sample light distribution system used in the analysis of any-type
fiber loss. . . . . . . . . . . . . . . . . . . . . . . . . . . . . . . . . . . . . . . . . . . . . . . . . . . . . . . .
6 Fig. 8 Spectral properties of the fiber and the eye response. . . . . . . . . . . . . . . . . . . . . . 8 Fig. 9 The reduction of light energy for each optical component. . . . . . . . . . . . . . . . . . 9 Fig. 10 The spectral distribution of the energy leaving each optical component. . . . . . . 10 Fig. 11 Attenuation due to bending and angle of incidence. . . . . . . . . . . . . . . . . . . . . . . 10 Fig. 12 Relative transmission of light due to a bend of a given radius. . . . . . . . . . . . . . . 11 Fig. 13 RPI transmission in 1 meter cable. . . . . . . . . . . . . . . . . . . . . . . . . . . . . . . . . . . . 11 Fig. 14 Comparison of modeled (RPI) and empirical (ORNL) transmission in straight
fiber. . . . . . . . . . . . . . . . . . . . . . . . . . . . . . . . . . . . . . . . . . . . . . . . . . . . . . . . . . . .
12 Fig. 15 Change of visible light spectrum due to components of HLS. . . . . . . . . . . . . . . 12 Fig. 16 Stages of light collection system. . . . . . . . . . . . . . . . . . . . . . . . . . . . . . . . . . . . . 13 Fig. 17 New Header and Membrane. . . . . . . . . . . . . . . . . . . . . . . . . . . . . . . . . . . . . . . . . 14 Fig. 18 Flow Characteristics of Several Header Designs. . . . . . . . . . . . . . . . . . . . . . . . . 15 Fig. 19 CO2 concentration as a function of flow rate and temperature. . . . . . . . . . . . . . . 15 Fig. 20 Flow of media through the membrane (onset of flow) . . . . . . . . . . . . . . . . . . . . 16 Fig. 21 Flow of media through the membrane (saturation flow) . . . . . . . . . . . . . . . . . . . 16 Fig. 22 Selection of cyanobacterial strains with elevated resistance to an
antimetabolite. . . . . . . . . . . . . . . . . . . . . . . . . . . . . . . . . . . . . . . . . . . . . . . . . . . .
16 Fig. 23 General view of migrated population of “3.2.2 s.c.1 Positive” . . . . . . . . . . . . . . 17 Fig. 24 Photomicrograph of leading edge of “3.2.2 s.c.1 Positive” . . . . . . . . . . . . . . . . . 18 Fig. 25 General view of migrated population of “3.2.2 s.c.1 Positive” . . . . . . . . . . . . . . 18 Fig. 26 Photomicrograph of leading edge of “3.2.2 s.c.1 “Positive” . . . . . . . . . . . . . . . . 19 Fig. 27 Secondary mirror and fiber array. . . . . . . . . . . . . . . . . . . . . . . . . . . . . . . . . . . . . 20 Fig. 28 Solar tracker-collector assembly. . . . . . . . . . . . . . . . . . . . . . . . . . . . . . . . . . . . . 20 Fig. 29 Photobioreactor lighting panels (luminaires) Image #1. . . . . . . . . . . . . . . . . . . . 21 Fig. 30 Photobioreactor lighting panels (luminaires) Image #2. . . . . . . . . . . . . . . . . . . . 22 Fig. 31 Organism S.C. 1.2(2) loaded on pilot bioreactor membrane. . . . . . . . . . . . . . . . 23

v
PARTICIPATING ORGANIZATIONS
Organization Abbreviation Principal Investigator University of Nevada, Reno UNR Byard Wood Oak Ridge National Lab P.O. Box 2009, MS-8058 Oak Ridge, TN 32831
ORNL Jeff Muhs
JX Crystals, Inc. 1105 12th Avenue NW, Suite A2 Issaquah, WA 98027
JXC Lewis Fraas
Ohio University Dept. of Mechanical Engineering 248 Stocker Center Athens, OH 45701-2979
OU David Bayless
Rensselaer Polytechnic Institute Lighting Research Center 21 Union Street Troy, NY 12180-3352
RPI Nadarajah Narendran
Science Application International Corporation 9455 Towne Centre Drive San Diego, California 92121
SAIC Robin Taylor
3M Company 3M Corporate Process Technology Center St. Paul, MN 55144-1000
3M Jennifer Sahlin
TVA Public Power Institute 1101 Market Street, MR 2T Chattanooga, TN 37402-2801
TVA David Dinse
University of Arizona Department of Agricultural and Biosystems Engineering 507 Shantz Building Tucson, AZ 85721
UA Joel Cuello
University of Wisconsin Solar Energy Lab 1500 Johnson Dr. Madison, WI 53706
UW William Beckman
The contributions of each of these individuals in the preparation of this report are gratefully acknowledged.

vi
EXECUTIVE SUMMARY This RD&D project is a three year team effort to develop a hybrid solar lighting (HSL) system that transports day light from a paraboloidal dish concentrator to a luminaire via a large core polymer fiber optic. The luminaire can be a device to distribute sunlight into a space for the production of algae or it can be a device that is a combination of solar lighting and fluorescent lighting for office lighting. In this project, the sunlight is collected using a one-meter paraboloidal concentrator dish with two-axis tracking. The secondary mirror consists of eight planar-segmented mirrors that direct the visible part of the spectrum to eight fibers (receiver) and subsequently to eight luminaires. This results in about 8,200 lumens incident at each fiber tip. The IR spectrum is directed to a thermophotovoltaic array to produce electricity. This report describes the technical progress from May 1, 2002 through August 1, 2003). The goals of this project are to:
1. Determine technical feasibility of using full-spectrum solar energy systems to enhance the overall sunlight utilization in buildings and biomass production rates of photobioreactors. This will be accomplished by developing a benchmark prototype system.
2. Determine the commercial viability of using full-spectrum solar energy systems to enhance the
overall sunlight utilization in buildings and biomass production rates of photobioreactors. This will be accomplished by determining those aspects that characterize performance efficiency, reliability, durability and ultimately minimum cost potential.
3. Demonstrate the HSL technology in a building application and a photobioreactor application.
The emphasis in developing the demonstration systems will be to meet performance objectives at minimum cost.
During the reporting period, the project team made progress towards the completion of the TRNSYS Full-Spectrum Solar Energy System model, the TPV array tests, the high-lumen test devices, the collector/receiver, fiber transmission models, and portions of the photobioreactor system. Accomplishments for this period are:
1. Experimental and analytical work was performed on the high-lumen test system. Steps are being taken to determine the appropriate combination of filters and/or quartz pieces to protect the fiber from overexposure to damaging IR radiation during the long-term tests.
2. Work was performed on the test system for the TPV array. A cooling circuit was built to keep the array cooled off below the maximum operating temperature, and a cold mirror was ordered to only transmit the IR portion of the sunlight to the TPV array, thus imitating the conditions of the full-spectrum system.
3. Updates were performed on the TRNSYS system model. Also, an EES program was written that correctly calculates the transmission of the fiber as a function of length, wavelength and entrance angle.
4. Modeling work was also performed on a FORTRAN model that can predict the attenuation loss of an arbitrary fiber. Fiber configurations inside a building were investigated so that model parameters could be developed
5. A new stainless-steel header was designed and tested for the photobioreactor. Biofilm mass transfer rate tests were performed, and buffering solutions for the organisms were tested. A new solar collector and fiber optic cables were installed at the pilot scale bioreactor facility and appears to be working well.

1
PROJECT DESCRIPTION This project is part of the FY 2000 Energy Efficiency Science Initiative that emphasized Cross-Cutting R&D in Solicitation No.: DE-PS36-00GO10500. It is a three year research project that addresses key scientific hurdles associated with adaptive, full-spectrum solar energy systems and associated applications in commercial buildings and new hybrid solar photobioreactors. The goal of this proposal is to demonstrate that full-spectrum solar energy systems can more than double the affordability of solar energy in commercial buildings and hybrid solar photobioreactors used in CO2 mitigation and compete favorably with existing alternatives. This project is a multi-team effort to develop a hybrid solar lighting (HSL) system that transports solar light from a paraboloidal dish concentrator to a luminaire via a large core polymer fiber optic. The luminaire can be a device to distribute sunlight into a space for the production of algae or it can be a device that is a combination of solar lighting and fluorescent lighting for office lighting. In this project, the sunlight is collected using a one-meter paraboloidal concentrator dish with two-axis tracking. The secondary mirror consists of eight planar-segmented mirrors that direct the visible part of the spectrum to eight fibers (receiver) and subsequently to eight luminaires. This results in about 8,200 lumens incident at each fiber tip. The IR spectrum is directed to a thermophotovoltaic array to produce electricity. This report describes the technical progress from May 1, 2002 through August 1, 2003, which is the first three months of Phase II. SCOPE OF WORK The key scientific hurdles are being addressed in a three-phase effort, viz.: Phase I. Assess Technical Feasibility Determine technical feasibility of using full-spectrum solar energy systems to enhance the overall sunlight utilization in buildings and biomass production rates of photobioreactors. This will be accomplished by developing a benchmark prototype system that can evaluate the solar lighting technology that was outlined in the original proposal. Phase II. Assess Commercial Viability Determine the commercial viability of using full-spectrum solar energy systems to enhance the overall sunlight utilization in buildings and biomass production rates of photobioreactors. This will be accomplished by determining those aspects that characterize performance efficiency, reliability, durability and ultimately minimum cost potential. This phase will culminate with the design and construction of an alpha system that shows significant improvement in the performance cost ratio. Phase III. Assess System Affordability Demonstrate the HSL technology in a building application and a photobioreactor application. The emphasis in developing the demonstration systems will be to meet performance objectives at minimum cost via a beta system or pre-commercial prototype system.
2
PROGRESS TOWARDS PROJECT OBJECTIVES The emphasis during this reporting period has been on the following items:
1. High-lumen test system 2. Non-imaging device for the TPV array and TPV System Testing 3. Prediction of attenuation loss for polymer optical fibers 4. Design optimization, TRNSYS model update, and fiber transmission testing 5. Collector/receiver and light delivery subassemblies. 6. Photobioreactor header design, mass transfer, buffering solution, new tracker/collector and long-
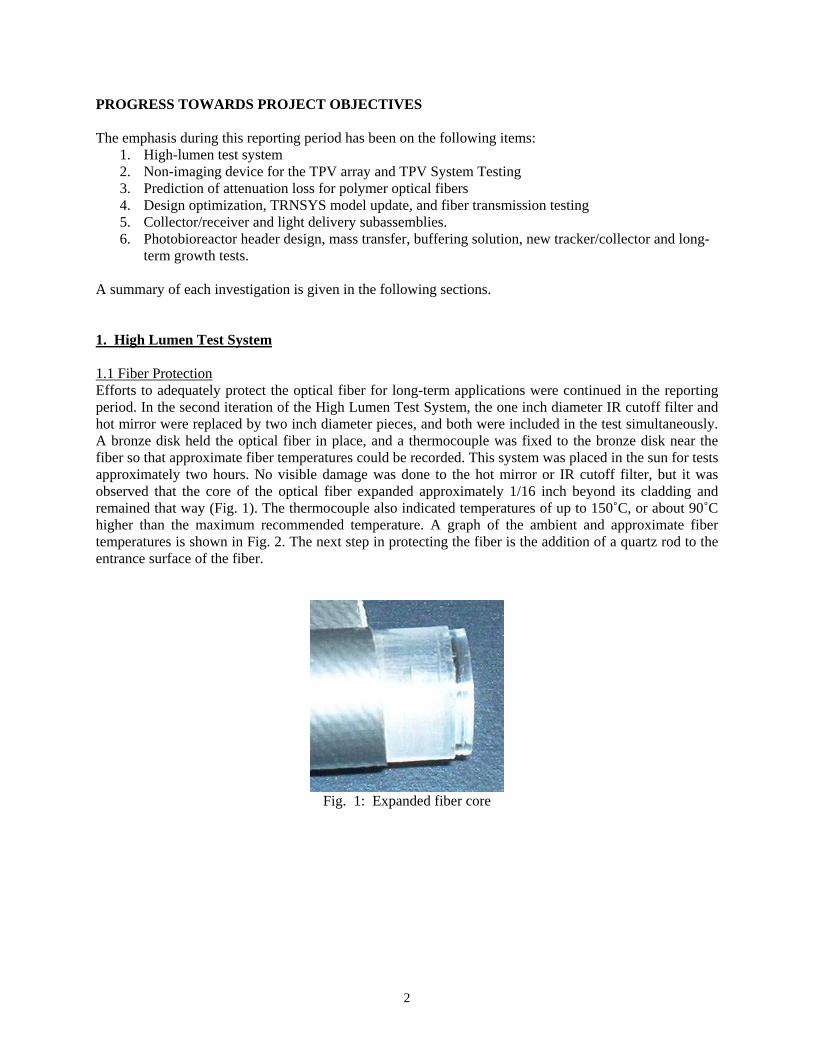
term growth tests. A summary of each investigation is given in the following sections. 1. High Lumen Test System 1.1 Fiber Protection Efforts to adequately protect the optical fiber for long-term applications were continued in the reporting period. In the second iteration of the High Lumen Test System, the one inch diameter IR cutoff filter and hot mirror were replaced by two inch diameter pieces, and both were included in the test simultaneously. A bronze disk held the optical fiber in place, and a thermocouple was fixed to the bronze disk near the fiber so that approximate fiber temperatures could be recorded. This system was placed in the sun for tests approximately two hours. No visible damage was done to the hot mirror or IR cutoff filter, but it was observed that the core of the optical fiber expanded approximately 1/16 inch beyond its cladding and remained that way (Fig. 1). The thermocouple also indicated temperatures of up to 150˚C, or about 90˚C higher than the maximum recommended temperature. A graph of the ambient and approximate fiber temperatures is shown in Fig. 2. The next step in protecting the fiber is the addition of a quartz rod to the entrance surface of the fiber.
Fig. 1: Expanded fiber core

3
Temperature vs Time
20
40
60
80
100
120
140
13:26:24 13:40:48 13:55:12 14:09:36 14:24:00 14:38:24 14:52:48 15:07:12 15:21:36
Time
Tem
pera
ture
(C)
Fiber TempAmbient Temp
Fig. 2: Temperature vs. Time for 6/10/03
1.2 Modeling A basic TracePro model including the Fresnel lens, hot mirror, plano-concave lens, IR filter, quartz rod, and fiber entrance surface has been constructed. This model will be used to get an approximate value for Watts striking the entrance region of the fiber, and then that number can be used with other models to get an approximate fiber temperature. This will be compared with experimental data, and will help decide the length of the quartz rod. 1.3 Fiber Test Specimen Search Information on several brands of large core optical fiber was gathered, and the four that best fit the needs of this project are shown in Table 1 below.
Table 1: Fiber Information Company Name
Fiber Name
Diameter (mm)
Max Temp (C) Attenuation
Price/ft Shipping
Lumenyte SEL 500 12.4 90 1.5% per ft $5.25 $15.46 PolyOptics Poly 120 12 120 3% per m $3.60 $61.00 Translight ---- 12 120 $8.20
Ultratec UFO 6003 13.8
200 (80 for longterm) 0.8dB/m
2. Non-Imaging Device and TPV Array Testing During the reporting period, the construction of the non-imaging (NI) device for the TPV array was mostly completed. A rectangular tube made of 96% reflective glass walls, with an aluminum frame and flange to mount the TPV array too, was constructed and tested. Unfortunately, the concentrated irradiance (about 56x) from the entire dish was too much for the 1/8” glass substrate of the mirrors, and cracks developed in two of the four mirrors, as can be seen in Fig. 3.

4
Fig. 3: Non-Imaging Device with broken mirror
A cold mirror was purchased from Navitar Coatings that has the same properties as the cold mirror used in the Benchmark systems installed at ORNL and OU. This mirror should help to reduce the flux incident on the TPV array to keep it below the maximum operating temperature. A mounting bracket was machined that allows the mirror to move along the central axis of the parabolic mirror, so that a location can be found where the flux is spread evenly across the cold mirror. With this cold mirror blocking the visible irradiance and the cooling circuit removing wasted heat from the array, the system should be able to operate under the maximum temperature. Once it is shown that it can operate cool enough, several tests will be performed to determine the performance of the TPV array. To assist in keeping the TPV array from overheating, a cooling coil was constructed from copper tubing that uses a chiller to cool off the back of the array. This will allow I-V curves to be generated at different operating temperatures of the array. Initial tests showed that the coil could cool off a brass plate from 213oC to 117oC with an ambient temperature of 41oC and water as the working fluid. This was done with 50% of the dish shaded and no cold mirror, as is shown in Fig. 4. With ethylene glycol instead of water, the chiller can run at lower temperatures and remove more heat from the TPV array.
Fig. 4: Cooling circuit and thermocouples on top of NI tube

5
3. Prediction of Attenuation Loss for POFs The simulation of an arbitrary fiber loss can be made provided that the position of each luminaire is fixed. Therefore, in the analysis of light distribution system, it is important that configuration, i.e. the position of luminaries relative to the solar collector, can be known or estimated in priori. A sample light distribution system for typical solar lighting system can be given in the case of top-floor and two-floor lighting. Figure 5 shows the light distribution system based on top floor lighting and Fig. 6 presents the same system for the lighting of two-floor space. It was noted that either of these distribution types, i.e. top-floor or two-floor, can be investigated through the three-coordinate-axis system as presented in Fig. 7. Maximum fiber length was estimated to be about 10-m.
Fig. 5: Light distribution on the same top-floor plan
The light distribution systems given in Figures 5 and 6 apply minimum number of bent sections. According to these figures, the total number of straight and bent sections was estimated to be six, (three for straight section and three for bent sections) in the case of both top-floor and two-floor lighting.
Fig. 6: Light distribution on the two-story floor plan.
Luminaire 1 Luminaire 2 Luminaire 3 Luminaire 4
Luminaire 5 Luminaire 6 Luminaire 7 Luminaire 8
Sun
Top floor
Preceding floor

6
Fig. 7: The sketch of sample light distribution system used in the analysis of any-type fiber loss. In Fig. 7, 1L , 2L , and 3L are the length of the straight sections and 1R , 2R , and 3R are appropriate radius of curvature. Straight section fiber length and bending radius fall in a range which would be encountered in a practice solar lighting application. The minimum curvature radius due to the mechanic constraints of 3M optical fiber is determined to be about R/r = 10. Nevertheless, bending loss of this fiber increases to unacceptable levels below R/r = 16. Hence, further optimization study of the light distribution system based on such constraints as material cost and light transmission is a necessity. Approximate ranges for the straight and bent section dimensions are given below:
]150,100,50[1 cmcmcmL ,
]80,60,40,20[1
rR
, οο 138905.11 =+= =−massairθθ ,
]500,..,100,50[2 cmcmcmL ,
]20,15,10[2
rR
,
]500,450,..,450,500[ cmcmcmcmx −− , ]500,450,..,450,500[ cmcmcmcmy −− ,
]20,15,10[3
rR
Configuration of the light distribution system incorporates approximate-estimate installation plan for the fibers. Geometrical consideration is concerned with different fiber core and cladding radii as well as different values for the length of straight section and radius of curvature. Optical property consideration incorporates different core-cladding refractive index combinations and a range for the bulk absorption and scattering coefficients combination. In the current analysis, the loss due to core-cladding roughness is not included since the physics of the light scatter at the core-cladding interface is not known.
Steps in the analysis:
• It looks like that practical or approximate light distribution system will resemble the one given in Fig. 5 for top-floor lighting and Fig. 6 for two-floor lighting.
L1
R2
L2
R1
L3
R3
R3
x
y
X
Y
Sun
East West
Luminaire
Luminaire
7
• The fiber distribution system will be analyzed due to Fig. 7. • The simulation results will present loss of any fiber at any arbitrary location in the distribution of
solar light. • Monograms or equations representing the light loss of any fiber up to individual luminaire will be
given. • Results of an experimental study can be compared with these simulation results.
4. Design Optimization, TRNSYS HLS Model Update, and Fiber Transmission Testing 4.1 Design Optimization The April, 2003 report documented a method to relate the illumination provided by the HLS to the total system cost. This analysis requires knowledge of the efficiency, size, and cost of each of the components in the HLS. Continuous functions are presently used to provide this information to the model, and a parametric analysis in which many of the system components are fixed and one or two are allowed to vary is used to find the design optimum. This approach is admittedly simplistic and its usefulness is limited by the complexity of the HLS. The design optimization model must accommodate discrete component cost and performance data and it must be able to find an optimum design solution varying all system components. Optimization literature is presently being reviewed to find suitable analytic methods. Possible solutions include the use of a Hessian matrix, or the method of Lagrange multipliers. Two papers were submitted to conferences: the ISES conference in Gotenborg Sweden, and the ASES conference in Austin, TX. A paper for the Solar Energy Journal was prepared for submission. 4.2 TRNSYS HLS Model Update 4.2.1 Controller Experiments at ORNL The main objective of the controller research is to identify and quantify factors limiting the performance of commercially available control units designed to control the illumination level in a workplane. A sample of commercially available control units suitable for the Hybrid Lighting System (HLS) has been identified and experimentally tested. A thesis (for the Norwegian University of Science and Technology) authored by Trine Pande-Rolfsen will be available in late July. 4.2.2 Updating the TRNSYS HLS Model UW-Madison developed a Hybrid Lighting System (HLS) model in TRNSYS to calculate energy savings and break-even capital cost of the new technology. Within the TRNSYS model is an in-house developed FORTRAN program that quantifies the performance of the HLS over the visible and infrared spectrums. This code was created near the beginning of the project, and changes in the design of the HLS as well as recent information concerning the reflectivity and attenuation of some of the components warranted review of the TRNSYS model. The update is ongoing. Changes made are detailed below.
4.2.2a Effect of the Luminous Flux Entrance Angle The current TRNSYS model modifies the radiation being reflected and transmitted by each component in the HLS as functions of wavelength in 5 nm bands. Recent work at ORNL has shown that the reflectance of the mirrors and attenuation in the optical fiber are also functions of the incident angle of the radiation. Though ORNL does not have a combined model of the system (ZEMAX ray-tracing software models the mirror stage, a Visual Basic code predicts attenuation in the fiber and the color temperature of exiting

8
light), the results of the ORNL models were compared with the results of the TRNSYS model at the corresponding stages to determine if the differences were significant. ZEMAX predicts an 89.6% overall efficiency of the primary and secondary mirrors of the new alpha system. This efficiency is defined as
η = Lumens intoprimary
Lumens ref lectedf romsecondary The TRNSYS model predicts an efficiency of 90%. The small difference in efficiency does not warrant a change to the TRNSYS model for simulation of the alpha system. However, ZEMAX predicted an efficiency of 78% for the currently deployed system that TRNSYS was developed to simulate. Larger flux angles in the deployed system result in less light being reflected by the secondary mirror. The larger flux entrance angles are caused by the geometry of the mirrors of the deployed design. For simulating this system, the TRNSYS model is over-estimating the efficiency of the mirror stages and needs to be changed. For both cases, the spectrum of the light leaving the mirror stage appeared similar. The differences in the transmittance of the fiber predicted by the empirically-derived ORNL model and TRNSYS are shown in Fig. 8 for the alpha system using a 10 m length of fiber.
400 450 500 550 600 650 7000
0.2
0.4
0.6
0.8
1
1.2
0
0.1
0.2
0.3
0.4
0.5
0.6
0.7
0.8
0.9
1
λ [nm]
Mra
d,qr
od [
W/n
m]
Mrad,qrodMrad,qrod
τ fib
er,la
mbd
a
τfiber,TRNSYSτfiber,TRNSYS
τfiber,lambda,alphaτfiber,lambda,alpha
VlambdaVlambda
Fig. 8: Spectral properties of the fiber and the eye response.
It is clear that the TRNSYS model under-estimates the transmittance of radiation through the fiber in the alpha system. However, when the entrance angles of the deployed design are modeled, TRNSYS over-estimates the transmittance of the radiation through the fiber. An EES program has been written that correctly calculates the transmission of the fiber as a function of length, wavelength and entrance angle. The EES code has not yet been incorporated into TRNSYS. 4.2.2b Use of Quartz Rods at the Entrance of the Fibers

9
The TRNSYS model uses a parameter called the “Optical Fiber Entrance Transmittance” to accommodate the loss of some light at the entrance of the fiber optic system. However, in both the deployed design and in the alpha design the light passes through quartz rods before entering the fiber. The quartz rods were added to prevent local end-heating of the fiber optic cable by diffusing the focused light coming from the secondary mirror. Fewer fibers have failed after inclusion of these rods. Unfortunately, losses are induced by the quartz rods. At each air/glass interface, approximately 4% of the light is lost due to differences in the index of refraction. In the alpha system, additional losses are related to the packing fraction of the bundled fiber. Presently, losses due to reflectance are estimated to be 12% and losses to packing 7%. An EES program has been written to accommodate these losses and include losses due to entrance angle mentioned earlier. The program accounts for the following components: primary mirror, secondary mirror, quartz rods, optical fiber, and luminaires. The mirrors’ reflectance is a function of wavelength and the fiber’s transmittance is a function of wavelength and entrance angle. All other component efficiencies are wideband. The program calculates the spectrum of light and the amount of visible light after each component of the system. Results for a 1 m2 collector with 10 m length of cable under a June sky in Knoxville, TN at 2 pm are shown in Figures 9 and 10. ORNL does not have an inclusive model of the system. ORNL requested a copy of this program with a demonstration version of EES.
Fig. 9: The reduction of light energy for each optical component
0.5 1.5 2.5 3.5 4.5 5.5 6.50
10000
20000
30000
40000
50000
60000
70000
80000
90000
100000
C o l l e c t e d After prim arym irror
After coldmirror
After rodentrance
At end of fibe r
A f t e r l u m i n a i r e
Lum
ens

10
Fig. 10: The spectral distribution of the energy leaving each optical component.
4.3 Fiber Transmission Testing -Light Attenuation Due to Bending ORNL used a xenon lamp and a 5 meter, 1.2 cm diameter optical fiber to investigate the effects of bending and light entrance angle on transmitted radiation. Figure 11 summarizes the results.
Attenuation in 5 m fiber with a 90° bend
00.10.20.30.40.50.60.70.80.9
1
0 5 10 15 20 25 30 35 40 45 50
angle of incidence (°)
Rel
ativ
e tra
nsm
issi
on straight9 in.7.5 in.6 in.4.5 in.3.5 in.
Fig. 11: Attenuation due to bending and angle of incidence
Angle of incidence is clearly the most important attenuating factor, but by comparing the relative transmission of the straight fiber to the relative transmission of a bent fiber at a given angle of incidence (0 to 5 degrees, 5 to 10 degrees, etc.), Fig. 12 can be generated:
380 430 480 530 580 630 680 730 7800
0.1 0.2 0.3 0.4 0.5 0.6 0.7 0.8 0.9
1 1.1 1.2 1.3 1.4 1.5
rod
Mrad,luminaireMrad,luminaire
Mla
mbd
a [W
/nm
]

11
Radius (in) flux 0-5° flux 5-10° flux 10-15° flux 15-20° flux 20-25° 3.5 0.87 0.88 0.88 0.88 0.79 4.5 0.90 0.89 0.89 0.88 0.81 6 0.94 0.95 0.95 0.94 0.89 7.5 0.95 0.96 0.96 0.97 0.95 9 0.95 0.95 0.95 0.95 0.92 straight 1.00 1.00 1.00 1.00 1.00
Fig. 12: Relative transmission of light due to a bend of a given radius From Fig. 12 one should not conclude that transmission of 15-20° light through a 5 m straight fiber is 100%. Rather, Fig. 12 is used to estimate the amount of light lost by the bend. For example, if the fiber has a 3.5 inch radius bend, then 88% of the 15-20° light is transmitted relative to the amount transmitted if the fiber were straight. The reason that Fig. 11 is used only to estimate bend losses and not losses due to incident angle is that Rensselaer Polytechnic Institute (RPI) has previously investigated light attenuation in fiber due to wavelength and incident angle. Figure 13 summarizes RPI’s results.
Fig. 13: RPI transmission in 1 meter cable
LF120B Fiber Transmission Properties(At Various Launch Angles)
0
0.2
0.4
0.6
0.8
1
380 480 580 680 780Wavelength
Tran
smis
sion
0-5 Degrees5-10 Degrees10-15 Degrees15-20 Degrees20-25 Degrees

12
ORNL has created a program to predict attenuation in the fiber using RPI’s data, and a model has been generated by UW-Madison that gives similar results to ORNL’s model. However, the model does not predict the same transmission characteristics for the “straight” fiber shown in Fig. 11. Figure 14 illustrates the discrepancy.
Fig. 14: Comparison of modeled (RPI) and empirical (ORNL) transmission in straight fiber ORNL has been made aware of this discrepancy and discussion is ongoing. But the relative transmission matches fairly well up to 15° incidence, and over half of the light flux enters in this range. Therefore the discrepancy will not affect results significantly. The effect of bending has been included in the EES model of the HLS. For a 3.5 inch bend in a 10 meter fiber, Figures 15 and 16 summarize model results.
Fig. 15: Change of visible light spectrum due to components of HLS
380 430 480 530 580 630 680 730 7800
0.2
0.4
0.6
0.8
1
1.2
1.4
1.6
0
0.2
0.4
0.6
0.8
1
λ [nm]
W/n
m
MradMrad,collMrad,collMrad,cmMrad,cmMrad,qrodMrad,qrodMrad,fiberstraightMrad,fiberstraightMrad,fiberwithbendMrad,fiberwithbendMrad,luminaireMrad,luminaire
V lam
bda
Visibility curveVisibility curve
0 5 10 15 20 25 30 35 40 450.1
0.2
0.3
0.4
0.5
0.6
0.7
0.8
0.9
1
entrance angle (°)
rela
tive
tran
smis
sion
τORNLxenonτORNLxenon
τRPI,withxenonspectrumτRPI,withxenonspectrum

13
Fig. 16: Stages of light collection system 5. Collector/Receiver The following items show the accomplishments on the collector/receiver task as performed during the reporting period Task 1: Primary Mirror Development
• Develop primary mirror specifications • Initiate search/evaluation for low cost mirror • Provide input on secondary mirror, receiver, controls, and tracking system. • Began formulating specifications for low-cost primary reflector and reviewing requirements for
reflector and tracking system. • Contacted former and newly-identified suppliers of dish concentrators to obtain updated
pricing/availability and specifications. Contacted suppliers of hydro-formed aluminum, spun aluminum, stamped steel, and thermoformed plastic mirrors and polymer reflector films. Preliminary results are that satellite dishes of spun aluminum and stamped steel are in the correct price range, but optical accuracy requires further study.
• Meet with ORNL researchers in San Diego to discuss specifications and approaches for the primary mirror/tracking system.
ORNL continued work on their portion of the collector/concentrator and light delivery tasks. Initial samples of thermally-compressed fiber bundles were received and evaluated. Some voids in initial samples were detected and ORNL will be working with the vendor to address this issue. The design of the secondary elliptical mirror was completed and initial mirrors are due to be shipped in July 2003. The balance of system design was completed and assembly of the first iteration of the BP2 collector/concentrator (less the low-cost primary mirror) was started during this time.
0
10000
20000
30000
40000
50000
60000
70000
80000
90000
100000
stages of collection system
Lum
ens
Collected After
mirrorprimary
After
mirrorcold
Afterfiber
entrance
Fiberstraight
Fiberbent
Out ofluminaire

14
7. Header Design, Mass Transfer, Buffering Solution and New Tracker/Collector & Long-Term Growth Test 7.1 Header Design, Mass Transfer, And Buffering Solution Specific results and accomplishments for this period include:
• Tests to measure the mass transfer rates in the biofilm layer were conducted using a thermo-electric probe and CO2 measurements in the gas and aqueous phases.
• The majority of work focused on new header design. We have developed a new stainless-steel header that we believe will work better with the pilot-bioreactor due to difficulties harvesting the organism at lower peak flow rates.
• The question of buffering solution for the organism is being investigated by our colleagues at Montana State University. Of concern is that that the organism will not perform in acidic solutions which result from the build up of carbonic acid, and therefore a buffer is needed for the growth media. Testing is now underway to measure that effect and look at alternative to expensive buffers and preliminary results are described in this report.
• The primary mirror was reinstalled during June. 7.1.1 Header Design Although not conclusive, observations during several recent experiments indicated that the existing header design would be inadequate to harvest some of the Nostoc (organism) currently being used in bioreactor experiments. Nostoc exhibits a high degree of adhesion, requiring a larger sheering force to detach the biofilm from the underlying substrate. As a result, a team of research engineers and graduate students designed a new stainless-steel header with a different shim material to allow for a higher flow-rate compared to the current plastic shim design. The key was to use a larger inlet flow area and a stainless steel shim that was very thin (5/1000ths of an inch). The new header and membrane are shown in Fig. 17. The test data, plotted as flow rate versus differential pressure, is shown in Fig. 18. The data in Fig. 18 shows a substantial improvement in flow rate while maintaining some degree of flow control at lower pressure.
Fig. 17: New Header and Membrane

15
0.0
0.5
1.0
1.5
2.0
2.5
3.0
0 10 20 30 40 50 60 70 80
Pressure (psi)
Flow
Rat
e (g
pm)
Pressure Drilled Hole psig
Pressure Pressure Shim (0.025 in)
Pressure Pressure Shim (0.020 in)
Pressure SS Pressure Shim (0.005 in)
Fig. 18: Flow Characteristics of Several Header Designs
7.1.2 Mass Transfer Measurements One key aspect to bioreactor design is determining whether or not the process of photosynthesis in the reactor is mass-transfer (of CO2) limited. If the reactor is not optimized for CO2 transfer, reactor surface area is wasted and alternate methods of transferring CO2 into solution must be explored. During this month, we began to examine mass transfer rates using a small film of growth media in a specially designed chamber. The media is sampled at various locations as a function of time and the dissolved CO2 level is measured through titration. This month, two mass transfer tests were performed: one is for 50°C and the other is for 20°C. Samples were drawn from 120 cm position for both tests, which examined the effect of flow rate on the mass transfer process. The test results are shown in Fig. 19. Preliminary conclusions derived from the data includes that the process is diffusion limited, but accelerated by the solubility of CO2 into the media, and that flow rate of the media biofilm has a small, but negative effect on the transfer properties through the conditions of typical flow in our bioreactor. Further testing is planned for the next few months to hopefully provide more solid conclusions.
0
0.001
0.002
0.003
0.004
0.005
0 0.5 1 1.5 2 2.5
Media flow rate (gpm)
CO2 C
once
ntra
tion
(mol
s/lit
er)
20ºC50°C
Fig. 19: CO2 concentration as a function of flow rate and temperature

16
Additionally, we have begun to measure the wave velocity in the film. While this work is on-going, it is interesting to see pictures of the flow highlighted with dye, which is very evenly distributed on the membranes (shown in Figures 20 and 21).
Fig. 20: Flow of media through the membrane (onset of flow)
Fig. 21. Flow of media through the membrane (saturation flow)
7.1.3 Buffering Solution Our colleagues at Montana State have been kind enough to address a critical issue for our bioreactor design. Analysis of growth data shows a potential problem in the cultivation of thermophilic cyanobacteria under an elevated concentration of CO2 because of the significant acidification of the growth medium by CO2. A short-term proposal to overcome of this problem is the use of buffers such as HEPES, to prevent a medium acidification. This is unlikely to become a practical solution in practice because of the expense of this buffer. Experimentation regarding the selection of highly productive strains of Spirulina platensis (Brown at all., 1996) was used as a starting point, where the cyanobacterium glided on semisolid surface. Furthermore, soft agar had the gradient of an antimetabolite directed against of Spirulina movement direction, as shown in Fig. 22. This allowed selection of strains resistant to the antimetabolite.
Fig. 22: Selection of cyanobacterial strains with elevated resistance to an antimetabolite.
light
antimetabolite
CB

17
Black arrow indicates the direction of movement of the cyanobacterial population towards light. Red arrow indicates an antimetabolite gradient. CB = cyanobacterial cell. The same approach was used to obtain a cyanobacterial culture with elevated resistance to acid pH. Unicellular culture “3.2.2 s. c.1 Positive” was chosen for this experiment because it appeared to have good mobility on semisolid surface towards a light supply. 3.2.2 s. c.1 is a unicellular culture and it was presumed that we might obtain a clonal mutant from the culture 3.2.2 s.c.1 more easily than from multicellular culture 1.2 s.c. 2. Two types of Petri dishes were prepared. The first group of dishes were filled with semisolid BG-11 medium supplemented with 30 mM HEPES (pH 7.4). The second group of dishes was filled in two steps: at first, we poured about 12 mL of BG-11 medium supplemented with 30 mM MES (pH 4.0) in Petri dish, what was positioned with small angle to horizontal surface. When this medium has been solidified, the Petri dish was placed on horizontal surface. 15 mL of the medium with pH 7.4 was poured in the depression between solidified medium and dish wall. This agarose “cake” had same profile as it is shown on Fig. 22. After that, ~ 20 µL of high-density “3.2.2 s.c.1 Positive” culture was inoculated on the surface of both group of Petri dishes and wrapped with aluminum foil so that they received light directed from one side only. The results are presented in the following pictures.
Figure 23: General view of migrated population of “3.2.2 s.c.1 Positive”on semisolid BG-11 medium, pH 7.4. Light gradient was perpendicular to red line on the bottom of the dish.

18
Fig. 24: Photomicrograph of leading edge of “3.2.2 s.c.1. Positive” migrated along semisolid BG-11 medium, pH 7.4, towards light. Red arrow indicates light direction.
As can be seen on Figs. 23 and 24, microcolonies of “3.2.2 s.c.1 Positive” culture migrated mainly towards light along a light gradient.
Fig. 25: General view of migrated population of “3.2.2 s.c.1 Positive” on semisolid BG-11 medium with acid gradient.Light gradient was perpendicular to red line on dish bottom. Black line indicates the end of the medium with pH 7.4. Medium above black line had initial pH 4.0.

19
Fig. 26: Photomicrograph of leading edge of “3.2.2 s.c.1 “Positive” migrated towards light along semisolid BG-11 medium with acid gradient. Red arrow indicates both light and pH gradient directions. Numbers indicate general range of pH gradient. Figure 25 suggests that microcolonies of “3.2.2 s.c.1 Positive” migrated towards light along a light gradient, and against acid gradient, in whole. However, as can be seen in Fig. 26, microcolonies approaching the area with lowest pH, changed migration direction to one which was almost perpendicular to both light and acid gradient. Nonetheless, some microcolonies were able to generate “secondary” microcolonies with bigger ability to move towards acid area. These microcolonies with elevated resistance to acidity have been isolated and inoculated in BG-11 with pH 6. Results of this selection are expected in 2-3 weeks. 2 New Tracker/Collector and Long-Term Growth Test Specific Results and Accomplishments 7.2.1 Solar Tracker Installation In late June, a new solar collector and fiber system was re-installed in the pilot scale bioreactor at Ohio University. The work was primarily done by Oak Ridge National Laboratories. The system has been working well since installation. Figure 27 shows the secondary mirror and fiber assembly above the primary mirror.
7.4
4.0

20
Fig. 27: Secondary mirror and fiber array
Figure 28 shows the entire tracker-collector assembly located on the roof above the bioreactor.
Fig. 28: Solar tracker-collector assembly

21
Figures 29 and 30 show the lighting panels (luminaires) from different perspectives. These are not replacement luminaires – however, it is it interesting to see their response with the new collector. During this day, the photosynthetic photon flux ranges from 80-130 �mols m-2 s-1.
Fig. 29: Photobioreactor lighting panels (luminaires) Image #1

22
Fig. 30: Photobioreactor lighting panels (luminaires) Image #2

23
Also, soon after the new tracker-collector was installed, we began a long-term growth viability test using organism S.C. 1.2(2). Initial loading of organism mass was calculated and the test began. Figure 31 shows the loading of organism on one of the membranes.
Fig. 31: Organism S.C. 1.2(2) loaded on pilot bioreactor membrane

24
CONCLUSIONS During the reporting period, the project team made progress towards the completion of the TRNSYS Full-Spectrum Solar Energy System model, the TPV array tests, the high-lumen test devices, the collector/receiver, fiber transmission models, and portions of the photobioreactor system. Accomplishments for this period are:
1. Work was performed on the high-lumen test system. Steps are being taken to determine the appropriate combination of filters and/or quartz pieces to protect the fiber from overexposure to damaging IR radiation during the long-term tests. Optical modeling of the system was also performed to better predict heat transfer.
2. Work was performed on the test system for the TPV array. A cooling circuit was built to keep the
array cooled off below the maximum operating temperature, and a cold mirror was ordered to only transmit the IR portion of the sunlight to the TPV array, thus imitating the conditions of the full-spectrum system.
3. Updates were performed on the TRNSYS system model. Also, an EES program was written that
correctly calculates the transmission of the fiber as a function of length, wavelength and entrance angle.
4. Modeling work was also performed on a FORTRAN model that can predict the attenuation loss
of an arbirtrary fiber. Fiber configurations inside a building were investigated so that model parameters could be developed
5. A new stainless-steel header was designed and tested for the photobioreactor. Biofilm mass
transfer rate tests were performed, and buffering solutions for the organisms were tested. A new solar collector and fiber optic cables were installed at the pilot scale bioreactor facility and appears to be working well.
DISTRIBUTION • NETL AAD Document Control • Frank “Tex” Wilkins, DOE • Lew Pratsch, DOE • Joel S. Chaddock, NETL • Bonnie Dowdell, NETL • David J. Bayless, Ohio University • William Beckman, University of Wisconsin • Clinton Berry, TN Dept. of Economic &
Community Dev. Energy Division • Joel L. Cuello, University of Arizona • Roger Davenport, Science Applications
International Corporation
• David R. Dinse, TVA Public Power Institute
• Lewis Fraas, JX Crystals Inc • Jason B. Keyes, JX Crystals Inc. • Sandy Klein, University of Wisconsin • Dave McNeil, Nevada Energy Office • Jeff Muhs, Oak Ridge National Laboratory • Nadarajah Narendran, Rensselaer
Polytechnic Institute • Jennifer Sahlin, 3M • Ramesh Raghavan, RPI • Robert Schnell, Honeywell Laboratories • Robin W. Taylor, Science Applications
International Corporation This report is posted on web site www.energy.unr.edu/lighting.htm