4.0 system analysis - betsaonline.combetsaonline.com/systemanalysis/system_analysis.pdf · system...
TRANSCRIPT

System Analysis 16
4.0 System Analysis
Systems analysis is the dissection of a system into its component pieces for purposes of
studying how those component pieces interact and work [Edwa89]. Structured analysis
was one the first formal strategies developed for systems analysis of information systems
and computer applications [Whit98]. Modern structured analysis is a process-centered
technique that is used to model requirements for a system. The models are structured
pictures that illustrate the processes, inputs, outputs, and files required to respond to
events. Structured analysis introduced an overall strategy that has been adopted by many
of the other techniques – model-driven development. A model is a representation of
reality. Just as ‘a picture is worth a thousand words,’ most models use pictures to
represent reality. Model-driven development techniques emphasize the drawing of
models to define requirements and system designs. The model becomes the design
blueprint for constructing the final system.
Before developing this model, however, it is essential to identify the components that will
make up the system to be designed. In order to best aid the machine designer and reduce
the design time, the following key elements were identified: an implicit solver to solve

System Analysis 17
the equations, a suitable graph utility to plot parameter values, a data store for the
machine element design data, and a word processor to aid in the documentation.
4.1 The Environmental Model
The first step in any system analysis and development technique is to develop a complete
model of user requirements for the new system. It is essential to determine what is part of
the system and what is not. Thus, the first major model to be developed is one that
defines the interface between the system and the rest of the universe, that is, the
environment. This model is known as the environmental model. It models the outside of
the system; the model of the inside of the system, known as the behavioral model is
discussed later.
In addition to determining what is inside the system and what is outside the system, it is
also critically important to define the interfaces between the system and the environment.
It is essential to identify what information comes into the system from the external
environment and what information the system produces as an output to be delivered to
the external environment. The systems produce outputs as a response to an event, or a
stimulus, in the environment. Thus, another critical aspect of the environmental model is
that of identifying the events occurring in the environment to which the system must
respond. The focus is only on those events that (1) occur in the external environment, and
(2) require a response from the system.

System Analysis 18
The area inside the system boundary is referred to as the domain of change, which simply
means that everything within the system boundary is subject to change, while everything
outside the boundary is to be left in its current form and not investigated.
The environmental model consists of three components:
1.Statement of purpose
2.Context Diagram
3.Event List
4.1.1 The Statement of purpose
The first component of the environmental model is a brief, concise textual statement of
the purpose of the system. It is intended for those who are not directly involved in the
development of the system and summarizes the tangible, quantifiable benefits that will be
achieved by the new system. For the system that the author intends to develop, which has
been named “The Mechanical Design Desktop, ” the statement of purpose is as follows:
The purpose of the Mechanical Design Desktop system is to categorize and arrange on
the desktop all the resources related to the design of a particular machine element, such
as the formulae, tables, standards, graphs and information available on the Internet. By a
convenient arrangement of the above stated resources, a user may design a machine
element of his or her choice and document the design. The purpose of the system is to not

System Analysis 19
only reduce the amount of work and time required for a machine designer to design a
given machine element, but also eliminate the need for the calculator, pen and paper.
Evidently, if the resources that a designer often refers to during the design process were
made available in a categorized manner on the desktop, it would speed up the design
process, as the designer need not spend time sifting through pages in the design book to
locate relevant data. Also, by incorporating a solver and word processor, one can
eliminate the conventional routine of using a pen and paper to document the design.
Thus, one can reduce the time and effort required for a particular design.
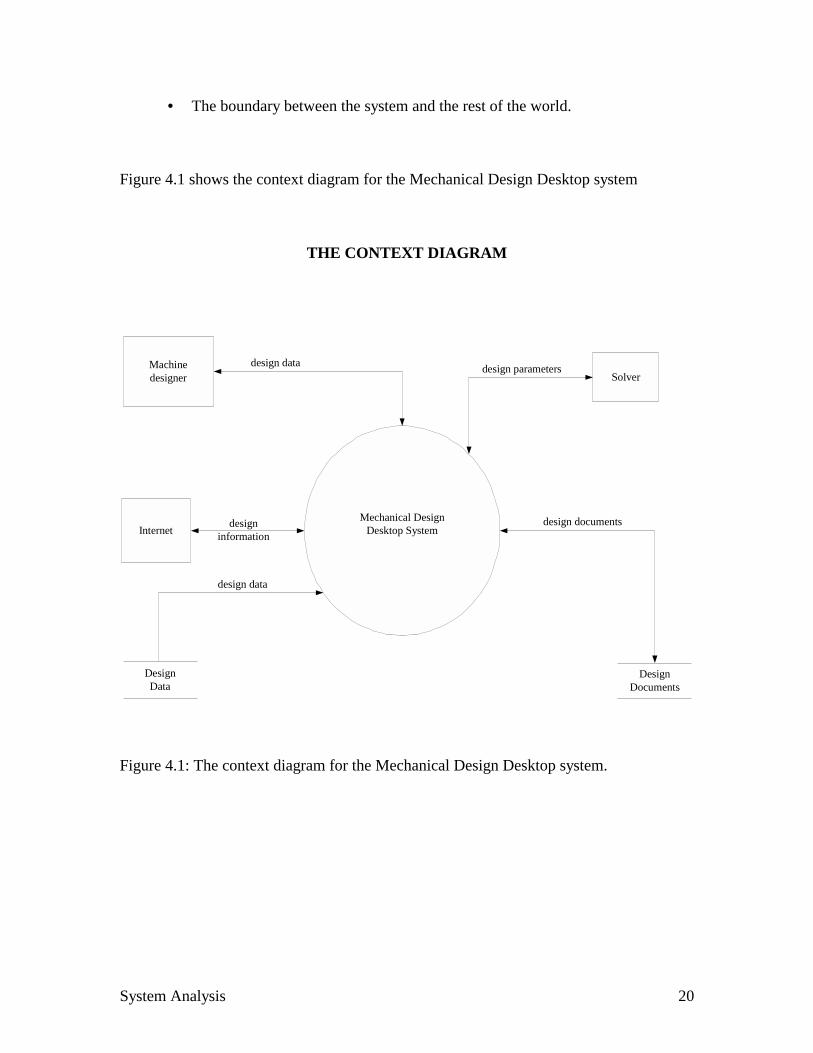
4.1.2 The Context Diagram
The Context diagram is a special case of the dataflow diagram, wherein a single bubble
represents the entire system. The context diagram highlights several important
characteristics of the system:
• The people, organizations, or systems with which the system communicates.
These are known as terminators.
• The data that the system receives from the outside world and that must be
processed in some way.
• The data produced by the system and sent to the outside world
• The data stores that are shared between the system and the terminators.
These data stores are either created outside the system and used by the system,
or created by the system and used outside the system.
System Analysis 20
• The boundary between the system and the rest of the world.
Figure 4.1 shows the context diagram for the Mechanical Design Desktop system
THE CONTEXT DIAGRAM
Mechanical DesignDesktop System
Machinedesigner
design data
DesignDocuments
design documents
Solverdesign parameters
Internet designinformation
DesignData
design data
Figure 4.1: The context diagram for the Mechanical Design Desktop system.

System Analysis 21
4.1.3 The Event List
The event list is a simple textual listing of the events in the environment to which a
system must respond. The event list for the current system consists of the following
events:
1. Machine designer selects the machine element to be designed.
2. Machine designer specifies the design limitations/constraints.
3. Machine designer selects the design equation.
4. Machine designer provides input parameter values by referring relevant graph.
5. Machine designer provides input design parameter values by referring relevant
table.
6. Machine designer provides input design parameter values by referring relevant
standard.
7. Solver solves for unknown design parameter.
8. Machine designer checks for the compliance of the calculated design parameter
with design limitation.
9. Machine designer standardizes calculated design parameter.
10. Machine designer generates datasets for dependent and independent design
parameter.
11. Machine designer plots datasets to observe the effect of changes in design
parameter value.
System Analysis 22
12. Machine designer searches the Internet for design information on the machine
element.
13. Machine designer catalogues the design information.
14. Machine designer refers design information.
15. Machine designer is prompted to refer source.
16. Machine designer documents the design.
4.2 The Behavioral Model
On the successful completion of the environmental model, there is a need to model what
the internal behavior of the system must be in order to deal successfully with the
environment. These are also referred to as the Logical Model.
Logical models show what a system is or does. They are implementation independent;
that is, they depict the system independent of any technical implementation. As such
logical models illustrate the essence of the system and have the following advantages:
• Logical models remove biases that are the result of the way the current system
is implemented or the way that any one person thinks the system may be
implemented. This overcomes the “we’ve always done it that way” syndrome.
Consequently, logical models encourage creativity.
• Logical models reduce the risk of missing requirements because we are too
preoccupied with technical details. Such errors can be costly to correct after
the system has been implemented. By separating what the system must do
System Analysis 23
from how the system will do it, we can better analyze the requirements for
completeness, accuracy and consistency.
• Logical models allow us to communicate with end-users in non-technical or
less technical languages. Thus, we don’t lose requirements in the technical
jargon of the computing discipline.
Logical Process modeling is a technique for organizing and documenting the structure
and flow of data through a system’s processes and/or the logic, policies, and procedures
to be implemented by a system’s processes.
4.2.1 Data Flow Diagrams
One of the most widely used system analysis process models is the data flow diagram. A
data flow diagram (DFD) is a tool that depicts the flow of data through a system and the
work or processing performed by that system. They are used to help understand the
current system and to represent the required system. The diagrams represent the external
bodies sending and receiving information, the processes that change information, the
information flow itself and where the information is stored. The diagrams are
hierarchical, with a single top level diagram decomposing to many lower level diagrams,
each representing different parts of the system. As diagrams are easier to understand than
technical descriptions, the data flow diagrams help analysts represent and discuss the
system with non-technical users. They can show a high-level overview of the system,
showing the boundaries and connections to other system and users, as well as, a much
System Analysis 24
more detailed picture of individual parts of the system. Thus, the existing system can be
studied and then future needs or existing problems considered and a new / better system
designed. The development of a data flow diagram aids in the understanding of the
system.
Data flow diagrams consist of three symbols and one connection, which help in quick
comprehension of the system. The symbols that typically make up a data flow diagram
are: Rounded rectangles to represent processes; squares to represent external agents-the
boundary of the system; open-ended boxes to represent data stores, sometimes called
files or databases; and arrows to represent data flows, or inputs and outputs, to and from
the processes.
Some of the salient features of data flow diagrams that aid in the understanding of the
system are summarized below:
• Processes in a dataflow can operate in parallel. Thus, several processes might be
executing or working simultaneously.
• Data flow diagrams show the flow of data through the system. Their arrows
represent paths down which its data can flow. Looping and branching are
typically not shown.
• Data flow diagrams can show processes that have dramatically different timing.
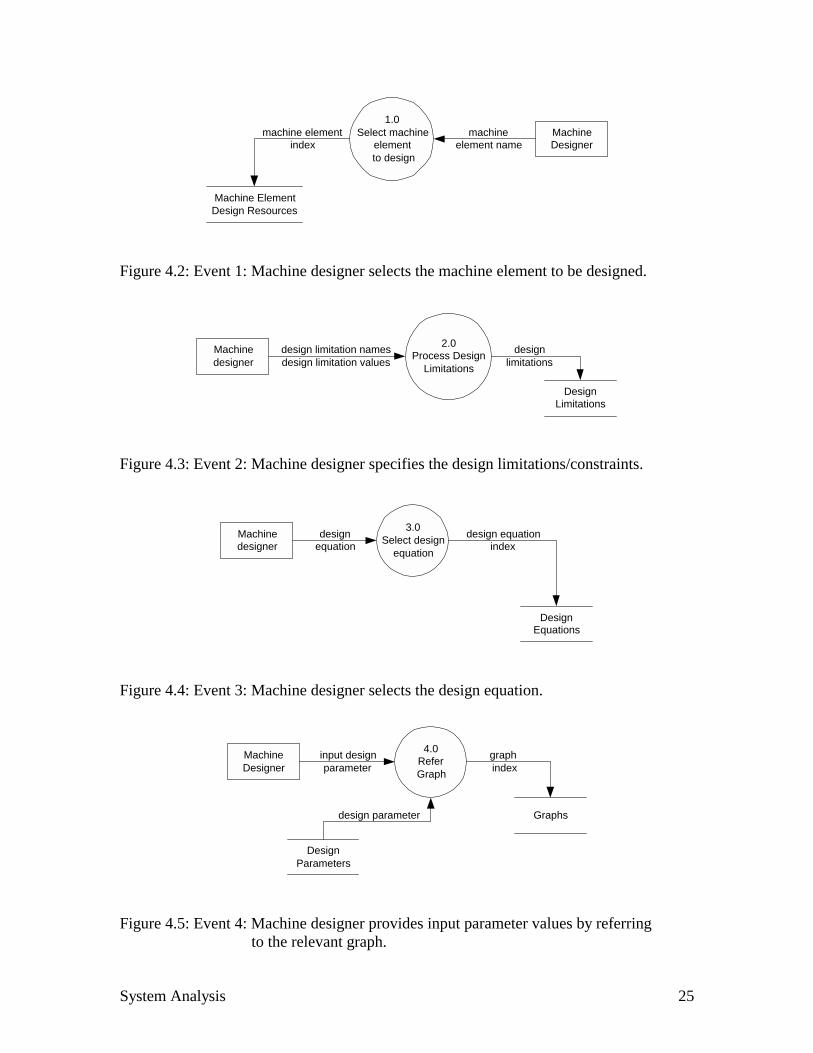
Each of the events listed in Section 4.1.3 has an associated dataflow diagram. The
preliminary data flow diagrams for the “Mechanical Design Desktop” system are given in
the following pages.
System Analysis 25
Figure 4.2: Event 1: Machine designer selects the machine element to be designed.
Figure 4.3: Event 2: Machine designer specifies the design limitations/constraints.
Figure 4.4: Event 3: Machine designer selects the design equation.
Figure 4.5: Event 4: Machine designer provides input parameter values by referring to the relevant graph.
MachineDesigner
1.0Select machine
element to design
Machine ElementDesign Resources
machineelement name
machine element index
2.0Process Design
Limitations
Machinedesigner
DesignLimitations
designlimitations
design limitation namesdesign limitation values
Machinedesigner
DesignEquations
3.0Select design
equation
designequation
design equationindex
MachineDesigner
4.0ReferGraph
Graphs
graph index
input designparameter
DesignParameters
design parameter
System Analysis 26
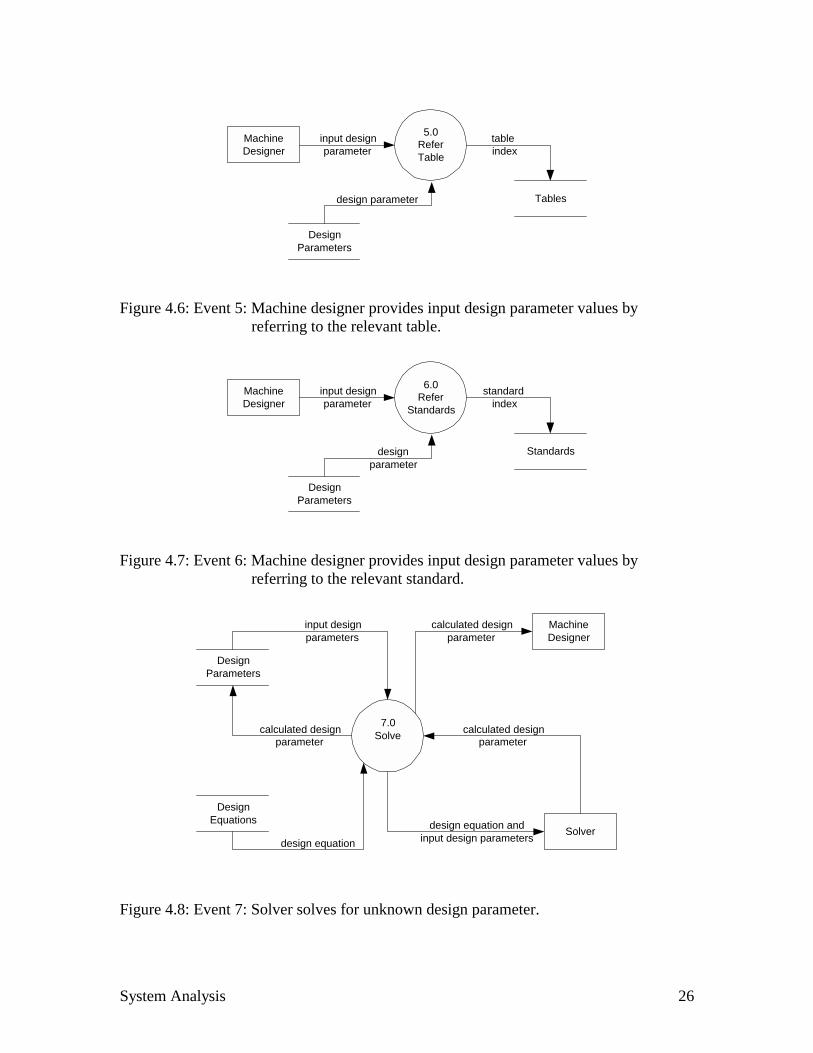
Figure 4.6: Event 5: Machine designer provides input design parameter values by referring to the relevant table.
Figure 4.7: Event 6: Machine designer provides input design parameter values by referring to the relevant standard.
Figure 4.8: Event 7: Solver solves for unknown design parameter.
MachineDesigner
5.0ReferTable
Tables
table index
input designparameter
DesignParameters
design parameter
MachineDesigner
6.0Refer
Standards
Standards
standard index
input designparameter
DesignParameters
designparameter
7.0Solve
calculated designparameter
MachineDesigner
DesignParameters
DesignEquations
design equation
input designparameters
calculated designparameter
Solverdesign equation andinput design parameters
calculated designparameter
System Analysis 27
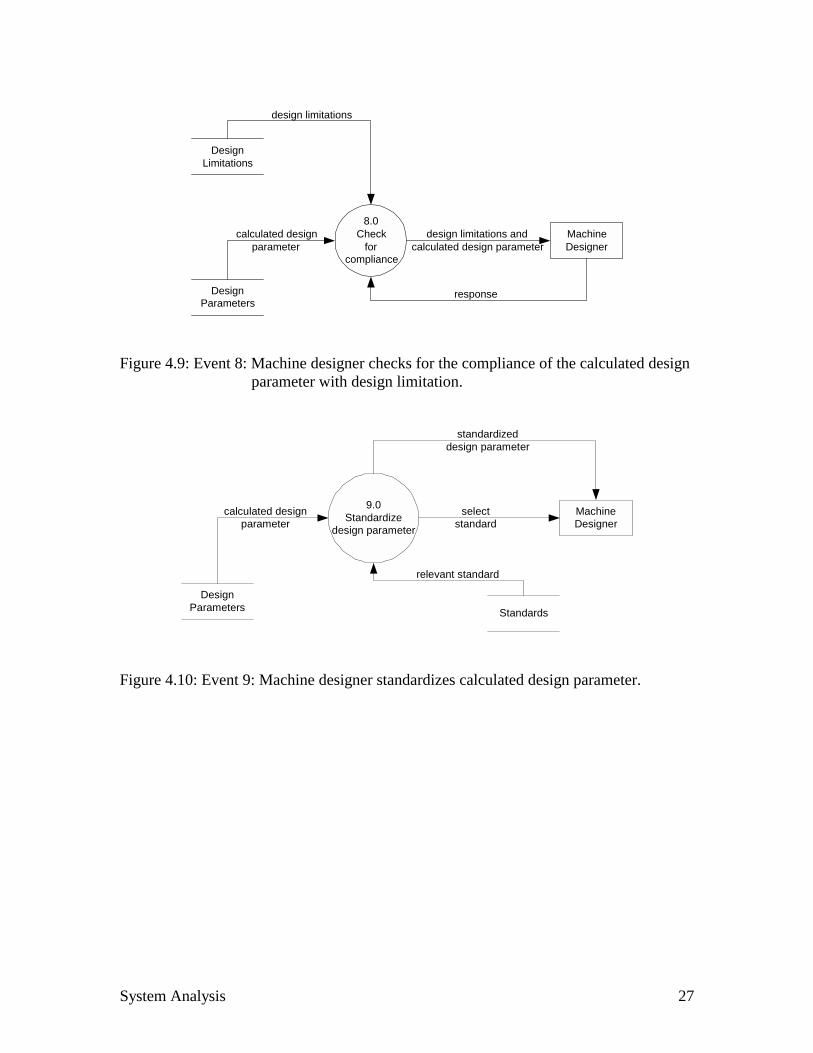
Figure 4.9: Event 8: Machine designer checks for the compliance of the calculated design parameter with design limitation.
Figure 4.10: Event 9: Machine designer standardizes calculated design parameter.
8.0Check
forcompliance
DesignParameters
calculated designparameter
MachineDesigner
design limitations andcalculated design parameter
response
DesignLimitations
design limitations
9.0Standardize
design parameter
DesignParameters Standards
calculated designparameter
relevant standard
MachineDesigner
selectstandard
standardizeddesign parameter

System Analysis 28
Figure 4.11: Event 10: Machine designer generates datasets for dependent and independent design parameters.
Figure 4.12: Event 11: Machine designer plots datasets to observe the effect of changes in design parameter values.
Figure 4.13: Event 12: Machine designer searches the Internet for design information on the machine element.
10.0Generate
data
DesignParameters
design parameters
DesignEquations
design equation
Machinedesigner
dependent andindependent design
parameters
dependent design parameter datasetand independent design parameter data set
12.0Searchdesign
information
Machinedesigner
machine element
selected designinformation
Internet
search results
search criteria
11.0Plot
dataset
MachineDesigner
dependent design parameter dataset andindependent design parameter dataset
plot
System Analysis 29
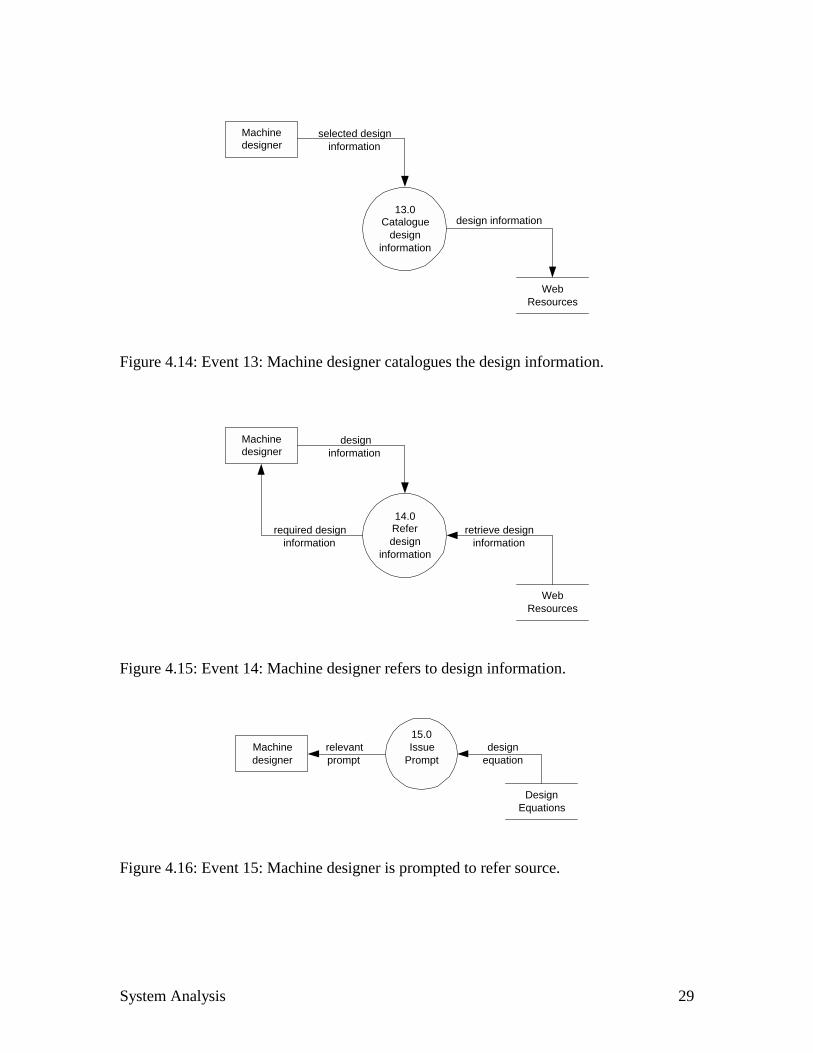
Figure 4.14: Event 13: Machine designer catalogues the design information.
Figure 4.15: Event 14: Machine designer refers to design information.
Figure 4.16: Event 15: Machine designer is prompted to refer source.
13.0Catalogue
designinformation
Machinedesigner
selected designinformation
WebResources
design information
14.0Referdesign
information
Machinedesigner
designinformation
WebResources
retrieve designinformation
required designinformation
15.0Issue
PromptMachinedesigner
DesignEquations
relevantprompt
designequation

System Analysis 30
Figure 4.17: Event 16: Machine designer documents the design.
The initial behavioral model as shown on the last several pages was transformed into a
leveled set of data flow diagrams. The top-level dataflow diagram and the additional
downward leveling are shown in the following pages.
Machinedesigner
16.0Document
Design
DesignDocuments
documented designdocument design
System Analysis 31
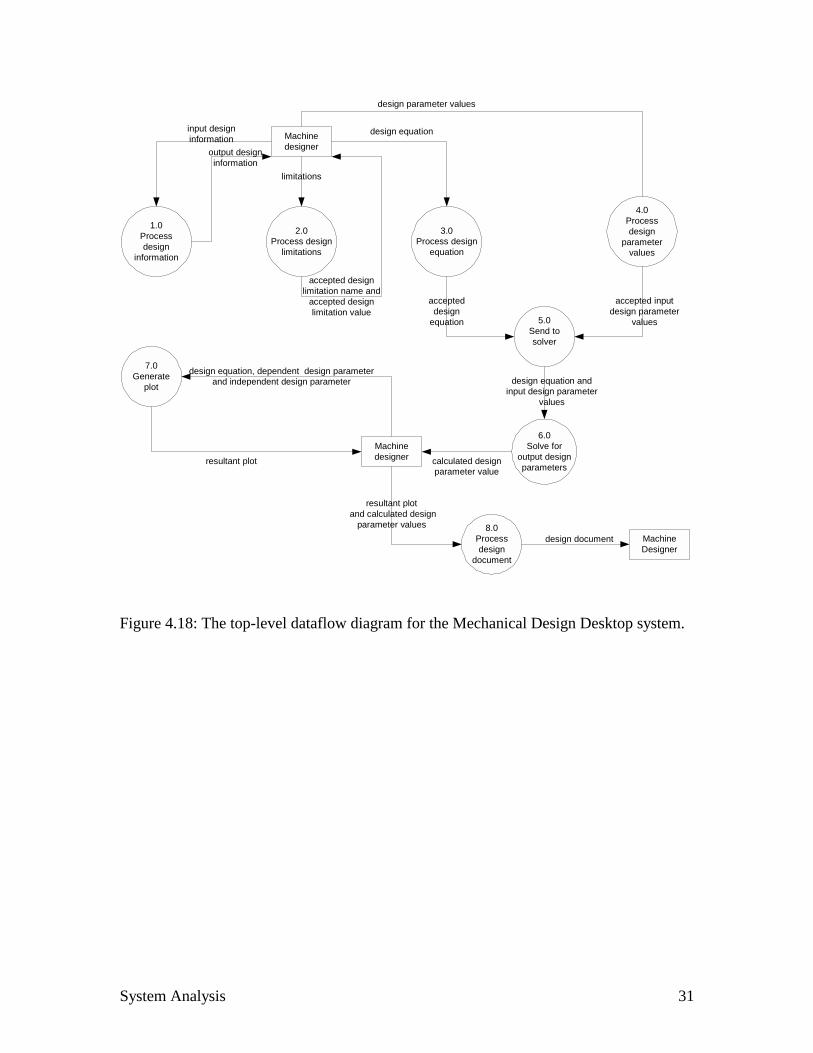
Figure 4.18: The top-level dataflow diagram for the Mechanical Design Desktop system.
Machinedesigner
1.0Processdesign
information
2.0Process design
limitations
3.0Process design
equation
input designinformation
design equation
limitations
4.0Processdesign
parametervalues
design parameter values
5.0Send tosolver
accepteddesign
equation
accepted inputdesign parameter
values
6.0Solve for
output designparameters
design equation andinput design parameter
values
Machinedesigner calculated design
parameter value
7.0Generate
plot
design equation, dependent design parameterand independent design parameter
8.0Processdesign
document
resultant plot and calculated design
parameter values
output designinformation
accepted designlimitation name and
accepted designlimitation value
resultant plot
MachineDesigner
design document

System Analysis 32
Figure 4.19: 1.0: Process design information.
MachineDesigner
1. 1Search forinformation
machineelement
information
1. 2Catalogue
hits
WebResources
1. 6Refer designinformation
1. 3View designinformation
hits
1. 4Select designinformation
webpages
web page
MachineDesigner
designinformation
selected designinformation
input designinformation
request designinformation
requested designinformation
output designinformation

System Analysis 33
Figure 4.20: 2.0: Process design limitations.
Figure 4.21: 3.0: Process design equation.
Machinedesigner
design limitation name
design limitation value2. 2
Accept designlimitation values
2. 1Accept design
limitationnames
accepted design limitationvalue
accepted design limitationname
3.2Load designequations
Machinedesigner
3. 3Select design
equation
DesignEquations
3.1Select
machineelement
machine element design equation
machineelement
designequations
loaded designequations
3. 4Resolve
parameters
selected designequation
resolved designparameters
DesignParameters
5.0Send tosolver
selected designequation
3. 6Generateprompt
Prompt
relevant prompt
selected designequation
accepteddesign equation
System Analysis 34
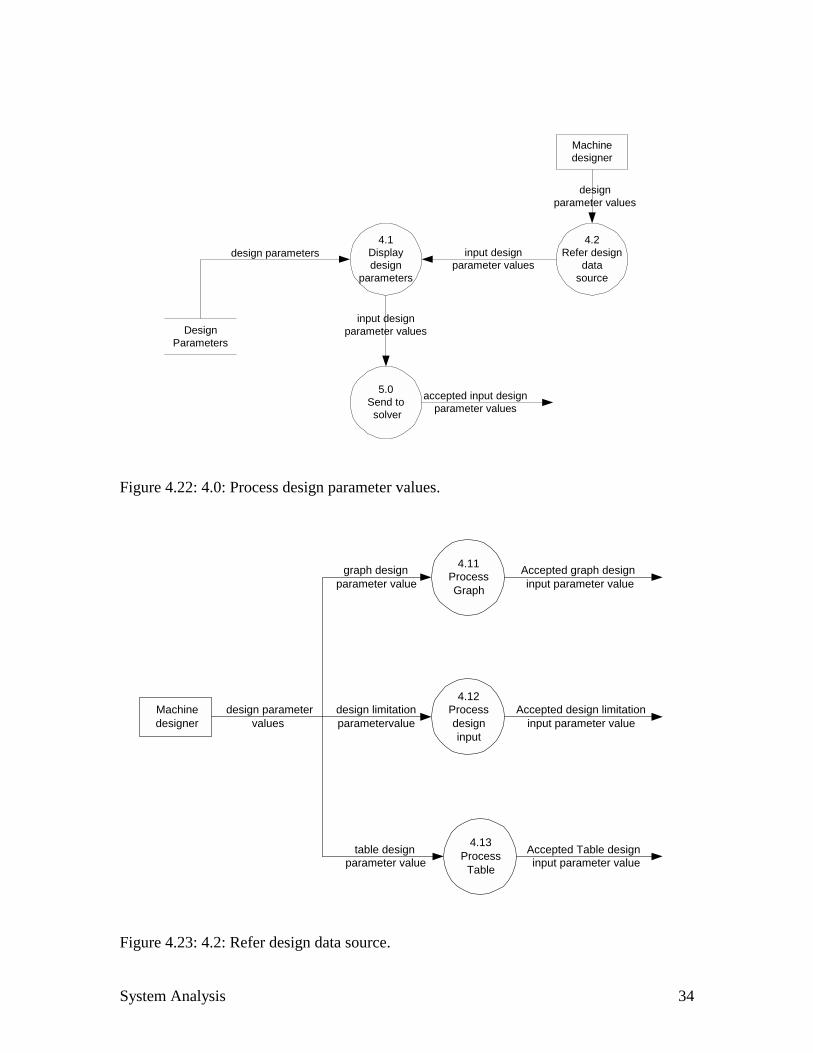
Figure 4.22: 4.0: Process design parameter values.
Figure 4.23: 4.2: Refer design data source.
Machinedesigner
4.11ProcessGraph
4.13Process
Table
4.12Processdesigninput
design parametervalues
graph designparameter value
design limitationparametervalue
table designparameter value
Accepted Table design input parameter value
Accepted design limitationinput parameter value
Accepted graph design input parameter value
4.1Displaydesign
parameters
DesignParameters
Machinedesigner
5.0Send to solver
designparameter values
input designparameter values
accepted input designparameter values
design parameters4.2
Refer designdata
source
input designparameter values
System Analysis 35
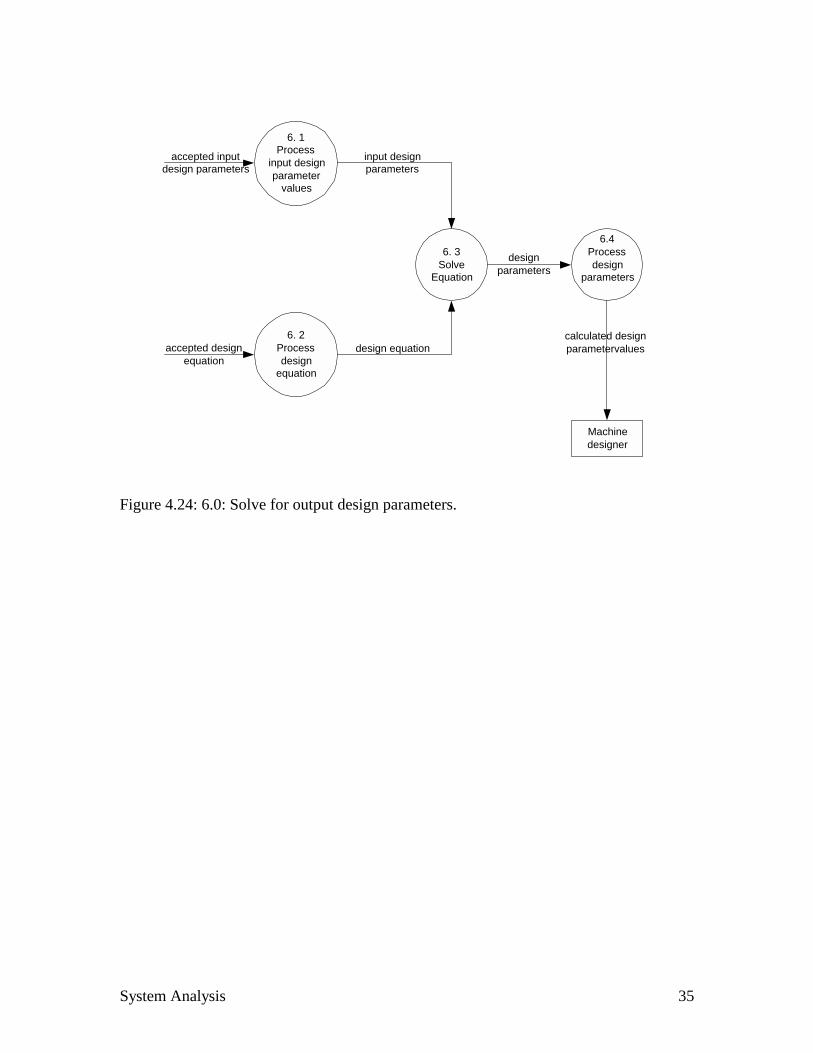
Figure 4.24: 6.0: Solve for output design parameters.
6. 1Process
input designparameter
values
6. 2Processdesign
equation
6. 3Solve
Equation
accepted inputdesign parameters
accepted designequation
input designparameters
design equation
6.4Processdesign
parameters
designparameters
calculated designparametervalues
Machinedesigner
System Analysis 36
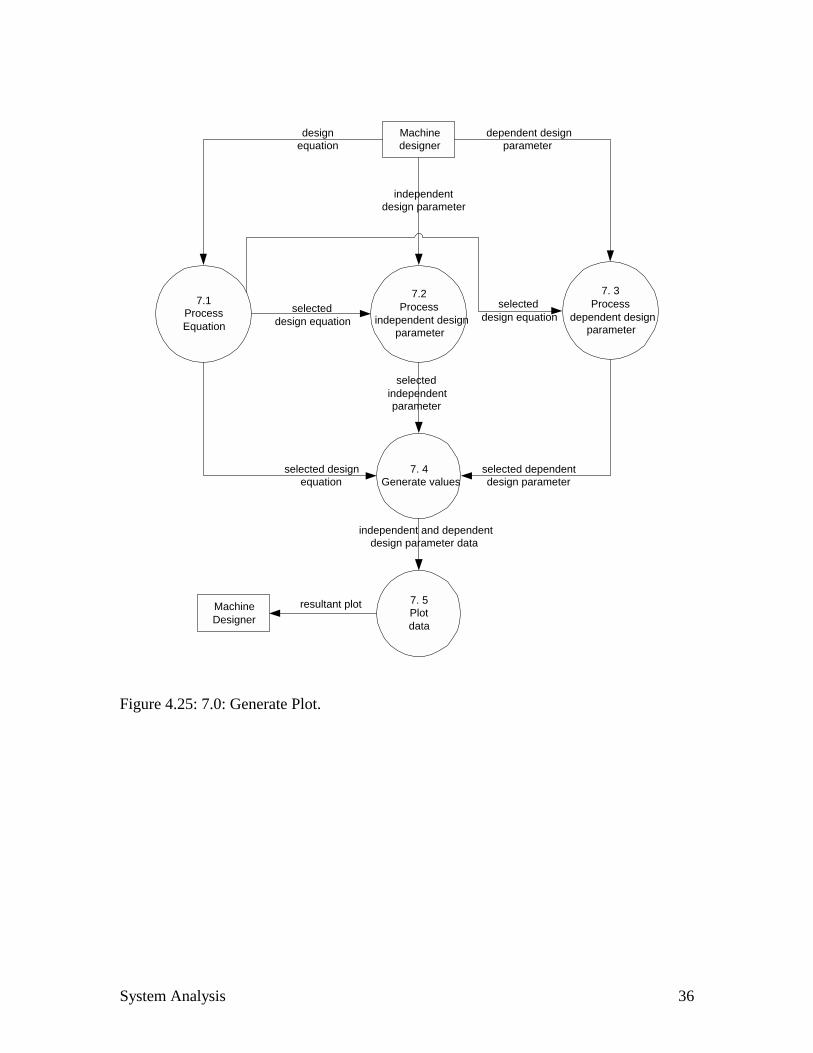
Figure 4.25: 7.0: Generate Plot.
Machinedesigner
7.1ProcessEquation
7.2Process
independent designparameter
7. 3Process
dependent designparameter
designequation
dependent designparameter
independentdesign parameter
7. 4Generate values
selected designequation
selectedindependentparameter
selected dependentdesign parameter
7. 5Plotdata
independent and dependentdesign parameter data
MachineDesigner
resultant plot
selecteddesign equation
selecteddesign equation
System Analysis 37
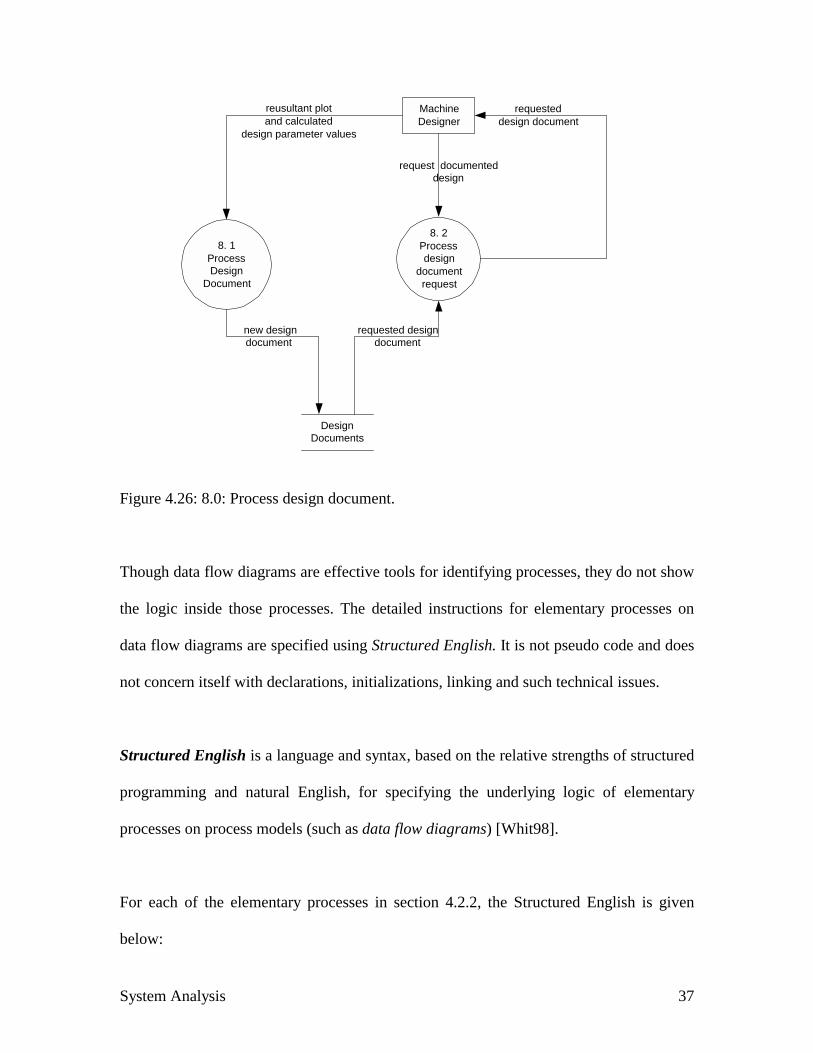
Figure 4.26: 8.0: Process design document.
Though data flow diagrams are effective tools for identifying processes, they do not show
the logic inside those processes. The detailed instructions for elementary processes on
data flow diagrams are specified using Structured English. It is not pseudo code and does
not concern itself with declarations, initializations, linking and such technical issues.
Structured English is a language and syntax, based on the relative strengths of structured
programming and natural English, for specifying the underlying logic of elementary
processes on process models (such as data flow diagrams) [Whit98].
For each of the elementary processes in section 4.2.2, the Structured English is given
below:
MachineDesigner
8. 1ProcessDesign
Document
reusultant plotand calculated
design parameter values
DesignDocuments
new designdocument
8. 2Processdesign
documentrequest
request documenteddesign
requested designdocument
requesteddesign document

System Analysis 38
1.1 Search for information:
For each machine element information requested:
1. Search the Internet for requested information.
2. List all web pages containing the requested information.
1.2 Catalogue hits
1. Display all the hits pertaining to the requested information.
2. Sort hits based on occurrence of requested information.
1.3 View design information
For each hit selected:
1. Display web page information.
2. Allow navigation to the web pages in order of selection.
3. Allow reloading of each of the web pages.
1.4 Select design information
For design information selected:
1. Allow copying of selected design information.
2. Allow pasting of selected design information.
3. Allow saving design information to specified folder and file.
1.5 Refer design information
For requested design information:

System Analysis 39
1. Open folder and file.
2. Display contents.
2.1 Accept design limitation names
For each design limitation name:
1. Allow input of design limitation names.
2. Display design limitation names.
2.2 Accept design limitation value
For each design limitation value:
1. Allow input of design limitation value.
2. Display design limitation value.
3.1 Select machine element
For each machine element selected:
1. Load the design equations.
2. Load the graphs.
3. Load the tables and standards.
3.2 Load design equations
1. Display all design equations.

System Analysis 40
3.3 Select design equation
For each design equation displayed:
1. Allow selection of design equation.
3.4 Resolve parameters
For each design equation selected:
1. Display the design parameter names.
2. Display means of specifying parameter values.
3.5 Generate Prompt
For each design equation selected:
1. Display prompt
4.11 Process Graph
For each graph selected:
1. Display graph name
2. Load graphics
4.12 Process design input
For each input design parameter:
If (finalized),
Then Display value.
Else Accept input value.
System Analysis 41
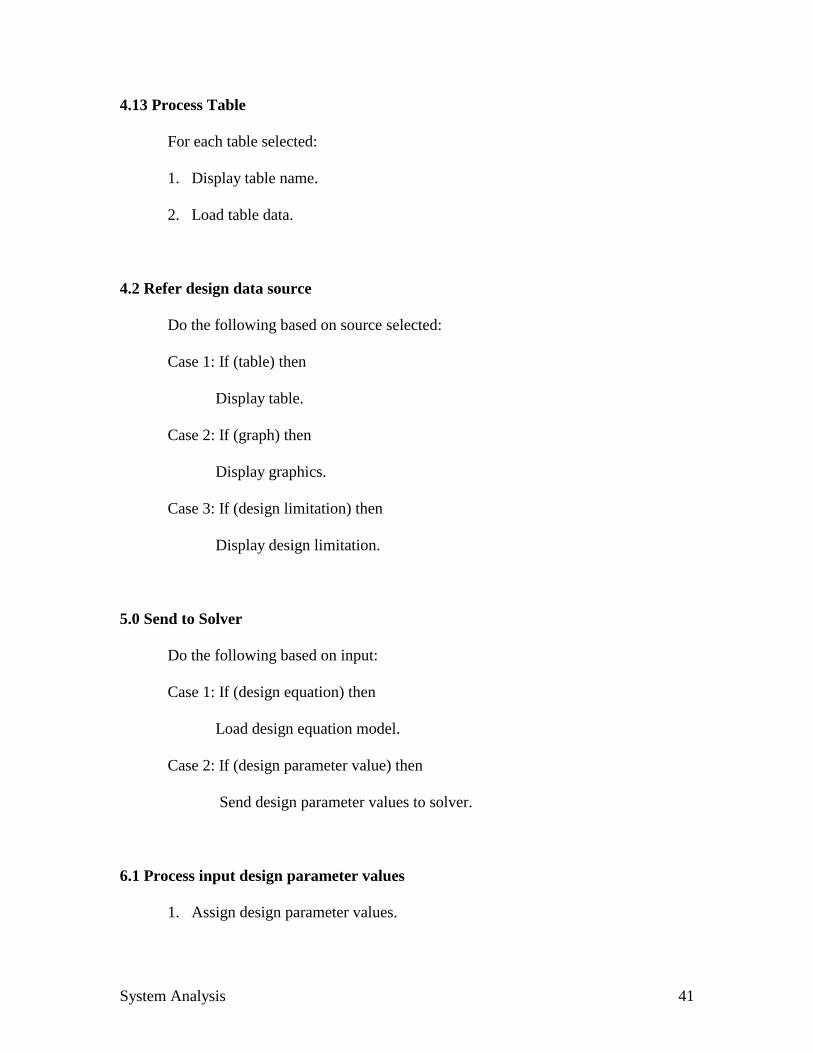
4.13 Process Table
For each table selected:
1. Display table name.
2. Load table data.
4.2 Refer design data source
Do the following based on source selected:
Case 1: If (table) then
Display table.
Case 2: If (graph) then
Display graphics.
Case 3: If (design limitation) then
Display design limitation.
5.0 Send to Solver
Do the following based on input:
Case 1: If (design equation) then
Load design equation model.
Case 2: If (design parameter value) then
Send design parameter values to solver.
6.1 Process input design parameter values
1. Assign design parameter values.
System Analysis 42
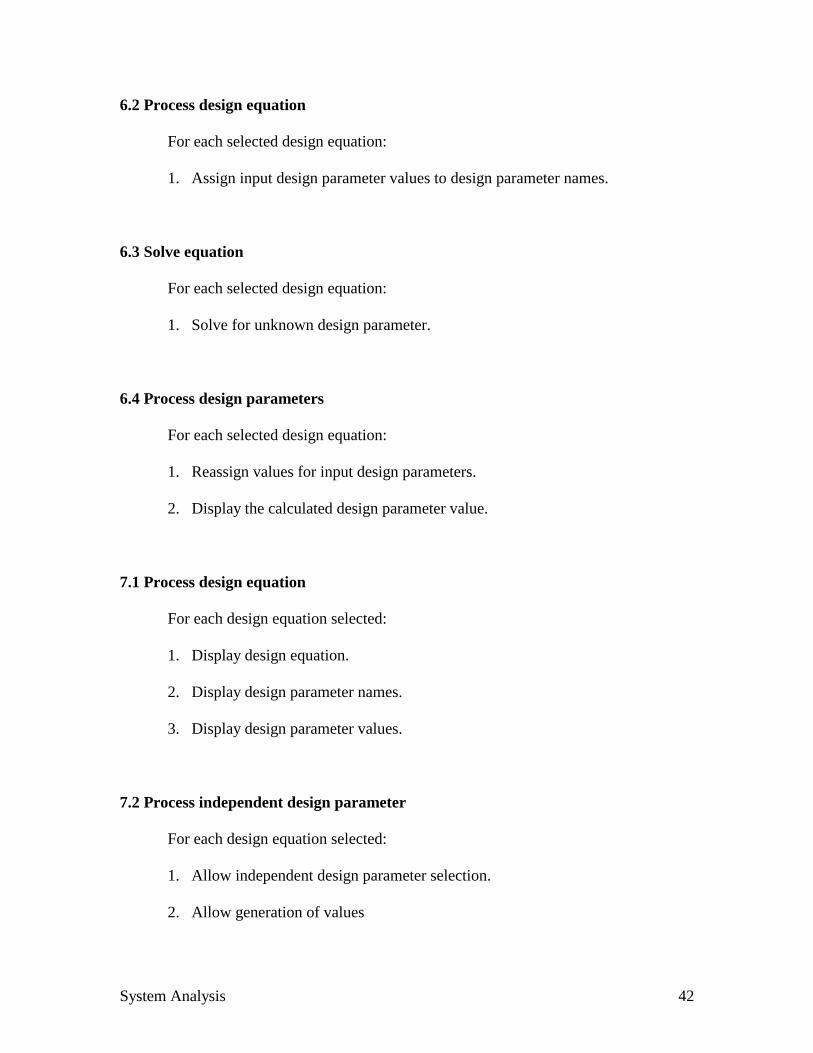
6.2 Process design equation
For each selected design equation:
1. Assign input design parameter values to design parameter names.
6.3 Solve equation
For each selected design equation:
1. Solve for unknown design parameter.
6.4 Process design parameters
For each selected design equation:
1. Reassign values for input design parameters.
2. Display the calculated design parameter value.
7.1 Process design equation
For each design equation selected:
1. Display design equation.
2. Display design parameter names.
3. Display design parameter values.
7.2 Process independent design parameter
For each design equation selected:
1. Allow independent design parameter selection.
2. Allow generation of values

System Analysis 43
7.3 Process dependent design parameter
For each design equation selected:
1. Allow dependent design parameter selection.
7.4 Generate values
For each independent design parameter value:
1. Generate value for dependent design parameter based on design equation.
7.5 Plot data
With the data sets for both the dependent and independent design parameters:
1. Plot the corresponding values.
2. Display the plot.
8.1 Process design document
For each design document:
1. Allow insertion of calculated design parameter values.
2. Allow insertion of plots.
3. Allow saving of design document to specified folder and file
8.2 Process design document request
For each design document requested:
1. Display design document.
2. Allow editing of design document.
System Analysis 44
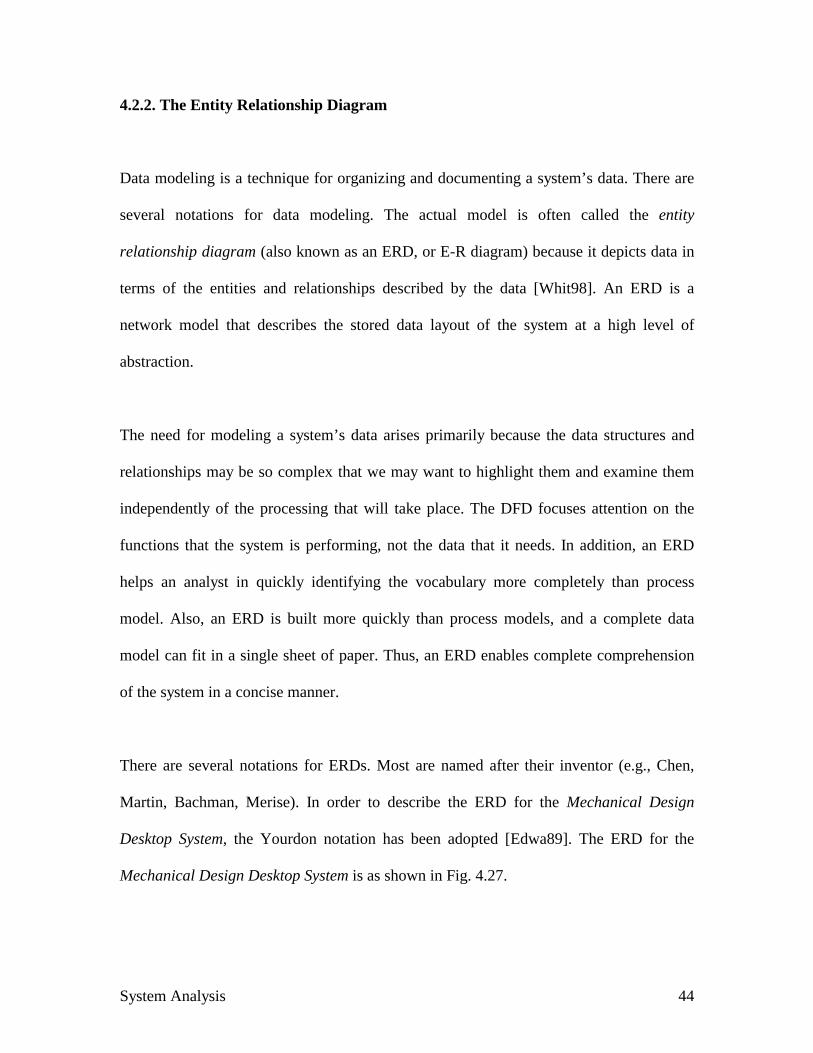
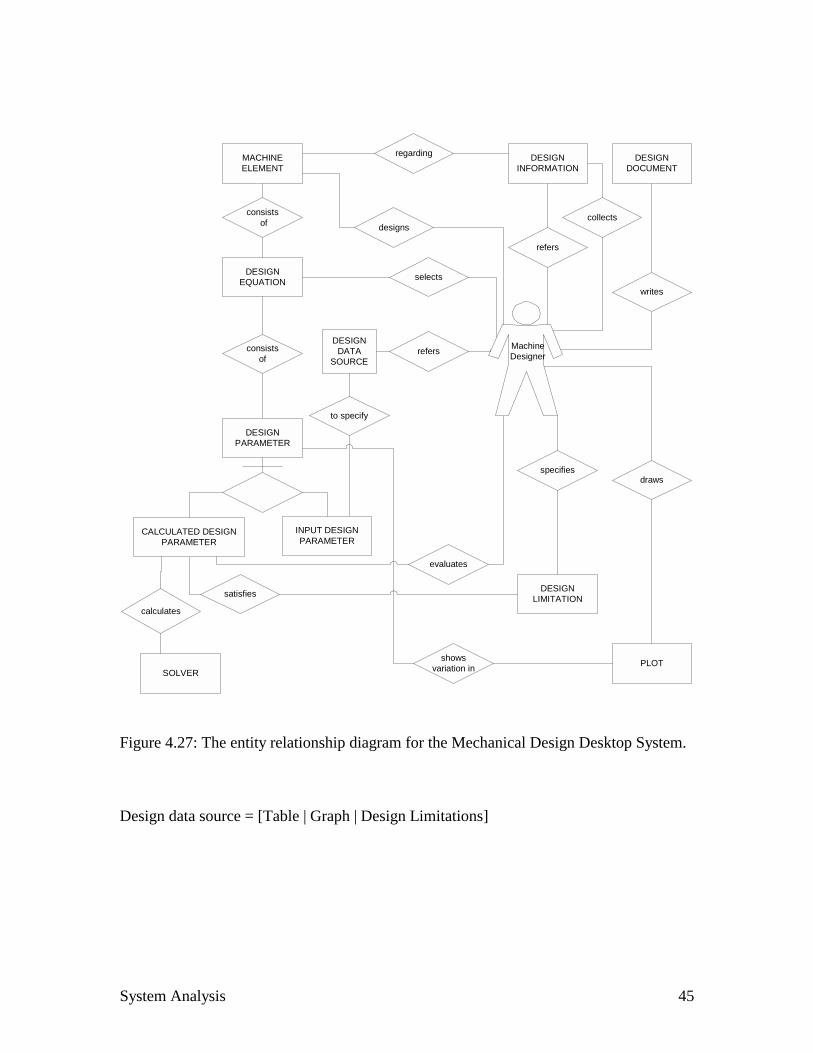
4.2.2. The Entity Relationship Diagram
Data modeling is a technique for organizing and documenting a system’s data. There are
several notations for data modeling. The actual model is often called the entity
relationship diagram (also known as an ERD, or E-R diagram) because it depicts data in
terms of the entities and relationships described by the data [Whit98]. An ERD is a
network model that describes the stored data layout of the system at a high level of
abstraction.
The need for modeling a system’s data arises primarily because the data structures and
relationships may be so complex that we may want to highlight them and examine them
independently of the processing that will take place. The DFD focuses attention on the
functions that the system is performing, not the data that it needs. In addition, an ERD
helps an analyst in quickly identifying the vocabulary more completely than process
model. Also, an ERD is built more quickly than process models, and a complete data
model can fit in a single sheet of paper. Thus, an ERD enables complete comprehension
of the system in a concise manner.
There are several notations for ERDs. Most are named after their inventor (e.g., Chen,
Martin, Bachman, Merise). In order to describe the ERD for the Mechanical Design
Desktop System, the Yourdon notation has been adopted [Edwa89]. The ERD for the
Mechanical Design Desktop System is as shown in Fig. 4.27.
System Analysis 45
Figure 4.27: The entity relationship diagram for the Mechanical Design Desktop System.
Design data source = [Table | Graph | Design Limitations]
DESIGNEQUATION
consistsof
DESIGNPARAMETER
evaluates
selectswrites
DESIGNDOCUMENT
draws
PLOTSOLVER
calculates
MACHINEELEMENT
designs
consists of
DESIGNLIMITATIONsatisfies
refers
specifies
collects
DESIGNINFORMATION
regarding
showsvariation in
refers
MachineDesigner
DESIGNDATA
SOURCE
to specify
INPUT DESIGNPARAMETER
CALCULATED DESIGNPARAMETER