4 water quality lecture - university of california, santa...
TRANSCRIPT

1
Discussion Items
! Announcements ! Group Project topics ! Discuss previous lab (Microbes in food)
– Results – Lab report – Isolates streak isolate by Thursday.
! Microbial analysis of water (Tuesday) – MPN and MF
! Growth Curve (Thursday)
Microbial Indicators of Water Quality ! Membrane filtration (Tuesday) ! MPN (Tuesday) ! Next steps:
– Streak plate the MPN tube on EMB agar – This will indicate E. coli or other fecal bacteria – Gram stain a colony to confirm morphology and
Gram properties.

2
Concerns about Microbial pollution in recreational waters
! 550 million people visit CA beaches each year.
! Economic benefit of $27 billion ! If beach has more than 50,000 annual visitors
city needs to monitor for: – total coliforms, fecal coliforms, and enterococci
! If indicators rise above a certain standard then beaches could be closed.
Grant et al. Generation of enterococci bacteria in a coastal saltwater marsh and its impact on surf zone water quality. Environ. Sci. Technol. (2001) vol. 35 (12) pp. 2407-16
http://spongebob.nick.com/pictures/spongebob-squarepants-sponge-cation-time-pictures.html
Microbes indicators of water quality

3
Huntington Beach, CA beach closures traced to saltmarsh
High ENT was not due to human influence like sewage leaks and urban runoff Problem was tracked to a salt marsh and tidal fluctuations and bird fecal pollution
Grant et al. Generation of enterococci bacteria in a coastal saltwater marsh and its impact on surf zone water quality. Environ. Sci. Technol. (2001) vol. 35 (12) pp. 2407-16
Microbial indicators of water pollution: fecal pollution
! Why test for fecal indicator bacteria (FIB)? – Difficult to directly monitor the pathogen
! What are some examples? – Coliforms and fecal coliforms – Clostridium perfringens – E. coli – fecal enterococci
! Microbial Source Tracking – Diagnosing the original of fecal pollutions – Distinguishing animal vs. human
Clostridium perfringens
Image: http://oh.water.usgs.gov/micro_methods_clostridium_perfringens.htm

4
What is an indicator organism? ! An organism that can be readily cultured that
indicates the presence of a pathogenic microorganism or correlates to a health problem.
! Five criteria for an indicator organism: 1. Consistently present in feces and at higher concentrations than
pathogens. 2. Should not multiply outside the human intestinal tract. 3. Should be as resistant or more resistant than the pathogen to
environmental conditions and to disinfection. 4. Easy to assay (culture and quantify) and differentiate from other
organisms. 5. Environmental concentrations should correlate with pathogens or
measurable health hazards.
Common indicator bacteria ! Coliforms:
– Facultatively aerobic, gram-negative, nonspore-forming, rod-shaped bacteria; ferment lactose with gas formation at 35˚C within 48 hrs.
– Usually enteric bacterial group (E. coli, Klebsiella, Citrobacter, Enterobacter, Serratia, Yersinia)
– Poor indicator: often found outside of the intestinal tract
! Fecal coliforms – Thermotolerant coliforms (44.5˚C), 20% of
total coliforms.
! Fecal indicator bacteria (FIB) cannot determine the source. Why?
Quanti-Tray
E. coli
Yellow=Coliforms
http://www.fs.fed.us/t-d/programs/im/coliform/Ecoli_06.shtml

5
Monitoring of indicators is done using
culturing techniques and selective media.
Gram positives
Technique: Membrane Filtration

6
Use mTEC Agar to select for the growth of E. coli
! mTEC = membrane Thermotolerant E. coli ! Used to distinguish E. coli from other
bacteria.

7
Interpreting the membrane filtration results
" Regular mTEC E. coli colonies are yellow
" mFC count blue colonies: these are fecal coliforms.
" How do you calculate CFU/ml?
Lactose Fermentation Lowers pH
pH indicator Turns yellow when acidic
Most Probable Number MPN: Presumptive Test
! Determines presence of coliforms (gas producers). ! Serial dilution of replicate lactose broth tubes
MPN index reports data as per 100 ml

8
Growth: Yes No
Fermentation: Yes Yes No Gas
MOST PROBABLE NUMBER (MPN) DETERMINATION FROM MULTIPLE TUBE TEST
NUMBER OF TUBES GIVING POSITIVE
REACTION FROM 95% CONFIDENCE LIMITS
3 tubes inoculated
with 10.0mL
water
3 tubes inoculated
with 1.0mL
water
3 tubes inoculated
with 0.1mL
water
MPN
Index
per 100mL Lower Upper
0 0 1 3 <0.5 9
0 1 0 3 <0.5 13
1 0 0 4 <0.5 20
1 0 1 7 1 21
1 1 0 7 1 23
1 1 1 11 3 36
1 2 0 11 3 36
2 0 0 9 1 36
2 0 1 14 3 37
2 1 0 15 3 44
2 1 1 20 7 89
2 2 0 21 4 47
2 2 1 28 10 150
3 0 0 23 4 120
3 0 1 39 7 130
3 0 2 64 15 380
3 1 0 43 7 210
3 1 1 75 14 230
3 1 2 120 30 380
3 2 0 93 15 380
3 2 1 150 30 440
3 2 2 210 35 470
3 3 0 240 36 1300
3 3 1 460 71 2400
3 3 2 1100 150 4800
From Standard Methods for the Examination of Water and Wastewater, 12th Edition.
(New York: The American Public Health Association, Inc.)

9
Streak Gas Positive MPN tubes on to Eosin Methylene Blue (EMB) Agar
! Used to distinguish E. coli from other bacteria. – Enterobacter, Pseudomonas, Salmonella, etc.
! Eosin Y and Methylene Blue are pH indicators ! Dark = acidic ! Light = alkaline ! Dyes also inhibit Gram + ! Has lactose, sucrose and amino acids ! How to use it:
– Streak your Gas + tube onto EMB Agar – Streak an mTEC yellow colony onto EMB
Results for the EMB Agar plates E.#coli# Enterobacter# Pseudomonas#

10
Possible sampling sites http://gis.co.santa-cruz.ca.us/publicWaterQuality/
San Lorenzo @ Laurel
11
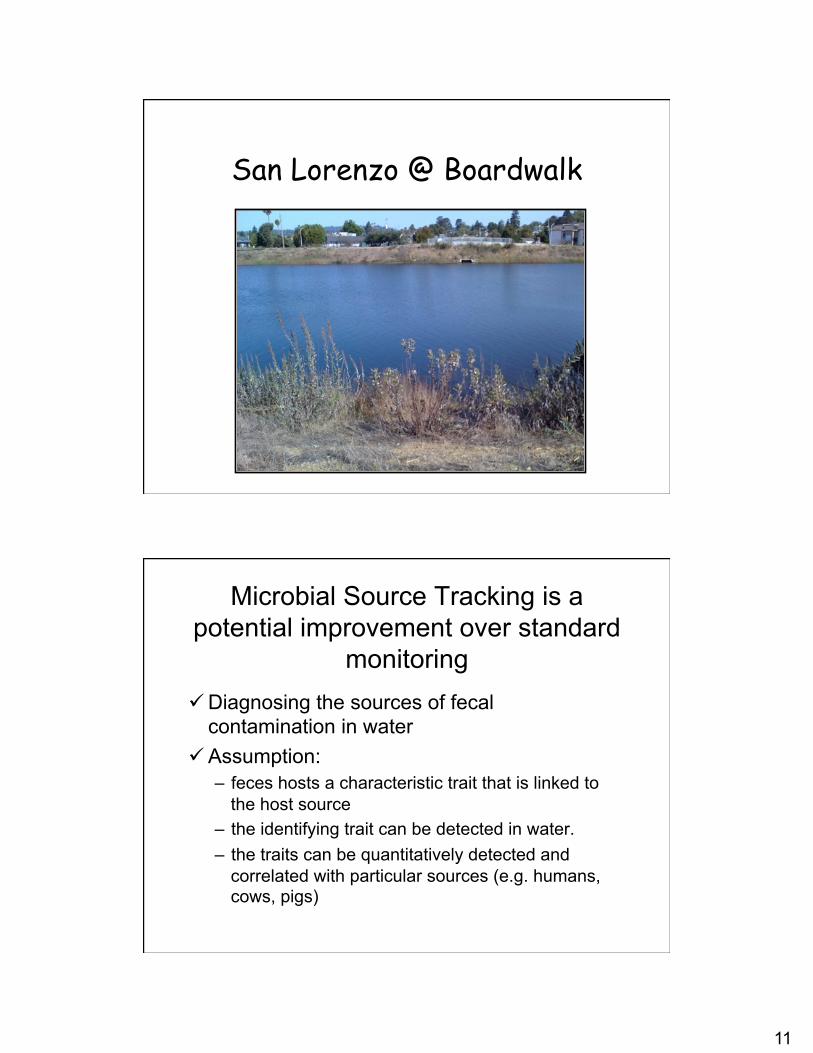
San Lorenzo @ Boardwalk
Microbial Source Tracking is a potential improvement over standard
monitoring ! Diagnosing the sources of fecal
contamination in water ! Assumption:
– feces hosts a characteristic trait that is linked to the host source
– the identifying trait can be detected in water. – the traits can be quantitatively detected and
correlated with particular sources (e.g. humans, cows, pigs)

12
MST: Why track fecal pollution?
" Investigate source of high FIBs. " …to eliminate them.
" To identify a particular pathogen " Like E. coli O157:H7
" Estimate human risk of illness with exposure to the contaminated water source
Molecular techniques for monitoring indicators
! Molecular methods can be very sensitive. – In theory, one gene copy can be detected via PCR.
! Molecular methods can be rapid: <1 day for results. ! Instead of growing organisms the goal is to track the
genetic signature of pathogens in environmental samples.
! DNA is extracted from a sample and PCR is usually done to detect some genetic marker that is only present in a particular pathogen or virus.
! What gene target would you go after?

13
Dombek, P. E. et al. 2000. Appl. Environ. Microbiol. 66(6):2572-2577
FIG. 1.
REP-PCR PCR method using primers that target the repetitive extragenic element. A banding pattern occurs based on the number of priming sites for the rep-primer The banding patterns are analyzed Similar patterns are grouped together.
FIG. 1. rep-PCR DNA fingerprint patterns of E. coli strains obtained from beef and dairy cows. (A) PCR DNA fingerprint patterns generated with primer BOX A1R. Lanes A and L contained an external standard, a 1-kb molecular weight ladder. (B) PCR DNA fingerprint patterns generated with primers REP 1R and REP 2I. Lanes A and L contained an external standard, a 1-kb molecular weight ladder. The E. coli strains used for the fingerprint analysis shown in panel B are identical to the strains used for the analysis shown in panel A, except that the strains in lanes O and T are reversed.
Dombek, P. E. et al. 2000. Appl. Environ. Microbiol. 66(6):2572-2577
FIG. 2.
FIG. 2. Dendrogram showing the relatedness of E. coli strains isolated from humans, geese, ducks, sheep, pigs, chickens, and cows as determined by a PCR DNA fingerprint analysis performed with primer BOX A1R. Relationships were determined by using Jaccard similarity coefficients and the neighbor-joining clustering method.

14
Dombek, P. E. et al. 2000. Appl. Environ. Microbiol. 66(6):2572-2577
FIG. 3. FIG. 3. MANOVA of BOX-derived PCR DNA fingerprints from E. coli strains obtained from animal and human sources. Binary band-matching character tables were analyzed by MANOVA, accounting for the covariance structure. The E. coli isolates were obtained from humans (), geese (), ducks (), sheep (), pigs (), chickens (), and cows (). The first discriminant is represented by the distance along the x axis, and the second discriminant is represented by the distance along the y axis.
Example: detecting toxic E. coli by PCR
! Shiga toxigenic Escherichia coli (STEC) cause deadly gastrointestinal disease in humans: e.g. O157 types.
! Here are some detectable virulence factors: – The hlyA gene for Enterohemolysin E. coli (EHEC) – The eaeA gene for intimin, encodes attaching and effacing (A/E) protein – The stx1 and stx2 genes, Shiga type 1 and 2 toxins; type 1 is more deadly
! Use multiplex PCR, which allows detection of multiple genes in one PCR.
E. coli in lane 2 would be deadly!
From: Paton and Paton 1998. JCM 36 (2): 598
Different E. coli strains were tested

15
Using toxin genes to source tracking water samples?
! Certain toxin genes are endemic to specific animals. – Cows have LTIIa – Swine have STII
! This method requires enrichment of E. coli first then detection.
Khatib et al. A biomarker for the identification of cattle fecal pollution in water using the LTIIa toxin gene from enterotoxigenic Escherichia coli. Appl Microbiol Biotechnol (2002) vol. 59 (1) pp. 97-104