4. summary of arabidopsis lipid composition - acyl...
TRANSCRIPT

Part of the ‘acyl-lipid metabolism’ chapter in The Arabidopsis Book Page 1
4. SUMMARY OF ARABIDOPSIS LIPID COMPOSITION
This section summarizes the acyl lipid composition for various tissues and organs of wild type Arabidopsis. Data presented in this chapter were collected from Col-0 ecotype unless otherwise noted. The goal of this section is to provide a quick and easy access to summary on acyl lipid content and composition, which sometimes can be difficult to find. It is composed of 15 tables and 3 figures as outlined below:
Tables included: (hyperlinked)
Table 4. Fatty Acid Composition of Arabidopsis Tissues Table 5. Molecular Species Composition for 52 TAGs From Dry Seeds Table 6. Glycerolipid Composition of Arabidopsis Tissues Table 7. Fatty Acid Composition of Individual Leaf Glycerolipids From Arabidopsis Table 8. Load of Cuticular Wax Compound Classes in Stems and Rosette Leaves of Arabidopsis Table 9. Total Load of Suberin and Suberin-Associated Waxes in Arabidopsis Seeds and Roots Table 10. Suberin Monomer Composition in Seed Coats and Roots Table 11. Composition of Arabidopsis Root Waxes Table 12. Composition of Arabidopsis Seed Waxes Table 13. Cutin Monomer Composition in Arabidopsis Tissues Table 14. Fatty Acid Composition of Glycerophospholipids in Mitochondrial Membranes of Arabidopsis Table 15. Lipid Composition of Mitochondria Isolated From Arabidopsis Table 16. Acyl-CoA Composition of Arabidopsis Leaf Tissues Table 17. Sphingolipid Composition of Arabidopsis Tissues Table 18. Stereospecific Analysis of Arabidopsis Seed Triacylglycerols Figures included:
Figure 21. Relative Distribution of Lipids and Other Components of Arabidopsis Leaf. Figure 22. Relative Distribution of Lipids and Other Components of Arabidopsis Seeds. Figure 23. Distribution of Extracellular Lipids in Mature Seeds.

Part of the ‘acyl-lipid metabolism’ chapter in The Arabidopsis Book Page 2
Table 4. Fatty Acid Composition of Arabidopsis Tissues
Fatty Acids
Tissue Types
Seed Leaf Stem Flower Root
Mature 5-Week-Old Open Flower 15-Day-Old
16:0 8.7±0.1 15.0±0.13 26.3±0.6 28.0±0.1 20.7±0.8
16:1(d3 + d9) ― 3.8±0.04 2.3±0.02 ― 1.2±0.6
16:2 ― 1.1±0.03 ― ― 0.4±0.1
16:3 ― 13.8±0.19 11.7±1.6 3.3±0.4 1.5±0.1
18:0 3.6± 0.1 1.0±0.04 2.3±0.01 1.9±0.03 1.9±0.1
18:1 (d9 + d11) 15.0±0.2 3.5±0.14 1.0±0.01 ― 7.5±0.01
18:2 29.0±0.3 15.7±0.17 19.9±2.4 36.9±0.4 36.5±1.8
18:3 19.2±0.1 46.0±0.2 36.4±3.3 28.3±0.1 24.6±2.3
20:0 2.2±0.1 ― ― 0.6±0.1 1.4±0.02
20:1 20.2±0.1 ― ― ― ―
20:2 2.0±0.1 ― ― ― ―
22:0 ― ― ― 0.5±0.02 2.5±0.1
22:1 1.7±0.1 ― ― ― ―
24:0 ― ― ― 0.4±0.03 1.7±0.1
Reference Y.H. Li et al.,
2006
Miquel and Browse,
1992
Y.H. Li et al.,
2007a
Li-Beisson et al.,
2009
Beaudoin et al.,
2009
Data are mean expressed as mol% ± SD (SE for leaves). Seeds n = 6, leaves n = 24, stems n = 4, flowers n = 3, roots n = 4). ― = not detected. (Prepared by Yonghua Li-Beisson)
Back

Part of the ‘acyl-lipid metabolism’ chapter in The Arabidopsis Book Page 3
Table 5. Molecular Species Composition for 52 TAGs From Dry Seeds
TAG Molecular Species Weight %
TAG Molecular Species Weight %
20:1-18:2-18:3 11.5 ± 0.9 18:0-18:2-20:1 1.3 ± 0.1
18:2-20:1-18:2 7.7 ± 0.4 16:0-18:2-16:0 1.3 ± 0.1
18:3-20:1-18:3 6.9 ± 0.5 18:2-20:0-18:2 1.3 ± 0.1
16:0-18:2-20:1 5.1 ± 0.3 16:0-18:1-20:1 1.2 ± 0.1
18:1-18:2-18:3 4.4 ± 0.2 18:0-18:3-20:1 1.0 ± 0.1
20:1-18:3-18:1 4.2 ± 0.3 16:0-18:2-18:0 1.0 ± 0.0
16:0-18:2-18:3 3.6 ± 0.2 18:0-18:2-18:1 0.9 ± 0.1
18:2-16:0-18:2 3.4 ± 0.2 18:3-20:0-18:3 0.9 ± 0.1
16:0-18:3-20:1 3.4 ± 0.1 16:0-20:0-18:2 0.8 ± 0.0
20:1-20:1-18:2 2.8 ± 0.7 16:0-16:0-18:3 0.6 ± 0.1
20:1-20:1-18:3 2.8 ± 0.3 20:0-18:2-18:1 0.6 ± 0.0
16:0-18:2-18:1 2.8 ± 0.1 18:3-18:3-18:3 0.6 ± 0.1
18:2-18:2-18:1 2.6 ± 0.1 20:0-18:2-20:1 0.6 ± 0.1
18:1-20:1-18:1 2.5 ± 0.1 16:0-20:0-18:3 0.5 ± 0.0
18:2-18:3-18:2 2.3 ± 0.2 20:0-18:3-18:1 0.5 ± 0.0
18:3-18:1-18:3 2.2 ± 0.1 16:0-18:3-18:0 0.5 ± 0.0
18:3-18:2-18:3 1.8 ± 0.1 20:0-18:3-20:1 0.4 ± 0.0
18:1-18:2-18:1 1.7 ± 0.3 18:0-18:1-20:1 0.4 ± 0.1
20:0-18:2-18:3 1.7 ± 0.1 18:1-20:0-18:1 0.3 ± 0.0
16:0-18:3-18:1 1.6 ± 0.1 16:0-16:0-18:1 0.3 ± 0.1
18:0-18:2-18:3 1.6 ± 0.1 22:0-18:2-18:3 0.2 ± 0.0
18:2-18:2-18:0 1.5 ± 0.2 16:0-18:1-18:0 0.2 ± 0.0
18:3-18:2-22:1 1.4 ± 0.2 18:2-20:0-18:0 0.2 ± 0.0
20:1-18:1-20:1 1.4 ± 0.1 18:2-22:0-18:2 0.2 ± 0.0
18:2-18:2-18:2 1.3 ± 0.1 18:3-18:3-20:3 0.2 ± 0.0
18:1-18:3-18:1 1.3 ± 0.1 16:0-18:1-20:0 0.2 ± 0.1
TAGs were extracted from 50 seeds/plant and subjected to LC-MS/MS analysis. Amounts were calculated as weight % of total TAGs detected. Only TAGs with an abundance >0.2% are shown. The putative sn-2 assignment of the fatty acid for each TAG annotation (sn-(1,3) – sn-2 – sn-(1,3) was deduced from the intensity of the MS2 daughter ions; sn-(1,3) positions are interchangeable. However, sn-2 assignments are not guaranteed without further analysis. Values are mean ± SD (n = 5).
(Prepared by Tony Larson)

Part of the ‘acyl-lipid metabolism’ chapter in The Arabidopsis Book Page 4
Table 6. Glycerolipid Composition of Arabidopsis Tissues
Glycerolipid
Classes
Tissue Types
Seed Root Chloroplasts Extrachloroplasts Leaf (7-Week-Old)
PC 48.1 45.4 12.0 47.8 13.8
PE 22.1 27.5 ― 36.5 7.1
PI + PS 18.9 12.9 ― 10.9 3.1
PA ― ― ― ― 0.7
SQDG ― ― 3.9 ― ―
DGDG 3.3 2.0 20.9 ― 18.6
PG 4.6 3.8 9.5 4.4 13.5
MGDG 3.0 3.4 53.7 ― 43.2
References Browse and Somerville, 1994 Welti et al., 2002
Data are mean and expressed as mol%. ― = not detected. (Prepared by Mats Andersson)
Back
Table 7. Fatty Acid Composition of Individual Leaf Glycerolipids From Arabidopsis
Fatty Acids Leaf Glycerolipid Classes
PC PE PI PG MGDG DGDG SQDG
16:0 20.6 31.2 43.5 20.7 1.5 13.6 43.2
16:1 0.6 ― ― 33.5 1.5 0.3 ―
16:2 ― ― ― ― 1.3 0.6 ―
16:3 ― ― ― ― 30.6 2.1 ―
18:0 2.7 3.4 5.2 1.8 0.2 1.1 3.7
18:1 4.4 3.3 4.3 6 1.5 1.3 5.3
18:2 38.8 43 27 12.5 3.4 5.0 10.4
18:3 32.1 18.7 20 25.6 60.0 75.9 37.4
% of total
polar lipids 17.2 10.3 3.5 10.1 42.3 14.2 2.5
Reference Miquel and Browse, 1992
Data are mean and expressed as mol%. 15-day-old rosette leaves were analyzed. ― = not detected. (Prepared by Mats Andersson)

Part of the ‘acyl-lipid metabolism’ chapter in The Arabidopsis Book Page 5
Table 8. Load of Cuticular Wax Compound Classes in Stems and Rosette Leaves of Arabidopsis
Compound
Classes
Acyl Chain
Length
Tissue Type
Stem Leaf
Free fatty acids
C22 1.5 ± 0.3 ―
C24 2.7 ± 0.4 0.3 ± 0.2
C26 5.7 ± 1.0 2.7 ± 0.5
C28 23.5 ± 4.0 3.9 ± 0.5
C30 15.5 ± 6.5 5.6 ± 1.0
Aldehydes
C26 8.4 ± 1.1 ―
C28 36.2 ± 4.5 2.5 ± 0.6
C30 57.1 ± 6.9 2.7 ± 0.6
Primary alcohols
C24 3.5 ± 0.6 ―
C26 32.7 ± 4.6 3.6 ± 0.6
C28 63.0 ± 8.8 6.3 ± 1.2
C30 21.3 ± 1.9 1.5 ± 1.1
Alkanes
C25 4.5 ± 0.4 0.8 ± 0.6
C26 0.6 ± 0.4 0.2 ± 0.3
C27 27.3 ± 2.6 2.7 ± 0.5
C28 8.0 ± 0.9 0.3 ± 0.2
C29 1318.1 ± 57.6 30.3 ± 1.6
C30 9.1 ± 0.6 1.1 ± 0.2
C31 30.5 ± 6.0 60.5 ± 4.4
C32 3.3 ± 0.4 1.2 ± 0.1
C33 4.4 ± 0.4 16.7 ± 1.3
Secondary
alcohols
C29 55.5 ± 8.5 ―
C31 8.1 ± 0.7 ―
Ketone C29 534.7 ± 12.4 0.9 ± 0.6
Wax esters
C38 3.8 ± 0.4 ―
C40 8.6 ± 0.3 ―
C42 28.5 ± 2.6 ―
C44 22.0 ± 1.9 ―
C46 9.8 ± 0.9 ―
C48 3.9 ± 0.6 ―
Unidentified 43.0 ± 14.7 3.1 ± 2.1
Total 2399.1 ± 71.5 150.1 ± 8.2
Reference Lü et al., 2009
Total wax loads and coverage of individual compound classes (µg/dm
2) are given as mean values ±SD (n = 3). Stem and
leaf tissue were taken from 6-week-old Arabidopsis plants. ― = not detected. (Prepared by Owen Rowland)
Back

Part of the ‘acyl-lipid metabolism’ chapter in The Arabidopsis Book Page 6
Table 9. Total Load of Suberin and Suberin-Associated Waxes in Arabidopsis Seeds and Roots
Tissue
Type
Suberin Polyester Monomers Chloroform-Extracted Waxes
Monomer Load References Wax Load References
Seed
a2.56 g/g seeds
46 ng/seed
12 g/cm2
Molina et al., 2006 170 g/g seeds
1.3 ng/seed
Y.H. Li et al., 2007b
Beisson et al., 2007
Root
b62.7 mg/g residue
b50.5 g/cm
2
c7.2 mg/g cell wall
d17 mg/g cell wall
Franke et al., 2005
Franke et al., 2005
Beisson et al., 2007
Y.H. Li et al., 2007b
360 g/gfw Y.H. Li et al., 2007b
(Prepared by Isabel Molina) aSuberin monomers are mostly deposited on the seed coat, but determinations were performed on solvent-extracted
residues of whole mature seed samples. Thus, the reported total lipid polyester monomer load includes a contribution of cutin-like monomers from the embryo (about 11% in B. napus seeds). bLipid polyester monomers determined on solvent-extracted and enzyme-digested (cellulases + pectinases) roots of 5-week-
old plants grown on soil. cLipid polyester monomers determined on solvent-extracted primary roots of 1-week-old seedlings grown on plates.
dLipid polyester monomers determined on solvent-extracted secondary roots of 7-week-old plants grown on soil.
Back

Part of the ‘acyl-lipid metabolism’ chapter in The Arabidopsis Book Page 7
Table 10. Suberin Monomer Composition in Seed Coats and Roots
Polyester Monomers Tissue Type
Seeda (mol %) Root
b (Weight %)
Octadecan-1-ol (C18) 1.50 ± 0.10 2.11 ± 1.46
Eicosan-1-ol (C20) 1.50 ± 0.10 2.49 ± 0.13
Docosan-1-ol (C22) 2.80 ± 0.25 1.83 ± 0.53
Nonadecan-1-ol, branched (C19) 0.30 ± 0.05 ―
Tricosan-1-ol, branched (C23) 0.35 ± 0.05 ―
Total alkan-1-ols 6.50 ± 0.45 6.43 ± 1.06
16-Hydroxyhexadecanoic acid (C16) 1.75 ± 0.10 5.77 ± 1.2
18-Hydroxyoctadecadienoic acid (C18:2) 4.55 ± 0.60 ―
18-Hydroxyoctadecenoic acid (C18:1) 3.45 ± 0.25 23.11 ± 2.26
18-Hydroxyoctadecanoic acid (C18) 0.25 ± 0.05 2.73 ± 0.88
20-Hydroxyeicosanoic acid (C20) 0.65 ± 0.10 3.07 ± 0.44
22-Hydroxydocosanoic acid (C22) 4.20 ± 0.25 7.79 ± 0.76
22-Hydroxydocosanoic acid, branched (C22) 0.70 ± 0.05 ―
23-Hydroxytricosanoic acid (C23) 0.55 ± 0.05 ―
24-Hydroxytetracosanoic acid (C24) 12.60 ± 0.45 0.71 ± 0.24
24-Hydroxytetracosanoic acid, branched (C24) 0.40 ± 0.05 ―
25-Hydroxypentacosanoic acid (C25) 0.30 ± 0.05 ―
26-Hydroxyhexacosanoic acid (C26) 0.20 ± 0.05 ―
Total -hydroxy fatty acids 29.6 ± 1.95 43.19 ± 4.14
1,16-Hexadecane dioic acid (C16) 1.80 ± 0.10 4.91 ± 1.3
1,18-Octadecadiene dioic acid (C18:2) 8.90 ± 0.75 ―
1,18-Octadecene dioic acid (C18:1) 3.40 ± 0.20 10.68 ± 0.76
1,18-Octadecane dioic acid (C18) 0.50 ± 0.05 5.87 ± 4.79
1,20-Eicosane dioic acid (C20) ― 1.01 ± 0.2
1,22-Docosane dioic acid (C22) 1.65 ± 0.10 1.39 ± 0.15
1,24-Tetracosane dioic acid (C24) 8.50 ± 0.40 0.35 ± 0.26
Total 1, -dicarboxylic acids 24.75 ± 1.60 24.21 ± 4.69
1,20-Eicosane diol (C20) 0.30 ± 0.05 ―
1,22-Docosane diol (C22) 2.40 ± 0.02 ―
Total 1, -alkane diols 2.70 ± 0.25 ―
Hexadecanoic acid (C16) 2.00 ± 0.25 ―
Octadecanoic acid (C18) 0.35 ± 0.10 0.12 ±0 .03
C18:1, C18:2, C18:3 acids 5.50 ± 1.50 ―
Eicosanoic acid (C20) 0.50 ± 0.05 2.23 ± 0.82
Eicosenoic acid (C20:1) 1.40 ± 0.40 ―
Docosanoic acid (C22) 0.50 ± 0.05 6.18 ± 0.7
Tetracosanoic acid (C24) 1.50±0.10 1.11 ± 0.52
Hexacosanoic acid (C26) 0.55 ± 0.05 ―
Hexacosenoic acid (C26:1) 0.45 ± 0.10 ―
Part of the ‘acyl-lipid metabolism’ chapter in The Arabidopsis Book Page 8
Octacosenoic acid (C28) 0.15 ―
Octacosenoic acid (C28:1) 0.30 ± 0.05 ―
Dotriacontanoic acid (C32) 0.10 ―
Dotriacontenoic acid (C32:1) 0.15 ―
Tetratriacontenoic acid (C34) 0.15 ―
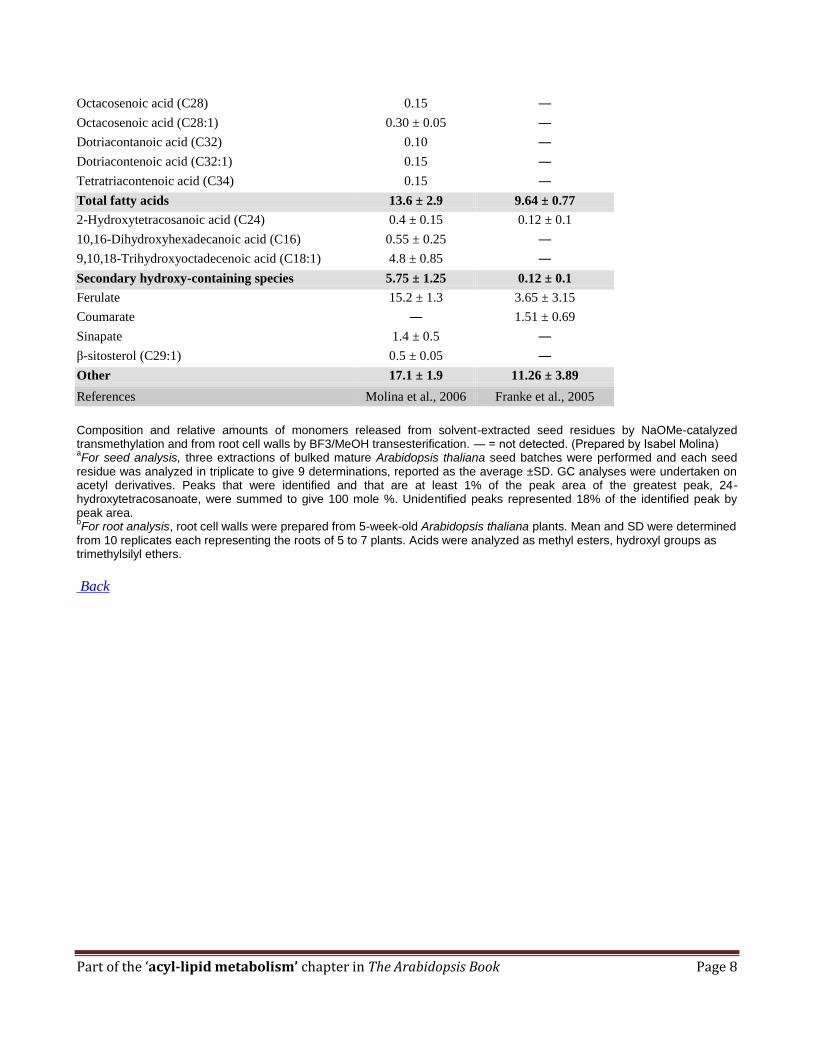
Total fatty acids 13.6 ± 2.9 9.64 ± 0.77
2-Hydroxytetracosanoic acid (C24) 0.4 ± 0.15 0.12 ± 0.1
10,16-Dihydroxyhexadecanoic acid (C16) 0.55 ± 0.25 ―
9,10,18-Trihydroxyoctadecenoic acid (C18:1) 4.8 ± 0.85 ―
Secondary hydroxy-containing species 5.75 ± 1.25 0.12 ± 0.1
Ferulate 15.2 ± 1.3 3.65 ± 3.15
Coumarate ― 1.51 ± 0.69
Sinapate 1.4 ± 0.5 ―
β-sitosterol (C29:1) 0.5 ± 0.05 ―
Other 17.1 ± 1.9 11.26 ± 3.89
References Molina et al., 2006 Franke et al., 2005
Composition and relative amounts of monomers released from solvent-extracted seed residues by NaOMe-catalyzed transmethylation and from root cell walls by BF3/MeOH transesterification. ― = not detected. (Prepared by Isabel Molina) aFor seed analysis, three extractions of bulked mature Arabidopsis thaliana seed batches were performed and each seed
residue was analyzed in triplicate to give 9 determinations, reported as the average ±SD. GC analyses were undertaken on acetyl derivatives. Peaks that were identified and that are at least 1% of the peak area of the greatest peak, 24-hydroxytetracosanoate, were summed to give 100 mole %. Unidentified peaks represented 18% of the identified peak by peak area. bFor root analysis, root cell walls were prepared from 5-week-old Arabidopsis thaliana plants. Mean and SD were determined
from 10 replicates each representing the roots of 5 to 7 plants. Acids were analyzed as methyl esters, hydroxyl groups as trimethylsilyl ethers.
Back

Part of the ‘acyl-lipid metabolism’ chapter in The Arabidopsis Book Page 9
Table 11. Composition of Arabidopsis Root Waxes
Compound classes Acyl chain length Waxes (weight %)
Primary alcohols
18:0 0.97
20:0 2.18
22:0 6.13
Free fatty acids
16:0 3.75
18:0 4.93
20:0 0.89
22:0 3.06
24:0 2.38
26:0 0.43
28:0 0.23
30:0 0.09
Stem-type waxes
29 Alkane 2.93
29 15-OH 2.02
29 ketone 0.57
Monoacylglycerols
β-22:0 2.29
a-22:0 0.99
β-24:0 1.26
a-24:0 0.72
β-26:0 0.30
a-26:0 0.17
β-28:0 ―
a-28:0 0.16
β-30:0 ―
a-30:0 0.23
Sterols 28:1 3.67
29:1 12.16
Coumarates
18:0 6.90
20:0 7.72
22:0 9.86
Ferulates
18:0 1.23
20:0 2.28
22:0 4.31
Caffeates
18:0 2.67
20:0 3.45
22:0 9.06
Reference Y.H. Li et al., 2007b
Data are average of 3 replicates. ― = not detected. (Prepared by Isabel Molina)
Back

Part of the ‘acyl-lipid metabolism’ chapter in The Arabidopsis Book Page 10
Table 12. Composition of Arabidopsis Seed Waxes
Compound Classes Acyl Chain Length Mass%
Fatty acids 26:0 3.09 ± 0.42
Primary alcohols
26:0 4.33 ± 0.03
28:0 4.91 ± 0.03
30:0 0.95 ± 0.22
Alkanes
27:0 1.46 ± 0.05
29:0
54.41 ±
0.42
31:0 2.80 ± 0.06
Secondary alcohols 29 15-OH 9.34 ± 0.05
Ketones 29
18.70 ±
0.28
References Molina et al., 2008
Values are average ±SE (n = 3). (Prepared by Isabel Molina)
Table 13. Cutin Monomer Composition in Arabidopsis Tissues
Compound Classes Acyl Chain Length
Tissue Type
Stem Leaf Flower
(µg/dm2) (µg/g FW)
Fatty acids
16:0 4.5 ± 0.2 2.8 ± 0.2 10 ± 1
18:0 1.2 ± 0.1 1.4 ± 0.1 2.9 ± 0.3
18:1, 18:2 2.5 ± 0.6 1.5 ± 0.2 3.6 ± 0.9
20:0 2.8 ± 1.1 1.4 ± 0.1 10 ± 1
22:0 3.4 ± 0.3 2.2 ± 0.2 24 ± 1
24:0 7.1 ± 1.4 4.4 ± 0.3 6 ± 1
ω-hydroxy fatty acids
16:0 12.3 ± 1.1 1.3 ± 0.1 44 ± 6
18:2 7 ± 0.3 6.4 ± 0.5 45 ± 2
18:1 7.9 ± 0.8 4.7 ± 0.1 23 ± 9
α,ω-Dicarboxylic acids
16:0 15.8 ± 1.8 9.9 ± 0.4 102 ± 14
18:2 127.2 ± 26.6 57.7 ± 2.2 126 ± 22
18:1 10.4 ± 1.6 9.7 ± 0.3 74 ± 14
18:0 4.3 ± 0.7 5 ± 0.2 14 ± 8
10(9),16-dihydroxy 16:0 3.6 ± 0.2 4 ± 0.1 620 ± 120
Total 210 ± 18.2 110.7 ± 9.8 1104 ± 81
References Y.H. Li et al., 2007a; Li-Beisson et al., 2009
Data are mean with SD (n = 4). For leaf and cutin analysis, samples were prepared from 5-week-old plants; for flowers, open flower (stage 15) were used. ― = not detected. (Prepared by Fred Beisson)
Back
Part of the ‘acyl-lipid metabolism’ chapter in The Arabidopsis Book Page 11
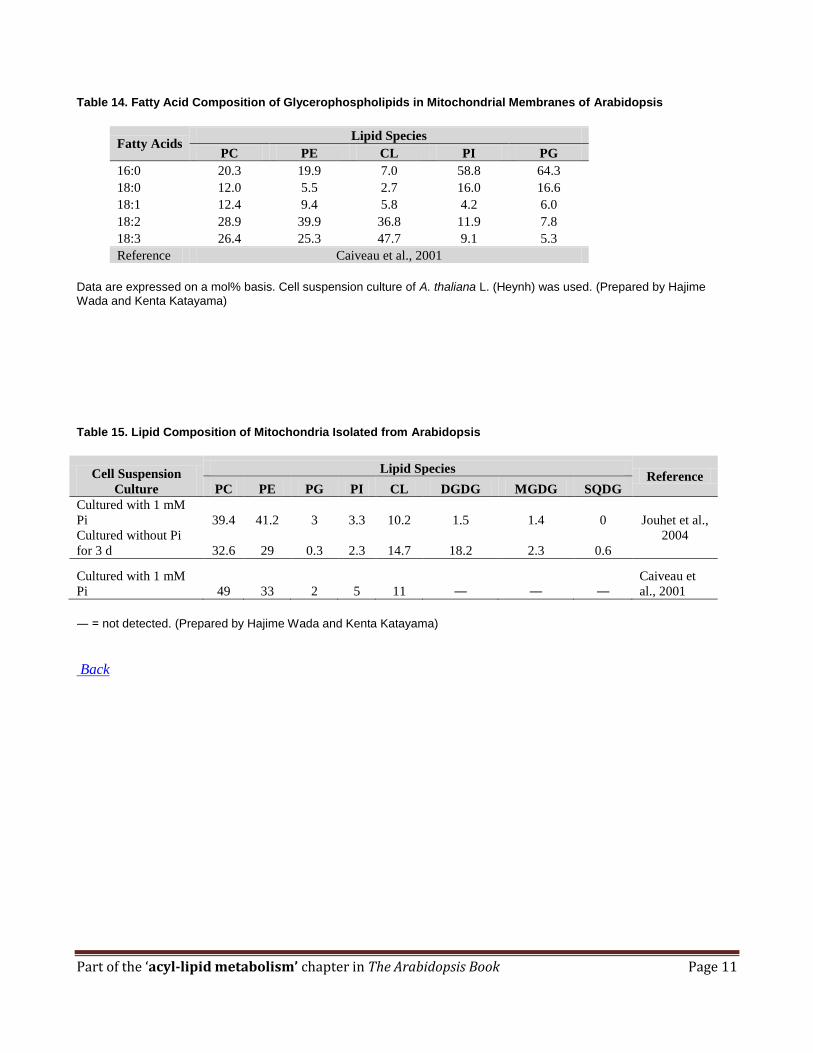
Table 14. Fatty Acid Composition of Glycerophospholipids in Mitochondrial Membranes of Arabidopsis
Fatty Acids Lipid Species
PC PE CL PI PG
16:0 20.3 19.9 7.0 58.8 64.3
18:0 12.0 5.5 2.7 16.0 16.6
18:1 12.4 9.4 5.8 4.2 6.0
18:2 28.9 39.9 36.8 11.9 7.8
18:3 26.4 25.3 47.7 9.1 5.3
Reference Caiveau et al., 2001
Data are expressed on a mol% basis. Cell suspension culture of A. thaliana L. (Heynh) was used. (Prepared by Hajime
Wada and Kenta Katayama)
Table 15. Lipid Composition of Mitochondria Isolated from Arabidopsis
Cell Suspension
Culture
Lipid Species Reference
PC PE PG PI CL DGDG MGDG SQDG
Cultured with 1 mM
Pi 39.4 41.2 3 3.3 10.2 1.5 1.4 0 Jouhet et al.,
2004 Cultured without Pi
for 3 d 32.6 29 0.3 2.3 14.7 18.2 2.3 0.6
Cultured with 1 mM
Pi 49 33 2 5 11 ― ― ―
Caiveau et
al., 2001
― = not detected. (Prepared by Hajime Wada and Kenta Katayama)
Back

Part of the ‘acyl-lipid metabolism’ chapter in The Arabidopsis Book Page 12
Table 16. Acyl-CoA Composition of Arabidopsis Leaf Tissues
Acyl-CoAs Content (fmol/mgFW)
2:0 488.31 ± 30.10
14:0 34.66 ± 1.94
16:0 292.72 ± 9.18
16:1 14.48 ± 1.08
18:0 45.79 ± 2.15
18:1 10.99 ± 3.17
18:2 119.97 ± 7.72
18:3 85.06 ± 3.71
20:0 54.15 ± 1.97
Reference Kannangara et al., 2007
Data are represented as mean ± SE (n = 3). (Prepared by Yonghua Li-Beisson)
Back
Table 17. Sphingolipid Composition of Arabidopsis Tissues
The sphingolipid content of Arabidopsis varies based on the method used to determine composition and the tissue from which the sphingolipids are extracted. Data are provided for the two main methods of analysis, hydrolysis and measurement of the long-chain base (LCB) component and liquid chromatography tandem mass spectrometry (LC-MS/MS) of the intact sphingolipids. All data are from Arabidopsis leaf tissue at 5–6 weeks of age. (Prepared by Jonathan E. Markham) Table 17.1. Sphingolipid Composition Determined by LCB Analysis t18:1(8Z) t18:1(8E) t18:0 d18:1(8Z) d18:1(8E) d18:0 TOTAL
Total tissue 59.8 ± 2.9
22.8%
170.5 ± 9.0
65.1%
13.5 ± 0.9
5.2%
2.1 ± 0.3
0.8%
14.7 ± 1.9
5.6%
1.4 ± 0.2
0.5%
262.0 ± 14.3
100%
Neutral sphingolipids 13.0 ± 2.2
39.9%
8.2 ± 1.3
25%
0.8 ± 0.2
0.1%
1.5 ± 0.2
4.5%
8.6 ± 1.2
26.6%
0.3 ± 0.0
0.9%
32.6 ± 4.5
12.4%
Anionic sphingolipids 7.3 ± 2.1
8.7%
67.0 ± 19.3
80.4%
4.8 ± 0.9
5.9%
0.1 ± 0.0
0.1%
2.9 ± 0.4
3.6%
1.1 ± 0.4
1.3%
83.2 ± 23.0
31.8%
Ceramide 0.04
2.9%
0.68
49.3%
0.66
47.7%
0
0%
0
0%
0
0%
1.37
0.5%
Glucosylceramide 10.9
40.9%
8.8
32.9%
0.3
1.1%
0.5
2.0%
6.1
22.7%
0.1
0.4%
26.7
10.2%
GIPC 3.6
7.3%
36.5
72.8%
7.4
14.7%
0
0%
1.3
2.5%
1.3
2.7%
50.1
19.1%
Reference Markham et al., 2006
Sphingolipid composition of Arabidopsis determined by hydrolysis and analysis of LCBs as o-phthaldialdehyde derivatives as described in Section I (Markham et al., 2006). Table is given for Total tissue, the relative proportion of neutral and anioic
sphingolipid, and individually purified compounds. Quantities are in nmol g fw–1
(n = 5; SD). GIPC = glycosylinositolphosphoryl-ceramide.
Back
Part of the ‘acyl-lipid metabolism’ chapter in The Arabidopsis Book Page 13
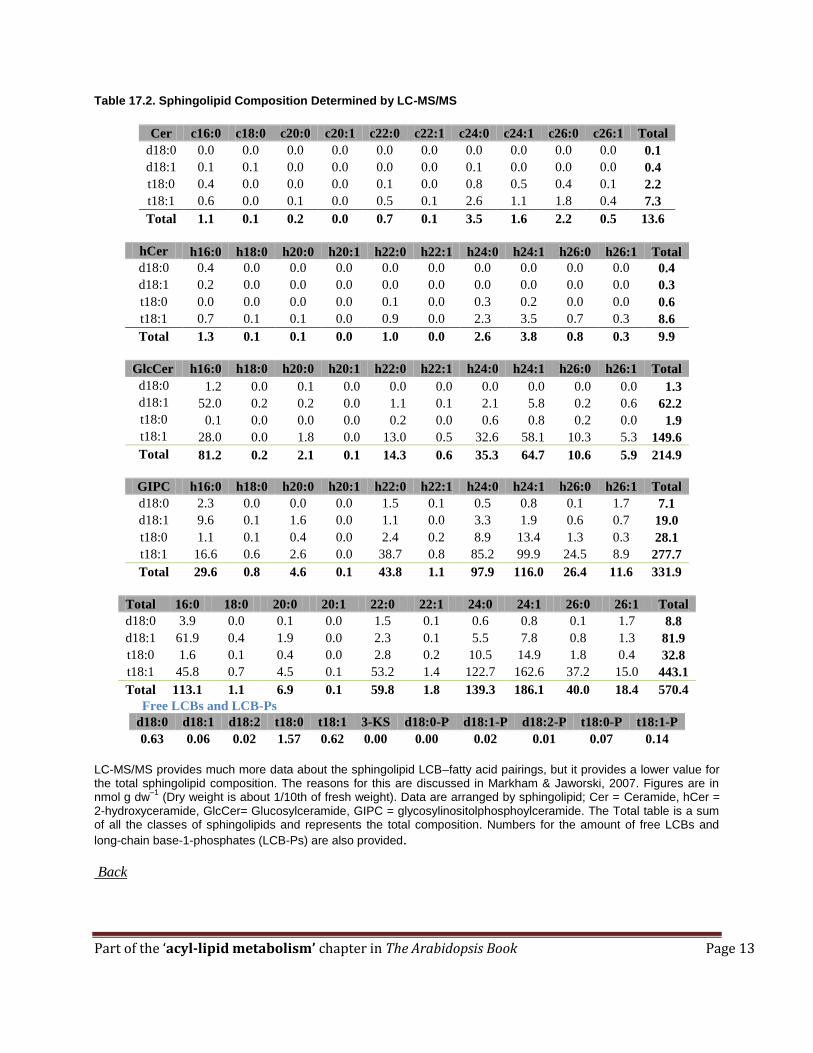
Table 17.2. Sphingolipid Composition Determined by LC-MS/MS
Cer c16:0 c18:0 c20:0 c20:1 c22:0 c22:1 c24:0 c24:1 c26:0 c26:1 Total
d18:0 0.0 0.0 0.0 0.0 0.0 0.0 0.0 0.0 0.0 0.0 0.1
d18:1 0.1 0.1 0.0 0.0 0.0 0.0 0.1 0.0 0.0 0.0 0.4
t18:0 0.4 0.0 0.0 0.0 0.1 0.0 0.8 0.5 0.4 0.1 2.2
t18:1 0.6 0.0 0.1 0.0 0.5 0.1 2.6 1.1 1.8 0.4 7.3
Total 1.1 0.1 0.2 0.0 0.7 0.1 3.5 1.6 2.2 0.5 13.6
hCer h16:0 h18:0 h20:0 h20:1 h22:0 h22:1 h24:0 h24:1 h26:0 h26:1 Total
d18:0 0.4 0.0 0.0 0.0 0.0 0.0 0.0 0.0 0.0 0.0 0.4
d18:1 0.2 0.0 0.0 0.0 0.0 0.0 0.0 0.0 0.0 0.0 0.3
t18:0 0.0 0.0 0.0 0.0 0.1 0.0 0.3 0.2 0.0 0.0 0.6
t18:1 0.7 0.1 0.1 0.0 0.9 0.0 2.3 3.5 0.7 0.3 8.6
Total 1.3 0.1 0.1 0.0 1.0 0.0 2.6 3.8 0.8 0.3 9.9
GlcCer h16:0 h18:0 h20:0 h20:1 h22:0 h22:1 h24:0 h24:1 h26:0 h26:1 Total
d18:0 1.2 0.0 0.1 0.0 0.0 0.0 0.0 0.0 0.0 0.0 1.3
d18:1 52.0 0.2 0.2 0.0 1.1 0.1 2.1 5.8 0.2 0.6 62.2
t18:0 0.1 0.0 0.0 0.0 0.2 0.0 0.6 0.8 0.2 0.0 1.9
t18:1 28.0 0.0 1.8 0.0 13.0 0.5 32.6 58.1 10.3 5.3 149.6
Total 81.2 0.2 2.1 0.1 14.3 0.6 35.3 64.7 10.6 5.9 214.9
GIPC h16:0 h18:0 h20:0 h20:1 h22:0 h22:1 h24:0 h24:1 h26:0 h26:1 Total
d18:0 2.3 0.0 0.0 0.0 1.5 0.1 0.5 0.8 0.1 1.7 7.1
d18:1 9.6 0.1 1.6 0.0 1.1 0.0 3.3 1.9 0.6 0.7 19.0
t18:0 1.1 0.1 0.4 0.0 2.4 0.2 8.9 13.4 1.3 0.3 28.1
t18:1 16.6 0.6 2.6 0.0 38.7 0.8 85.2 99.9 24.5 8.9 277.7
Total 29.6 0.8 4.6 0.1 43.8 1.1 97.9 116.0 26.4 11.6 331.9
Total 16:0 18:0 20:0 20:1 22:0 22:1 24:0 24:1 26:0 26:1 Total
d18:0 3.9 0.0 0.1 0.0 1.5 0.1 0.6 0.8 0.1 1.7 8.8
d18:1 61.9 0.4 1.9 0.0 2.3 0.1 5.5 7.8 0.8 1.3 81.9
t18:0 1.6 0.1 0.4 0.0 2.8 0.2 10.5 14.9 1.8 0.4 32.8
t18:1 45.8 0.7 4.5 0.1 53.2 1.4 122.7 162.6 37.2 15.0 443.1
Total 113.1 1.1 6.9 0.1 59.8 1.8 139.3 186.1 40.0 18.4 570.4
Free LCBs and LCB-Ps
d18:0 d18:1 d18:2 t18:0 t18:1 3-KS d18:0-P d18:1-P d18:2-P t18:0-P t18:1-P
0.63 0.06 0.02 1.57 0.62 0.00 0.00 0.02 0.01 0.07 0.14
LC-MS/MS provides much more data about the sphingolipid LCB–fatty acid pairings, but it provides a lower value for the total sphingolipid composition. The reasons for this are discussed in Markham & Jaworski, 2007. Figures are in nmol g dw
–1 (Dry weight is about 1/10th of fresh weight). Data are arranged by sphingolipid; Cer = Ceramide, hCer =
2-hydroxyceramide, GlcCer= Glucosylceramide, GIPC = glycosylinositolphosphoylceramide. The Total table is a sum of all the classes of sphingolipids and represents the total composition. Numbers for the amount of free LCBs and
long-chain base-1-phosphates (LCB-Ps) are also provided.
Back

Part of the ‘acyl-lipid metabolism’ chapter in The Arabidopsis Book Page 14
Table 18. Stereospecific Analysis of Arabidopsis Seed Triacylglycerols
Table 18.1. Occurrence of Fatty Acids at Each sn-Position
16:0 18:0 18:1Δ9 18:1Δ11 18:2 18:3 20:0 20:1 20:2 22:0 22:1
TAG 8.3 3.4 15 1.2 28.6 18.5 2.1 19.8 1.2 0.3 1.6
sn-1 11.2 3.6 12.8 1.7 23.3 16.4 2.4 21.7 3.5 0.4 2.7
sn-2 6.4 3.6 17.4 0.9 44.3 22 0.9 3.3 0.5 0.4 0.4
sn-3 18.2 9.8 13.9 1 6 4.8 6.3 34.3 1.5 1.3 2.8
Table 18.2. Occurrence of Each Fatty Acid Across All Three sn-Positions
16:0 18:0 18:1Δ9 18:1Δ11 18:2 18:3 20:0 20:1 20:2 22:0 22:1
sn-1 31.4 21.4 29.1 47.3 31.7 38.0 25.1 36.6 64.3 19.9 46.2
sn-2 17.8 20.9 39.4 24.4 60.1 50.8 9.4 5.6 8.3 19.4 7.0
sn-3 50.9 57.8 31.6 28.2 8.2 11.1 65.5 57.8 27.4 60.6 46.8
TAGs were isolated from mature A. thaliana (L.) Heynh. Columbia wild type seed and subjected to a Grignard-based
stereospecific analysis. Table 18.1 shows the occurrence of all fatty acids at each sn-position. Table 18.2 shows the
occurrence of each fatty acid across all three sn-positions. Values represent mol% of the total. (Prepared by Timothy
P. Durrette; data from Taylor et al., 1995).
Back

Part of the ‘acyl-lipid metabolism’ chapter in The Arabidopsis Book Page 15
Carbohydrates59%
Protein19%
Minerals9,0%
Other7,0%
Chlorophyll1,5%
Sphingolipids0,2%
Glycerolipids3,2%
Wax0,2%
Cutin Monomers0,3%
Lipid6.1%
-------Other - 0.7%Plastoquinone CarotenoidsTocopherols Sterols
Distribution of lipids(as percent of total by weight)
Arabidopsis Leaf: Distribution of Dry Weight
(as percent of total)Dry Weight approx. 8% of fresh weight
Figure 21. Relative Distribution of Lipids and Other Components of Arabidopsis Leaf.
Data adapted from Browse and Somerville (1994). (Prepared by John Ohlrogge)
Part of the ‘acyl-lipid metabolism’ chapter in The Arabidopsis Book Page 16
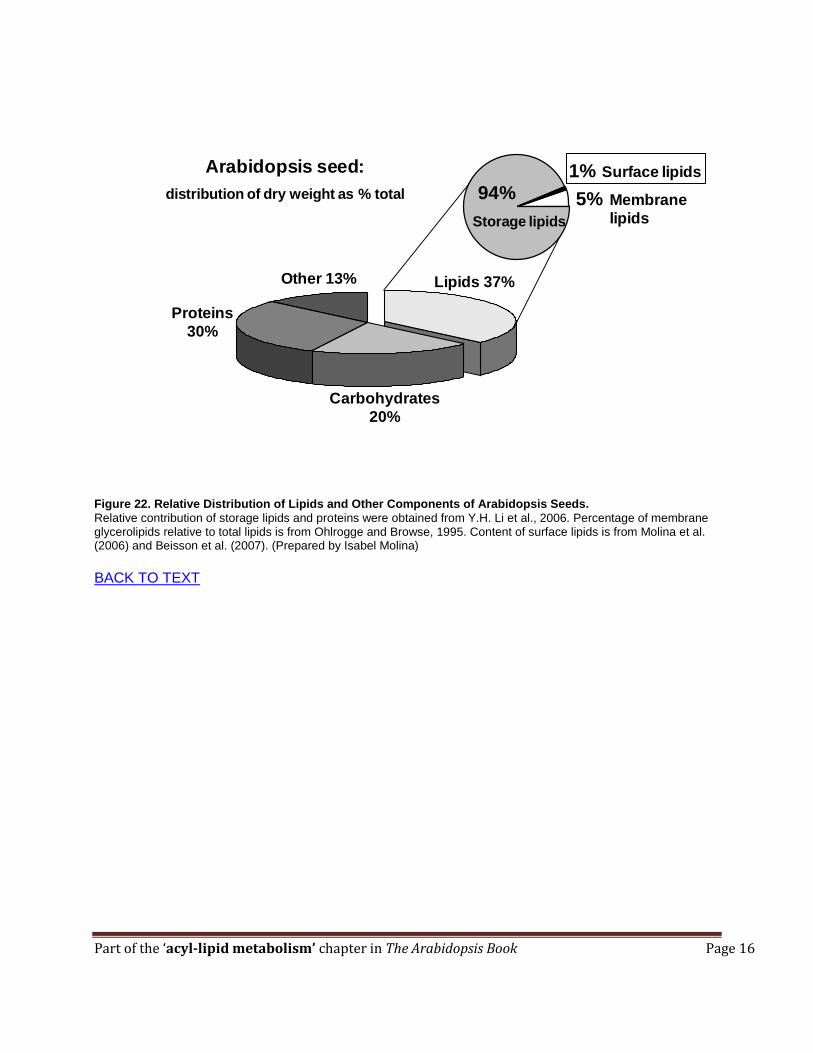
Other 13%
Proteins
30%
Lipids 37%
1%94% 5%
Surface lipids
Membrane
lipidsStorage lipids
Carbohydrates
20%
Arabidopsis seed:
distribution of dry weight as % total
Figure 22. Relative Distribution of Lipids and Other Components of Arabidopsis Seeds.
Relative contribution of storage lipids and proteins were obtained from Y.H. Li et al., 2006. Percentage of membrane glycerolipids relative to total lipids is from Ohlrogge and Browse, 1995. Content of surface lipids is from Molina et al. (2006) and Beisson et al. (2007). (Prepared by Isabel Molina)
BACK TO TEXT

Part of the ‘acyl-lipid metabolism’ chapter in The Arabidopsis Book Page 17
89% of total
polyesters
Suberin-like
monomers
Cutin-like
monomers
Wax: 1.3 ng/seed
Total polyester
load: 46 ng/seedMature seed11% of total polyesters
(cutin-like monomers)
Surface Lipid Distribution
cuticle
oi
iiE
In Seed Coat
89% of total
polyesters
Suberin-like
monomers
Cutin-like
monomers
Wax: 1.3 ng/seed
Total polyester
load: 46 ng/seedMature seed11% of total polyesters
(cutin-like monomers)
Surface Lipid Distribution
89% of total
polyesters
Suberin-like
monomers
Cutin-like
monomers
Wax: 1.3 ng/seed
Total polyester
load: 46 ng/seedMature seed11% of total polyesters
(cutin-like monomers)
Surface Lipid Distribution
cuticle
oi
iiE
In Seed Coat
Figure 23. Distribution of Extracellular Lipids in Mature Seeds.
Values of total polyester monomers and distribution between seed coat and embryo (inferred from B. napus data) are from Molina et al. (2006). Distribution of polyester monomers in inner integument (ii) and outer integument (oi) summarize results from Molina et al. (2008). Surface wax load was reported by Beisson et al. (2007). (Prepared by Isabel Molina)