3q16 earnings release - página inicial · price/earnings 12 months price/book ... includes the...
TRANSCRIPT

3Q16 Earnings
Release
2
Disclaimer
This presentation may include references and statements, planned synergies,
estimates, projections of results, and future strategy for Banco do Brasil, its
Associated and Affiliated Companies, and Subsidiaries. Although these references
and statements reflect the management’s belief, they also involve estimates and
unforeseen risks. Consequently, results may differ from those anticipated and
discussed here. These expectations are highly dependent on market conditions, on
Brazil’s economic and banking system performances, as well as on international
market conditions. Banco do Brasil is not responsible for updating any estimate in
this presentation.
Banco do Brasil S.A. – Third Quarter 2016 Earnings

Highlights (9M16/9M15)
NII Grew by 15.0%
3 Banco do Brasil S.A. – Third Quarter 2016 Earnings
Pre-Tax and Pre-
Provision
Earnings Increased by 9.8%
Administrative
Expenses
Fee Income
Cost to Income
Ratio
7.0% Growth
Under control (4.2% growth)
Improved to 39.4%
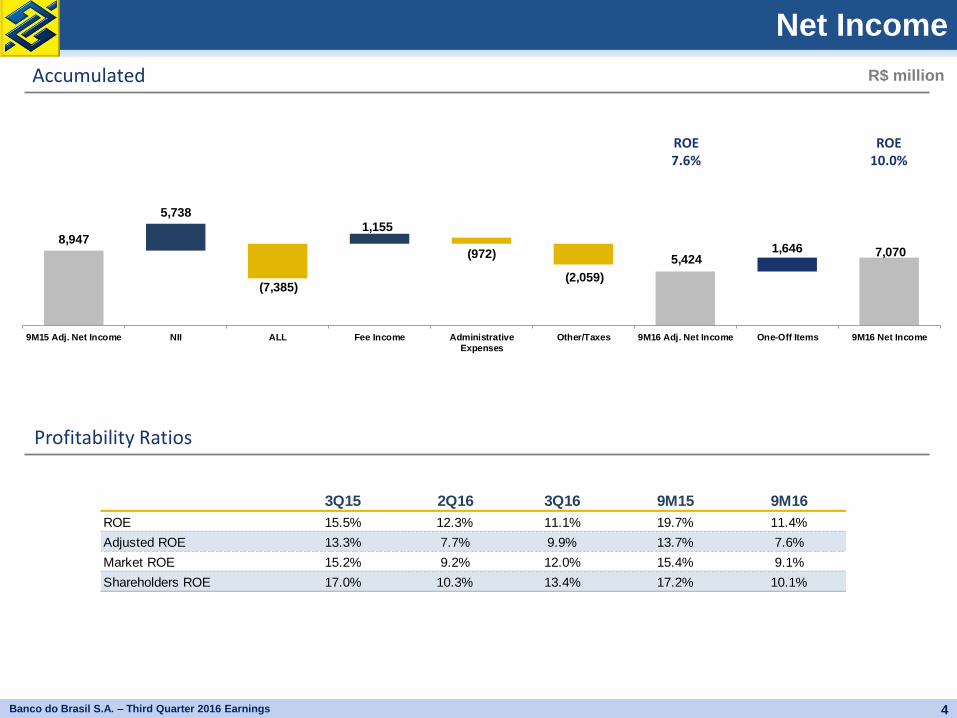
Net Income
R$ million Accumulated
4 Banco do Brasil S.A. – Third Quarter 2016 Earnings
Profitability Ratios
ROE 7.6%
ROE 10.0%
(7,385)
(972) 5,4247,070
8,947
5,7381,155
(2,059)
1,646
9M15 Adj. Net Income NII ALL Fee Income AdministrativeExpenses
Other/Taxes 9M16 Adj. Net Income One-Off Items 9M16 Net Income
3Q15 2Q16 3Q16 9M15 9M16
ROE 15.5% 12.3% 11.1% 19.7% 11.4%
Adjusted ROE 13.3% 7.7% 9.9% 13.7% 7.6%
Market ROE 15.2% 9.2% 12.0% 15.4% 9.1%
Shareholders ROE 17.0% 10.3% 13.4% 17.2% 10.1%
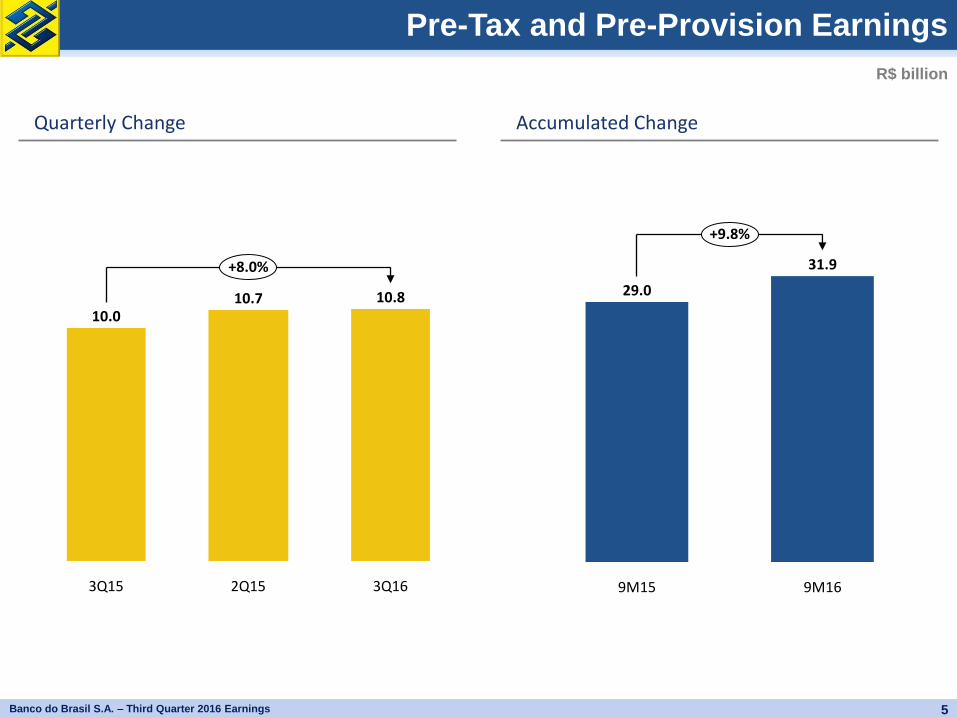
Pre-Tax and Pre-Provision Earnings
5 Banco do Brasil S.A. – Third Quarter 2016 Earnings
+9.8%
9M16
31.9
9M15
29.0
R$ billion
Quarterly Change Accumulated Change
+8.0%
3Q16
10.8
2Q15
10.7
3Q15
10.0
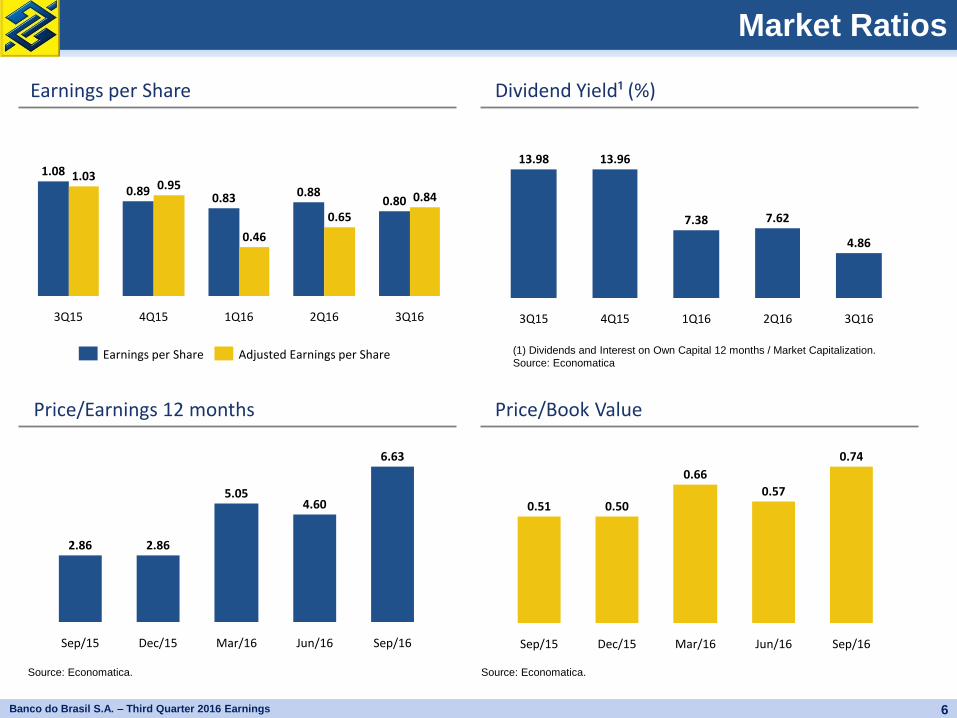
Market Ratios
(1) Dividends and Interest on Own Capital 12 months / Market Capitalization.
Source: Economatica
3Q16
0.84 0.80
2Q16
0.65
0.88
1Q16
0.46
0.83
4Q15
0.95 0.89
3Q15
1.03 1.08
Adjusted Earnings per Share Earnings per Share
Sep/16
6.63
Jun/16
4.60
Mar/16
5.05
Dec/15
2.86
Sep/15
2.86
Sep/16
0.74
Jun/16
0.57
Mar/16
0.66
Dec/15
0.50
Sep/15
0.51
3Q16
4.86
2Q16
7.62
1Q16
7.38
4Q15
13.96
3Q15
13.98
Source: Economatica. Source: Economatica.
Dividend Yield¹ (%) Earnings per Share
Price/Book Value Price/Earnings 12 months
6 Banco do Brasil S.A. – Third Quarter 2016 Earnings
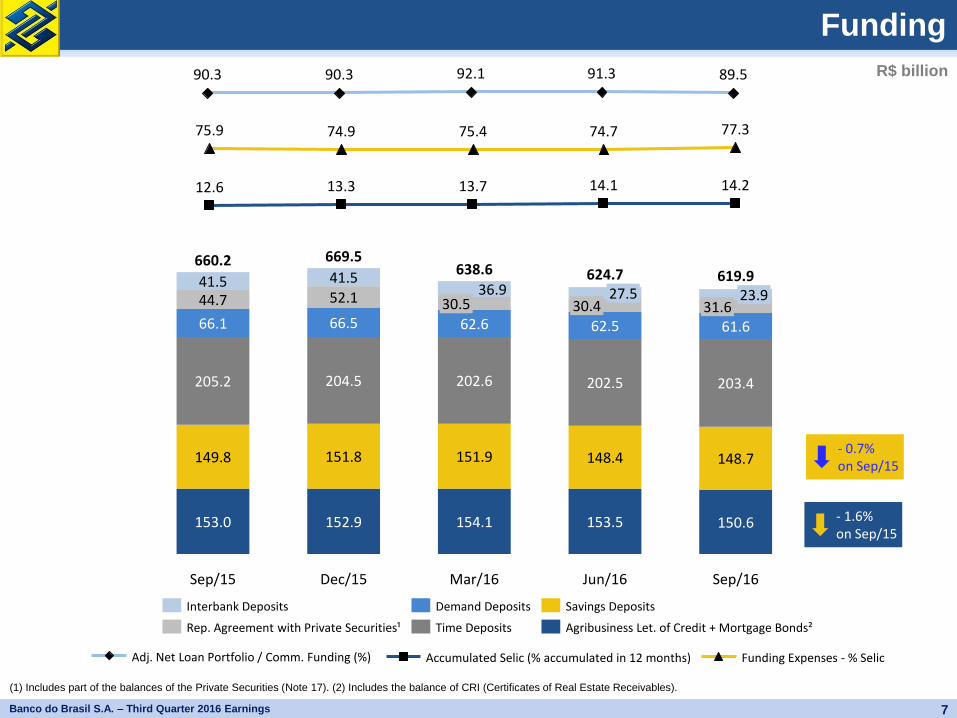
Sep/16
619.9
150.6
148.7
203.4
61.6 31.6
23.9
Jun/16
624.7
153.5
148.4
202.5
62.5 30.4
27.5
Mar/16
638.6
154.1
151.9
202.6
62.6
30.5 36.9
Dec/15
669.5
152.9
151.8
204.5
66.5
52.1 41.5
Sep/15
660.2
153.0
149.8
205.2
66.1
44.7 41.5
Agribusiness Let. of Credit + Mortgage Bonds²
Savings Deposits
Time Deposits
Demand Deposits
Rep. Agreement with Private Securities¹
Interbank Deposits
89.5 91.3 92.1 90.3 90.3
Funding
R$ billion
Adj. Net Loan Portfolio / Comm. Funding (%)
- 1.6% on Sep/15
7 Banco do Brasil S.A. – Third Quarter 2016 Earnings
- 0.7% on Sep/15
77.3
14.2
74.7
14.1
75.4
13.7
74.9
13.3
75.9
12.6
Funding Expenses - % Selic Accumulated Selic (% accumulated in 12 months)
(1) Includes part of the balances of the Private Securities (Note 17). (2) Includes the balance of CRI (Certificates of Real Estate Receivables).
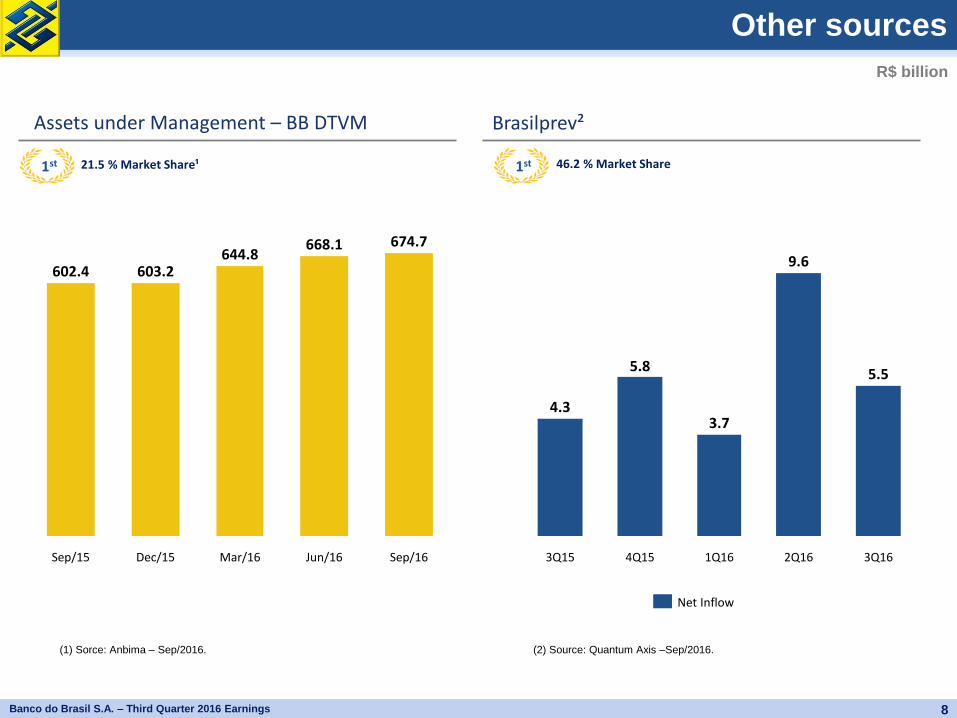
Other sources
R$ billion
Assets under Management – BB DTVM Brasilprev²
21.5 % Market Share¹
(1) Sorce: Anbima – Sep/2016.
8 Banco do Brasil S.A. – Third Quarter 2016 Earnings
Sep/16
674.7
Jun/16
668.1
Mar/16
644.8
Dec/15
603.2
Sep/15
602.4
46.2 % Market Share
(2) Source: Quantum Axis –Sep/2016.
3Q16
5.5
2Q16
9.6
1Q16
3.7
4Q15
5.8
3Q15
4.3
Net Inflow
1st 1st
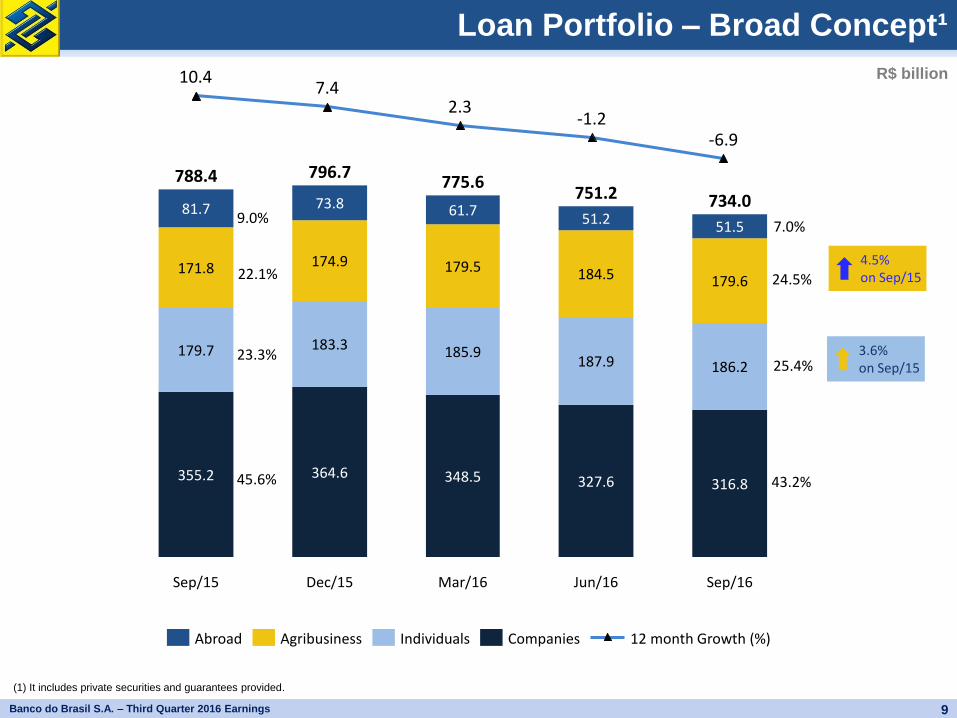
Loan Portfolio – Broad Concept¹
R$ billion
9 Banco do Brasil S.A. – Third Quarter 2016 Earnings
Sep/16
734.0
316.8
186.2
179.6
51.5
Jun/16
751.2
327.6
187.9
184.5
51.2
Mar/16
775.6
348.5
185.9
179.5
61.7
Dec/15
796.7
364.6
183.3
174.9
73.8
Sep/15
788.4
355.2
179.7
171.8
81.7
Companies Individuals Agribusiness Abroad
-6.9 -1.2
2.3 7.4
10.4
12 month Growth (%)
9.0%
22.1%
23.3%
45.6%
7.0%
24.5%
25.4%
43.2%
3.6% on Sep/15
4.5% on Sep/15
(1) It includes private securities and guarantees provided.
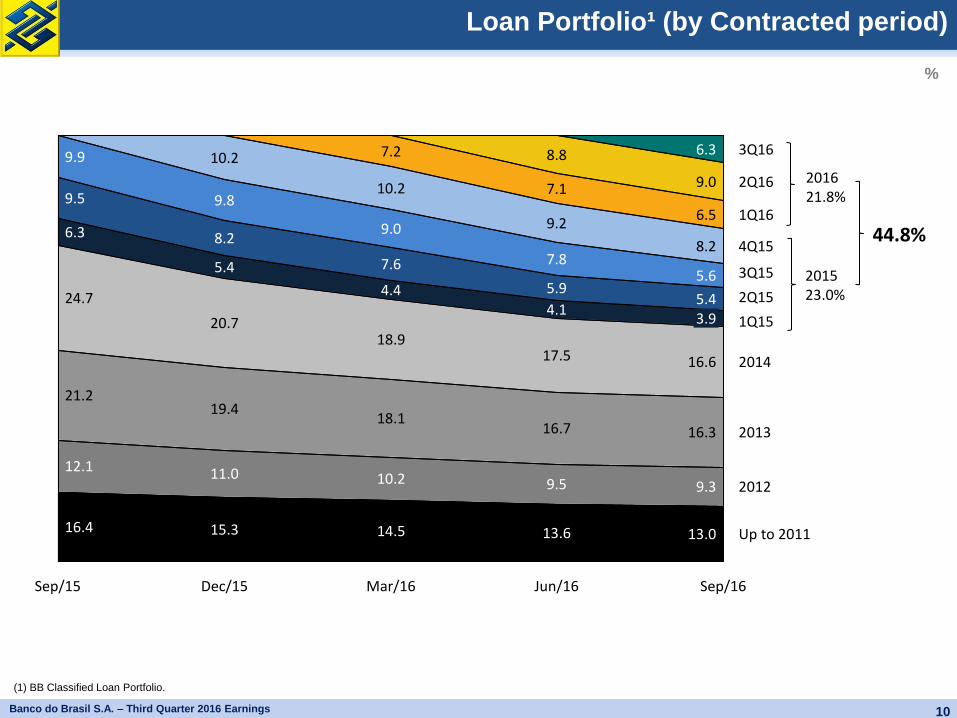
Loan Portfolio¹ (by Contracted period)
%
10 Banco do Brasil S.A. – Third Quarter 2016 Earnings
13.6
2013
21.2
16.7
16.4 Up to 2011
12.1
2012 9.5
15.3
11.0
19.4
14.5
10.2
18.1
13.0
9.3
16.3
1Q15
4Q15
1Q16
3Q15
2Q15
2014
2Q16
3Q16
Sep/16
16.6
3.9 5.4
5.6
8.2
6.5
9.0
6.3
Jun/16
17.5
4.1
5.9
7.8
9.2
7.1
8.8
Mar/16
18.9
4.4
7.6
9.0
10.2
7.2
Dec/15
20.7
5.4
8.2
9.8
10.2
Sep/15
24.7
6.3
9.5
9.9
2016 21.8%
2015 23.0%
44.8%
(1) BB Classified Loan Portfolio.
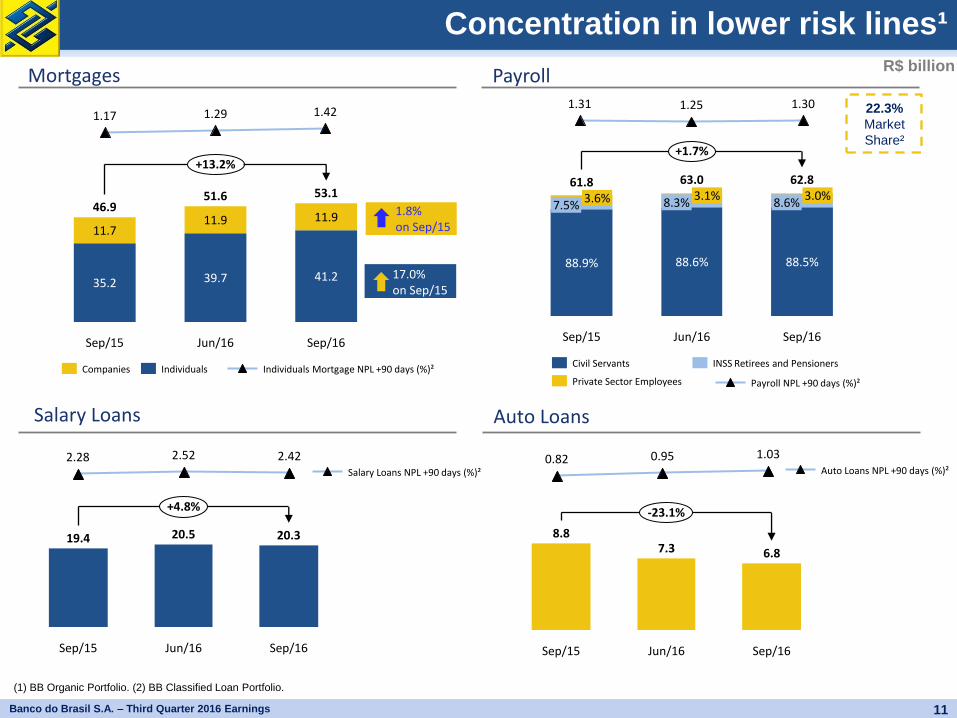
Concentration in lower risk lines¹ R$ billion
(1) BB Organic Portfolio. (2) BB Classified Loan Portfolio.
Auto Loans
Payroll
+1.7%
Sep/16
62.8
8.6% 3.0%
88.5%
Jun/16
63.0
8.3% 3.1%
88.6%
Sep/15
61.8
7.5% 3.6%
88.9%
22.3%
Market
Share²
Salary Loans
Mortgages
+13.2%
Sep/16
53.1
41.2
11.9
Jun/16
51.6
39.7
11.9
Sep/15
46.9
35.2
11.7
Individuals Companies
+4.8%
Sep/16
20.3
Jun/16
20.5
Sep/15
19.4
INSS Retirees and Pensioners
Private Sector Employees
Civil Servants
-23.1%
Sep/16
6.8
Jun/16
7.3
Sep/15
8.8
1.30 1.25 1.31
Payroll NPL +90 days (%)²
2.42 2.52 2.28 Salary Loans NPL +90 days (%)²
1.03 0.95 0.82 Auto Loans NPL +90 days (%)²
1.42 1.29 1.17
Individuals Mortgage NPL +90 days (%)²
11 Banco do Brasil S.A. – Third Quarter 2016 Earnings
1.8% on Sep/15
17.0% on Sep/15
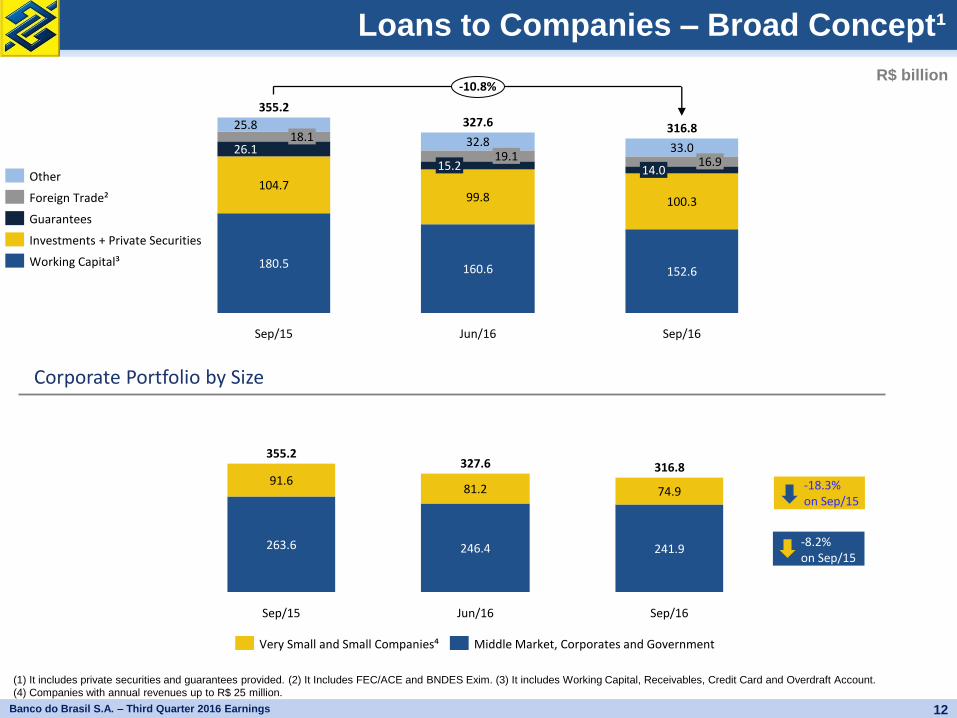
Loans to Companies – Broad Concept¹
R$ billion
99.8
15.2 19.1
32.8
Sep/15
355.2
180.5
104.7
26.1 18.1
25.8
-10.8%
Sep/16
316.8
152.6
100.3
14.0 16.9
33.0
Jun/16
327.6
160.6 Working Capital³
Investments + Private Securities
Guarantees
Foreign Trade²
Other
Corporate Portfolio by Size
241.9
74.9
Jun/16
327.6
246.4
81.2
Sep/15
355.2
263.6
91.6
Sep/16
316.8
Middle Market, Corporates and Government Very Small and Small Companies⁴
12 Banco do Brasil S.A. – Third Quarter 2016 Earnings
-18.3% on Sep/15
-8.2% on Sep/15
(1) It includes private securities and guarantees provided. (2) It Includes FEC/ACE and BNDES Exim. (3) It includes Working Capital, Receivables, Credit Card and Overdraft Account.
(4) Companies with annual revenues up to R$ 25 million.
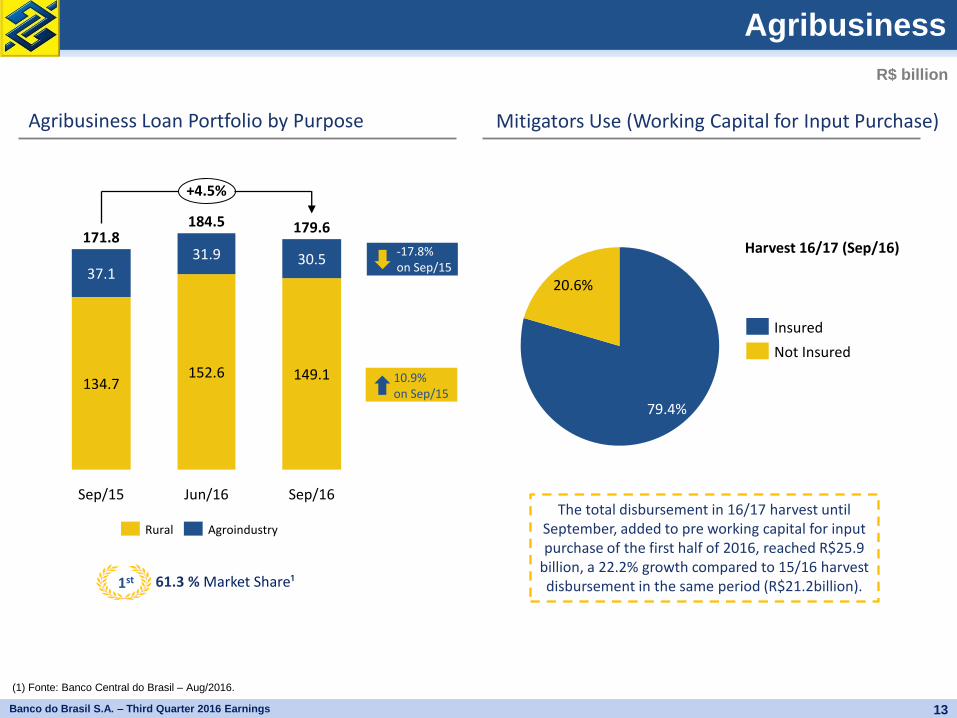
Agribusiness
(1) Fonte: Banco Central do Brasil – Aug/2016.
R$ billion
Harvest 16/17 (Sep/16)
+4.5%
Sep/16
179.6
30.5
149.1
Jun/16
184.5
31.9
152.6
Sep/15
171.8
37.1
134.7
Agroindustry Rural
Agribusiness Loan Portfolio by Purpose Mitigators Use (Working Capital for Input Purchase)
13 Banco do Brasil S.A. – Third Quarter 2016 Earnings
-17.8% on Sep/15
10.9% on Sep/15
20.6%
79.4%
Not Insured
Insured
61.3 % Market Share¹
The total disbursement in 16/17 harvest until September, added to pre working capital for input purchase of the first half of 2016, reached R$25.9
billion, a 22.2% growth compared to 15/16 harvest disbursement in the same period (R$21.2billion). 1st
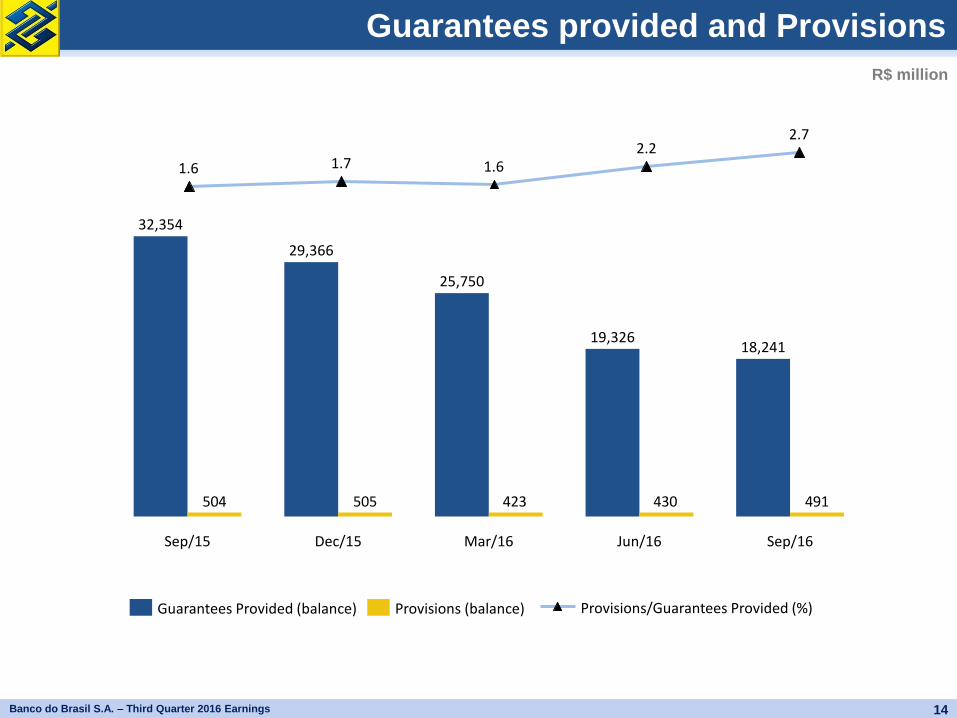
Guarantees provided and Provisions
14
2.7 2.2
1.6 1.7 1.6
Provisions/Guarantees Provided (%)
R$ million
491430423505504
Sep/16
18,241
Dec/15 Jun/16
19,326
Mar/16
25,750
29,366
Sep/15
32,354
Guarantees Provided (balance) Provisions (balance)
Banco do Brasil S.A. – Third Quarter 2016 Earnings
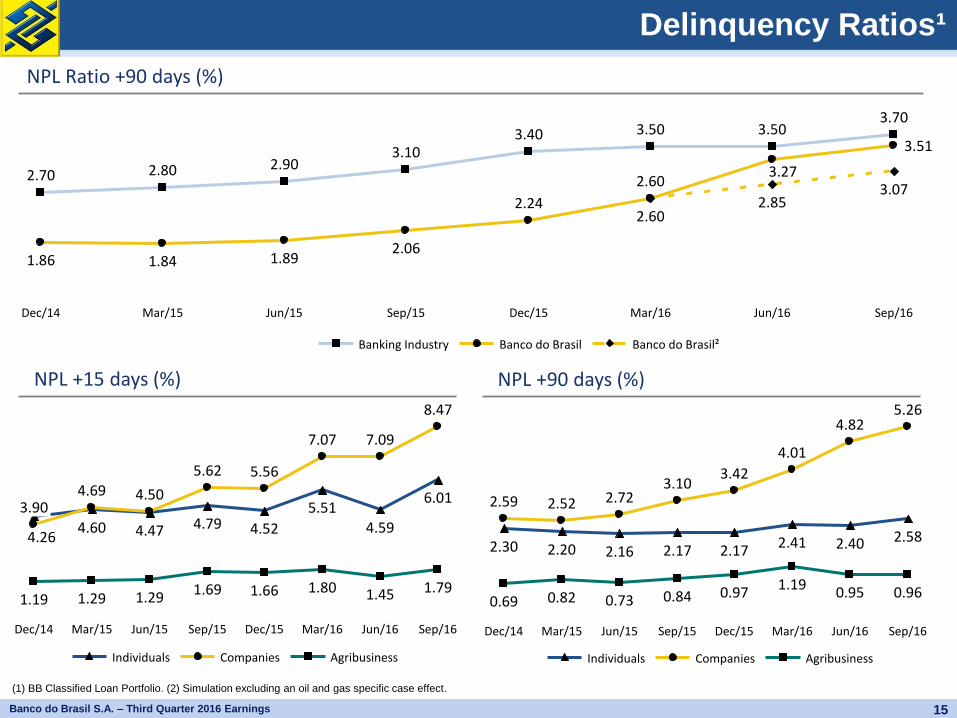
Delinquency Ratios¹
(1) BB Classified Loan Portfolio. (2) Simulation excluding an oil and gas specific case effect.
Sep/16
0.96
5.26
2.58
Jun/16
0.95
4.82
2.40
Mar/16
1.19
4.01
2.41
Dec/15
0.97
3.42
2.17
Sep/15
0.84
3.10
2.17
Jun/15
0.73
2.72
2.16
Mar/15
0.82
2.52
2.20
Dec/14
0.69
2.59
2.30
Sep/16
3.07
3.51
3.70
Jun/16
2.85
3.27
3.50
Mar/16
2.60
2.60
3.50
Dec/15
2.24
3.40
Sep/15
2.06
3.10
Jun/15
1.89
2.90
Mar/15
1.84
2.80
Dec/14
1.86
2.70
Banco do Brasil² Banco do Brasil Banking Industry
NPL +15 days (%) NPL +90 days (%)
Agribusiness Companies Individuals
15 Banco do Brasil S.A. – Third Quarter 2016 Earnings
Sep/16
1.79
8.47
6.01
Jun/16
1.45
7.09
4.59
Mar/16
1.80
7.07
5.51
Dec/15
1.66
5.56
4.52
5.62
4.79
Jun/15
1.29
4.50
4.47
Mar/15
1.29
4.69
4.60
Dec/14
1.19
3.90
4.26
1.69
Sep/15
Agribusiness Companies Individuals
NPL Ratio +90 days (%)
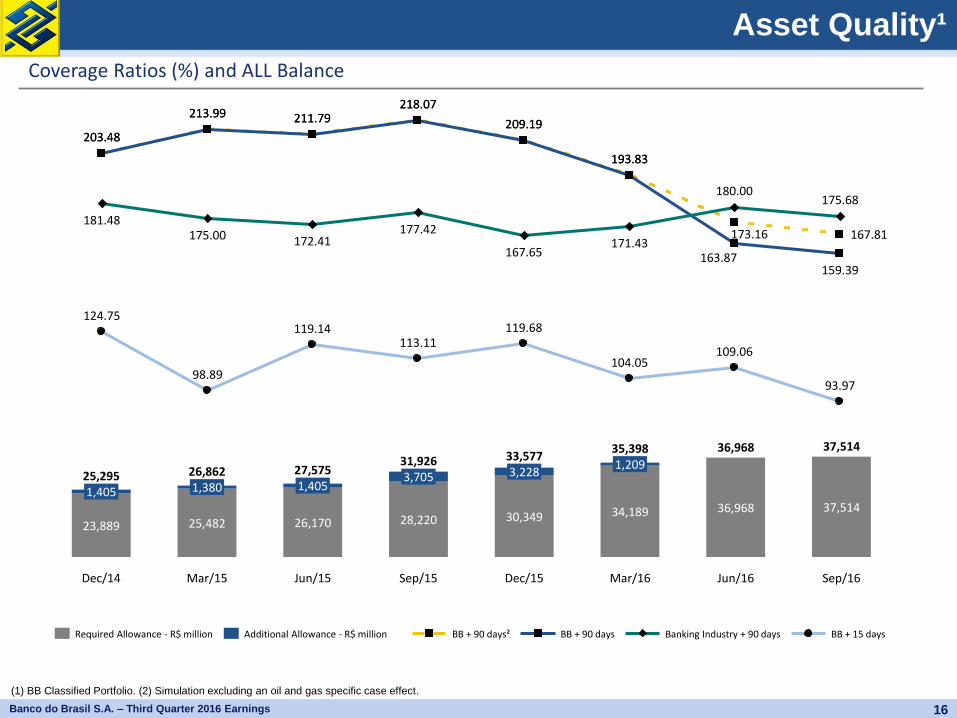
Asset Quality¹
93.97
175.68
159.39
167.81
109.06
180.00
163.87
173.16
104.05
171.43
193.83 193.83
119.68
167.65
209.19 209.19
177.42
218.07 218.07
119.14
172.41
211.79 211.79
98.89
175.00
213.99 213.99
124.75
181.48
203.48 203.48
113.11
BB + 15 days Banking Industry + 90 days BB + 90 days BB + 90 days²
Sep/16
37,514
37,514
Jun/16
36,968
36,968
Mar/16
35,398 1,209
34,189
Dec/15
33,577 3,228
30,349
Sep/15
31,926 3,705
28,220
Jun/15
27,575 1,405
26,170
Mar/15
26,862 1,380
25,482
Dec/14
25,295 1,405
23,889
Additional Allowance - R$ million Required Allowance - R$ million
Coverage Ratios (%) and ALL Balance
16 Banco do Brasil S.A. – Third Quarter 2016 Earnings
(1) BB Classified Portfolio. (2) Simulation excluding an oil and gas specific case effect.
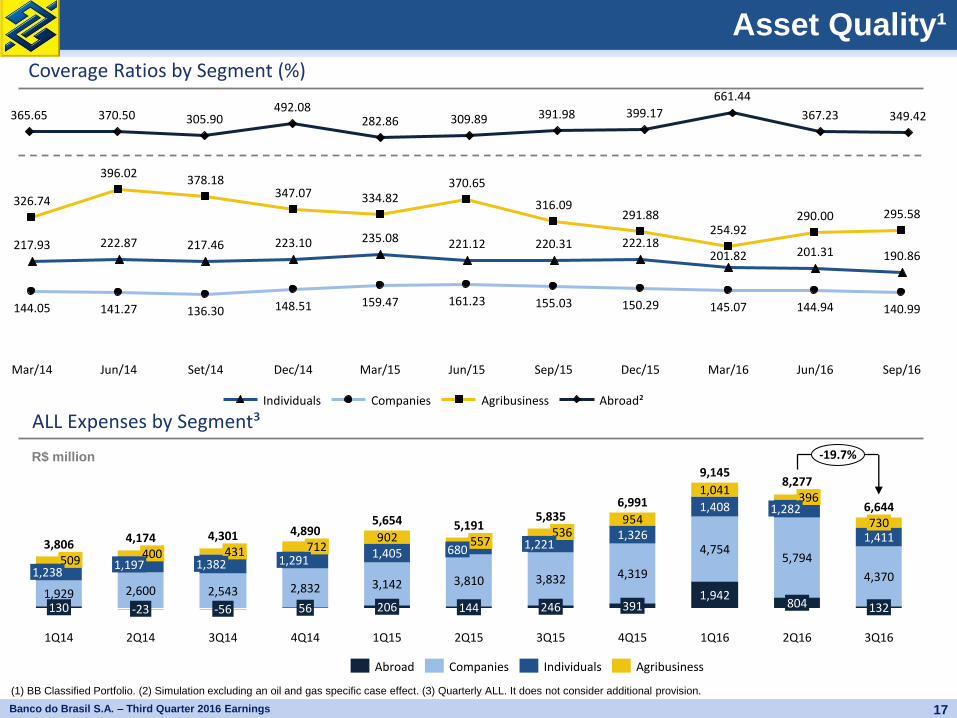
Asset Quality¹
954
902
3Q16
6,644 730
1,411
4,370
132
2Q16
8,277 396
1,282
5,794
804
1Q16
9,145
1,041
1,408
4,754
1,942
4Q15
6,991
1,326
4,319
391
3Q15
5,835 536
1,221
3,832
246
2Q15
5,191 557
680
3,810
144
1Q15
5,654
1,405
3,142
206
4Q14
4,890 712
1,291
2,832
56
3Q14
4,301 431
1,382
2,543
-56
-19.7%
2Q14
4,174 400
1,197
2,600
-23
1Q14
3,806 509
1,238
1,929 130
Abroad Agribusiness Individuals Companies
Coverage Ratios by Segment (%)
ALL Expenses by Segment³
17 Banco do Brasil S.A. – Third Quarter 2016 Earnings
R$ million
Sep/16
295.58
140.99
190.86
Jun/16
290.00
144.94
201.31
Mar/16
254.92
145.07
201.82
Dec/15
291.88
150.29
222.18
Sep/15
316.09
155.03
220.31
Jun/15
370.65
161.23
221.12
Mar/15
334.82
159.47
235.08
Dec/14
347.07
148.51
223.10
Set/14
378.18
136.30
217.46
Jun/14
396.02
141.27
222.87
Mar/14
326.74
144.05
217.93
Agribusiness Companies Individuals
349.42 367.23
661.44
399.17 391.98 309.89 282.86 492.08
305.90 370.50 365.65
Abroad²
(1) BB Classified Portfolio. (2) Simulation excluding an oil and gas specific case effect. (3) Quarterly ALL. It does not consider additional provision.
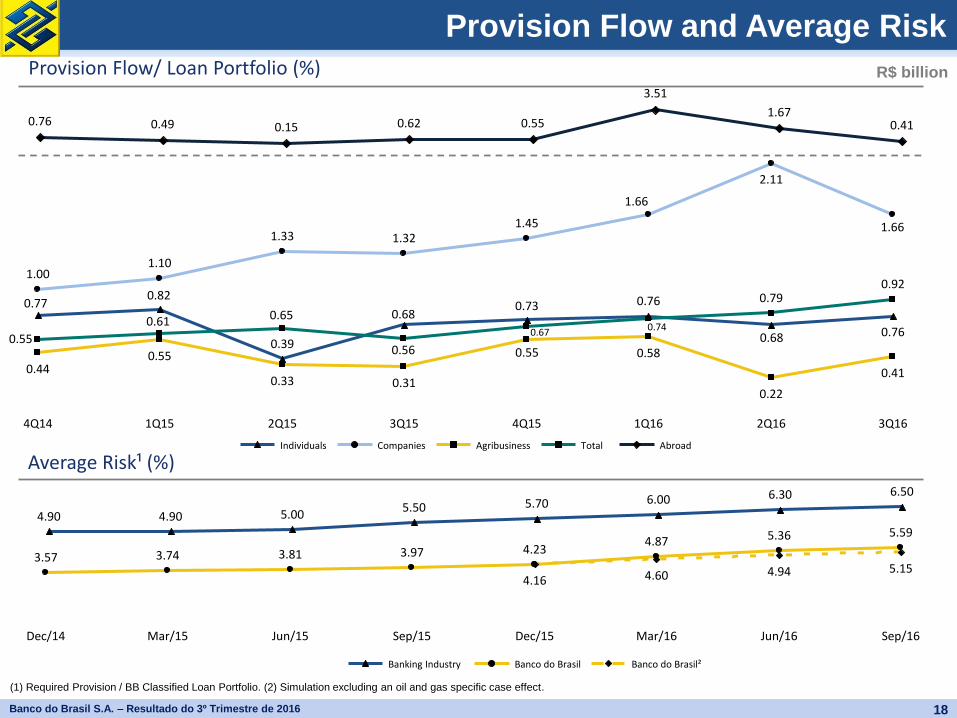
Provision Flow and Average Risk
18 Banco do Brasil S.A. – Resultado do 3º Trimestre de 2016
R$ billion
Sep/16
5.15
5.59
Jun/16
4.94
5.36
Mar/16
4.60
4.87
Dec/15
4.16
4.23
Sep/15
3.97
Jun/15
3.81
Mar/15
3.74
Dec/14
3.57
6.50 6.30 6.00 5.70 5.50 5.00 4.90 4.90
Banking Industry Banco do Brasil² Banco do Brasil
3Q16
0.92
0.41
1.66
0.76
2Q16
0.79
0.22
2.11
0.68
1Q16
0.74
0.58
1.66
0.76
4Q15
0.67
0.55
1.45
0.73
3Q15
0.56
0.31
1.32
0.68
2Q15
0.65
0.33
1.33
0.39
1Q15
0.61
0.55
1.10
0.82
4Q14
0.55
0.44
1.00
0.77
Total Agribusiness Companies Individuals
0.41 1.67
3.51
0.55 0.62 0.15 0.49 0.76
Abroad
Provision Flow/ Loan Portfolio (%)
Average Risk¹ (%)
(1) Required Provision / BB Classified Loan Portfolio. (2) Simulation excluding an oil and gas specific case effect.
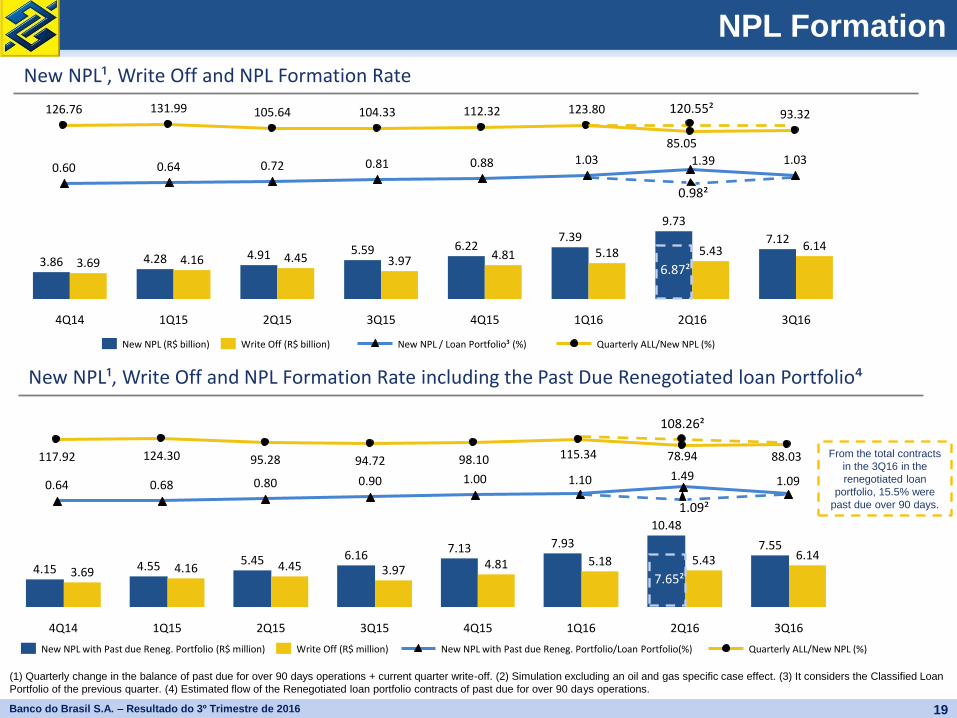
NPL Formation
New NPL¹, Write Off and NPL Formation Rate including the Past Due Renegotiated loan Portfolio⁴
19 Banco do Brasil S.A. – Resultado do 3º Trimestre de 2016
New NPL¹, Write Off and NPL Formation Rate
3Q16
6.14 7.12
2Q16
5.43
9.73
1Q16
5.18 7.39
4Q15
4.81 6.22
3Q15
3.97 5.59
2Q15
4.45 4.91
1Q15
4.16 4.28
4Q14
3.69 3.86
Write Off (R$ billion) New NPL (R$ billion)
1.03 1.39 1.03 0.88 0.81 0.72 0.64 0.60
New NPL / Loan Portfolio³ (%)
93.32
85.05
123.80 112.32 104.33 105.64 131.99 126.76
Quarterly ALL/New NPL (%)
0.98²
6.87²
3Q16
6.14 7.55
2Q16
5.43
10.48
1Q16
5.18
7.93
4Q15
4.81 7.13
3Q15
3.97 6.16
2Q15
4.45 5.45
1Q15
4.16 4.55
4Q14
3.69 4.15
Write Off (R$ million) New NPL with Past due Reneg. Portfolio (R$ million)
1.09 1.49 1.10 1.00 0.90 0.80 0.68 0.64
New NPL with Past due Reneg. Portfolio/Loan Portfolio(%)
88.03 78.94 115.34 98.10 94.72 95.28 124.30 117.92
Quarterly ALL/New NPL (%)
7.65²
1.09²
108.26²
120.55²
From the total contracts
in the 3Q16 in the
renegotiated loan
portfolio, 15.5% were
past due over 90 days.
(1) Quarterly change in the balance of past due for over 90 days operations + current quarter write-off. (2) Simulation excluding an oil and gas specific case effect. (3) It considers the Classified Loan
Portfolio of the previous quarter. (4) Estimated flow of the Renegotiated loan portfolio contracts of past due for over 90 days operations.

Renegotiated Overdue Loan Portfolio¹ R$ million
20 Banco do Brasil S.A. – Third Quarter 2016 Earnings
3Q15 2Q16 3Q16
Credits Renegotiated when Past Due - Changes
Initial Balance 12,701 22,038 25,050
Contracts 3,783 5,026 2,758
Payments received and capitalized interest (461) (979) (744)
Write-Off (503) (1,036) (1,370)
Past due Renegotiated Loan Portfolio (A) 15,520 25,050 25,694
ALL Balance (B) 7,464 10,369 10,784
NPL + 90 days (C) 2,469 5,642 6,370
Indicators - %
ALL / Loan Portfolio (B/A) 48.1 41.4 42.0
NPL + 90 days / Loan Portfolio (C/A) 15.9 22.5 24.8
ALL Balance/NPL + 90 days (B/C) 302.2 183.8 169.3
Credits Renegotiated/Classified Portfolio 2.2 3.6 3.8
New NPL¹, Write Off and NPL Formation Rate
Sep/16
1.37 2.10
Jun/16
1.04
2.38
Mar/16
0.78
1.91
Dec/15
0.84 1.55
Sep/15
0.50 1.24
Jun/15
0.65 0.79
Mar/15
0.51 0.68
Dec/14
0.51 0.33
Write Off (R$ billion) New NPL - Credits Renegotiated (R$ billion)
8.37 10.78 9.71 9.96 9.80 7.73 7.50 4.14
New NPL/Past due Renegotiated Portfolio²
169.31 183.79 220.67 270.72 302.24 382.74 384.91 403.08
ALL Balance/NPL + 90 days
Balance Share%
AA 151 1.0
A 894 5.8
B 1,767 11.4
C 1,427 9.2
D 803 5.2
E 2,974 19.2
F 1,578 10.2
G 962 6.2
H 4,964 32.0
Total 15,520 100.0
AA-C 4,239 27.3
D-H 11,281 72.7
Sep/15
Balance Share%
AA 431 1.7
A 1,158 4.5
B 3,467 13.5
C 3,183 12.4
D 1,333 5.2
E 5,195 20.2
F 2,634 10.3
G 2,182 8.5
H 6,112 23.8
Total 25,694 100.0
AA-C 8,238 32.1
D-H 17,456 67.9
Sep/16
(1) Table according to Explanatory Note 10.k
(1) Quarterly change in the balance of past-due for over 90 days operations + current quarter write off. (2) It considers the past due renegotiated portfolio of the previous quarter.
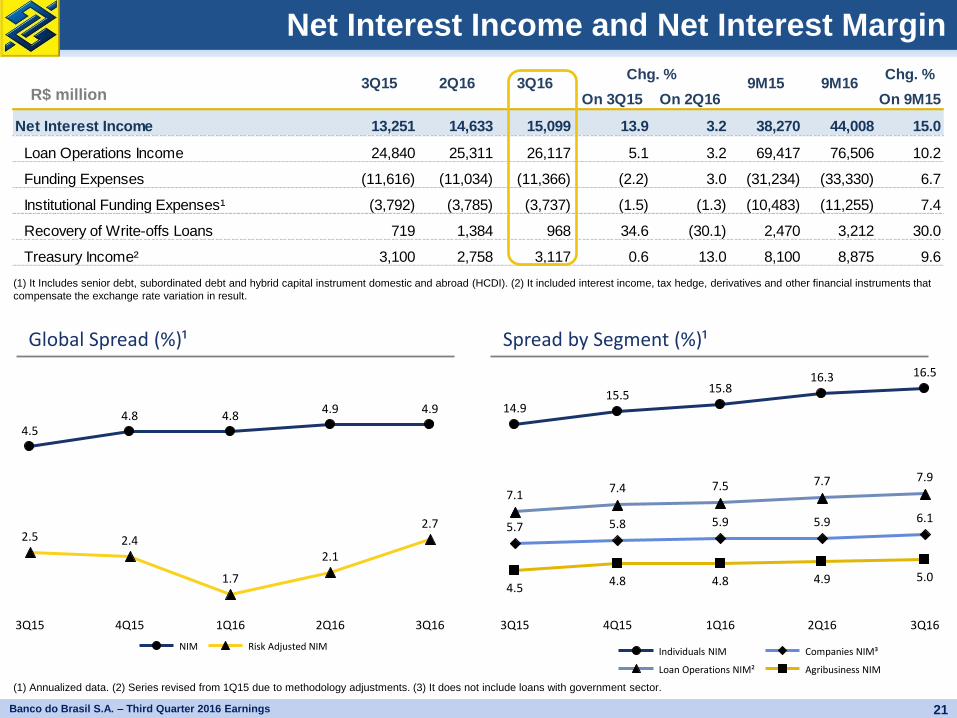
Chg. %
On 3Q15 On 2Q16 On 9M15
Net Interest Income 13,251 14,633 15,099 13.9 3.2 38,270 44,008 15.0
Loan Operations Income 24,840 25,311 26,117 5.1 3.2 69,417 76,506 10.2
Funding Expenses (11,616) (11,034) (11,366) (2.2) 3.0 (31,234) (33,330) 6.7
Institutional Funding Expenses¹ (3,792) (3,785) (3,737) (1.5) (1.3) (10,483) (11,255) 7.4
Recovery of Write-offs Loans 719 1,384 968 34.6 (30.1) 2,470 3,212 30.0
Treasury Income² 3,100 2,758 3,117 0.6 13.0 8,100 8,875 9.6
3Q15 9M15 9M163Q162Q16Chg. %
Net Interest Income and Net Interest Margin
21
2.7
4.9
2.1
4.9
1.7
4.8
2.4
4.8
2.5
4.5
1Q16 2Q16 3Q16 4Q15 3Q15
Risk Adjusted NIM NIM
Global Spread (%)¹ Spread by Segment (%)¹
3Q16
5.0
6.1
7.9
16.5
2Q16
4.9
5.9
7.7
16.3
1Q16
4.8
5.9
7.5
15.8
4Q15
4.8
5.8
7.4
15.5
3Q15
4.5
5.7
7.1
14.9
Agribusiness NIM
Companies NIM³
Loan Operations NIM²
Individuals NIM
R$ million
Banco do Brasil S.A. – Third Quarter 2016 Earnings
(1) It Includes senior debt, subordinated debt and hybrid capital instrument domestic and abroad (HCDI). (2) It included interest income, tax hedge, derivatives and other financial instruments that
compensate the exchange rate variation in result.
(1) Annualized data. (2) Series revised from 1Q15 due to methodology adjustments. (3) It does not include loans with government sector.
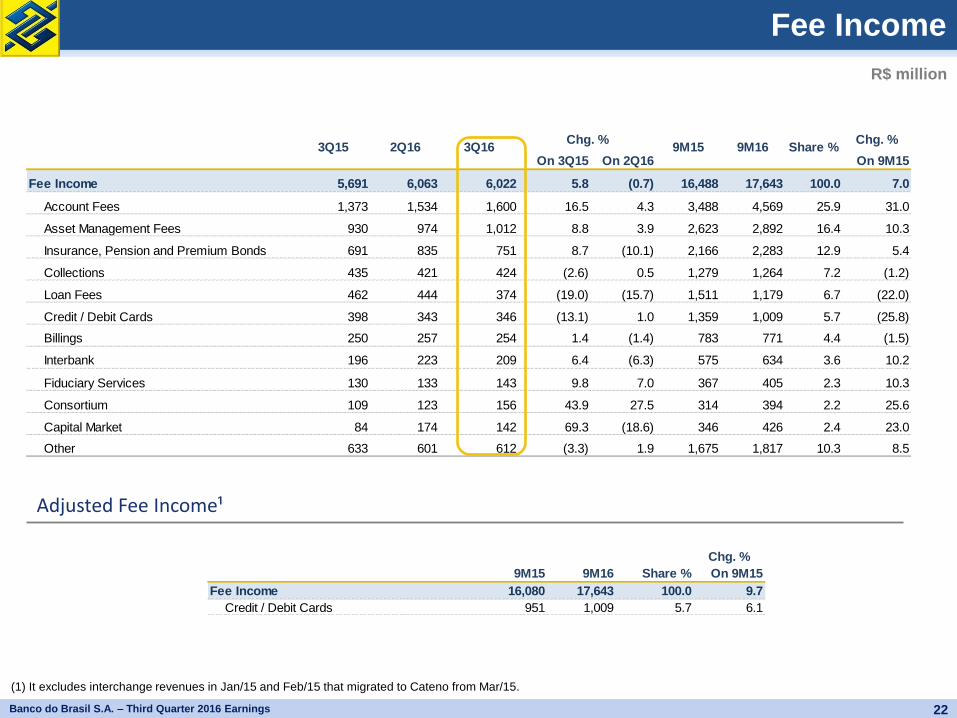
Fee Income
R$ million
22 Banco do Brasil S.A. – Third Quarter 2016 Earnings
Chg. %
On 3Q15 On 2Q16 On 9M15
Fee Income 5,691 6,063 6,022 5.8 (0.7) 16,488 17,643 100.0 7.0
Account Fees 1,373 1,534 1,600 16.5 4.3 3,488 4,569 25.9 31.0
Asset Management Fees 930 974 1,012 8.8 3.9 2,623 2,892 16.4 10.3
Insurance, Pension and Premium Bonds 691 835 751 8.7 (10.1) 2,166 2,283 12.9 5.4
Collections 435 421 424 (2.6) 0.5 1,279 1,264 7.2 (1.2)
Loan Fees 462 444 374 (19.0) (15.7) 1,511 1,179 6.7 (22.0)
Credit / Debit Cards 398 343 346 (13.1) 1.0 1,359 1,009 5.7 (25.8)
Billings 250 257 254 1.4 (1.4) 783 771 4.4 (1.5)
Interbank 196 223 209 6.4 (6.3) 575 634 3.6 10.2
Fiduciary Services 130 133 143 9.8 7.0 367 405 2.3 10.3
Consortium 109 123 156 43.9 27.5 314 394 2.2 25.6
Capital Market 84 174 142 69.3 (18.6) 346 426 2.4 23.0
Other 633 601 612 (3.3) 1.9 1,675 1,817 10.3 8.5
3Q15 2Q16 3Q16 9M15 9M16 Share %Chg. %
Chg. %
9M15 9M16 Share % On 9M15
Fee Income 16,080 17,643 100.0 9.7
Credit / Debit Cards 951 1,009 5.7 6.1
(1) It excludes interchange revenues in Jan/15 and Feb/15 that migrated to Cateno from Mar/15.
Adjusted Fee Income¹
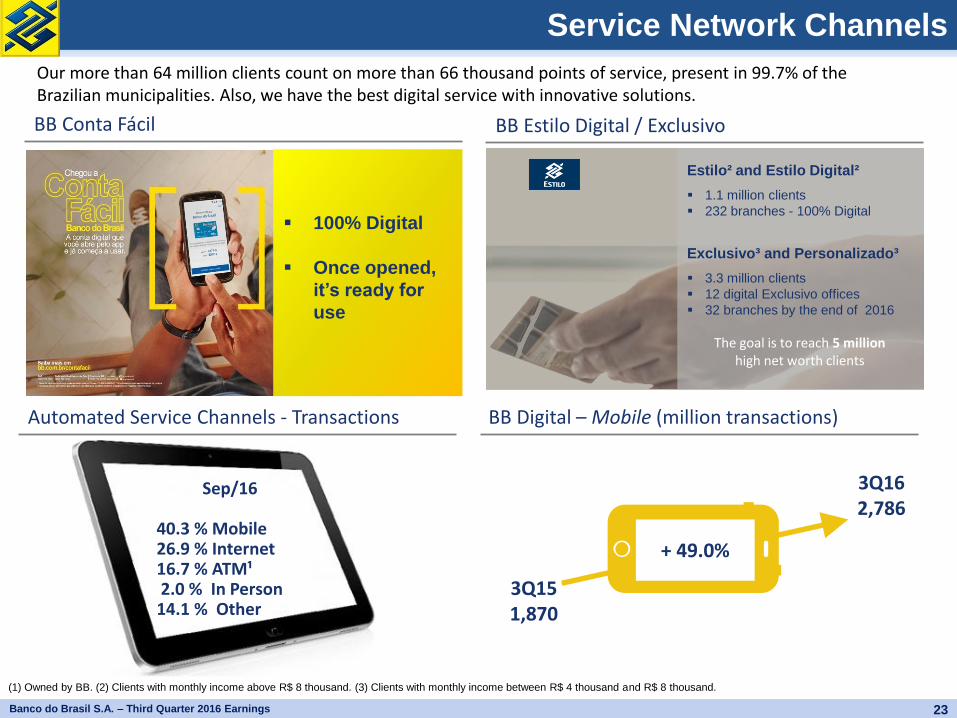
23
BB Conta Fácil
Automated Service Channels - Transactions BB Digital – Mobile (million transactions)
3Q15 1,870
3Q16 2,786
Our more than 64 million clients count on more than 66 thousand points of service, present in 99.7% of the Brazilian municipalities. Also, we have the best digital service with innovative solutions.
Service Network Channels
Sep/16
40.3 % Mobile 26.9 % Internet 16.7 % ATM¹ 2.0 % In Person 14.1 % Other
BB Estilo Digital / Exclusivo
+ 49.0%
(1) Owned by BB. (2) Clients with monthly income above R$ 8 thousand. (3) Clients with monthly income between R$ 4 thousand and R$ 8 thousand.
100% Digital
Once opened,
it’s ready for
use
Estilo² and Estilo Digital²
1.1 million clients
232 branches - 100% Digital
Exclusivo³ and Personalizado³
3.3 million clients
12 digital Exclusivo offices
32 branches by the end of 2016
The goal is to reach 5 million high net worth clients
Banco do Brasil S.A. – Third Quarter 2016 Earnings
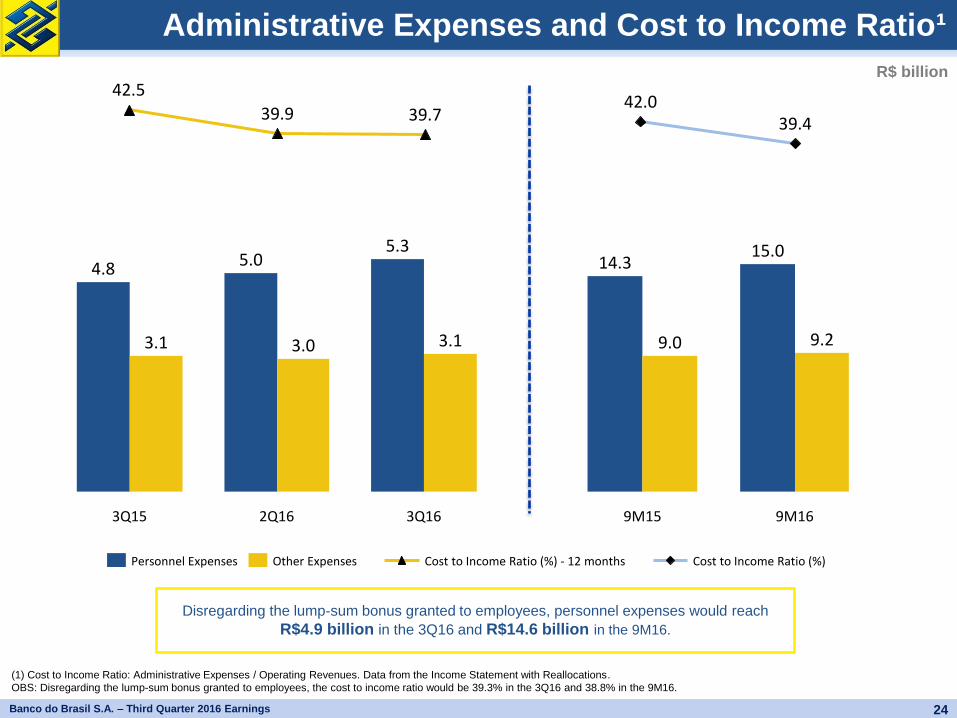
Administrative Expenses and Cost to Income Ratio¹
R$ billion
39.7 39.9
42.5
Cost to Income Ratio (%) - 12 months
3Q16
3.1
5.3
2Q16
3.0
5.0
3Q15
3.1
4.8
24 Banco do Brasil S.A. – Third Quarter 2016 Earnings
Other Expenses Personnel Expenses
(1) Cost to Income Ratio: Administrative Expenses / Operating Revenues. Data from the Income Statement with Reallocations.
OBS: Disregarding the lump-sum bonus granted to employees, the cost to income ratio would be 39.3% in the 3Q16 and 38.8% in the 9M16.
9M16
9.2
15.0
9M15
9.0
14.3
39.4 42.0
Cost to Income Ratio (%)
Disregarding the lump-sum bonus granted to employees, personnel expenses would reach
R$4.9 billion in the 3Q16 and R$14.6 billion in the 9M16.
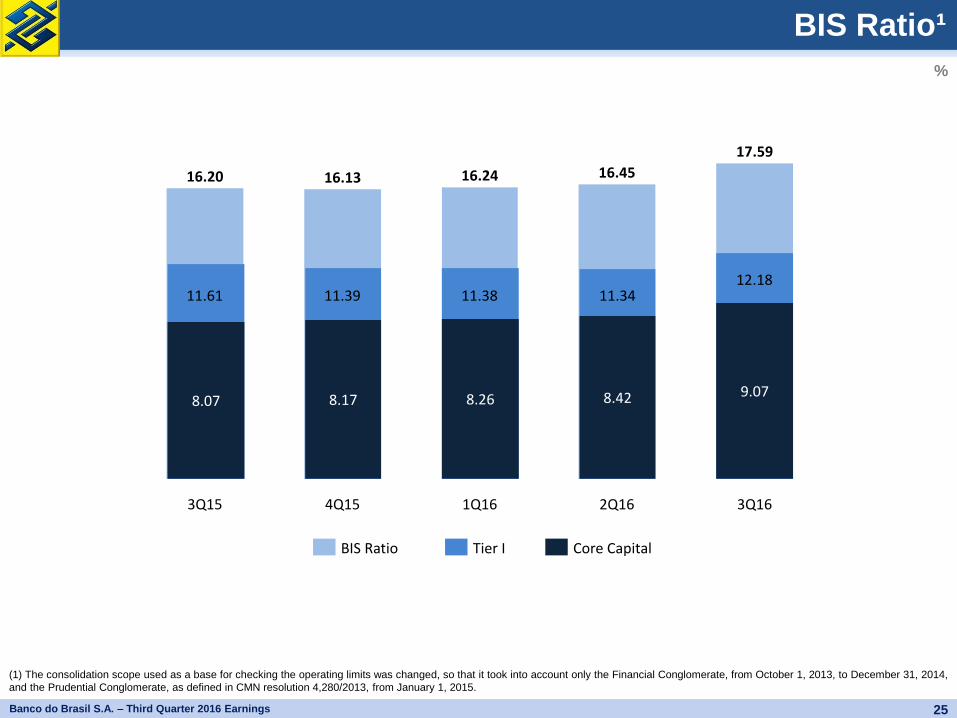
BIS Ratio¹
%
3Q16
17.59
2Q16
16.45
1Q16
16.24
4Q15
16.13
3Q15
16.20
25 Banco do Brasil S.A. – Third Quarter 2016 Earnings
9.07 8.42 8.26 8.17 8.07
BIS Ratio Tier I Core Capital
11.61 11.39 11.38 11.34 12.18
(1) The consolidation scope used as a base for checking the operating limits was changed, so that it took into account only the Financial Conglomerate, from October 1, 2013, to December 31, 2014,
and the Prudential Conglomerate, as defined in CMN resolution 4,280/2013, from January 1, 2015.
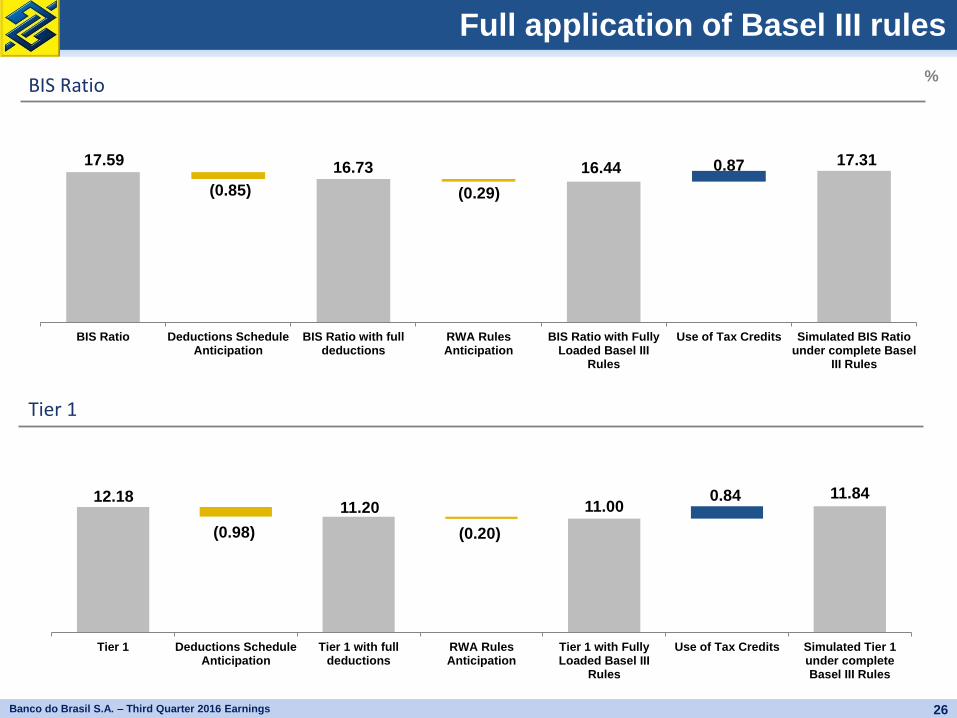
Full application of Basel III rules
%
Tier 1
BIS Ratio
26 Banco do Brasil S.A. – Third Quarter 2016 Earnings
17.59 16.73 16.44 0.87 17.31
(0.85) (0.29)
BIS Ratio Deductions ScheduleAnticipation
BIS Ratio with fulldeductions
RWA RulesAnticipation
BIS Ratio with FullyLoaded Basel III
Rules
Use of Tax Credits Simulated BIS Ratiounder complete Basel
III Rules
11.20 11.00 11.84 12.18
(0.98) (0.20)
0.84
Tier 1 Deductions ScheduleAnticipation
Tier 1 with fulldeductions
RWA RulesAnticipation
Tier 1 with FullyLoaded Basel III
Rules
Use of Tax Credits Simulated Tier 1under completeBasel III Rules
%
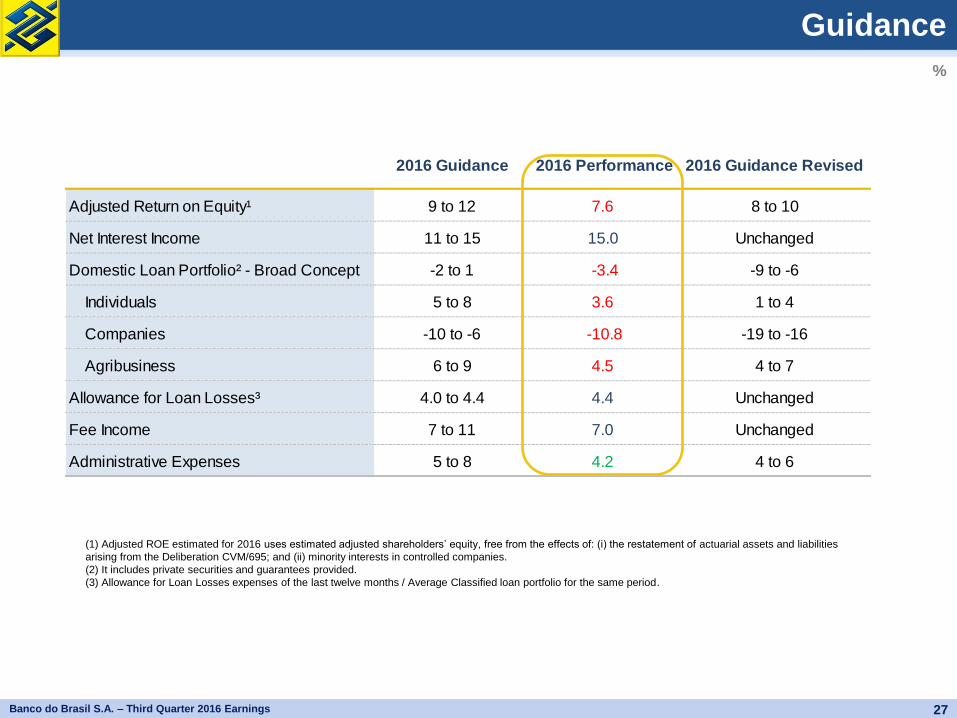
27
Guidance
Banco do Brasil S.A. – Third Quarter 2016 Earnings
(1) Adjusted ROE estimated for 2016 uses estimated adjusted shareholders’ equity, free from the effects of: (i) the restatement of actuarial assets and liabilities
arising from the Deliberation CVM/695; and (ii) minority interests in controlled companies.
(2) It includes private securities and guarantees provided.
(3) Allowance for Loan Losses expenses of the last twelve months / Average Classified loan portfolio for the same period.
Adjusted Return on Equity¹ 9 to 12 7.6 8 to 10
Net Interest Income 11 to 15 15.0 Unchanged
Domestic Loan Portfolio² - Broad Concept -2 to 1 -3.4 -9 to -6
Individuals 5 to 8 3.6 1 to 4
Companies -10 to -6 -10.8 -19 to -16
Agribusiness 6 to 9 4.5 4 to 7
Allowance for Loan Losses³ 4.0 to 4.4 4.4 Unchanged
Fee Income 7 to 11 7.0 Unchanged
Administrative Expenses 5 to 8 4.2 4 to 6
2016 Performance 2016 Guidance Revised2016 Guidance
28
Contacts
Banco do Brasil S.A. – Third Quarter 2016 Earnings
Investor Relations Unit
Av. Paulista, 2,163 – 2nd Floor
01311-933 - São Paulo (SP)
Telephone: +55 (11) 3066 9110
bb.com.br/ir
29
Appendix
Banco do Brasil S.A. – Third Quarter 2016 Earnings
30. BIS III - Capital Requirements
31. One-Off Items
32. Income Statement – Main Lines
33. Banco Votorantim
%
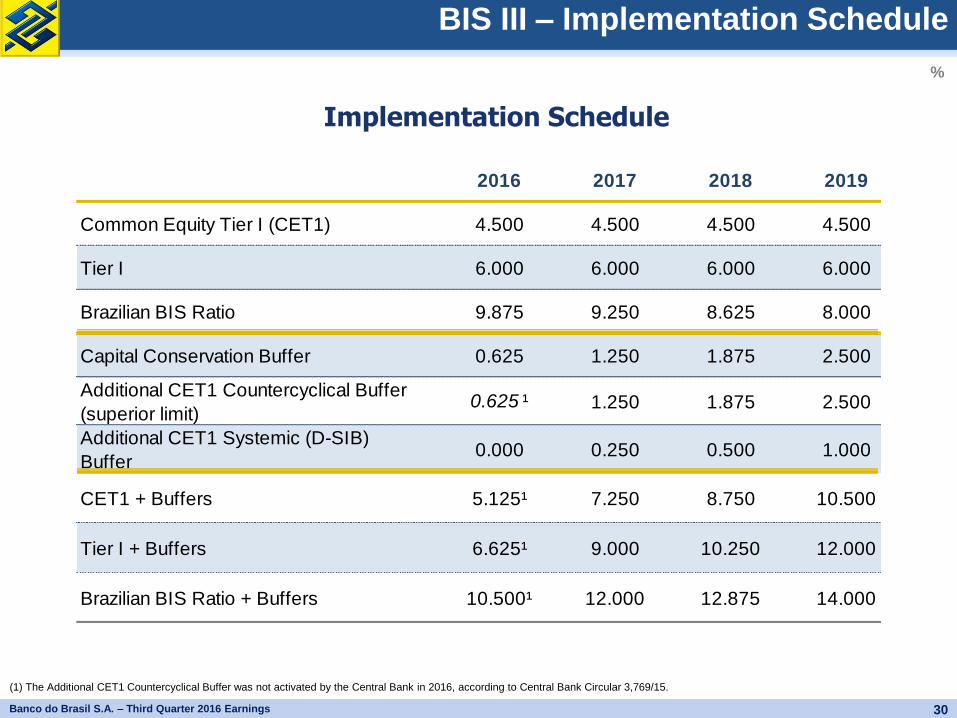
BIS III – Implementation Schedule
30 Banco do Brasil S.A. – Third Quarter 2016 Earnings
(1) The Additional CET1 Countercyclical Buffer was not activated by the Central Bank in 2016, according to Central Bank Circular 3,769/15.
Implementation Schedule
2016 2017 2018 2019
Common Equity Tier I (CET1) 4.500 4.500 4.500 4.500
Tier I 6.000 6.000 6.000 6.000
Brazilian BIS Ratio 9.875 9.250 8.625 8.000
Capital Conservation Buffer 0.625 1.250 1.875 2.500
Additional CET1 Countercyclical Buffer
(superior limit)0.625 ¹ 1.250 1.875 2.500
Additional CET1 Systemic (D-SIB)
Buffer0.000 0.250 0.500 1.000
CET1 + Buffers 5.125¹ 7.250 8.750 10.500
Tier I + Buffers 6.625¹ 9.000 10.250 12.000
Brazilian BIS Ratio + Buffers 10.500¹ 12.000 12.875 14.000
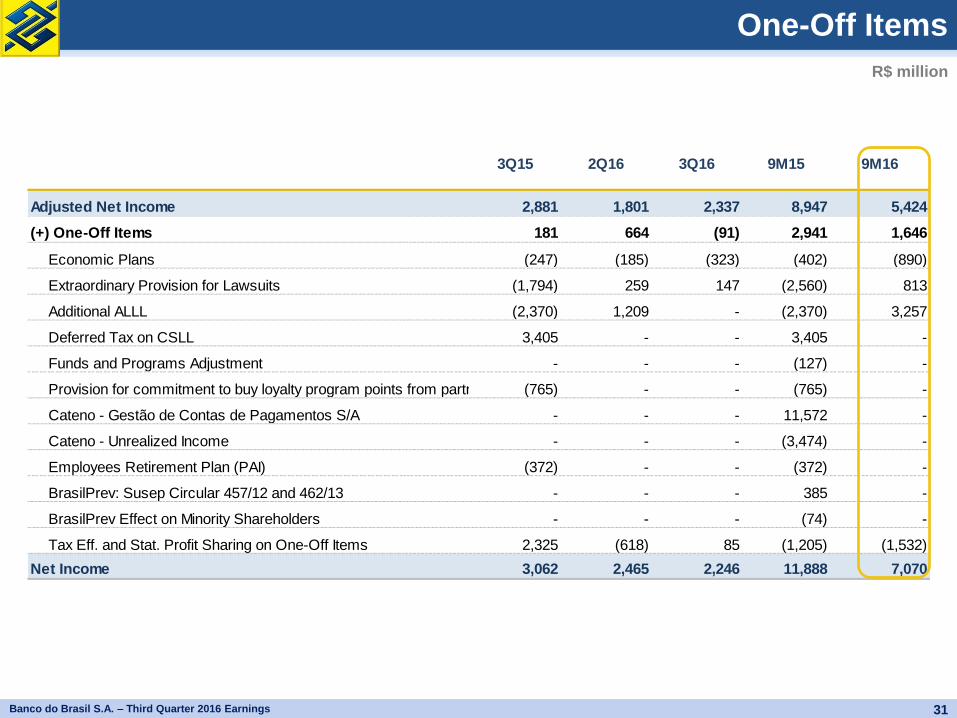
Adjusted Net Income 2,881 1,801 2,337 8,947 5,424
(+) One-Off Items 181 664 (91) 2,941 1,646
Economic Plans (247) (185) (323) (402) (890)
Extraordinary Provision for Lawsuits (1,794) 259 147 (2,560) 813
Additional ALLL (2,370) 1,209 - (2,370) 3,257
Deferred Tax on CSLL 3,405 - - 3,405 -
Funds and Programs Adjustment - - - (127) -
Provision for commitment to buy loyalty program points from partners (765) - - (765) -
Cateno - Gestão de Contas de Pagamentos S/A - - - 11,572 -
Cateno - Unrealized Income - - - (3,474) -
Employees Retirement Plan (PAI) (372) - - (372) -
BrasilPrev: Susep Circular 457/12 and 462/13 - - - 385 -
BrasilPrev Effect on Minority Shareholders - - - (74) -
Tax Eff. and Stat. Profit Sharing on One-Off Items 2,325 (618) 85 (1,205) (1,532)
Net Income 3,062 2,465 2,246 11,888 7,070
3Q15 2Q16 3Q16 9M15 9M16
One-Off Items
R$ million
31 Banco do Brasil S.A. – Third Quarter 2016 Earnings
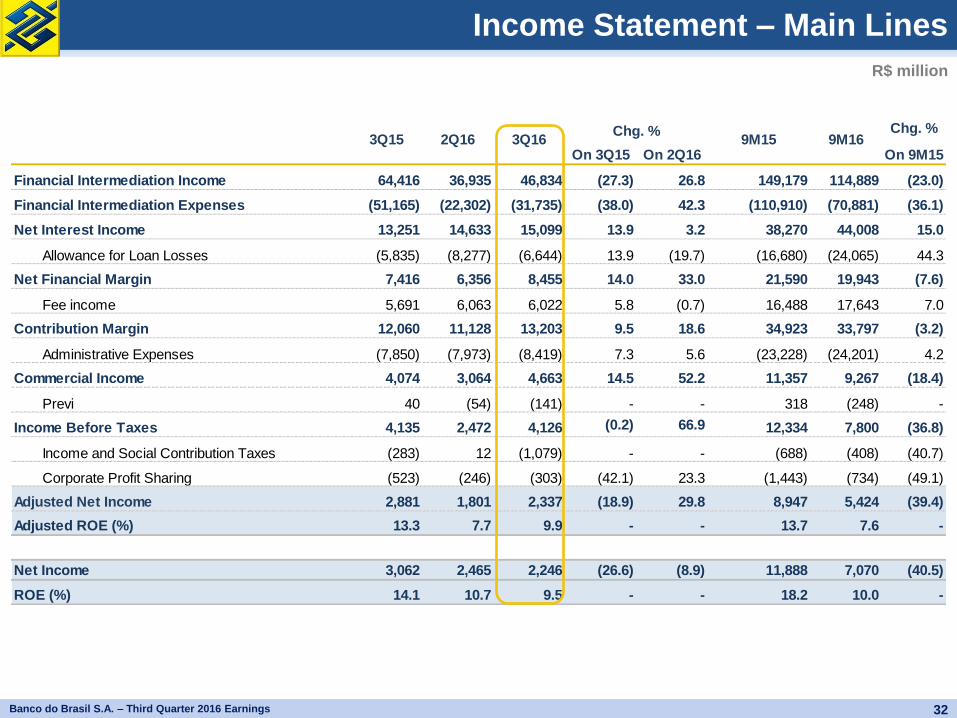
Chg. %
On 3Q15 On 2Q16 On 9M15
Financial Intermediation Income 64,416 36,935 46,834 (27.3) 26.8 149,179 114,889 (23.0)
Financial Intermediation Expenses (51,165) (22,302) (31,735) (38.0) 42.3 (110,910) (70,881) (36.1)
Net Interest Income 13,251 14,633 15,099 13.9 3.2 38,270 44,008 15.0
Allowance for Loan Losses (5,835) (8,277) (6,644) 13.9 (19.7) (16,680) (24,065) 44.3
Net Financial Margin 7,416 6,356 8,455 14.0 33.0 21,590 19,943 (7.6)
Fee income 5,691 6,063 6,022 5.8 (0.7) 16,488 17,643 7.0
Contribution Margin 12,060 11,128 13,203 9.5 18.6 34,923 33,797 (3.2)
Administrative Expenses (7,850) (7,973) (8,419) 7.3 5.6 (23,228) (24,201) 4.2
Commercial Income 4,074 3,064 4,663 14.5 52.2 11,357 9,267 (18.4)
Previ 40 (54) (141) - - 318 (248) -
Income Before Taxes 4,135 2,472 4,126 (0.2) 66.9 12,334 7,800 (36.8)
Income and Social Contribution Taxes (283) 12 (1,079) - - (688) (408) (40.7)
Corporate Profit Sharing (523) (246) (303) (42.1) 23.3 (1,443) (734) (49.1)
Adjusted Net Income 2,881 1,801 2,337 (18.9) 29.8 8,947 5,424 (39.4)
Adjusted ROE (%) 13.3 7.7 9.9 - - 13.7 7.6 -
Net Income 3,062 2,465 2,246 (26.6) (8.9) 11,888 7,070 (40.5)
ROE (%) 14.1 10.7 9.5 - - 18.2 10.0 -
3Q15 2Q16 3Q16 9M15 9M16Chg. %
R$ million
32 Banco do Brasil S.A. – Third Quarter 2016 Earnings
Income Statement – Main Lines
R$ million
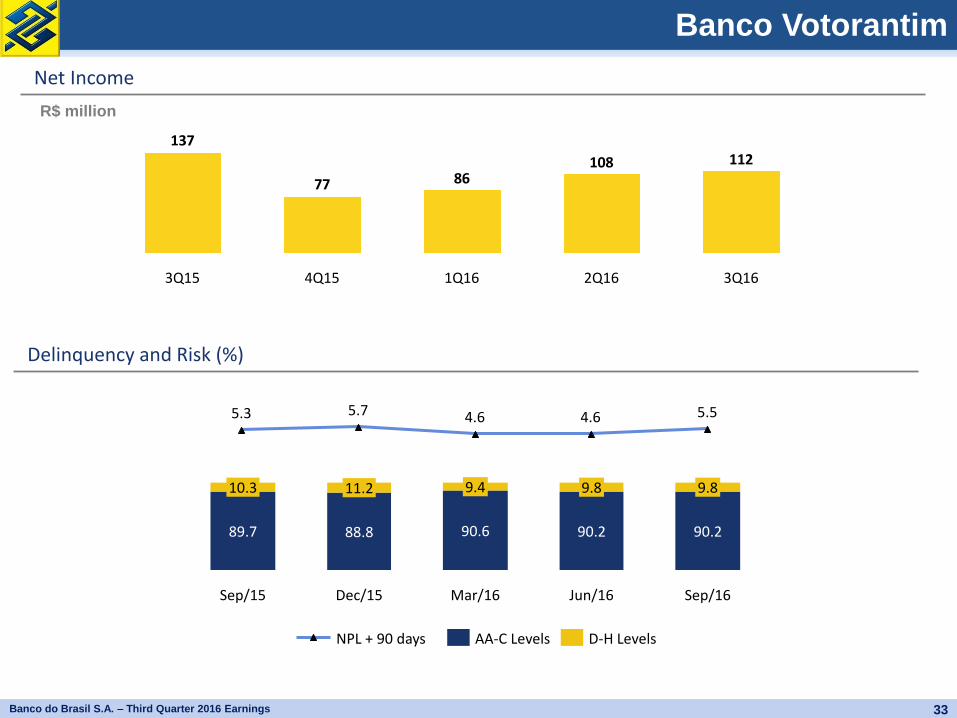
112 108 86 77
137
3Q16 2Q16 1Q16 4Q15 3Q15
Sep/16
9.8
90.2
Jun/16
9.8
90.2
Mar/16
9.4
90.6
Dec/15
11.2
88.8
Sep/15
10.3
89.7
D-H Levels AA-C Levels
5.5 4.6 4.6 5.7 5.3
33 Banco do Brasil S.A. – Third Quarter 2016 Earnings
Banco Votorantim
Net Income
NPL + 90 days
Delinquency and Risk (%)