3.demissie belayneh.pdf
TRANSCRIPT
SCHOOL OF GRADUATE STUDIES
ADDIS ABABA UNIVERSITY
COLLEGE OF DEVELOPMENT STUDIES (CDS)
THE SOCIO-ECONOMIC AND LIVELIHOOD IMPACTS OF ENVIRONMENTAL CHANGE AND
LOCAL RESPONSES A CASE STUDY ON THE DISAPPEARANCE OF LAKE HARAMAYA IN
HARAMAYA DISTRICT, OROMIYA REGION, ETHIOPIA
BY
DEMISSIE BELAYNEH ZIKE
JUNE, 2008
ADDIS ABABA
i
SCHOOL OF GRADUATE STUDIES
ADDIS ABABA UNIVERSITY
COLLEGE OF DEVELOPMENT STUDIES (CDS)
THE SOCIO-ECONOMIC AND LIVELIHOOD
IMPACTS OF ENVIRONMENTAL CHANGE AND
LOCAL RESPONSES A CASE STUDY ON THE DISAPPEARANCE OF LAKE HARAMAYA IN
HARAMAYA DISTRICT, OROMIYA REGION, ETHIOPIA
BY
DEMISSIE BELAYNEH
Advisor:-TESFAYE TAFESSE (Ph.D)
ii
ADDIS ABABA UNIVERSITY
SCHOOL OF GRADUATE STUDIES COLLEGE OF DEVELOPMENT STUDIES (CDS)
THE SOCIO-ECONOMIC AND LIVELIHOOD
IMPACTS OF ENVIRONMENTAL CHANGE AND
LOCAL RESPONSES A CASE STUDY ON THE DISAPPEARANCE OF LAKE HARAMAYA IN
HARAMAYA DISTRICT, OROMIYA REGION, ETHIOPIA
MA THESIS BY
DEMISSIE BELAYNEH
Approved by Board of Examiners
……………………………………… …………….. …………………..
Name of Chairman Signature Date
……………………………………… ……………... ……………………
Name of Advisor Signature Date
…………………………………….. ………………… ………………….
Name of Internal Examiner Signature Date
…………………………………….. …………………. ………………….
Name of External Examiner Signature Date
iii
DEDICATION
Dedicated to Generation Obama, who disproved the
presumptive impossibility and are in-waiting to
prove the indiscerptibility of humanity beneath his
skin.
iv

ACKNOWLEDGMENT
First and foremost, I would like to express my sincere gratitude and
indebtedness to my advisor Dr Tesfaye Tafesse for his constructive and
invaluable comments in the course of my thesis work. He spent a great
deal of his precious time in reviewing and editing the manuscript and the
intellectual guidance he rendered me from the start to finish.
My sincere gratitude also extends to Haramaya University, my home
base, and Addis Ababa University, College of Development Studies. The
former for giving me a study leave, and the later, for covering the cost of
my thesis work. I duly thank the two institutions.
Words can not express my deepest gratitude to my intimate friends,
Kumela Gudeta and Ephrem Fufa for their unreserved co-operation and
guidance during data processing from data entry to analysis. Guys, your
support and friendliness are vital source of morale backing to my overall
effort to accomplish this study. I thank you both indiscriminately.
I also extend special gratitude and appreciations to all staff of Geography
and History departments in Haramaya University for their kind support
during the course of my study. Above all, I am indebted to Ato
Mohammed Hassan of History department for his never–to-be mentioned
encouragement and accommodation.
Last but not least, I extend special indebtedness and gratitude to my
father, brothers and sisters, all of them, for their morale and material
support in my academic career as a whole.
v

ACRONNYMS
a..s.l above sea level
CRM Community Resource Management
CSA Central Statistic Authority
FRCRCS International Federation of Red Cross and Red
Crescent Society
NS Not Significant
PAT Population, Affluence and Technology
RWH Rain Water Harvesting
SD Standard Deviation
SE Standard Error
SPSS Statistical Package for Social Science
UGW underground water
WR Water Reclamation
vi
TABLE OF CONTENTS
ACKNOWLEDGMENT --------------------------------------------------------------------------- i
ACRONNYMS-------------------------------------------------------------------------------------- vi
TABLE OF CONTENTS ------------------------------------------------------------------------ vii
LIST OF TABLES--------------------------------------------------------------------------------- ix
LIST OF FIGURES --------------------------------------------------------------------------------x
LIST OF PLATES ----------------------------------------------------------------------------------x
ABSTRACT---------------------------------------------------------------------------------------- xii
CHAPTER ONE -----------------------------------------------------------------------------------1
1. INTRODUCTION -------------------------------------------------------------------------------1 1.1 Background to the study ----------------------------------------------------------------------- 1 1.2 Statement of the problem ---------------------------------------------------------------------- 4 1.3 Objectives of the study-------------------------------------------------------------------------- 7 1.4 Significance of the study ----------------------------------------------------------------------- 8 1.5 Delimitation of the study------------------------------------------------------------------------ 9 1.6 Limitations of the study------------------------------------------------------------------------- 9 1.7 Organization of the paper --------------------------------------------------------------------- 10
CHAPTER TWO --------------------------------------------------------------------------------- 12
2. REVIEW OF RELATED LITERATURE ------------------------------------------------ 12 2.1 Society- Environment inter-relationships------------------------------------------------ 12 2.2 Human driving forces of environmental and ecological changes --------------- 13 2.3 Human consequences of Environmental change ------------------------------------- 14
2.3.1 Impacts of Environmental change: A tale of Aral Sea ------------------------------------16 2.4. Human Responses to Environmental Change.---------------------------------------- 18
2.4.1. Theoretical Considerations -----------------------------------------------------------------------18 2.4.2 Empirical Considerations --------------------------------------------------------------------------22
2.5 Conceptual Framework ------------------------------------------------------------------------ 27 CHAPTER THREE------------------------------------------------------------------------------ 30
3. RESEARCH METHODOLOGY----------------------------------------------------------- 30 3.1 Research design---------------------------------------------------------------------------------- 30 3.2. Sources of data and methods of data collection. ------------------------------------ 31 3.3 Sample size determination and sampling procedures ------------------------------ 32 3.4 Methods of data analysis ---------------------------------------------------------------------- 34
3.4.1 Model specification-----------------------------------------------------------------------------------36 3.4.2 Hypothesis and Definition of variables --------------------------------------------------------38
vii
CHAPTER FOUR ------------------------------------------------------------------------------- 42
BACKGROUND TO THE STUDY AREA ------------------------------------------------- 42 4.1 Description of the Study Area --------------------------------------------------------------- 42
4.1.1 Location and physical settings-------------------------------------------------------------------42 4.1.2 Socio- demographic profile ------------------------------------------------------------------------46
4.2 Background Characteristics of the Study Population ------------------------ 46 4.2.1 Demographic characteristics of sample households -------------------------------------47 4.2.2 Socio-economic characteristics -----------------------------------------------------------------49
CHAPTER FIVE --------------------------------------------------------------------------------- 53
RESULTS AND DISCUSSION -------------------------------------------------------------- 53 5.1 Direct utilities of the lake before disappearance -------------------------------------- 53 5.2 The induced impacts---------------------------------------------------------------------------- 56
5.2.1 Conflict over resources use -----------------------------------------------------------------------56 5.2.2 Change in farmland under irrigation cover ---------------------------------------------------59 5.2.3 Decline in agricultural productivity -------------------------------------------------------------64 5.2.4 Perceived impact on household’s income----------------------------------------------------72
5.3 Household responses to disappearance of the lake --------------------------------- 76 5.3.1 Households Perception towards the Dryup of the Lake ---------------------------------76 5.3.2 Water reclamation and utilization practices--------------------------------------------------78 5.3.3 Households participation in institutional services-----------------------------------------82 5.3.4 Occupational responses----------------------------------------------------------------------------85
5.4 Determinants of Household's Participation water reclamation and utilization Measures -------------------------------------------------------------------------------------------------- 89
5.4.1 Household age versus participation in water reclamation and utilization measures--------------------------------------------------------------------------------------------------------92 5.4.2 Household size versus participation in water reclamation activities ----------------93 5.4.3 Literacy status versus participation in water reclamation ------------------------------94 Activities --------------------------------------------------------------------------------------------------------94 5.4.4 Land size versus participation in water reclamation activities ------------------------95 5.4.5 Off - farm income versus participation in water reclamation activities -------------96 5.4.6 Access to credit service versus participation in water reclamation measures---97 5.4.7Fertilizer use versus participation in water reclamation measures -------------------98 5.4.8 Household perception versus participation in water reclamation activities ------99 5.4.9 Participation in community resource management versus participation in water reclamation measures ------------------------------------------------------------------------------------ 100
CHAPTER SIX ----------------------------------------------------------------------------------103
CONCLUSION AND RECOMMENDATION---------------------------------------------103 6.1 CONCLUSION ----------------------------------------------------------------------------------- 103 6.2 RECOMMENDATIONS ------------------------------------------------------------------------ 105
REFERENCE ------------------------------------------------------------------------------------108
viii

LIST OF TABLES Table 3. 1 Definitions of Variables ........................................................................................................... 41
Table 4. 1 Age-sex composition of the sample households .......................................... 47
Table 4. 2 Marital status of the sample households ..................................................... 48
Table 4. 3 Household size of the sample households.................................................... 49
Table 4. 4 Labor Force Size of the sample households................................................ 49
Table 4. 5 Literacy status of the sample households.................................................... 50
Table 4. 6 Land Size holding in timad of the Sample Households .............................. 50
Table 4. 7 Labor - Land ratio of the sample households............................................. 51
Table 4. 8 Percentage distribution of the sample households by Off-farm income .. 52
Table 5. 1 Reported utilities of Lake Haramaya before its disappearance. .............. 54 Table 5. 2 Reported quantities of utilities and incomes from Lake Haramaya before
its disappearance..................................................................................................... 55 Table 5. 3 Households' incidents of conflict over resource use................................... 57 Table 5. 4 Average proportion of land under irrigation in 2005, 2006 and 2007...... 60 Table 5. 5 Paired sample test of the mean area of land under irrigation between
2005 to 2006 and 2006 to 2007 ............................................................................... 61 Table 5. 6 Average size of land under irrigation for ‘experimental’ and ‘control’
groups for three years (i.e. 2005, 2006 and 2007)................................................. 62 Table 5. 7 Results of t-tests for mean difference in land under irrigation for
‘experimental’ and ‘control’ groups by years (2005, 2006 and 2007)................ 64 Table 5. 8 Percentage increase/decrease of crop production per timad over three
years (2005, 2006 and 2007) ................................................................................... 66 Table 5. 9 T-test for the mean differences in production per timad for various crops
over three years (2005, 2006, and 2007)................................................................ 68 Table 5. 10 Group comparison of crop production per timad for three years (2005,
2006 and 2007)......................................................................................................... 70 Table 5. 11 Trends in household’s income as perceived by household head over the
past three years ....................................................................................................... 72 Table 5. 12 Causes of income decrease over the past three years (2005, 2006 and
2007) as perceived by the household heads........................................................... 73 Table 5. 13 Perceived trends of income by group over past three years (i.e., 2005,
2006 and 2007)......................................................................................................... 73 Table 5. 14 Perceived causes of decline in households’ income over the past three
years (i.e. 2005, 2006 and 2007) by group............................................................. 75 Table 5. 15 Measures taken by the households to overcome water scarcity ............. 79
ix

Table 5. 16 Measures taken by households to suffice water demand by group ........ 80 Table 5. 17 Fertilizer use and participation in credit over the three years by
Households............................................................................................................... 83 Table 5. 18 Participation in credit service by household groups over three years
(2005, 2006and 2007) .............................................................................................. 84 Table 5. 19 Percentage distribution of households by off-farm income generation
over the three years, 2005, 2006 and 2007 ............................................................ 85 Table 5. 20 Cross- tabulation of child labor use and school dropout in 2007 ........... 87 Table 5. 21 Parameter estimates of a Logistic Model of factors affecting households’
participation in water conservation measures ..................................................... 91 Table 5. 22 Results of chi-square of independence by background Characteristics of
the Respondents .................................................................................................... 101 Table 5. 23 T-test results of mean differences by participation in water conservation
for continuous variables. ...................................................................................... 102
LIST OF FIGURES
Figure 2. 1 Schematic representation of the Conceptual framework of the study ... 28 Figure 4. 1 Map of the Study Area ............................................................................... 43 .
LIST OF PLATES Plate 5. 1 The wilted Chat farm near the shore of former lake .................................. 65
Plate 5. 2 Irrigation farming using underground water.............................................. 67
Plate 5. 3.A vast field that once comprised Lake Haramaya ...................................... 78
Plate 5. 4 A Drying Underground water bore hole ...................................................... 80
Plate 5. 5 Rain Water harvesting pond ......................................................................... 81
Plate 5. 6 Children working on underground water bore holes ................................. 88
x

LIST OF APPENDICES
Annex. 1 Multicollinearity test for Continuous Variables ........................................ 114
Annex. 2 Multicollinearity test for Categorical Variables ........................................ 114
Annex. 3 Questionnaire for Formal Survey ............................................................... 115
Annex. 4 Checklist for Focus Group Discussion........................................................ 122
xi

ABSTRACT
The way human action reshape the environment pose a new cycle of mutual determination on the way people create and re-create their livelihood in line with the changes in their environment . This must be analyzed interms of changes not only in their ecology but also in the emerging new social dynamics. In line with this assertion, this study examines the socio-economic and livelihood impacts of the disappearance of Lake Haramaya on the surrounding rural households and the households’ responses to such environmental catastrophe. Thus, the basic data used for the analysis were generated from 159 sample households through interviews and focus group discussions. Descriptive and bivariate methods of analysis were employed over time series data (i.e. 2005, 2006 and 2007). Besides, inter-group data comparison was used to demonstrate impacts as well as responses to such environmental shock. Result of the impact analysis revealed that the disappearance of the lake has resulted in the loss of direct utilities the households used to generate from the lake. These include loss of water for livestock feeding, water for domestic consumption, irrigation and recreation. Besides, two direct livelihood sources, fishing and ferry renting, were lost along with the lake. The indirect impacts of the dry-up of the lake were manifested in conflict over water use, decrease in size of land under irrigation, and thus decline in production of chat and vegetables which were mainly cultivated by irrigation. All these ultimately caused decrease in household’s income. Investigation into households’ response to water scarcity that was induced by the disappearance of the lake demonstrated that the main response to such shortfall was reclamation of underground water from previous bed of the lake. In addition, rain water harvesting is also a prevalent responsive measure among the households. However, as water table is continuously dropping and subsequent surge in the cost of digging water borehole, underground water is presently an option for those ‘resource rich’ households. On the other hand, this situation forced some households to use child labor which in turn resulted in school dropout. Examination of inter-household variation in the implementation of water reclamation practices as a response was sought by logistic regression model. The result revealed that age of household head, household size, literacy status, land size, access to credit service and household’s anticipation to dry-up of the lake have significant and positive influence on household’s application of water reclamation measures as response to the disappearance of the lake, whereas access to off-farm income and fertilizer use have significant and negative effect. On the basis of the empirical findings, institutional and policy intervention measures that are hoped to ease the pressure on the environment are recommended. These include enacting and implementing policy towards sustainable use of open access resources and controlling population size. Besides, institutional interventions which are geared towards enhancing agricultural production through promoting sound conservation measures were also recommended.
xii
CHAPTER ONE
1. INTRODUCTION
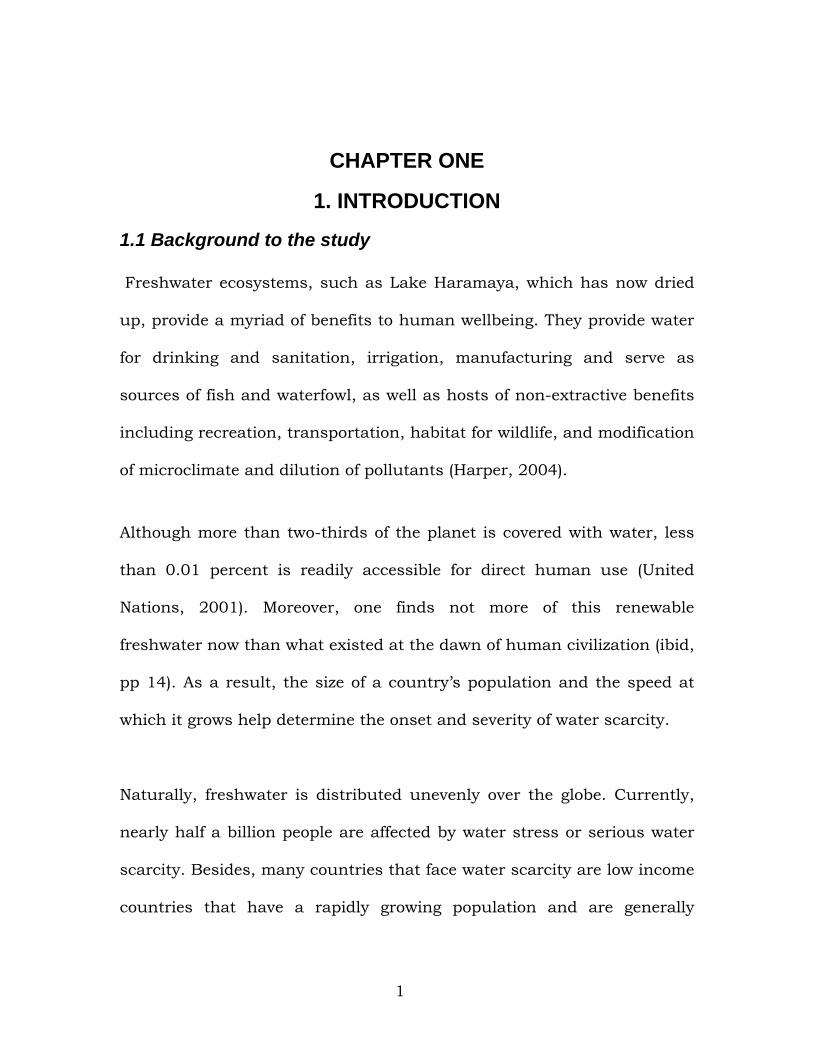
1.1 Background to the study
Freshwater ecosystems, such as Lake Haramaya, which has now dried
up, provide a myriad of benefits to human wellbeing. They provide water
for drinking and sanitation, irrigation, manufacturing and serve as
sources of fish and waterfowl, as well as hosts of non-extractive benefits
including recreation, transportation, habitat for wildlife, and modification
of microclimate and dilution of pollutants (Harper, 2004).
Although more than two-thirds of the planet is covered with water, less
than 0.01 percent is readily accessible for direct human use (United
Nations, 2001). Moreover, one finds not more of this renewable
freshwater now than what existed at the dawn of human civilization (ibid,
pp 14). As a result, the size of a country’s population and the speed at
which it grows help determine the onset and severity of water scarcity.
Naturally, freshwater is distributed unevenly over the globe. Currently,
nearly half a billion people are affected by water stress or serious water
scarcity. Besides, many countries that face water scarcity are low income
countries that have a rapidly growing population and are generally
1

unable to make costly investments in water saving technologies (United
Nations, 2001)
Part of the water scarcity is explained by the very nature of the resource
by which many of the environmental issues of greatest concern, such as
depletion of fresh water ecosystems, fall under common property
resources (Kneese, 1977).
Economic theories predict and many empirical evidences demonstrate
that the unhindered access to water resources lead to overuse, misuse
and quality degradation. In the absence of effective social mechanism to
control the over usage and degradation of common property resources,
population growth will tend to exacerbate such problems. At global
aggregate, however, most environmental changes correlate well with the
variables in the “PAT” formula which ascribes human impact on the
environment to the factors of population (P), per capita resource use(A)
and the technologies (T) by which the resources are used. At regional
level however, other factors, such as institutions, policy, political
structure, trade relations, beliefs and attitudes are important (Meyer et
al, 1996)
Human-induced environmental changes are at times beneficial and at
the other times disastrous for different people in different part of the
world. Global warming, for instance, melts glaciers at higher latitudes
2
and adds more agricultural lands for countries located in those latitudes.
On the other hand, the same phenomenon increases heat and water
stress to substantially lower cropland yields and hamper the well being
of those countries located nearer to the equator. Thus, food supply crisis
and economic impacts tend to be severe for tropical countries that are
poorer and depend on agriculture (Meyer, 1996).
Studies on the holistic assessment of critical environmental zones in the
world examined various regions where pressures of change and physical
and socio-economic vulnerabilities appear to have come together to
produce environmental crisis of unusual severity, jeopardizing the
continued use and occupancy at existing or projected levels of population
and standard of living (Meyer, 1996). A striking example for this is the
shrinkage by half of the large inland Aral Sea in central Asia due to
excessive withdrawal of water for irrigation of cotton fields: The shrinkage
of Aral Sea has induced socio-economic and livelihood disasters on the
local people that eventually caused large out migration of people form the
area (Postel, 1996).
The lessons from such studies imply that there exist large regions and
localities where environmental degradation is seriously jeopardizing the
socio-economic and livelihood aspects of inhabitants with its rate
outpacing the ability to adapt and respond.
3

In this particular study, the interest focus on analyzing the social,
economic and livelihood impacts of the sudden disappearance of Lake
Haramaya on the surrounding people living in Haramaya Woreda1. The
study had two phases; (a) an impact analysis of the dead lake is
undertaken using survey instruments, structured interviews, focus
group discussions and review of secondary data; and (b), responses and
means of adaptation by local people to such environmental shocks was
investigated through in-depth analysis.
1.2 Statement of the problem
At global level, freshwater supply is coming to be in short supply. As
agriculture, population and human economies have grown, global water
use has increased dramatically since the 1950’s. The consequence of
such expanding demand has become apparent in the falling of water
tables, shrinkage of lakes and wetlands and the dwindling of streams
and rivers. Around the world, such water shortages have resulted in
economic and legal conflicts. At the local level, it has incurred social,
economic and livelihood costs, especially for most rural people living in
the developing countries (Livernash and Rodenberg, 1998).
Presently in Ethiopia, the flow resources, the very direct source of
peoples life-support, are being ‘mined' by the same people who most
depend on them (Tegegne, 1995; Belay, 1995). In Haramaya District,
1 Amharic equivalence to a district
4
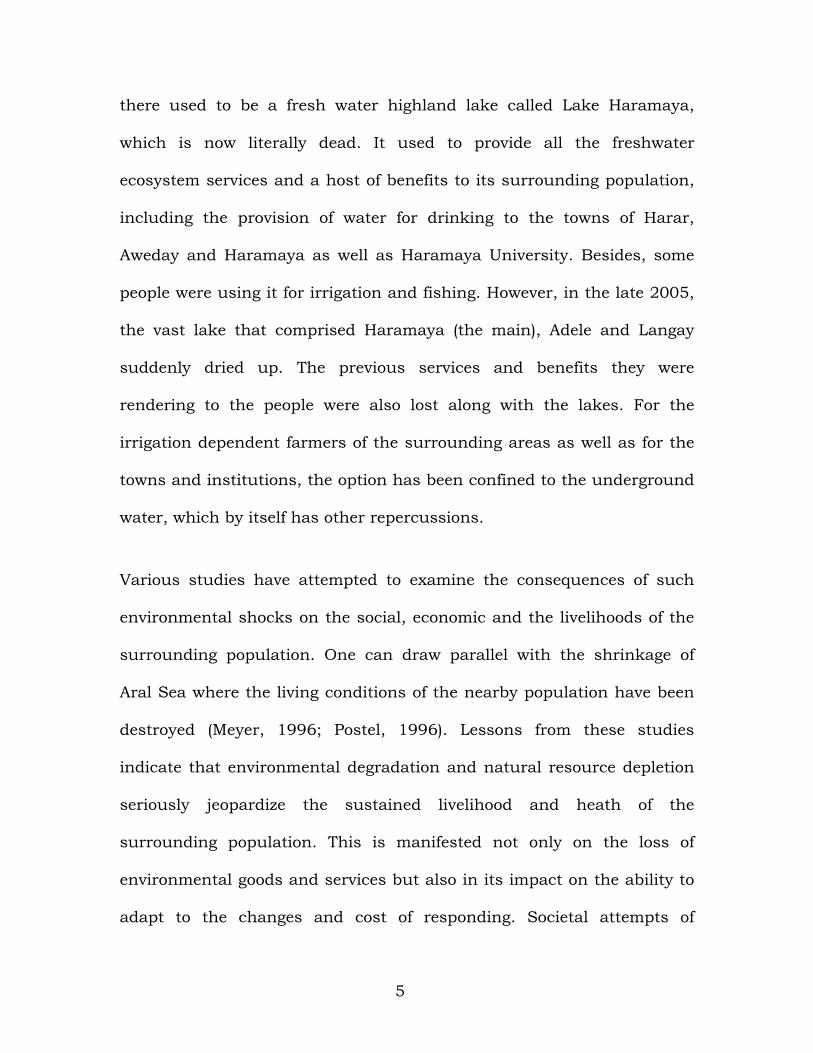
there used to be a fresh water highland lake called Lake Haramaya,
which is now literally dead. It used to provide all the freshwater
ecosystem services and a host of benefits to its surrounding population,
including the provision of water for drinking to the towns of Harar,
Aweday and Haramaya as well as Haramaya University. Besides, some
people were using it for irrigation and fishing. However, in the late 2005,
the vast lake that comprised Haramaya (the main), Adele and Langay
suddenly dried up. The previous services and benefits they were
rendering to the people were also lost along with the lakes. For the
irrigation dependent farmers of the surrounding areas as well as for the
towns and institutions, the option has been confined to the underground
water, which by itself has other repercussions.
Various studies have attempted to examine the consequences of such
environmental shocks on the social, economic and the livelihoods of the
surrounding population. One can draw parallel with the shrinkage of
Aral Sea where the living conditions of the nearby population have been
destroyed (Meyer, 1996; Postel, 1996). Lessons from these studies
indicate that environmental degradation and natural resource depletion
seriously jeopardize the sustained livelihood and heath of the
surrounding population. This is manifested not only on the loss of
environmental goods and services but also in its impact on the ability to
adapt to the changes and cost of responding. Societal attempts of
5

adaptation to resource scarcity run the risk of giving rise to undermining
the overall adaptive capacity of societies. This problem, arising from the
need to apply an increased amount of social resources in order to adapt
to resource scarcity (e.g. water) constitutes a vicious circle that is often
neglected in research on water resources management.
Successful adaptation to natural resource depletion may be possible as
for instance, in the transition described by Bosreup (1965), from shifting
cultivation to settled agriculture; or demographically through declines in
fertility rates and out migration etc. as adaptation mechanisms
However, for already densely populated area like Haramaya Woreda,
these could only be long term considerations while the short and
medium term reliance on such success could lead to sever socio
economic and environmental ramifications.
Most studies on Lake Haramaya have been devoted to analyzing and
investigating the causes of the deterioration and ultimate death of the
lake (e.g. Chalachew, 2004; Shibiru, 2002; Solomon, 2002). But none of
these authors have, however, attempted to investigate the human
impacts of the disappearance of Lake Haramaya on the surrounding
population, which is the main concern of this study.
It is against the above stated backdrops that this study is designed to
assess the socio-economic and livelihood repercussions of the
6

disappearance of Lake Haramaya on the surrounding population from
the point of view of livelihood frame work. The study exposes changes in
socio-economic variables that attribute to the loss of benefits and
services of the lake. Besides, the study also investigates local responses
and adaptation strategies by households to such environmental shocks
and identifies opportunities and challenges to such responses and
adaptation.
1.3 Objectives of the study
General objective The overall objective of this study is to assess the livelihood impacts of
the disappearance Lake Haramaya on the surrounding community and
analyze local responses and adaptations to such an environmental
shock.
Specific objectives
The specific objectives of this study are to;
1. Asses the impact of the disappearance of Lake Haramaya on the
sustained livelihood of the surrounding community.
2. Examine the responses of households to such environmental shock
3. Identify the determinants of household’s participation in water
Reclamation practices as a means of response.
7
1.4 Significance of the study
This study, which attempts to investigate the impact of environmental
change on the socio-economic and livelihood of the surrounding people
and their adaptive responses, has some importances. Firstly, it provides
clue to the current controversies and discourses in the academic world
about human-environment relationships regarding “future without
limits” and “future with limit”. In other words, the result of this study
brings to light how human activities influence the bio-physical
environment which, in turn, influences the socio-economic well being of
human beings. Thus the study improves the understanding of the
problem at the local level.
Secondly, responses to resource depletion and environmental changes
may involve both sustainable and unsustainable practices. The findings
of this study identify determinants to household participation in water
conservation as responses by local people to environmental changes for
further remedy. On the other hand, the study discerns the unsustainable
practices. By so doing, it could uncover the causes and constraints to
such practices, and forwards corrective measures for implementation
both at the study site and elsewhere where there are identical problems.
Thirdly, the findings of this study can show the impacts of
environmental change. This could be of help in policy and institutional
8

intervention which may require the vulnerability levels as well as priority
settings of interventions in agriculture and health development. Thus the
outputs of this study can help in this regard.
Fourthly, the findings of this study can serve as a good input for forging
polices towards sustainable utilization and management of the country’s
resource base in general and its fresh water resources in particular.
1.5 Delimitation of the study
This study is conducted in Haramaya Woreda with the intent to analyze
the socio-economic and livelihood impacts and consequences on the host
population due to the sudden disappearance of a lake. The focus is on
the livelihood aspects of the rural households. Other aspects of the wider
community of the woreda are not considered. Besides, the ecological
impacts of the dryup of the lake are not considered in the study.
1.6 Limitations of the study
There were some unintended limitations to the findings of this study,
which was induced by the nature of the problem under investigation and
data sets.
Firstly, in line with the objectives of the study, time series data were
gathered by cracking the memories the respondents. The reliability of
9

such data depends mainly on respondents’ memory to the actual value of
the variable under investigation.
Secondly, some variables were treated as the determinants of
household’s implementation of water conservation measures as a
response to the water scarcity that was induced by the disappearance of
the lake. These were the socio-economic, institutional and demographic
variables that were hypothesized to have profound influence upon
household’s implementation of such practices as a response to the dryup
of the lake. Therefore the whole range of all determinant variables that
could affect water conservation by household are not considered as such
approaches requires further independent study of its own.
1.7 Organization of the paper
This research report comprises six chapters. Chapter one presents
introduction and statement of the problem as well as objectives and
significance of the study .Presented in this part are also delimitation and
limitation of the study.
The second chapter provides review of related literature pertaining to the
problem under investigation. Various publications having diverging and
converging views in different school of thought as well as empirical
10
findings by other scholars that are pertinent to the problem were
critically read and presented.
Chapter three presents research methodology. In this chapter, the study
design; types and methods of data collection; sampling method and
procedures are presented. Methods of data analysis that were adopted to
investigate the problem are also presented in this chapter.
The fourth chapter provides description of the study area and the study
population. Location and physical settings of the study area are
presented using available data and map. Besides, socio-economic and
demographic background of the study population is presented using
tables.
Chapter five provides results and discussion of the study. This is the
main body of the paper which presents results of data analysis and its
interpretations. It presents the direct services of the lake before it
disappeared; the induced impacts after it dried up; responses of the
households to the dryup and determinants of water conservation and
utilization measures as a response.
The last chapter provides conclusion and recommendation of the study.
11
CHAPTER TWO
2. REVIEW OF RELATED LITERATURE
2.1 Society- Environment inter-relationships
Increasingly, man-environment inter-relationships are being studied in
multi-disciplinary and integrated ways. There is overall necessity
because no society or community so far has managed to be a fully self-
contained complex without any links to its surrounding environment
(Tobin and Montz, 1997).
The ecological complex of communities has been analyzed by examining
interactions of five of its components. These are the environment,
population, culture, technology and organization. Any change in one of
these components will induce changes with respect to the others. Within
the five clusters of variables indicated, sets of relationships emerge
between the clusters. Besides, there may be exogenous factors in play,
including climatic change or ecological succession (to environment);
settlement by outside groups or people (to population); mission and
education (culture); development extension work (technology); indigenous
or induced administration (to organization) (Harper, 2004).
Ellen (1982) analyzed a large number of society-environment interactions
case studies to finally summarize endogenous dynamics of these
12

systems. Here, the assumption is that a society with given technology
and institution will, either through expansion and derived human
pressures on the environment (notably its renewable resource) or
through continuous exploitation of finite resource, reach a state of
scarcity of one or more of its key resources. This will induce adaptation
such as a shift to other resource; shift to other technology; resource base
outside of the society’s territory.
Changes in technology, organization and culture thus are seen as derived
from environmental bottlenecks in sustaining a given society. This view
is then seen as a dynamic model of environment-society interactions.
However, it is confined to endogenous developments in ecological
complex with no consideration to exogenous disturbances.
2.2 Human driving forces of environmental and ecological
changes
Ecological theory emphasizes that even in static ecological equilibrium
some changes and flux is the normal sate of affairs with regard to the
environment (Miller, 1998). However, environmental and ecological
changes today differ from those of the past. The pace of global
environmental changes has dramatically accelerated with the most
significant one now-a-days being anthropogenic (Southwick, 1996; Stern,
et al, 1992). Four types of human variables are proximate causes or
13

driving forces of environmental and ecosystem change. These are
population pressure; institutions, particularly political economies that
promote economic growth; culture, attitudes, beliefs including social
constructions and paradigms about environment; and technological
change (Stern et al, 1992). However, the implicit and often not very
implicit approach is Malthusian and/or Neo-Malthusian, which assume
a one -to- one straightforward relationship between population growth
and environmental degradation (Tegegne, 1995).
Within the physical environment, ecosystems and human social systems
are interconnected and interdependent but each ecosystem has its own
internal dynamics of equilibrium. Similarly, each human system has its
own sources of change apart from being embedded in ecosystems.
However, the interfaces within which the dynamics of human societies
become the proximate causes of ecosystem change and the parallel
interfaces between ecosystem change and the things that humans
depend on and value matters a lot (Harper, 2004).
2.3 Human consequences of Environmental change
Environmental change is neither environmental improvement nor
environmental degradation per se. It is the characteristics of the society
interacting with the physical phenomena that makes it to be either
resources or hazards (Meyer, 1996). Zimmerman (1951) discussed that
environmental and natural resources evolve from a three way interaction
14
of natural, human and cultural assets. In other words, resources are not
static but expand and contract in response to human wants and human
actions.
Deciding how desirable and undesirable an environmental change is
complicated by various factors. Firstly, a single environmental change
may incur multitudes of impacts that require accurate data. Secondly, in
one type of environmental change there are gainers and losers. Thirdly,
intervention costs are to be borne by various losers and gainers with
uncertainty. Lastly, the phenomena involve the presence of risk and
blames (Harper 2004). With the intimate interaction of human social
system with biophysical system, degradation or depletion of
environmental goods and services would lead to deterioration and final
collapse of the livelihood of the immediate population of that locality or
region. As a result, the precautionary principle of sustainable
development dictates that even in the absence of scientific data,
countries should adopt precautionary approach to environmental
changes.
Gaps in data and scientific understanding undeniably make it difficult to
achieve consensus on actions needed to solve environmental problems
and their impacts on wider community. Nevertheless, it is widely
acknowledged that environmental actions may be warranted even when
15
data and theories are incomplete (United Nations, 2001). It is in this
context that the precautionary principle, endorsed in 1992 at Rio de
Janeiro that actions should not wait until scientific evidence is in place,
As outlined in paragraph 35.3 of Agenda 21 (1992) “In the case of threats
of irreversible environmental damage, lack of full scientific evidence
should not be an excuse for postponing actions that are justified in their
own light. The precautionary approach could provide a basis for policies
relating to complex systems that are not yet fully understood and whose
consequences of disturbances can not be predicted”.
In the following section, a brief review of the human consequences of
environmental change will be made with reference to the shrinkage of
Aral Sea in Central Asia.
2.3.1 Impacts of Environmental change: A tale of Aral Sea
The Aral region includes the Aral Sea Basin; the basins of the Syrdarya,
Amudarya, Tedjen and Murgab rivers; the Karakumsky Canal; small
rivers running from the West Tien Shan and areas between the rivers
and around the Aral Sea.
In the early 1960s, the former USSR government decided to begin large
scale expansion of irrigation to increase cotton fruits and vegetables
productions, and boost meat and rice production to feed the growing
population. The new large scale irrigation and the application of chemical
16

inputs and other human impacts have caused intensive transformation
of the natural environment, economy and the population of the region
(Postel, 1996).
The total area of the sea decreased from 67,000 to 41,000 Km2 while the
rate of salinity increased from 10percent to 28-30 percent. The lowered
water levels in the rivers and in the sea have caused intensive
desertification of coastal and delta areas. Besides, the climate in the Aral
Region became more continental and the diversity of mammals has
decreased from 70 to 30 species and of birds’ form 173 to 38 while 54
plant species were endangered. Because of the shrinkage of the water of
the sea, the former coastal port cities became inland, and a large number
of people migrated to other areas (ibid: 17)
The human consequences and indicators have included the growth of
child mortality rate, which in some areas exceeded 110 per 1000.
Further more, disease and mortality rates have grown in adult
population and a significant decline in cotton crop yield and fishing, was
recorded (Postel, 1993). It is estimated that the remediation of the area
will cost approximately 37 billion Rubles.
17

2.4. Human Responses to Environmental Change.
2.4.1. Theoretical Considerations Various approaches have been taken to understand the behavior of
people before, during and after environmental changes and disasters.
They all attempt to make generalizations about the relationship between
perception and response and, in one way or another, they all address
those elements pertinent to human decision making, including economic,
social and political forces (Tobin and Montz, 1997). These approaches
are, however, neither independent nor mutually exclusive, but involve a
group of interacting forces which may be viewed and evaluated
differently. Thus discussion of the various approaches will help to
understand the complexities of the interactions involved.
2.4.1.1 Behavioral Approaches.
To examine the role and behavior of individuals in the context of
environmental change, researchers have frequently adopted a logical
positivist approach, leaning heavily on hypothesis formulation and
deductive agreement on assumptions regarding economically rational
behavior (Miller, 1998). Here the fundamental premise was that
individuals that face environmental shock would behave in an
economically rational way to maximize all outcomes. In other words,
individuals would analyze cost-benefit of their responsive actions and if
18
the benefits out weigh the cost of taking responsive measures, then this
would guide their behavior.
However, recognizing that such simplistic cost-benefit analysis could not
explain the decisions of most individuals and certainly could not account
for many seemingly odd activities found within environmentally stressed
zones, various models began to emerge under behavioral schools of
thought in the aim of explaining rigorously individual's responsive
behaviors to environmental change and resource scarcity.
Preference Models: This school of thought attempts to explain
individual behavior through "revealed" and "expressed" preferences, that
is, to document what people would do under given conditions of
environmental change and resource scarcity. Here, researchers have
adopted two broad themes. Firstly, in the revealed preferences approach
disaster victims have been surveyed to establish what they actually did
before and after environmental shock. In this way, preferences are
revealed and we can determine exactly how individuals responded to
specific shock and threats and their behavior can be related to the
cognitive (i.e. perception and attitudes) and situational (social, economic
and demographic) models (Tobin and Montz, 1997).
The expressed preferences approach, on the other hand, takes different
track. They argue that, since it is not always possible to interview
19
potential victims directly (in part because the event has not yet to occur)
it is plausible to look at what individuals perceive as acceptable behavior.
In other word, potential victims are asked to state a preferred choice of
action under a detailed or synthetic disaster conditions. Here the
problem is that individual does not always do what they say to do. This
is because expressed preferences by the individual are constrained by
socio-economic and political realities to be translated into action.
Utility Models: Burton, et al (1993) discusses individual behavior as a
choice process from among a limited number of alternatives. However,
they also point out that our understanding of these choice processes
(and hence behavior) is far from clear and might depend on socio-
economic factors. For instance, from economic perspectives, it is argued
that individuals assess all potential outcomes in a set of order to
determine the maximum outcome, termed as "expected utility model".
The assumption is that individuals have sufficient information and the
capacity to make "rational" decisions that will result in optimal outcome;
all decisions to respond to environmental change and resource scarcity
are thus maximized.
On the other extreme, a companion model, the "subjective utility model"
argues that individuals make choices based on subjective views of
probable outcomes, that is, decision making is constrained by personal
views or subjectivity of the individual. In the former model, economic
20

considerations prevail; in the later, other factors may influence decision
making. In situations of environmental change and hence resource
scarcity, individuals will consider a series of options and select those
actions perceived to provide the greatest benefit.
All these behavioral models in combination with socio-economic and
political realities on the ground would determine responsive behaviors
and then actions of individuals to environmental change and resource
scarcity.
2.4.1.2 Marxist Approaches
This approach argues that individual’s response to environmental change
and resource scarcity is influenced to greater extent by the political
economy than any other factors (e.g. Susman et al, 1983). They argue
that environmental change and subsequent resource scarcity affect
marginalized and poorer section of the community more than others. In
looking at the vulnerability to environmental change, it is clear that not
all individuals are equally vulnerable but rather that different classes,
groups or even countries experience different degree of risk. The poorer
are generally more vulnerable than the rich; their behavior is likely to be
different and recovery for this group is usually very different (IFRCRCS,
1993).
21

The Marxist approach therefore, focuses on the socio-economic and
politico-economic situations than behavioral or cognitive factors. With a
situational focus, differences in vulnerability can be explained in part
through the marginalization of groups and individuals within society in
which some are less powerful than others; while still a part of the
cultural wave of society, a group or individual is marginalized within the
prevailing power structure (Burton et al, 1993). This leads to greater
vulnerability of the poor to environmental changes as they are less likely
to respond. Besides, this section of the community is forced to occupy
environmentally degraded zones as population expands and resources
are controlled by a smaller minority. Thus, the cost of environmental
change is severe and recovery is slower for the poor than the rich.
2.4.2 Empirical Considerations Various factors that affect how people respond to environmental change,
and hence resource scarcity have been noted in numerous literatures
(e.g. Bosreup, 1965). At either community or individual levels, victims of
environmental change could have four response options: modify the loss
burden, modify the event, modify vulnerability and/or do nothing (Tobin
and Montz, 1997). However, the choice of any of these options is
explained by various factors at various levels (i.e. at individual, group
and community levels).
22

At the individual level, responsive action to environmental change is
influenced by individual trait such as age, gender and family structure
(Perry et al, 1984). Personal mobility, health, functional behavior and
personal experience can have impact on response to environmental
shocks (Solomon et al, 1987). Because personal characteristics can
either constrain or enhance individual activity, they must be included to
other socio-economic determinants of individual’s responsive action to
environmental stress.
At the secondary or group level, other factors come into play and affect
the individual level. Some variables include neighborhood
characteristics, level of social support and social involvement following
the disaster. For example it has been suggested that in habitants of
homogenous neighborhood have greater levels of social support to take
responsive measures within the social network than those isolated in
heterogeneous neighborhood (Russel et al, 1991; Solomon et al, 1987).
Finally at community level, distinction was made between urban and
rural dwellers. Various authors have explored the sociology of
community and differences. They argue that responses to resource
depletion by rural people varies greatly from that of Urban dwellers as
the value set and livelihood importance of the resource varies between
the two communities (Burton et al, 1993; White, 1974). Scale may also
23

be a significant factor influencing community responses. Large
communities have larger resource base compared to smaller units, but
demand on those resources are many and varied and hence response
also varies in comparison to small units (Tobin and Montz, 1997).
On the other hand, in the events of environmental shocks and hence
resource scarcity, people adopt various strategies that range from long-
term to short-term responses (United Nations, 2001). The long-term
strategy includes search for other forms of livelihood sourcing (e.g. off-
farm job), demographics (e.g. increase or decrease in fertility) or as
described by Boserup (1965) transformation from shifting cultivation to
sedentary farming. The short-term response could be conservation of the
existing or threatened resources to suffice their needs.
Implementation of conservation measures by the household as a
response to environmental change and hence resource scarcity is
influenced by various factors. Burton et al (1993) notes that household's
perception towards the depleting resource is the important variable that
influences its response through conservation practices. In other words,
households that anticipated the inevitability of change in resource size
are likely to make preparations to respond to its scarcity than those that
did not anticipate so. Besides, according to United Nations (2001),
households that have experience in community resource management
24

practices are likely to apply the same on their farm yard. The same
source also indicates that availability of input services to undertake
farming as well as conservation activities have important bearing not
only in conserving the resources at their disposal but also give wider
options to choose from.
Various literatures reveal that demographic and socio-economic profiles
of farmers have profound effect on the application of various
conservation techniques as response to depleting resources at their
disposal. Household size, labor- land ratio, land size, tenure security,
access to off-term income, policies and laws are few to mention (Dejene,
1996; Gideon, 2003; Koning and Smaling, 2002)
Studies have shown that households with small land holdings are more
likely to apply conservation measures than households with large
holding (Bahru, 1993). On the other extreme it is largely argued that
pressure on land would lead to reduction of fallow periods and overuse of
other land resources. Thus shortage of arable land may force households
to advance marginal lands and overuse of other land resources than to
conserve them (Yeraswork, 1995). Besides, land size is a source of wealth
and prestige. Households with large land size have thus adequate income
and wealth as well as risk takers to participate in conservation practices.
25
Large body of literature relates household size and conservation decision
by the household negatively. They argue those large households draw
labor from investment in conservation for search of food for survival
(Bekele and Holden, 1998; Bekele and Lars, 2002). The same literature
also shows that household labor size is negatively correlated with the
application of conservation techniques. They argue that, other things
being constant, large household size have large labor supply but they are
food insecure in most cases. Thus to ensure food security, they rush to
other income generating activities drawing labor away from investment in
conservation of resources.
Studies show mixed correlation between availability of off-farm income to
household’s application of conservation techniques as a response to
resource depilation. According to Alemu (2003), households with low off-
farm income are capable of investing in conservation measures where as
others hold this hypothesis positively and argue that households with
relatively high income are more risk takers to implement conservation
techniques than those with low income (Bekele and Lars, 2002).
With regard to households literacy status verses participation in
conservation of resources, studies reveal that literate households are
likely to conserve resources as they have general awareness about the
merits of the conservation of available resources they command (Barrow,
1995; Shibiru, 2002).
26

2.5 Conceptual Framework
As shown in the schematic conceptual framework overleaf, the overall
assumptions that guided this study are presented in Figure1.
Environmental change (i.e. the disappearance of Lake Haramaya) results
both direct and induced impacts upon the livelihood and institutional
wellbeing of the surrounding community. For the community to ensure
sustained livelihood, they have respond to such environmental shock.
However, the degree of success at household level depends on various
socio-economic, demographic and institutional factors. Therefore, the key
concepts of the model are socio-economic, demographic and institutional
factors and response of the household to the disappearance of the lake.
The socio-economic variables that could influence household response to
direct and induced impact include availability of off farm income, size of
land holding, literacy status and household anticipation to the dry-up.
On the other hand, institutional factors that may hinder or enhance
household response are credit supply, fertilizer use, tenure security and
social organization (e.g. participation in community resource
management). The demographic variables include household age,
household size and available labor force in the household.
Response in this context refers to activities undertaken by the household
to mitigate and / or control impacts induced by the disappearance of the
27

lake to sustain decent living. This could be conservation practices to
towards sustainable use of available resources and non conservation
measures such as search for off farm income, land intensification, out-
migration etc.
SUSTAINABLE ENVIRONMENTAL MANAGEMENT AND POLICY INTERVENTION
ENVIRONMENTAL CHANGE (Dryup of Lake Haramaya)
LIVELIHOOD AND INSTITUTIONAL IMPACTS
Source: Authors own construction
Figure 2. 1 Schematic representation of the Conceptual framework of the study
SOCIO-ECONOMIC -Land size -Off-farm income -Literacy status -Perception
INSTITUTIONAL -Service provision (Credit & Fertilizer) -Tenure security -Social organization (CRM)
DEMOGRAPHIC -Age -Household size -Labor size
-CONSERVATION MEASURES -NONCONSERVATION MEASURES
IMPACT CONTROL IMPACT
MITIGATION
DETERMINANTS OF HOUSEHOLD’S RESPONSES
28
Thus, the responsive measures by the household induced by resource
scarcity (disappearance of the lake) are explained by socio-economic,
institutional and demographic factors in the existing exogenous
economic and political environment.
Responses of the households may be sustainable conservation measures
to be adopted elsewhere or unsustainable practice that may cause
further environmental trauma. Therefore, to promote the sustainable
practices and control the unsustainable ones call for policy interventions.
Conversely, the existing policy frame work may shape the households
responsive measures. However, the scope of this study is limited to the
endogenous dynamics within livelihood impacts and household response
to the disappearance of the lake.
29

CHAPTER THREE
3. RESEARCH METHODOLOGY
3.1 Research design This study adopted a mix of both qualitative and quantitative research
design. Survey data were collected using personal interviews and focus
group discussion. In order to draw sample households, multi-stage
sampling procedure was employed. The results of the interviews and
focus group discussion, which comprise primary data, were analyzed
through quantitative and qualitative method of data analysis. Besides,
secondary data were also used to supplement findings by primary data.
The impact analysis of the lake’s disappearance was conducted by inter-
group comparison and time series analysis of the sample statistics of the
households located close to the lake and those located far away. On the
other hand, analysis of household’s responses to the disappearance of
the lake was explored through data generated from the households
located close to the lake as the impact is more clearly exhibited for these
households than the group located far away from the lake. The
examination of determinants of household’s implementation of water
reclamation measures (underground water reclamation, rainwater
30

harvesting or both) as a response to the dryup of the lake was
investigated only for those households located close to the lake.
For the sake of simplicity, households located close to the lake are
henceforth called ‘experimental group’ while those households located far
away from the lake are called ‘control group’. Thus it should be noted
that these references do not mean the actual experimental and ‘control
group’ of the experimental study design.
3.2. Sources of data and methods of data collection.
Both primary and secondary data were employed in this study.
A. Primary Data: These were collected via household survey and focus
group discussion. The household survey was conducted through oral
interviews (both structured and semi structured) from the sample
households. Before conducting the actual interview, questionnaires were
pre-tested to modify some of the questions which were either irrelevant,
missing or are out of context. Eight enumerators were recruited on the
basis of their academic performance and knowledge of the local language
to administer the structured interview.
Focus group discussion was conducted with elderly, officials of peasant
Association, staff of the agriculture and rural development. Three focus
group discussions, each comprising six to eight numbers, were
31
conducted. One is with the male elders in the sample Kebeles 2. The
other was with female housewives, and the third was with agricultural
experts from agriculture office.
B. Secondary Data; The secondary sources of information were collected
from published and unpublished works on agricultural production and
water resources in the study area. These were collected from regional,
zonal and woreda agriculture office as well as previous publication
related to the study area.
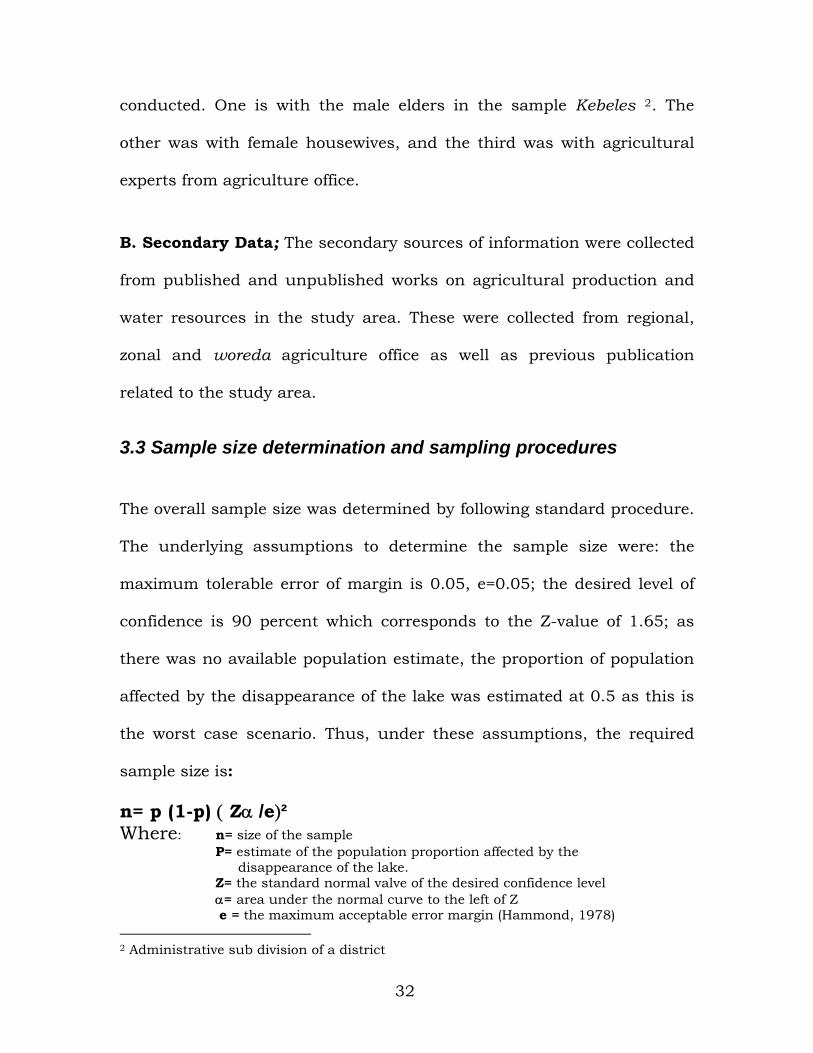
3.3 Sample size determination and sampling procedures
The overall sample size was determined by following standard procedure.
The underlying assumptions to determine the sample size were: the
maximum tolerable error of margin is 0.05, e=0.05; the desired level of
confidence is 90 percent which corresponds to the Z-value of 1.65; as
there was no available population estimate, the proportion of population
affected by the disappearance of the lake was estimated at 0.5 as this is
the worst case scenario. Thus, under these assumptions, the required
sample size is:
n= p (1-p) ( Zα /e)² Where: n= size of the sample
P= estimate of the population proportion affected by the disappearance of the lake. Z= the standard normal valve of the desired confidence level α= area under the normal curve to the left of Z
e = the maximum acceptable error margin (Hammond, 1978) 2 Administrative sub division of a district
32
Thus, the sample size determined under this procedure was found to be
268. However, due to time and resource constraints, only 200
households were considered as overall sample size for this study.
A two stage sampling method was used to draw the sample households
for the study. Firstly, the entire rural kebeles of Haramaya District were
divided into two strata, with rural kebeles bordering the lake basin
differentiated from those that do not. Later, one rural kebele was selected
randomly from each stratum. Thus Tuji-gabissa Kebele was selected for
the stratum that borders the lake while Ifa-batee kebele was selected for
the other stratum.
The random assignment of these 200 samples to each kebele was decided
proportionally based on the size of total household numbers of the
respective sample kebeles. Thus 126 households were to be assigned to
Tuji-gabissa kebele while the remaining 74 households were to Ifa-bate
kebele. This sample size makes 11.26 percent of the overall total number
of households in each Keble.
The sample frame that constituted the names of the household heads in
each kebele was obtained from their respective kebele office and random
numbers were assigned to each of them for selection. After random
selection of the 126 households for Tuji-gabissa and 74 houselds for Ifa-
33
bate kebeles, field survey was conducted by hired enumerators. At the
end, the interviewers were able to access 99 households for Tuji-gabissa
kebele and 60 households for Ifa-bate, while the remaining household
heads were not present during the days of field survey. At the end, 159
households (99 for Tuji-gabissa kebele, henceforth called ‘experimental
group’; and 60 for Ifa-bate, henceforth called ‘control group’) were
interview and their responses were supplemented with results of focus
group discussion for analysis.
3.4 Methods of data analysis The examination of households’ responses and opinions and statistical
comparison of variation in their incomes and other livelihood parameters
before and after the demise of the lake as well as determinants of
successful responses to such environmental shock was analyzed by
using both qualitative and quantitative methods of analysis.
Following the completion of data collection, data were cleaned, coded and
entered into SPSS 15.0 software programme for analysis. The specific
quantitative methods of analysis employed in this study include
descriptive, t-test for equality/inequality of means; chi-square test of
independence and logistic regression model.
Descriptive statistics and t-test were used to assess and investigate
variations in income, agricultural production and other livelihood
34
attributes lost due to the dryup of the lake in inter-group and time series
comparison of means over three years. This was hoped to provide insight
into the impact assessment of the dryup of the lake.
On the other hand, investigation into the responses of households to the
dryup of the lake was made using chi-square and logistic regression.
Here the assumption was that households responded to the dryup of the
lake by implementing water reclamation measures. Thus chi-square of
independence was employed to identify possible association between the
dependent variable and a set of explanatory variables whereas t-test was
employed for justifying equality/inequality of continuous variables in the
analysis.
Besides, logistic regression model was also used to investigate and
establish relationships between the dependent variable and a set of
predictor variables. This is a model which is much useful when the
dependent variable is a dichotomy (i.e. yes/no response) and the
independent variables are of any type (i.e. either categorical or
continuous or both).
Due to their proximity to the lake and severity of impact , analysis of
household's implementation of water reclamation measures as a
response to the dryup of the lake is more relevant for the ‘experimental
35

group’ than for ‘control group’. Therefore, logistic regression model and,
chi-square and t-tests were used for analysis only for the 99 households
that belong to ‘experimental group’.
On the other hand, qualitative data were analyzed by using triangulation,
compare and contrast and chronological methods, and were presented by
using narrative quotes. These were used to supplement the findings by
quantitative approach.
3.4.1 Model specification
In studies where respondents’ responses are dichotomous (e.g. yes or No)
such as participation in water reclamation measures, the appropriate
model to determine factors affecting the implementation of such a
practice is logistic regression model. The model was used to estimate the
probability of households participation in water reclamation measures
that takes either of the two values of Y=1 for implementation and Y=0 for
non-implementation. The functional presentation of the model is
presented below.
According to Gujrati (1988) and Hosmer and Lemeshow (1989), the
logistic distribution function for the use of water reclamation practices
can be specified as:
36

( ) ( )iZi eP −+
=1
1
Where P (i) is a probability of using water reclamation practice for ith
household and Z (i) is a function of m explanatory variables (Xi), and is
expressed as:
( ) mmi XXXZ ββββ ++++= K22110
Where 0β is the constant and iβ are the coefficient parameters in the
model. The coefficients tell how the log-odds in favor of using water
conservation practices change as independent variables change by a
unit.
Therefore, in this study the binary logistic distribution function (logit)
model is selected. The model dictates that the probability of changes in
dependent variable for a unit of independent variable varies between 0
and 1. In other words, the probability that a given household implements
water reclamation measures is 1 and 0 if the household did not. Thus a
chance for the household to be between 1 and 0 (participants and non
participants in water reclamation) is a function of various independent
variables. Put it another way, the model identifies the contribution of
each independent variable to water reclamation measures by a
probability value between 0 and 1.
37

3.4.2 Hypothesis and Definition of variables
Dependent variable: -Household's implementation of water reclamation
measures as a response to the existing water scarcity following the
disappearance of the lake. This includes underground water reclamation,
rainwater harvesting or both. The responses are Yes= 1 and No =0.
Explanatory variables
Age: - Age of the household head has important bearings in the
implementation of conservation measures. The age of a farmer can
enhance or prevent the implementations of water reclamation measures.
With age, a farmer may get experience about his/her farm and can react
in favor of adoption of the practice (Young and Shortle, 1984). On the
contrary, as evidenced by previous research results, older farmers are
more likely to reject conservation practices (Gould et al, 1989). Thus
household head age is expected to have positive or negative effect on the
implementation of conservation measures.
Literacy Status: -. Literacy status of the household head was assumed
to increase households’ ability to obtain, process, and use information
relevant to implement water reclamation measures. Literate households
are therefore expected to have higher probability of implementation of
water reclamation measures.
38
Household Size: - Household size is an important determinant factor in
household's participation in water reclamation measures. This is because
large households have sufficient labor required for water reclamation
activities. Thus large household size was hypothesized to have positive
and direct association with participation in reclamation measures.
Land Size: - Land size is an important proxy to wealth and prestige.
Households with large landholding are rich enough to purchase inputs
required for reclamation measures and also they are risk takers than
their poor counterparts. Thus households with large landholding were
hypothesized to have positive and direct correlation with implementation
of reclamation measures.
Off-farm income: - Households with access to off-farm income could
have surplus financial assets to implement conservation measures than
those that do not. Households with off-farm income were hypothesized to
have positive correlation to water reclamation practices than those that
do not have off-farm income.
Participation in Credit: - Since credit service enables household to
purchase inputs needed for water conservation practices, participation in
credit service was hypothesized to have positive correlation with water
reclamation measures than those that did not.
39

Fertilized Use: Household's decision to invest in fertilizer use could be
an opportunity cost to its investment in water reclamation measures.
Hence the use of purchased fertilizer by the household was hypothesized
to have negative correlation with participation in water reclamation
practices.
Perception: - Is whether the household head had imagined Lake
Haramaya to dryup before its actual disappearance. Household heads
that had perceived the inevitability of the disappearance of the lake could
have made prior preparedness to response to the actual disappearance of
the lake, and hence were hypothesized to participate in water
reclamation measures more likely than those that did not have such
perception.
Participation CRM: - Participation in CRM could have positive impact in
implementation of similar measure on individual’s own farm. Because
individuals participating in such activities could have rich experience
and have technical exposure. Thus participation in CRM was
hypothesized to have positive correlation with participation water
reclamation in measures by the households.
40

Table 3. 1 Definitions of Variables
Variable name Description Dependent variable Implementation of Whether a household implements under ground Water reclamation water reclamation, rainwater harvesting or both; Measures 1 if implements and 0 otherwise Independent variables AGE Whether the Age of the household head above or
below the median age (38 years); 1 if above the median and 0 if below the median
HOUSEHOLD SIZE Number of persons in the household LITERACY STATUS Literacy status of the household head; 1if
literate and 0 otherwise LAND SIZE size of landholding in timad3 OFFINCOM Whether a household is engaged in off-farm
employment; 1 if a farmer has off-farm employment and 0 otherwise
ACCESS TO CREDIT Whether a household has access to credit; 1 if has access to credit and 0 otherwise FERTILIZER USE Whether a household uses fertilizer or not; 1 if
he/she uses fertilizer and 0 otherwise PERCEIVE Whether a household anticipated the
disappearance of the lake; 1 if household had anticipated and 0 otherwise
PARTICIPATION IN CRM Whether a household participated in CRM; 1if a household participated and 0 otherwise
Source: Author’s own construction
3 A local unit of land measurement equivalent to 0.25 hectare
41
CHAPTER FOUR
BACKGROUND TO THE STUDY AREA
4.1 Description of the Study Area
4.1.1 Location and physical settings
Haramaya district is located in eastern highlands of Ethiopia. The main
town of Haramaya is found on the main road form Addis Ababa at a
distance of 510km.Its astronomical location lies roughly between 90 201-
90 351 North latitude and 410 511- 420- 041 East longitude. Haramaya
district is bordered in the west and southwest by Kersa and Kurfachele
districts; in the north and northwest by rural Dire Dawa and Kombolcha.
The east, southeast and southern limits of the district is bordered by
rural Harari and Fedis district (see Fig 4.1)
The district has the total area of 550 km2 and comprises three smaller
towns; namely Haramaya (the main town), Adele and Bate. In addition,
there are 33 rural kebeles in the district.
Haramaya district is noted for its intensive agricultural practices and
cropping system. The dominant staple crop produced is sorghum where
as the dominant cash crop is chat4 (Shibiru, 2002). The district is also
4 A plant with a mild stimulant leaves commonly used in East African highlands and Arabian Peninsula
42

noted for its rich fresh water resource. Before its disappearance Lake
Haramaya was a vital source of water for drinking, washing, irrigation,
recreation, etc. to the people of the district and surrounding towns and
institutions. That is why the central theme of this research is devoted to
assess the impact of the disappearance of this lake up on surrounding
population, and the later response to such environmental catastrophe.
Source: Own construction using available data
Figure 4. 1 Map of the Study Area
43

a) Climate
Haramaya district lies between 1900 to 2450 m.a.s.l. These altitudinal
ranges gave the district Dega5 and Woinadega6 agro-ecological zones.
The mean annual rainfall is 74.1mm, with mean annual temperature of
16.90c. The dry season, with relatively less than 30 mm of rain fall per
month, extends from October to February. The main autumn rain occurs
from September to November while the smaller spring rain occurs from
March to May.
b) Geology and Soil
The present land forms that shaped Haramaya district are the product of
the late geologic activities and processes of Mesozoic era coupled with
Cenozoic events. Thus the layers of sedimentary deposits here and there
in the eastern high land of the country including Haramaya are products
of these geologic events. Old crystalline rocks, granite, and to a lesser
extent mica schist are particularly exposed on the surface through out
the district (Mohr, 1960).
Much of the agricultural soils in the catchments are very shallow
(Tamire, 1980 cited in Chalachew, 2004). There are five major types of
soils in the catchments; namely, Lithosols, Regosols, Cambisols,
Fluvisols and Vertisols. The Regosols are the dominant in the catchments
5 The traditional agro ecological zone for areas lying between 2300-3300m.a.s.l 6 The traditional agro ecological zone for areas lying between 1500-2300m.a.s.l
44

while Cambisols cover larger areas around the lake from the southwest of
west (Solomon, 2002)
c) Resource base
Haramaya district is rich in water resource. It had a fresh water lake
called Lake Haramaya from which the district got its name. Lake
Haramaya comprises Haramaya (the main), Adele and Langhay. Elders in
the area narrate that these three lakes were once adjoined as a single
lake. Studies based on aerial photographs and the bathymetric surveys
demonstrate that the main lake among these three parts of Lake
Haramaya had the surface area of 4.13 km2 in 1965. In 1996, it shrunk
to 2.03Km2, and in 2001, it became 1.79 km2 (Solomon 2002),
ultimately, it disappeared in 2004/05.
The causes of the disappearance of Lake Haramaya have been mentioned
in many literatures. Some account it to ever growing population
pressure, while still others blame climate change. The debate still goes
on but one thing is real: the lake has gone. Therefore, a repercussion of
the disappearance of the lake and the response by the surrounding
community is the main concern of this study.
45
4.1.2 Socio- demographic profile a) Age-sex composition
According to CSA, 1996a, Haramaya district had a total population of
147,260 as of 1994. Females constitute slightly less than half (49
percent) of this population. The sex ratio was 104 males for every 100
females. Nearly 87.4 percent of this population is rural population.
b) Ethnic composition
The dominant ethnic group of the district is the Oromo which make 96
percent of the total population, followed by the Amhara (3.12 percent).
Guraghe take third position by 0.36 percent while Harari make 0.16
percent of the total population (CSA, 1996)
c) Religious Composition
According to CSA, 1996, Islam is the dominant religion in the district
(95.82 percent) followed by Orthodox Christian (3.11 percent)
4.2 Background Characteristics of the Study Population Socio-economic and demographic characteristics of the study population
have important bearing on the way communities utilize their resources
sustainably and respond to changes in resource base. Evidences reveal
that respondents in certain socio- economic group and with certain
demographic characteristics are likely to respond to environmental
changes than their counterparts. Therefore, in the preceding section, the
socio- economic and demographic characteristics of the sample
population will be presented and analyzed.
46
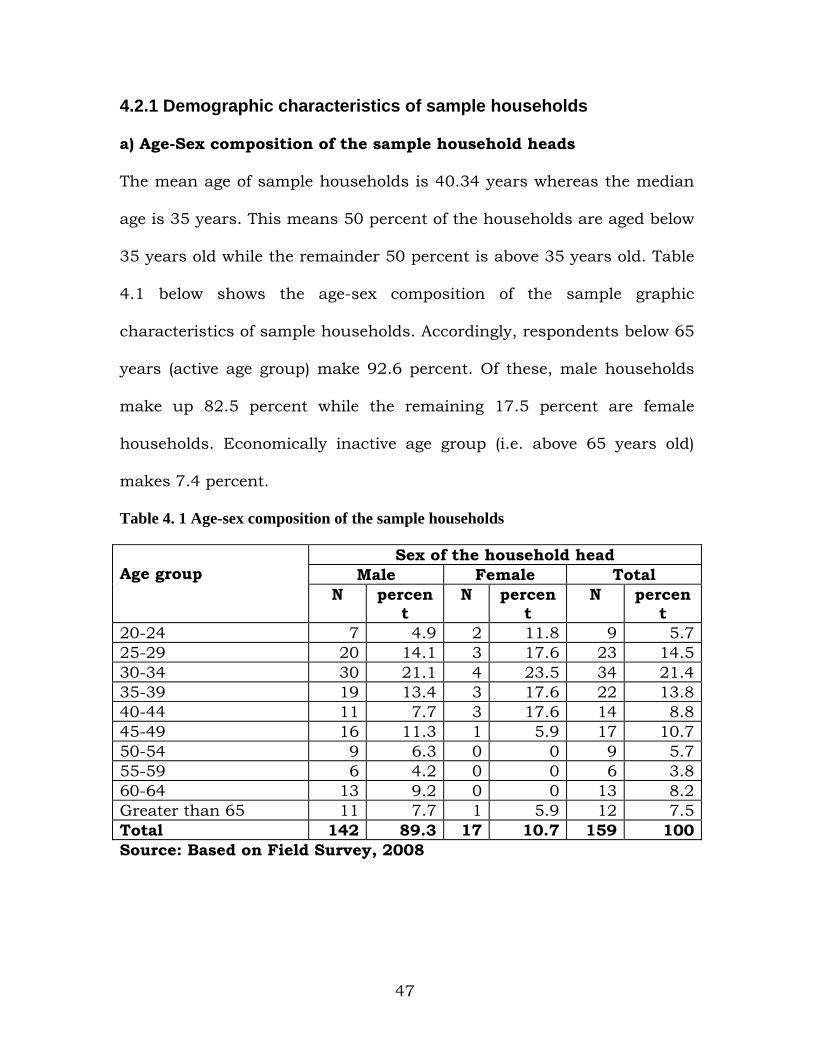
4.2.1 Demographic characteristics of sample households a) Age-Sex composition of the sample household heads
The mean age of sample households is 40.34 years whereas the median
age is 35 years. This means 50 percent of the households are aged below
35 years old while the remainder 50 percent is above 35 years old. Table
4.1 below shows the age-sex composition of the sample graphic
characteristics of sample households. Accordingly, respondents below 65
years (active age group) make 92.6 percent. Of these, male households
make up 82.5 percent while the remaining 17.5 percent are female
households. Economically inactive age group (i.e. above 65 years old)
makes 7.4 percent.
Table 4. 1 Age-sex composition of the sample households
Sex of the household head Male Female Total
Age group
N percent
N percent
N percent
20-24 7 4.9 2 11.8 9 5.7 25-29 20 14.1 3 17.6 23 14.5 30-34 30 21.1 4 23.5 34 21.4 35-39 19 13.4 3 17.6 22 13.8 40-44 11 7.7 3 17.6 14 8.8 45-49 16 11.3 1 5.9 17 10.7 50-54 9 6.3 0 0 9 5.7 55-59 6 4.2 0 0 6 3.8 60-64 13 9.2 0 0 13 8.2 Greater than 65 11 7.7 1 5.9 12 7.5 Total 142 89.3 17 10.7 159 100 Source: Based on Field Survey, 2008
47

b) Marital status of the sampled household heads Variations in marital status have an important bearing on the size and
structures of households. Table 4.2 presents data on marital status of
the sample population. As indicated in the table, 88.1 percent of the
respondents were married. Analysis of the same data indicate that 97.5
percent of the sample population were ever married (i.e. married,
divorced, separated) while the remaining 2.5 percent were single.
Table 4. 2 Marital status of the sample households Marital Status N percent Married 140 88.1 Single 4 2.5 Divorced 2 1.3 Separated 13 8.2 Total 159 100.00 Source: Based on Field Survey, 2008 c) Household size of the sample household
Household size of the sample population has been indicated on table 4.3
below. Accordingly, the mean household size of the sample population is
computed to be 5.7 with the median household size of 6. On the other
hand, 13.2 percent of the households have three and less members.
Household size group of 4-6 make the largest proportion (59.7 percent) of
the sample population. This implies that nearly 86.8 percent of rural
households have at least four house-hold members (see table 4.3).
48
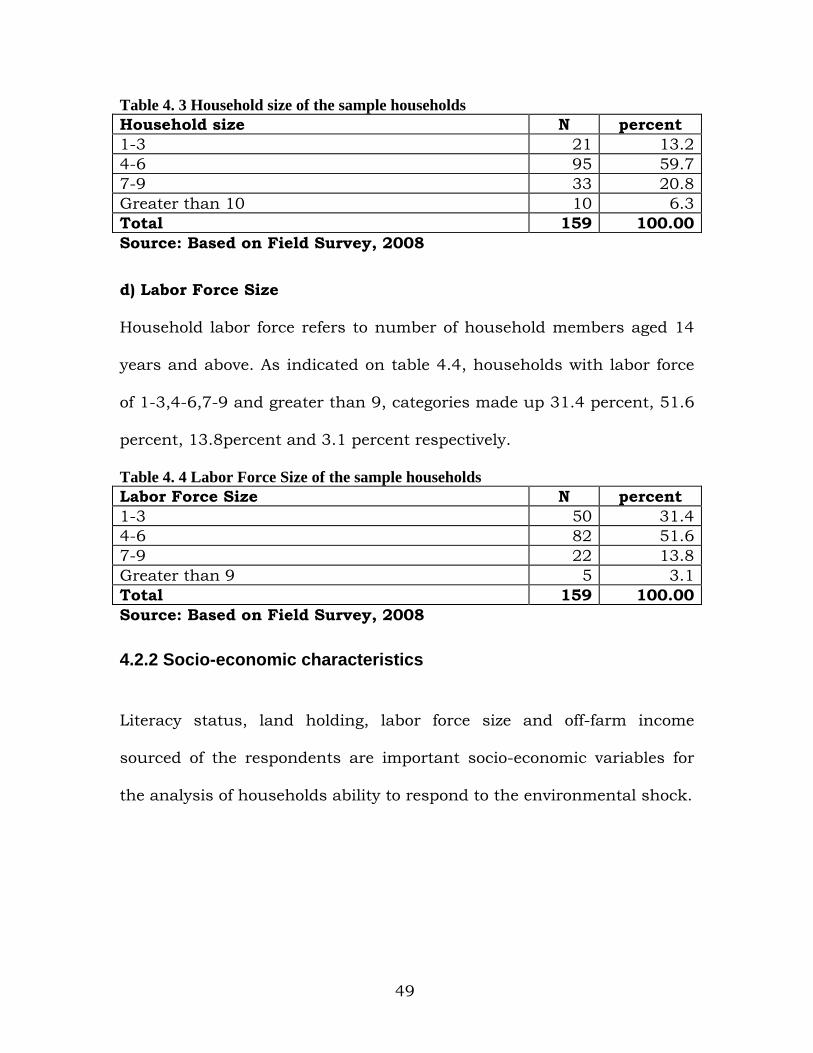
Table 4. 3 Household size of the sample households Household size N percent 1-3 21 13.2 4-6 95 59.7 7-9 33 20.8 Greater than 10 10 6.3 Total 159 100.00 Source: Based on Field Survey, 2008 d) Labor Force Size
Household labor force refers to number of household members aged 14
years and above. As indicated on table 4.4, households with labor force
of 1-3,4-6,7-9 and greater than 9, categories made up 31.4 percent, 51.6
percent, 13.8percent and 3.1 percent respectively.
Table 4. 4 Labor Force Size of the sample households Labor Force Size N percent 1-3 50 31.4 4-6 82 51.6 7-9 22 13.8 Greater than 9 5 3.1 Total 159 100.00 Source: Based on Field Survey, 2008
4.2.2 Socio-economic characteristics
Literacy status, land holding, labor force size and off-farm income
sourced of the respondents are important socio-economic variables for
the analysis of households ability to respond to the environmental shock.
49
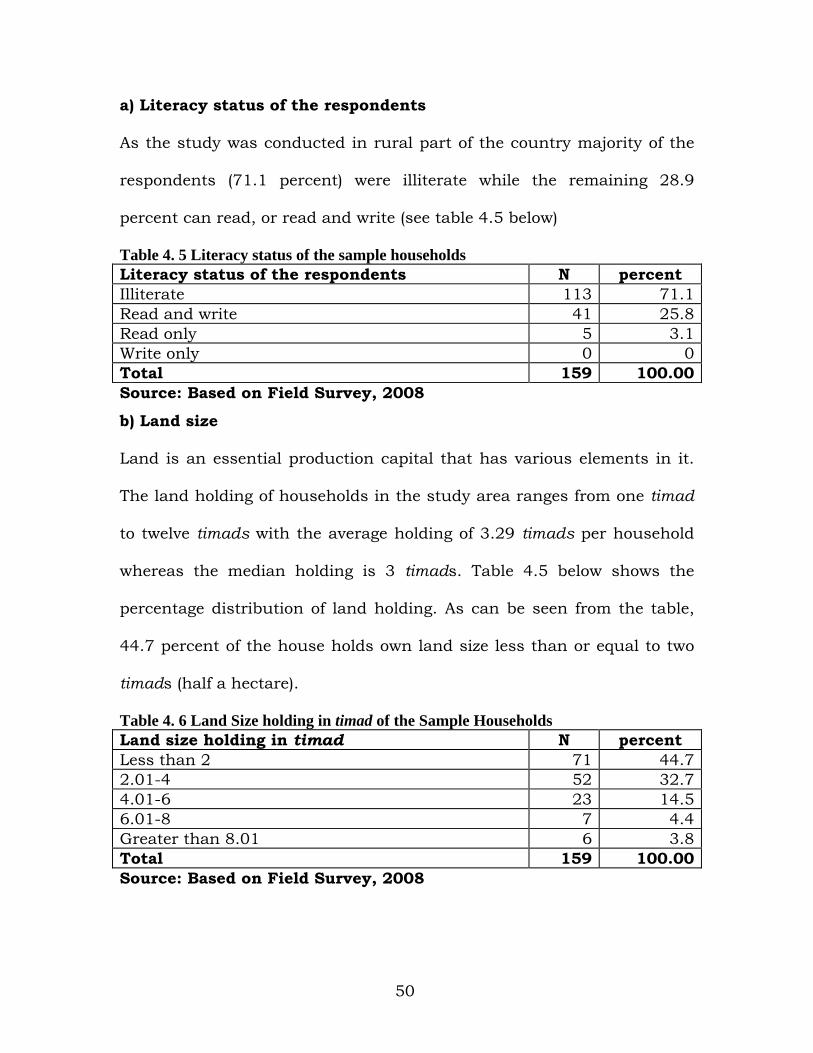
a) Literacy status of the respondents
As the study was conducted in rural part of the country majority of the
respondents (71.1 percent) were illiterate while the remaining 28.9
percent can read, or read and write (see table 4.5 below)
Table 4. 5 Literacy status of the sample households Literacy status of the respondents N percent Illiterate 113 71.1 Read and write 41 25.8 Read only 5 3.1 Write only 0 0 Total 159 100.00 Source: Based on Field Survey, 2008 b) Land size
Land is an essential production capital that has various elements in it.
The land holding of households in the study area ranges from one timad
to twelve timads with the average holding of 3.29 timads per household
whereas the median holding is 3 timads. Table 4.5 below shows the
percentage distribution of land holding. As can be seen from the table,
44.7 percent of the house holds own land size less than or equal to two
timads (half a hectare).
Table 4. 6 Land Size holding in timad of the Sample Households Land size holding in timad N percent Less than 2 71 44.7 2.01-4 52 32.7 4.01-6 23 14.5 6.01-8 7 4.4 Greater than 8.01 6 3.8 Total 159 100.00 Source: Based on Field Survey, 2008
50

c) Labor - Land ratio
Information pertaining to the sample households’ labor- land ratio is
presented in table 4.7 below. As can be seen nearly 70 percent of the
households have a labor-land ratio less than 2.00 where as the
remaining 29.2 percent of the households had labor- land ratio of greater
than 2.
Table 4. 7 Labor - Land ratio of the sample households Labor - Land ratio N percent Less than 2 111 69.8 2.01-4 32 20.1 4.01-6 13 8.2 6.01-8 2 1.6 Greater than 8.01 1 0.6 Total 159 100.00 Source: Based on Field Survey, 2008
d) Off-farm income
Off-farm income, in the context of this study, refers to any income
obtained by the households from non- agricultural activities. These may
contribute or hinders household's ability to respond to the disappearance
of the lake. To this end, respondents were asked whether they had
participated in off-form activities along with the income they obtain.
Table4.8 below presents the percentage distribution of the sample house
holds by off-farm income. Accordingly, only 20.1 percent of the sample
population was involved in off-farm activities.
51
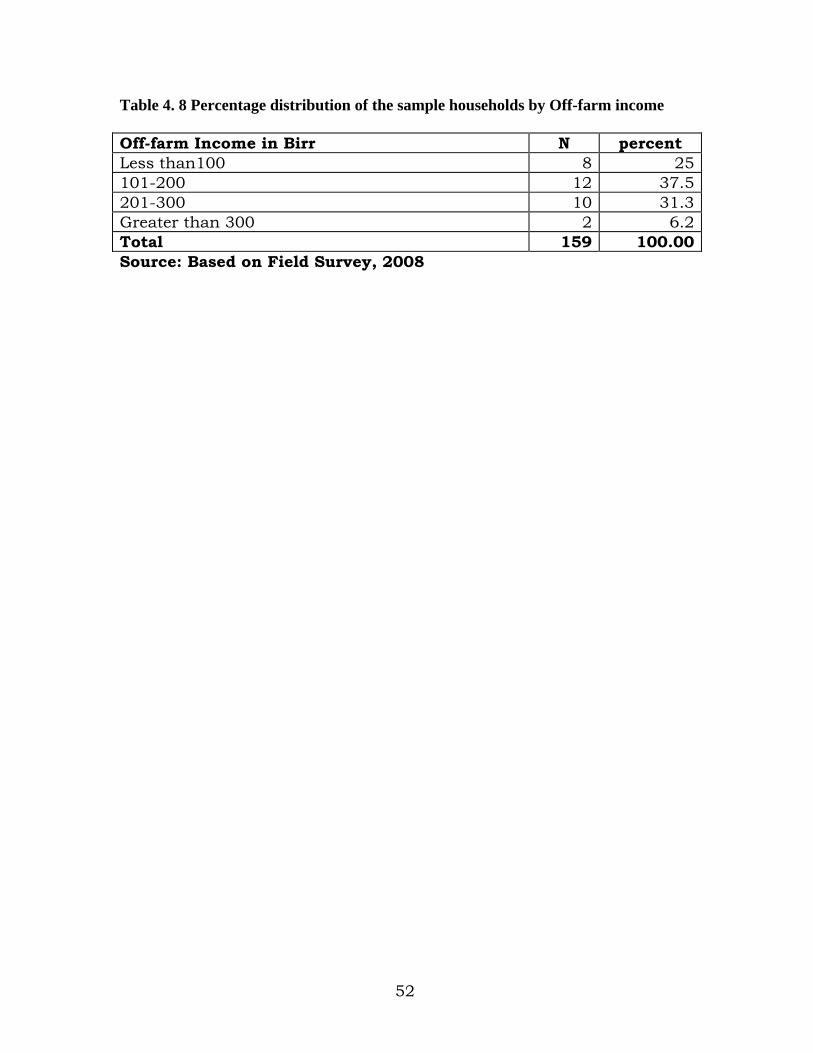
Table 4. 8 Percentage distribution of the sample households by Off-farm income Off-farm Income in Birr N percent Less than100 8 25 101-200 12 37.5 201-300 10 31.3 Greater than 300 2 6.2 Total 159 100.00 Source: Based on Field Survey, 2008
52

CHAPTER FIVE
RESULTS AND DISCUSSION This chapter is broken down into four major components. The first part
provides the description of the direct utilities that the sample households
used to obtain from the lake. The second part provides an in-depth
impact analysis of the disappearance of Lake Haramaya on the
surrounding rural communities. This is followed by the empirical
exploration of the households' response to such environmental shock.
The last part presents findings on the investigation into socio-economic
and demographic characteristics of the households versus participation
in water conservation and utilization practices in response to water
scarcity that came as a result of the disappearance of the lake.
5.1 Direct utilities of the lake before disappearance Direct or indirect; tangible or intangible services of freshwater ecosystem
such as the disappeared Lake Haramaya are difficult to quantify.
However, attempts have been made to record and document the services
of the lake as reported by the respondents.
Table 5.1 overleaf presents the services that the sample households used
to obtain from the lake before its disappearance. Accordingly, the largest
proportion of the respondents (25.3 percent of the responses and 70.1
53
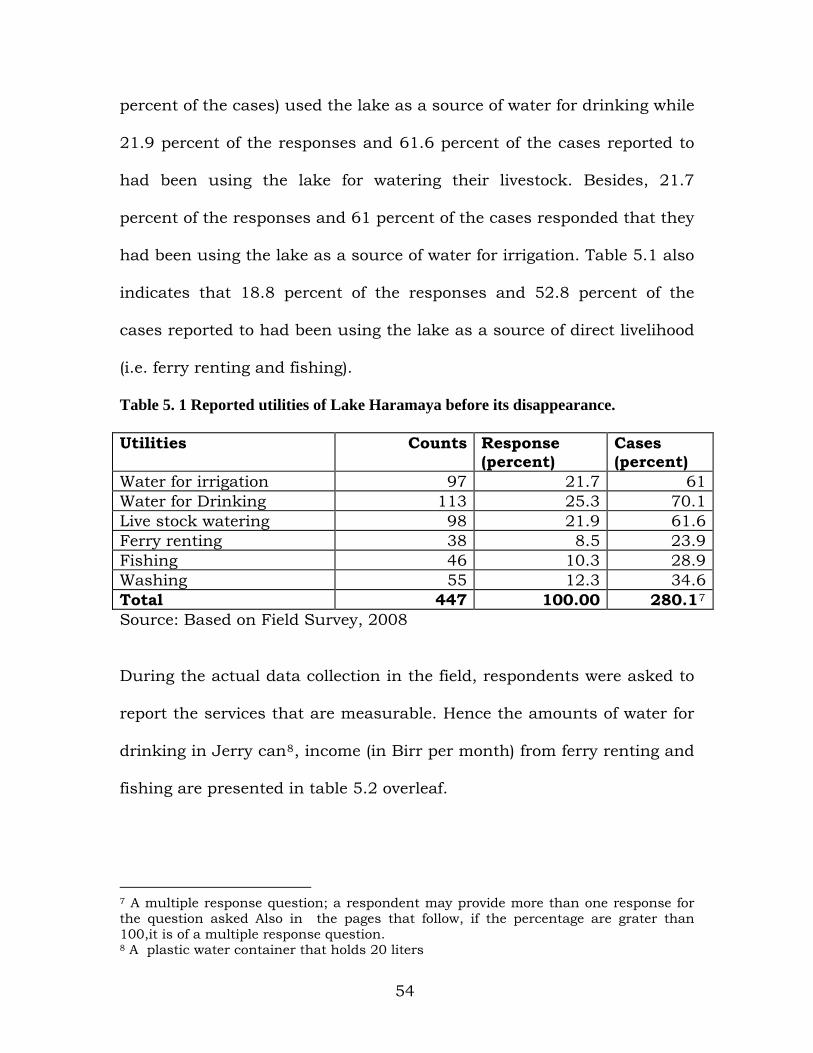
percent of the cases) used the lake as a source of water for drinking while
21.9 percent of the responses and 61.6 percent of the cases reported to
had been using the lake for watering their livestock. Besides, 21.7
percent of the responses and 61 percent of the cases responded that they
had been using the lake as a source of water for irrigation. Table 5.1 also
indicates that 18.8 percent of the responses and 52.8 percent of the
cases reported to had been using the lake as a source of direct livelihood
(i.e. ferry renting and fishing).
Table 5. 1 Reported utilities of Lake Haramaya before its disappearance. Utilities Counts Response
(percent) Cases (percent)
Water for irrigation 97 21.7 61 Water for Drinking 113 25.3 70.1 Live stock watering 98 21.9 61.6 Ferry renting 38 8.5 23.9 Fishing 46 10.3 28.9 Washing 55 12.3 34.6 Total 447 100.00 280.17
Source: Based on Field Survey, 2008
During the actual data collection in the field, respondents were asked to
report the services that are measurable. Hence the amounts of water for
drinking in Jerry can8, income (in Birr per month) from ferry renting and
fishing are presented in table 5.2 overleaf.
7 A multiple response question; a respondent may provide more than one response for the question asked Also in the pages that follow, if the percentage are grater than 100,it is of a multiple response question. 8 A plastic water container that holds 20 liters
54
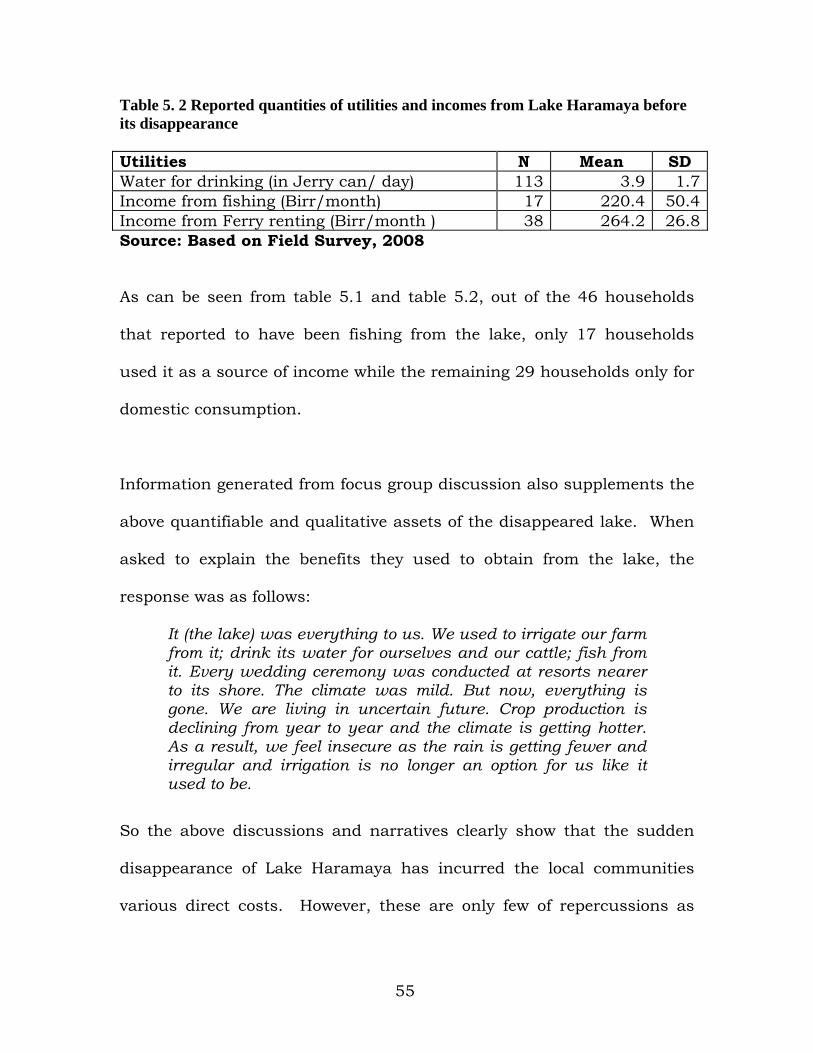
Table 5. 2 Reported quantities of utilities and incomes from Lake Haramaya before its disappearance Utilities N Mean SD Water for drinking (in Jerry can/ day) 113 3.9 1.7 Income from fishing (Birr/month) 17 220.4 50.4 Income from Ferry renting (Birr/month ) 38 264.2 26.8 Source: Based on Field Survey, 2008
As can be seen from table 5.1 and table 5.2, out of the 46 households
that reported to have been fishing from the lake, only 17 households
used it as a source of income while the remaining 29 households only for
domestic consumption.
Information generated from focus group discussion also supplements the
above quantifiable and qualitative assets of the disappeared lake. When
asked to explain the benefits they used to obtain from the lake, the
response was as follows:
It (the lake) was everything to us. We used to irrigate our farm from it; drink its water for ourselves and our cattle; fish from it. Every wedding ceremony was conducted at resorts nearer to its shore. The climate was mild. But now, everything is gone. We are living in uncertain future. Crop production is declining from year to year and the climate is getting hotter. As a result, we feel insecure as the rain is getting fewer and irregular and irrigation is no longer an option for us like it used to be.
So the above discussions and narratives clearly show that the sudden
disappearance of Lake Haramaya has incurred the local communities
various direct costs. However, these are only few of repercussions as
55

there have been many induced impacts discussed in the proceeding
section.
5.2 The induced impacts Following environmental change as the dryup of Lake Hararmaya various
induced socio-economic impacts could set in. Various literature reveal
that in the event of the scarcity of environmental goods such as water,
fuel-wood etc, different social disasters would follow those conditions,
especially in the rural households of the Third World and elsewhere (e.g.
Desgupta, 1992; Livernash, et al 1998). For instance child labor use is
found to be positively correlated with the scarcity of those environmental
goods.
In this section the induced impacts of the change upon the livelihood of
the community is analyzed. This includes conflict over resource use,
impact on farmland under irrigation, change in agricultural production
and household income.
5.2.1 Conflict over resources use During the field survey, respondent households were requested to report
the frequency of the incidents of conflict with other household heads over
resource use; particularly water resource. The result has indicated an
impressive surge of conflict over water use in 2006/07. Table 5.3
56

presents frequencies of conflict by resource type over three years (i.e.
2005, 2006 and 2007).
Table 5. 3 Households' incidents of conflict over resource use Conflict by resource type Frequency of incidents of conflict
Water Land Livestock Year Frequency N percent N percent N percent
Once 4 2.5 2 1.2 1 0.6 Twice - - 1 0.6 - -
2005
More than twice 1 0.6 - - - - Total 5 3.1 3 1.8 1 0.6
Once 7 4.4 3 1.8 3 1.8 Twice 2 1.2 - - - -
2006
More than twice 2 1.2 - - - - Total 11 6.8 3 1.8 3 1.8
Once 14 8.8 8 5 - - Twice 8 5 2 1.2 - -
2007
More than twice 3 1.8 - - - - Total 25 15.7 10 6.2 - -
Source: Based on Field Survey, 2008
Conflict over water use showed steady increase from 3.1 percent in 2005
to 15.7 percent in 2007 in aggregate comparison to other resources. This
is mainly because of the prevalent shortage of water for irrigation after
the lake had dried up. To further elaborate this argument chat is the
dominant cash crop that is also consumed virtually by all households.
However, chat growing requires continuous supply of water. During the
time when the lake was in existence, this supply was sustained by the
withdrawal of water from the lake to irrigate chat. It was learned from
focus group discussion that during the times when the lake was there,
households near the lake and those on the upper catchments irrigate
their farm through relay of motor pumps that pump water to far away
57
farms. However, when the lake dried up, those near the lake began
digging water bore holes on the former floor of the lake. This time, those
households in upper catchments were sidelined as the water becomes
insufficient, and the water table is dropping sharply. This is the source of
contention between lower and upper catchment’s farming households.
On the other hand, the conflict is not limited between farmers alone. It
goes far beyond. When asked to explain causes of conflict over water use,
the response of the focus group discussion was as follows:
All our problems are rooted to the urban dwellers. They used up the water of the lake freely for decades. And now the lake has dried up. They have now turned to underground water. The level of water in bore holes on which we depend for irrigation and drinking is falling from day-to-day. We don't have shops and business enterprises as they do. Our life is tied merely to farming…
In fact, Lake Haramaya was the source of water supply for residents of
Harar city. When the lake disappeared, the Harari Water and Sewerage
Authority had dug numerous water bore holes to supply water to city's
residents by transporting water through tanker trucks. Even before the
disappearance of the lake, there had been reports of farmers breaking
the water pipes to Harar city and use the water for irrigation. There were
even legal interventions to such acts where farmers are still in Jail. This
contentious scenario can be supplemented by a report on the weekly
Fortune which described the problem clearly as: “A group of rogue
farmers was accused of sabotaging water pipes which are the city's
58
(Harar) main water source, breaking connections and siphoning off the
escaping water for irrigation purposes. A few of the farmers are still in
jail …" (Fortune March 30, 2008; 54). Therefore, the conflict and
contentions are not limited only among the farming households.
5.2.2 Change in farmland under irrigation cover One of the most important services of Lake Haramaya to its surrounding
communities was the provision water for irrigation to produce chat and
vegetables in particular, and other annual crops in general. Therefore, in
this section of the paper, impact of the disappearance of the lake on the
household's land under irrigation cover is analyzed. Firstly, time series
analysis of change in mean land size under irrigation for the total 159
households over three years (2005, 2006 and 2007) is examined. This is
followed by inter-group comparison and analysis of the same variable for
‘experimental’ and ‘control’ groups to get a more convincing picture and
insight into the impact of the disappearance of the lake on land under
irrigation.
During the field study, households were interviewed to report proportion
of their landholding under irrigation for the three consecutive years (i.e.
in 2005, in 2006 and in 2007). The result was a dramatic decline in the
mean land size under irrigation from 2005 to 2007. Table 5.4 below
presents the mean land size under irrigation from 2005 to 2007 for 159
59

sample households. As can be seen from the table, the average land size
under irrigation in 2005 was 1.2233 timad while it was reduced to
0.7830 timad for the year 2006. This indicates a decrease by 0.4403
timad or a 36 percent drop taking the mean of preceding year as a base.
Table 5. 4 Average proportion of land under irrigation in 2005, 2006 and 2007
Year Mean (in timad)
SD Mean Difference Percentage Decrease
2005 1.2233 1.43 - - 2006 0.7830 1.13 0.4403 36 2007 0.7390 1.11 0.044 5.6 Source: Based on Field Survey, 2008
Table 5.4 shows all lands under irrigation cover irrespective of water
sources that was used for irrigation. In other words, households may
irrigate their land using water of the lake (before and during 2005) or
they may use underground water or even rain water harvesting as a
source of water for irrigation. However, when mean differences between
preceding years are compared, there is considerable difference between
the mean of 2005 and that of 2006. On the contrary, the mean difference
between 2006 and 2007 is small (i.e. 5.6percent) in relation to that of
2005 and 2006(i.e. 36 percent).
Statistical significance of these mean differences was justified by using t-
test. Thus the mean difference of the irrigated land for 2005 and 2006
was found to be statistically significant at 99 percent confident level
where as that of 2006 and 2007 was statistically insignificant (see Table
60

5.5). This means that there is significant difference between mean
irrigated land in 2005 and in 2006. On the contrary, the mean land size
under irrigation in 2006 and that of 2007 is statistically not significant.
Table 5. 5 Paired sample test of the mean area of land under irrigation between 2005 to 2006 and 2006 to 2007 Paired mean
Mean difference SD t-value Significance
2005-2006 0.44023 .848 6.548*** 0.000 2006-2007 0.04403 .366 1.516(NS) 0.132 Source: Based on Field Survey, 2008
Note: *** significant at 1percent, NS not significant This glaring difference of the average irrigated land size in 2005 and the
proceeding years (i.e. 2006 and 2007) requires further scrutiny and
analysis to clearly explain whether the difference is due to the
disappearance of the lake or other factors.
By conventional wisdom, it is agreed that the accessibility to utilization of
the water of the lake for irrigation purpose declines with the distance of
households’ location from the nearest shore of the lake. Thus the
averages size of land under irrigation for households located near the
shore of the lake (‘experimental group’) were compared with that of those
located far away (‘control group’) over the three years (2005, 2006 and
2007). This comparison between the two groups would help to infer how
the disappearance of the lake accounted for the dramatic decrease in
mean land size under irrigation. In addition it also helps to show how the
lake was prominent source of water for irrigation for the ‘experimental
61

group’ than the ‘control group’. Table 5.6 below shows the mean area of
farmland under irrigation for these two groups for three years (i.e. 2005,
2006 and 2007).
Table 5. 6 Average size of land under irrigation for ‘experimental’ and ‘control’ groups for three years (i.e. 2005, 2006 and 2007) Group Year Mean SD Difference b/n
preceding year Percentage decrease
2005 1.6843 1.38 - - 2006 0.9848 1.21 0.6995 41.5
‘experimental group’
2007 0.9141 1.18 0.7070 7.2 2005 0.4625 1.17 - - 2006 0.4500 0.39 0.0125 2.7
‘control group’
2007 0.4500 0.39 0.000 0 Source: Based on Field Survey, 2008
The average size of farmland under irrigation in 2005, 2006 and 2007 for
the ‘experimental group’ was 1.6843, 0.9848 and 0.9141 timads
respectively. This shows that there was a decline in mean land size
between 2005 and 2006 by 0.6995timads (41.5percent). This difference is
attributed to the dryup of the lake. On the other hand the mean
difference of 2006 and 2007 is computed to be 0.0707timads (7.2percent)
which is not as large as that of 2005 and 2006 mean difference. This is
because the lake had already dried up in the late 2005. So the mean
difference for 2006 and 2007 can be due to inter-household variations in
to use underground water or rain water harvesting as the lake has
already dried up before this period.
62
By comparison, the mean land area under irrigation for ‘control group’
was 0.4625, 0.45 and 0.45timad in 2005, 2006 and 2007, respectively.
When the mean differences are compared, it shows 0.0125timad
(2.7percent) decrease for the year 2005 and 2006 and no change for
2006 and 2007. Although there is a decline in land under irrigation
between 2005 and 2006, the figure is very minute in comparison to mean
differences of the ‘experimental group’ for the same period. This result
show that the degree of decline in land under irrigation for the
‘experimental group’ could have show up in ‘control group’ had the cause
for the decline be attributed to any other factors other than the
disappearance of the lake.
Further statistical test for these mean differences supplement the above
argument in that the mean difference in land area under irrigation for
2005 and 2006 is significant for ‘experimental group’ while it is
insignificant for ‘control group’ (see Table 5.7 overleaf). This significant
difference for ‘experimental group’ is due the disappearance of the lake
which had not equally affected ‘control group’ as far as irrigation is
concerned.
63

Table 5. 7 Results of t-tests for mean difference in land under irrigation for ‘experimental’ and ‘control’ groups by years (2005, 2006 and 2007) Group Year Mean
Difference SD t-value Significance
05-06 0.699 0.80 8.67*** 0.00 ‘experimental group’ 06-07 0.071 0.42 1.69* 0.094
05-06 0.0125 0.75 0.130(NS) 0.89 ‘control group’ 06-07 0.000 0.26 0.000(NS) 1.000
Source: Based on Field Survey, 2008
Note: *** significant at 1percent, * significant at 10percent, NS: Not
significant
Table 5.7 also shows that the mean difference of irrigated farmland for
2006 and 2007 is significant at 90 percent confidence level for
‘experimental group’ but not significant for ‘control group’ for the same
period. Although the lake had dried up in late 2005, those households
located too close to the lake shore can still use the remaining
underground and surface water to irrigate their farmland in 2006.This
contributed for mean difference for 2006 and 2007.
So, all the above analysis and discussions in group as well as time series
comparisons clearly show how Lake Haramaya had been important
source of water for irrigation to its surrounding rural communities.
5.2.3 Decline in agricultural productivity
In this section, the impact of the disappearance of the lake upon
agricultural productivity is analyzed. Similar to the investigation into
land under irrigation (in group as well as time series comparisons), the
64

same procedures and logic is employed to investigate the impact of the
dryup of the lake on agricultural productivity. In addition to time series
and group comparisons, impact analysis on agricultural productivity by
crop type is included to provide clearer understanding.
Plate 5. 1 The wilted Chat farm near the shore of former lake
Table 5.8 overleaf presents the average production per timad of the main
crop type produced by households over the three years. Chat production
per timad dropped abruptly by 16.1 percent in 2006 when compared to
production per timad in 2005. The other crop type that showed sharp
decline next to chat for the same period was vegetable9 production which
decreased by 15.1 percent for the same period. Investigation during field
9 A combined production of potato, cabbage and onion.
65

survey revealed that these two groups of crops were produced mainly by
irrigation during dry seasons, though they are also produced by rain fed
agriculture. Given the very means of their production, these two groups
of crops showed such a significant decrease in productivity per timad no
sooner had the lake dried up in the late 2005.
Table 5. 8 Percentage increase/decrease of crop production per timad over three years (2005, 2006 and 2007)
Crop type
Year
Production per timad
Percentage Mean
difference from
preceding Yr
SD
2005 2,7456 __ __ 2006 2,7118 -1.1 2.60168
Sorghum (in quintal10/timad)
2007 2,7162 +0.2 3.6235 2005 2,2696 __ __ 2006 2,3913 +5 4.223
Maize (in quintal/timad)
2007 2,4394 +6 6.162 2005 129,9904 __ __ 2006 108,4353 -16.6 24.6312
Chat (in kg/timad)
2007 106,1343 _1.5 20.412 2005 300,0347 __ __ 2006 254,7222 -15.1 60.8715
Vegetable (in kg/timad)
2007 248,444 -2.5 64.512 Source: Based on Field Survey, 2008
Table 5.8 also shows comparisons for various rain fed crops over the
period of three years whose mean differences were not only varying but
also showed less significant variation in production over the said period.
In other words, maize and sorghum production per timad revealed
relatively smaller percentage of mean difference. Besides, mean
10 Quintal is a domestic measurement unit of cereals equivalent to 100kg.
66
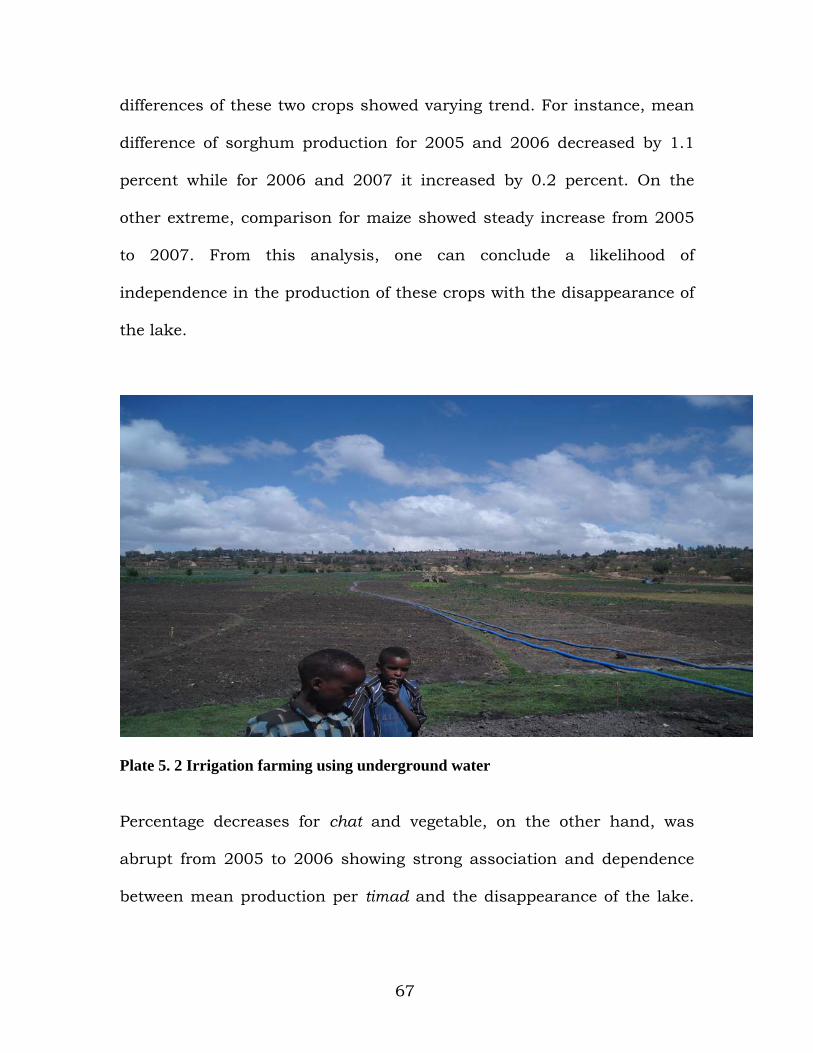
differences of these two crops showed varying trend. For instance, mean
difference of sorghum production for 2005 and 2006 decreased by 1.1
percent while for 2006 and 2007 it increased by 0.2 percent. On the
other extreme, comparison for maize showed steady increase from 2005
to 2007. From this analysis, one can conclude a likelihood of
independence in the production of these crops with the disappearance of
the lake.
Plate 5. 2 Irrigation farming using underground water
Percentage decreases for chat and vegetable, on the other hand, was
abrupt from 2005 to 2006 showing strong association and dependence
between mean production per timad and the disappearance of the lake.
67
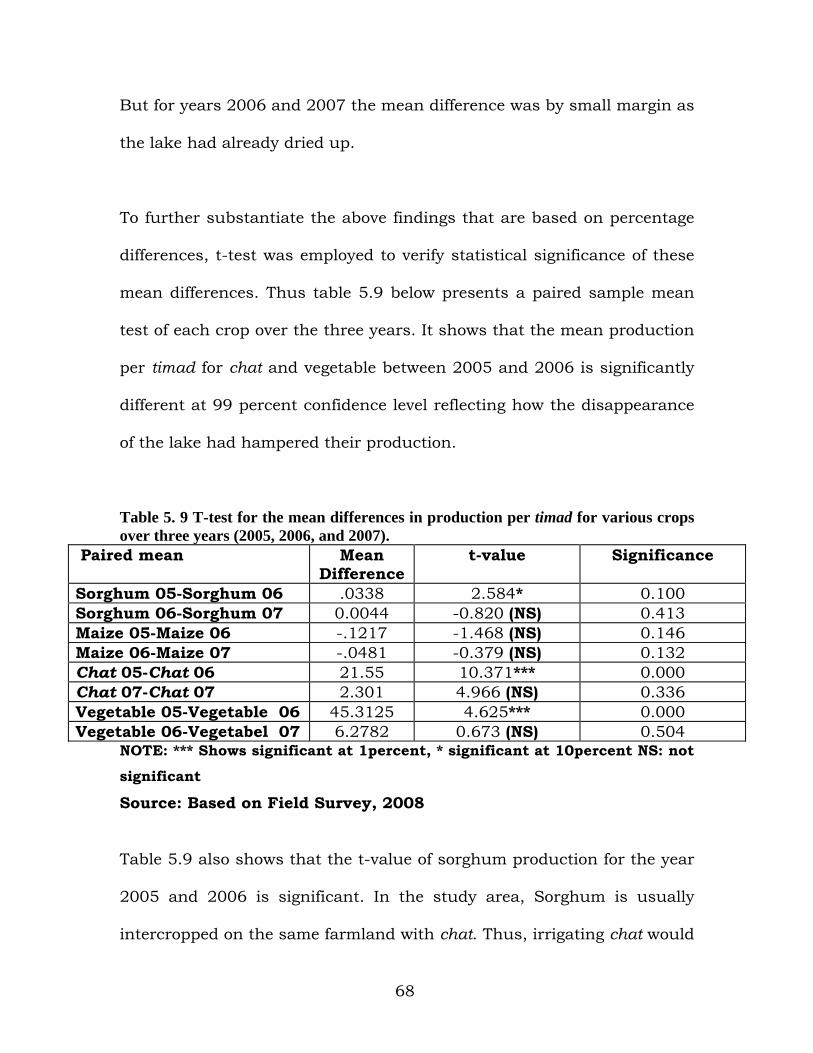
But for years 2006 and 2007 the mean difference was by small margin as
the lake had already dried up.
To further substantiate the above findings that are based on percentage
differences, t-test was employed to verify statistical significance of these
mean differences. Thus table 5.9 below presents a paired sample mean
test of each crop over the three years. It shows that the mean production
per timad for chat and vegetable between 2005 and 2006 is significantly
different at 99 percent confidence level reflecting how the disappearance
of the lake had hampered their production.
Table 5. 9 T-test for the mean differences in production per timad for various crops over three years (2005, 2006, and 2007).
Paired mean Mean Difference
t-value Significance
Sorghum 05-Sorghum 06 .0338 2.584* 0.100 Sorghum 06-Sorghum 07 0.0044 -0.820 (NS) 0.413 Maize 05-Maize 06 -.1217 -1.468 (NS) 0.146 Maize 06-Maize 07 -.0481 -0.379 (NS) 0.132 Chat 05-Chat 06 21.55 10.371*** 0.000 Chat 07-Chat 07 2.301 4.966 (NS) 0.336 Vegetable 05-Vegetable 06 45.3125 4.625*** 0.000 Vegetable 06-Vegetabel 07 6.2782 0.673 (NS) 0.504
NOTE: *** Shows significant at 1percent, * significant at 10percent NS: not
significant
Source: Based on Field Survey, 2008
Table 5.9 also shows that the t-value of sorghum production for the year
2005 and 2006 is significant. In the study area, Sorghum is usually
intercropped on the same farmland with chat. Thus, irrigating chat would
68

indirectly boost Sorghum production as it is mostly intercropped with
chat prior to 2006. Therefore, after the disappearance of the lake, the
impact on production per timad was felt not only on chat and vegetable
productions but also to a lesser degree on sorghum production. For
maize production, however, the mean difference for the three years is
statistically insignificant as it is mostly produced through rain fed
farming.
Further examination of these declines in crop production per timad is
vital in order to have a more convincing picture of their causes. The
above analysis and discussions are based on the composite mean
production of the whole 159 sample household covered in this study.
However, analysis based on such approach would not provide relatively
more comprehensive understanding of the impact of the dryup of the
lake in comparison to analysis based on statistic of households that had
access to the lake and those that had limited access. Therefore, two
group comparisons, i.e., ‘experimental’ and ‘control’ groups is vital for
such analysis.
Table 5.10 presents the mean production per timad for various crops
over the three years (i.e., 2005, 2006 and 2007) for ‘experimental’ and
‘control’ group. As can be seen from the table, percentage production
69

declines for chat and vegetable was much greater between 2005 and
2006 for ‘experimental group’ than for ‘control group’
Table 5. 10 Group comparison of crop production per timad for three years (2005, 2006 and 2007).
‘experimental group’ ( N=99) ‘control group’ (N = 60) Crop Year Mean Percentage
Mean difference
t-value
Sign. Mean Percentage Mean
difference
t-value
Sign.
05 2.82 __ __ __ 2.61 __ __ __ 06 2.78 -1.4 2.46 .016** 2.60 -0.38 1.00 .322
Sorghum
07 2.79 +0.35 -2.68 .01*** 2.59 -0.38 1.00 .326 05 2.03 __ __ __ 2.62 __ __ __ 06 2.24 +10.3 -1.52 .135 2.65 +1.15 1.00 .324
Maize
07 2.17 -3.1 1.00 .322 2.72 +2.64 -.283 .779 05 153.31 __ __ __ 88.48 __ __ __
06 120.05 -21.7 17.04 .00*** 87.76 -0.81 .258 .798 Chat
07 116.92 -2.6 1.14 .256 88.03 +0.31 1.143 .258 05 332.68 __ __ __ 202.08 __ __ __ 06 290.46 -12.7 4.55 0.00*** 196.36 -2.83 1.42 .256
Vegetable
07 262.93 -9.5 6.67 0.00*** 190.41 -3.03 1.00 .325 Source: Based on Field Survey, 2008
NOTE: *** show significant at 1percent, ** Show significant at
5percent Note:- Percentage mean differences indicate differences in the means of two consecutive years taking the preceding year as a base, and +/- sign show increase or decrease. -Unit of measurement for Sorghum and Maize is quintal/timad while that of chat and Vegetable is kg/timad
Critical examination of Table 5.10 above reveals two interesting findings.
Firstly, contrary to the previous combined analysis, variations in mean
crop production over the three years are statistically significant only for
‘experimental group’. This clearly shows how the disappearance of the
lake had declined crop production for those that had close location to the
lake. Secondly, vegetable production for gross means for 2006 and 2007
70
was insignificant (See Table 5.9 )for gross comparison but significant for
‘experimental group’ in inter-group analysis.
The overall examination of the two groups shows that there is significant
decline for ‘experimental group’ than for ‘control group’. In addition,
though there were fluctuations in mean productions for ‘control group’
for every crop in all the years, none of these were statistically significant.
So by the same token, those variations in the mean production that were
statistically significant in combined sample analysis are found to be even
more significant for ‘experimental group’. Analysis by group comparison,
thus, revealed some variations that were masked during combined
sample analysis. For instance, variation in sorghum production for 2006
and 2007 were found to be significant for ‘experimental group’, while it
was not significant in combined sample analysis. Similar scenario is
observed in vegetable production for the same year.
In spite of these differences, analysis by group comparison and combined
group approach revealed one fact; that is, in both cases chat and
vegetable production between 2005 and 2006 had decreased significantly
which was undoubtly attributed to the disappearance of Lake Haramaya.
In nut shell, all the above analysis that incorporate comparisons by time
series, crop types and group, regarding crop production per timad give a
71

clear insight into the impact of the disappearance of the lake upon crop
production by the local community.
5.2.4 Perceived impact on household’s income
During the field survey, households were requested to report their own
evaluation on trends in their income over the past three years. The result
was that significant number of household heads (93.1 percent) perceived
their income as decreasing while 5.7 percent responded that their income
is increasing in the said period. (See Table 5.11)
Table 5. 11 Trends in household’s income as perceived by household head over the past three years Income trend N Percent Increasing 9 5.7 Decreasing 148 93.1 No change 2 1.2 Total 159 100.0 Source: Based on Field Survey, 2008
Furthermore, households were asked to report the perceived causes of
decline in their incomes over the said period. Hence, responses of the
148 household heads who reported decreasing trend in their incomes is
presented on table 5.12 overleaf. The main perceived cause of the decline
in their incomes is high cost of farm input (i.e., 46.3 percent of the
responses and 64.2 percent of the cases). The second cause is lack of
water for irrigation (i.e., 43.5 percent of the responses and 61.3 percent
of the cases). (See table 5.12).
72

Table 5. 12 Causes of income decrease over the past three years (2005, 2006 and 2007) as perceived by the household heads
Percent Causes
Number Responses Cases
High cost of farm input 95 46.3 64.2 Lack of water for irrigation 89 43.5 61.3 Low market price for farm produces 16 7.8 10.8 Large family size 5 2.4 3.4 Total 205 100.00 139.7 Source: Based on Field Survey, 2008
To take the analysis further, responses on income trend over the said
period as well as the perceived reasons for decline in income is examined
in inter-group comparisons. Thus, Table 5.13 below presents perceived
income trend by group (i.e. between ‘experimental’ and ‘control’ groups).
Table 5. 13 Perceived trends of income by group over past three years (i.e., 2005, 2006 and 2007).
Experimental Group
‘control group’
Income Trend
N percent N percent
Increasing 5 5.1 4 6.7 Decreasing 94 94.9 54 90 No change 0 0 2 3.3 Total 99 100 60 100 Source: Based on Field Survey, 2008
Table 5.13 shows that only 5.1 percent of the respondents from
‘experimental group’ reported increase in their income over the said
period while the figure is 6.7 percent for ‘control group’. On the other
hand, 94.9 percent of the respondents in ‘experimental group’ reported a
decreasing trend in their income while the figure is 90 percent for
‘control group’. Here, the point to ponder is that ‘control group’ is better
73

off both in increasing response trend of income (i.e., 6.7 percent) and in
proportion of respondents who reported no change in their income over
the said period (i.e., 3.3 percent). Therefore, ‘experimental group’, which
had greater accessibility to the lake before it dried up, perceive their
income as declining much more (i.e., 94.9 percent) in comparison to
‘control group’ (i.e., 90 percent).
Further investigation was made between the two groups regarding the
perceived causes of income decline by responses given and cases
involved. This was done in the hope of showing the impact of the dryup
of the lake in much clearer manner than the previous combined
frequencies of the responses and cases. Thus, Table 5.14 overleaf shows
the perceived causes of decline in households’ income over the said
period by group category.
The major perceive cause of decline in income over the past three years
for ‘experimental group’ is the lack of water for irrigation (i.e., 50 percent
of the responses and 73.4 percent of the cases). This is followed by high
cost of farm input (i.e., 42 percent of the responses and 61.7 percent of
the cases).
On the contrary, the result for ‘control group’ is the reverse of the former
group. In other words, the main perceived cause of income decline for
74
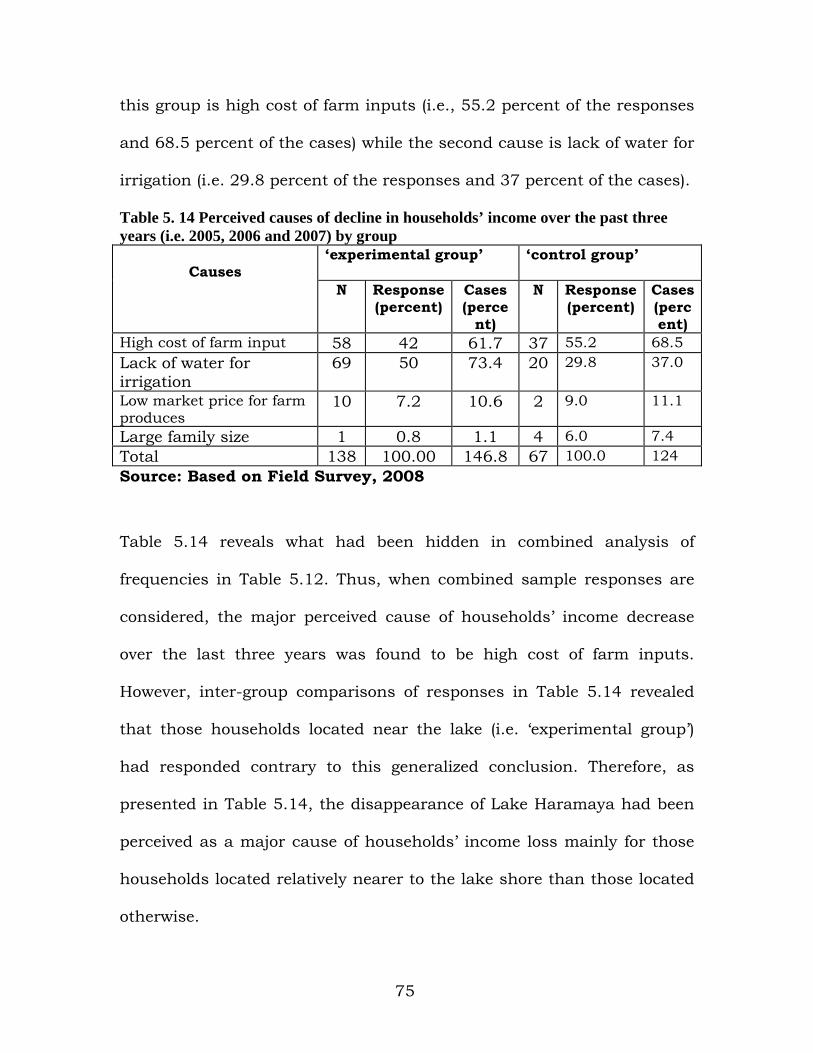
this group is high cost of farm inputs (i.e., 55.2 percent of the responses
and 68.5 percent of the cases) while the second cause is lack of water for
irrigation (i.e. 29.8 percent of the responses and 37 percent of the cases).
Table 5. 14 Perceived causes of decline in households’ income over the past three years (i.e. 2005, 2006 and 2007) by group
‘experimental group’
‘control group’ Causes
N Response (percent)
Cases (perce
nt)
N Response (percent)
Cases (percent)
High cost of farm input 58 42 61.7 37 55.2 68.5 Lack of water for irrigation
69 50 73.4 20 29.8 37.0
Low market price for farm produces
10 7.2 10.6 2 9.0 11.1
Large family size 1 0.8 1.1 4 6.0 7.4 Total 138 100.00 146.8 67 100.0 124 Source: Based on Field Survey, 2008
Table 5.14 reveals what had been hidden in combined analysis of
frequencies in Table 5.12. Thus, when combined sample responses are
considered, the major perceived cause of households’ income decrease
over the last three years was found to be high cost of farm inputs.
However, inter-group comparisons of responses in Table 5.14 revealed
that those households located near the lake (i.e. ‘experimental group’)
had responded contrary to this generalized conclusion. Therefore, as
presented in Table 5.14, the disappearance of Lake Haramaya had been
perceived as a major cause of households’ income loss mainly for those
households located relatively nearer to the lake shore than those located
otherwise.
75
5.3 Household responses to disappearance of the lake
In this section, responses of the households to the sudden disappearance
of the lake are presented with in-depth analysis. In this regard water
conservation measures as well as non conservation responses are
investigated in time series and group comparison approach. The later
include household’s participation in institutional services and
occupational responses triggered by the dryup of the lake.
5.3.1 Households Perception towards the Dryup of the Lake Behavioral studies to environmental changes underline that people's
perception towards anticipated changes in their surrounding
environment has important bearings to their responses in mitigation and
adaptive actions (Tobin and Montz, 1997). In line with this argument,
therefore, it is important to assess the perception of the households to
the lake before its disappearance. This was sought through their
responses to the question whether or not she/he had ever imagined Lake
Haramaya to dry empty. The result revealed that 28 sample households
(17.6 percent) had a perception that the lake would dryup one day while
131 households (82.4 percent) had never ever thought Lake Haramaya
would dryup.
Asked whether they were shocked by the disappearance of the lake, 78.4
percent of the households responded that they were ‘very shocked’ while
76

20.1 percent responded that they ‘were shocked’ and 1.5 percent (8
households) reported that they ‘were not shocked’.
But it is almost impossible to measure the degree of shock for some one
who knew Haramaya in the past and came recently to find a once vast
lake now transformed into just a vast field. This story takes us to what
had been published on the weekly Fortune newspaper. The paper
narrates about a once resident of Haramaya who won US Visa Lottery
eight years ago. After spending eight years in USA, Chala Ahmed came
home for an extended visit in January 2008, and Fortune writes:
When he arrived it was at night, the atmosphere was dark and quiet. Ahmed woke up the next morning and stepped out into the early sunlight. As he stared at a vast empty field, he watched farmers herd cattle and goats across the empty lake bed that was once Lake Haramaya. Then he sat down on a dusty patch of grass and cried… ‘When I left eight years ago, the lake was full, now the lake has become nothing but a field.’ (Fortune, March 30, 2008: 54)
77
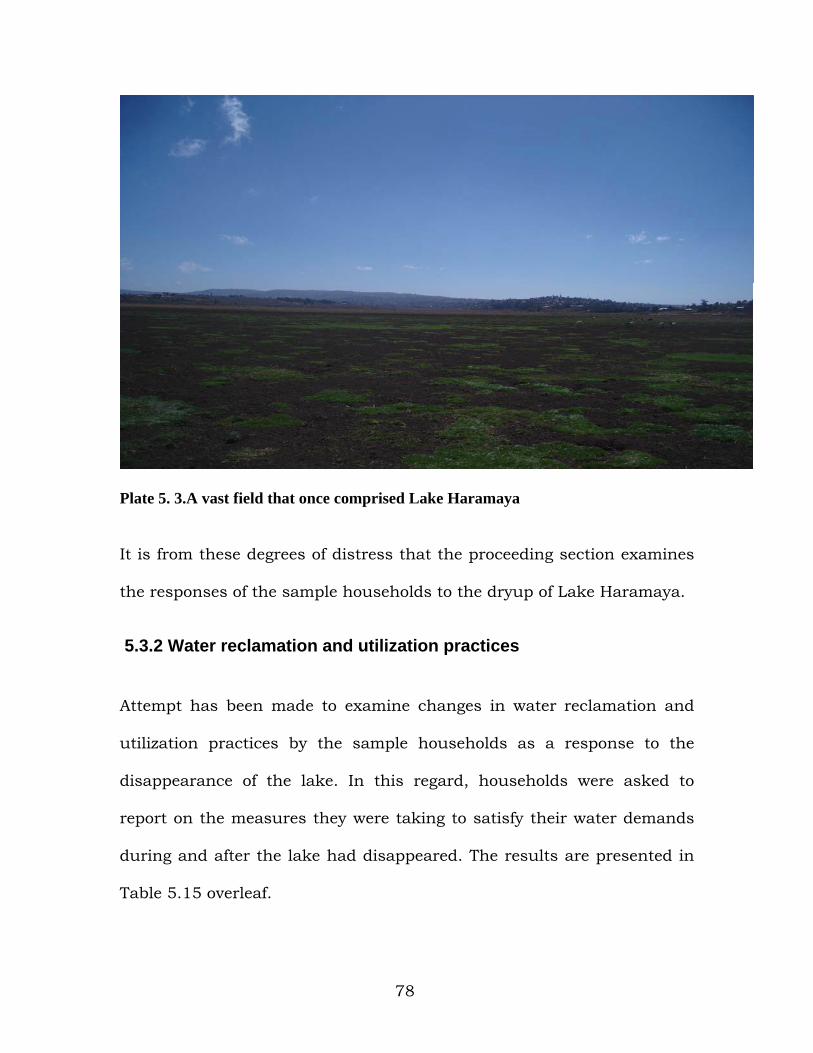
Plate 5. 3.A vast field that once comprised Lake Haramaya
It is from these degrees of distress that the proceeding section examines
the responses of the sample households to the dryup of Lake Haramaya.
5.3.2 Water reclamation and utilization practices
Attempt has been made to examine changes in water reclamation and
utilization practices by the sample households as a response to the
disappearance of the lake. In this regard, households were asked to
report on the measures they were taking to satisfy their water demands
during and after the lake had disappeared. The results are presented in
Table 5.15 overleaf.
78

Accordingly, only 24 household (15.1 percent) of the total sampled
households were practicing underground water reclamation and rain
water harvesting during 2005. However, after the lake had dried up, in
2006, about 54.7 percent of the sample households were engaged in
underground water withdrawal and rain water harvesting, while the
figure for 2007 was 51.6 percent.
Table 5. 15 Measures taken by the households to overcome water scarcity 2005 2006 2007 N Percent N Percent N Percent
Underground water 13 54.2 62 71.3 50 61.0 Rain water Harvesting 11 45.8 25 28.7 32 39.0 Total 24 15.1 87 54.7 82 51.6 Source: Based on Field Survey, 2008
From Table 5.15, one can infer that there is a steady and abrupt increase
in households who practice water reclamation measures from 2005 (i.e.
24 households) to 2006 (i.e.87 households) but with subtle decline in
2007 (i.e. 82 households). Results from focus group discussion revealed
that because of continuous decline of water table, soaring prices of water
pump generators and fuel, it is becoming difficult for households to
withdraw underground water recently. Table 5.15 also supplements this
view in that underground water withdrawal used to make 71.3 percent of
the practices in 2006 while it dropped to 61.0 percent in 2007. On the
other hand, rain water harvesting, by household count increased from 11
in 2005, to 25 in 2006 and to 32 in 2007. This shows that rain water
79

harvesting is becoming an important practice to rely on as underground
water is becoming unreliable owing to the stated constraints
Plate 5. 4 A Drying Underground water bore hole Inter- group analysis was made to provide much clearer pictures of such
responses by groups. Therefore, Table 5.16 below presents the
responsive measures taken to water scarcity by group.
Table 5. 16 Measures taken by households to suffice water demand by group ‘experimental group’ ‘control group’ Year UGW RWH UGW RWH N percen
t N perce
nt N percen
t N percen
t 2005 6 6.1 1 1 7 11.7 10 16.7 2006 58 58.6 14 14.1 4 6.7 11 18.3 2007 49 49.5 19 19.2 1 1.7 13 21.7 Source: Based on Field Survey, 2008 NOTE: UGB= Underground water withdrawal, RWH= Rain water harvesting
80

Comparison of the two groups with regard to water reclamation and
utilization practices, one can ponder intriguing points from Table 5.16.
Firstly, for the ‘experimental group’, underground water withdrawal is
the major practice to meet their water demand while for ‘control group’
rain water harvesting is the reliable and consistent practice. The sharp
increase in underground water withdrawal for ‘experimental group’ in
2006 can be attributed to the disappearance of the lake in late 2005
while the percentages for ‘control group’ is in continuous decline from
2005 to 2007 signaling the resultant drop in water table and associated
rise of its cost.
Plate 5. 5 Rain Water harvesting pond
On the contrary, rain water harvesting is progressively practiced by the
two groups over the years, though the percentages are larger for ‘control
81

group’. This shows that with continuously dropping water table and
other stated costs, underground water withdrawal would be less reliable
and rain water harvesting will become the major practice by both groups
to assure their water demand, both for irrigation and consumption.
So the trend in water use followed, firstly withdrawal of surface water
from the lake for irrigation and consumption, later to withdrawal of
underground water from the very ground that used to be lake bed. And
as the later is becoming more costly and scarce with declining water
table, rain water harvesting is becoming the dominant practice to
respond to prevalent water scarcity after the lake disappeared.
5.3.3 Households participation in institutional services
With sudden disappearance of the lake, severe shortage of water set in.
This resulted in decreasing production of crops, particularly chat and
vegetables, which in turn caused soaring prices of chat that has doubled
up in present times. With such lucrative prices of chat, farmers in the
study area were striving to sustain production of this crop.
It was learned from group discussion that water for irrigating chat farm
is scarce due to the decline in water table. Hence farmers responded to
this scarcity by drilling water bore hole further deep. There is parallel
increase in the cost drilling as well as fuel for water pumping generators.
82
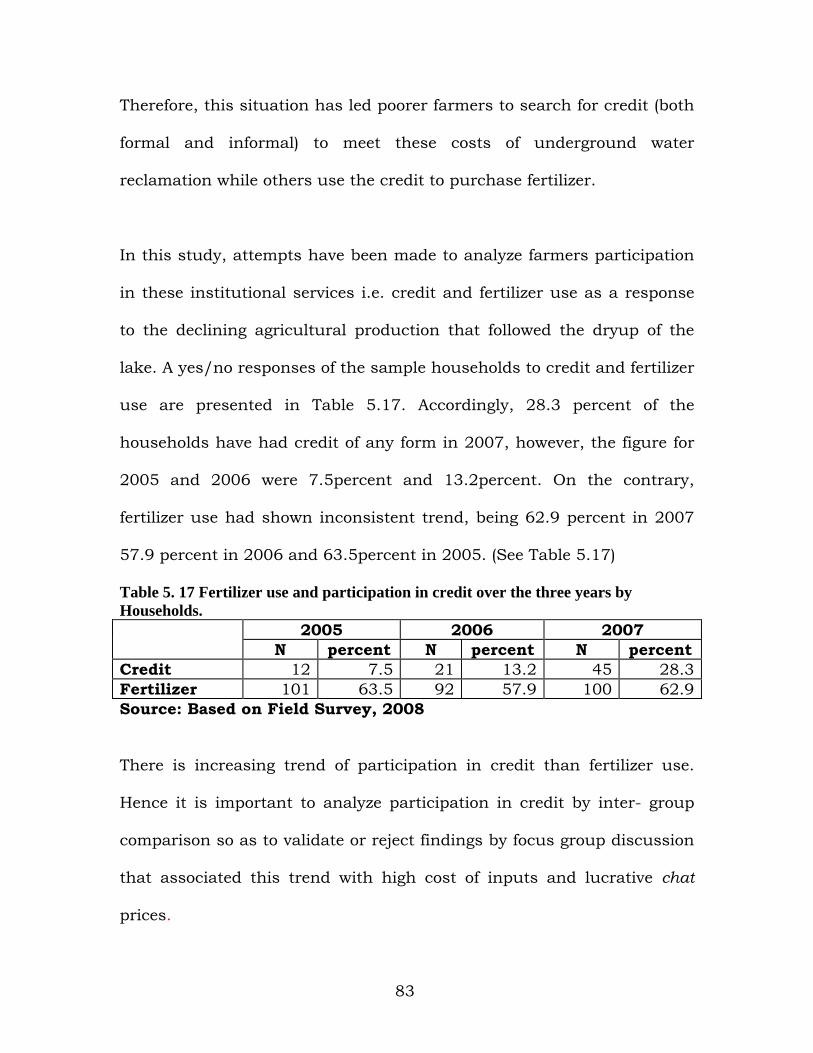
Therefore, this situation has led poorer farmers to search for credit (both
formal and informal) to meet these costs of underground water
reclamation while others use the credit to purchase fertilizer.
In this study, attempts have been made to analyze farmers participation
in these institutional services i.e. credit and fertilizer use as a response
to the declining agricultural production that followed the dryup of the
lake. A yes/no responses of the sample households to credit and fertilizer
use are presented in Table 5.17. Accordingly, 28.3 percent of the
households have had credit of any form in 2007, however, the figure for
2005 and 2006 were 7.5percent and 13.2percent. On the contrary,
fertilizer use had shown inconsistent trend, being 62.9 percent in 2007
57.9 percent in 2006 and 63.5percent in 2005. (See Table 5.17)
Table 5. 17 Fertilizer use and participation in credit over the three years by Households.
2005 2006 2007 N percent N percent N percent
Credit 12 7.5 21 13.2 45 28.3 Fertilizer 101 63.5 92 57.9 100 62.9 Source: Based on Field Survey, 2008
There is increasing trend of participation in credit than fertilizer use.
Hence it is important to analyze participation in credit by inter- group
comparison so as to validate or reject findings by focus group discussion
that associated this trend with high cost of inputs and lucrative chat
prices.
83

Table 5.18 shows the results of household’s participation in credit by
inter-group comparison. The result for ‘experimental group’ reveals a
continuous increase in household’s participation credit (i.e. 4percent,
16.2percent and 38.2percent in 2005, 2006 and 2007 respectively). This
is in harmony with the findings by focus group discussion which linked
participation in credit to the rising cost of underground water
reclamation and lucrative price of chat.
On the hand the result for ‘control group’ reveals inconsistent trend (i.e.
13.3percent, 8.3percent and 11.7percent in 2005, 2006 and 2007
respectively.
Table 5. 18 Participation in credit service by household groups over three years (2005, 2006and 2007)
‘experimental Group’ (N=99)
‘control group’ (N=60)
Year N percent N percent 2005 4 4 8 13.3 2006 16 16.2 5 8.3 2007 38 38.2 7 11.7
Therefore, information gathered from focus group discussion which
correlate participation in credit to the rising cost of inputs and soaring
price of chat has some grain of truth. This is because in the analysis of
water conservation and utilization section, inter-group comparison result
reveals that greater percentage of households in ‘experimental group’ (i.e.
58.6 percent) responded to the prevalent water scarcity by underground
84
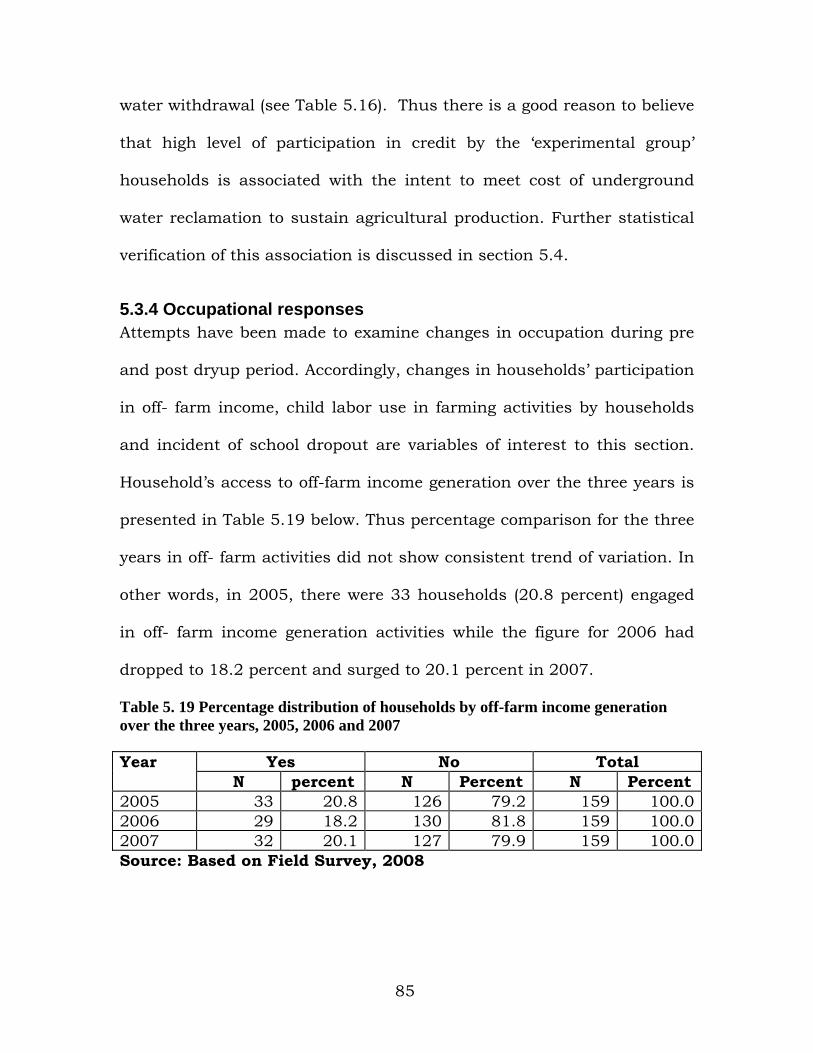
water withdrawal (see Table 5.16). Thus there is a good reason to believe
that high level of participation in credit by the ‘experimental group’
households is associated with the intent to meet cost of underground
water reclamation to sustain agricultural production. Further statistical
verification of this association is discussed in section 5.4.
5.3.4 Occupational responses Attempts have been made to examine changes in occupation during pre
and post dryup period. Accordingly, changes in households’ participation
in off- farm income, child labor use in farming activities by households
and incident of school dropout are variables of interest to this section.
Household’s access to off-farm income generation over the three years is
presented in Table 5.19 below. Thus percentage comparison for the three
years in off- farm activities did not show consistent trend of variation. In
other words, in 2005, there were 33 households (20.8 percent) engaged
in off- farm income generation activities while the figure for 2006 had
dropped to 18.2 percent and surged to 20.1 percent in 2007.
Table 5. 19 Percentage distribution of households by off-farm income generation over the three years, 2005, 2006 and 2007
Yes No Total Year N percent N Percent N Percent
2005 33 20.8 126 79.2 159 100.0 2006 29 18.2 130 81.8 159 100.0 2007 32 20.1 127 79.9 159 100.0 Source: Based on Field Survey, 2008
85
So there seem no clear variations in off- farm income generation by the
households that could be attributed to the dryup of the lake. Like wise,
inter-group analysis of variation in off- farm income generation by
respondents didn't reveal any verifiable consistent trend for articulation.
This is because participation in off - farm income is not a matter of
choice but rather availability.
On the other end of the analysis, intents of the household to use child
labor for farming activities and incidents of school dropout revealed an
intriguing association. During interview, households were asked whether
children below ten years old were engaged in any farm activities. Hence
21 households (i.e. 13.2 percent) agreed that they do let children of that
age group work in farm activities. On the other extreme, result of
incident of school dropout in 2007 revealed that 7 households (4.4
percent) of the sample households agreed to the occurrence of the
incident on their household members.
As such, attempt had been made to investigate the association between
intents to use child labor in farm activities and incident of school
dropout. Table 5.20 presents cross- tabulation of the two variables. The
result of chi-square showed a statistically significant association (at 90
percent confidence level) between child labor use and school dropout.
86

Table 5. 20 Cross- tabulation of child labor use and school dropout in 2007
School Drop out Yes No
Total
N Percent N Precept N Precept Yes 4 57.4 17 11.2 21 13.2 No 3 42.6 135 88.8 138 86.8
Child Labor Use
Total 7 100.0 152 100.0 159 100.0 NOTE: *** significant at 1percent Source: Based on Field Survey, 2008 -value =11.598*** 2χ Further inter-group analysis revealed that out of the 21 households that
allow child labor use on farm, 16 households (76.2percent) belong to
Experimental while the remaining 5 households (25.8percent) belong to
‘control group’. So relative percentages comparison between the two
groups indicate that ‘experimental group’ use child labor for farm
activities than ‘control group’.
Similarly, percentages for school dropout also confirm the above finding
in that out of 7 cases of school drop out, 5 belong to ‘experimental group’
while only 2 belong to ‘control group’. From these glaring differences one
can extract important implication on the way households responded to
the disappearance of the lake. In other words, greater degree of impact
on ‘experimental group’ households as result of the dryup could have
forced them to use child labor in farming and other conservation
activities that need intensive labor.
87
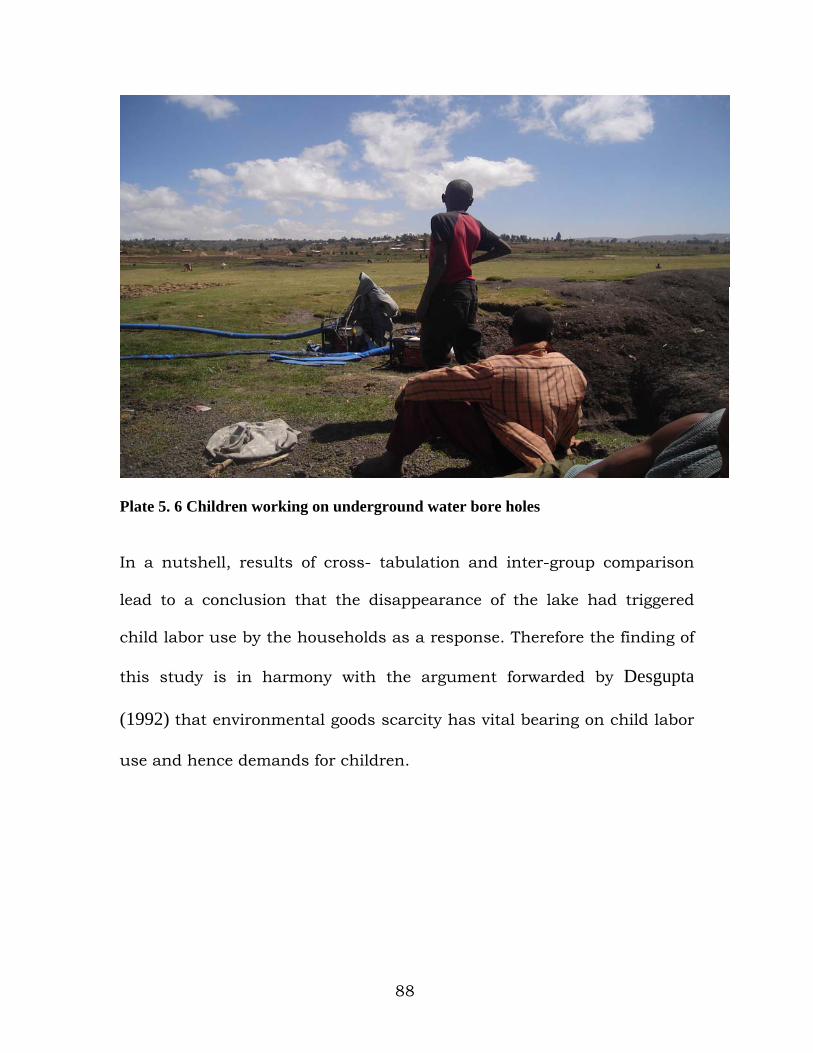
Plate 5. 6 Children working on underground water bore holes
In a nutshell, results of cross- tabulation and inter-group comparison
lead to a conclusion that the disappearance of the lake had triggered
child labor use by the households as a response. Therefore the finding of
this study is in harmony with the argument forwarded by Desgupta
(1992) that environmental goods scarcity has vital bearing on child labor
use and hence demands for children.
88

5.4 Determinants of Household's Participation water reclamation and utilization Measures
Several factors are responsible for inter-household variations in the
participation of water reclamation activities. In this study Logistic
regression model was employed to identify the socio-economic,
demographic and institutional factors that determine participation in
water reclamation and utilization measures by the households.
A total of nine variables were treated against household’s participation in
water reclamation and utilization measures as a response to the
prevalence of water scarcity that was set following the disappearance of
the lake. These factors are Age, literacy status, Household size, land size,
off-farm income, participation in credit, fertilizer use, household’s prior
perception towards the dryup of lake and participation in community
resource management.
The variables included in the model were tested for the existence of
multicollinearity using contingency coefficient and variance inflation
factor (VIF) for dummy and continuous variables respectively. The
contingency coefficient for the dummy variables included in the model
shows no multicollinearity problem. Similarly, the results of the variance
inflation factor confirmed absence of multicollinearity between
continuous variables.
89
With highly significant model chi-square statistics ( ) = 43.45 value
(with 9 degrees of freedom) and a -44.2 log likelihood ratio, the model
achieved 79.8percent correct prediction. Figures for correctly predicted
participants in water conservation measures and non-participants in
water reclamation measures were 85.2percent and 71.1percent
,respectively.
2χ
Among the factors considered in the model, eight variables were found to
have a significant influence on household’s participation in water
reclamation and utilization measures. Of these, six variables were found
to have a significant and positive influence on household’s participation
in water reclamation and utilization measures as a response. These are
household age, literacy status, household size, land size, participation in
credit and prior perception towards the dryup of lake. On the other hand,
fertilizer use and involvement in off-farm income were found to have a
significant and negative influence on household’s participation in water
reclamation and utilization measures (refer to Table 5.21).
90
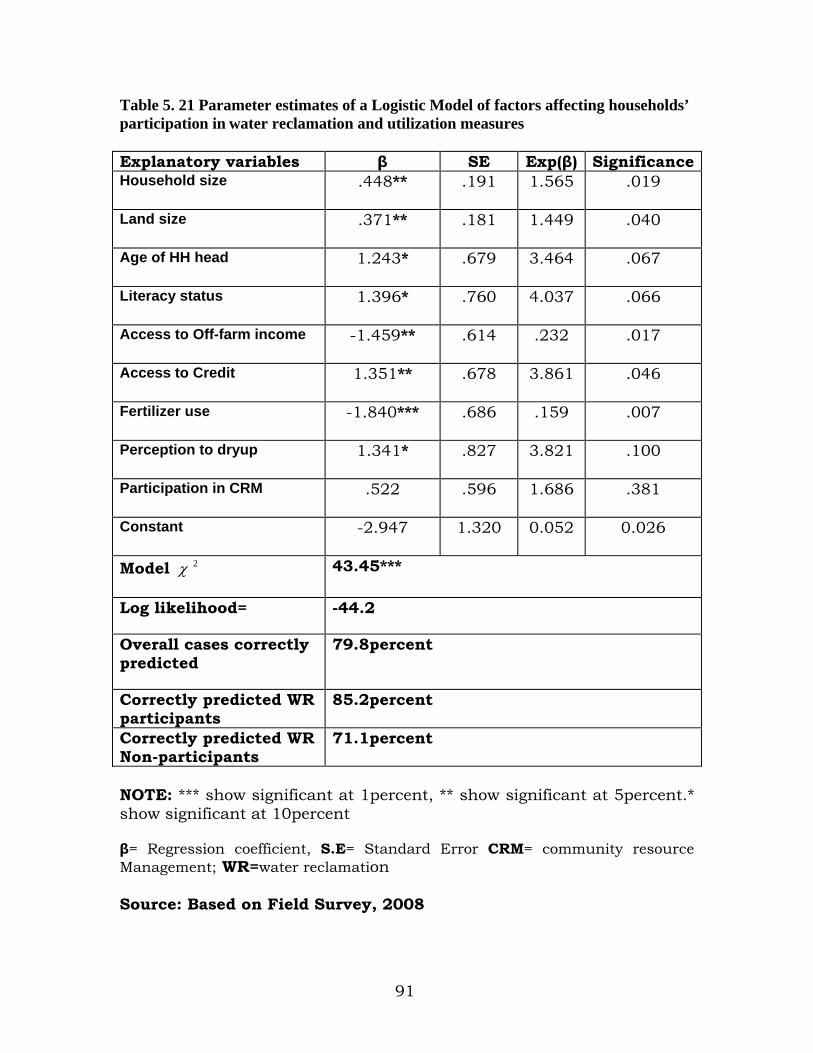
Table 5. 21 Parameter estimates of a Logistic Model of factors affecting households’ participation in water reclamation and utilization measures
Explanatory variables β SE Exp(β) Significance Household size .448** .191 1.565 .019
Land size .371** .181 1.449 .040
Age of HH head 1.243* .679 3.464 .067
Literacy status 1.396* .760 4.037 .066
Access to Off-farm income -1.459** .614 .232 .017
Access to Credit 1.351** .678 3.861 .046
Fertilizer use -1.840*** .686 .159 .007
Perception to dryup 1.341* .827 3.821 .100
Participation in CRM .522 .596 1.686 .381
Constant -2.947 1.320 0.052 0.026
Model 2χ
43.45***
Log likelihood=
-44.2
Overall cases correctly predicted
79.8percent
Correctly predicted WR participants
85.2percent
Correctly predicted WR Non-participants
71.1percent
NOTE: *** show significant at 1percent, ** show significant at 5percent.* show significant at 10percent β= Regression coefficient, S.E= Standard Error CRM= community resource Management; WR=water reclamation Source: Based on Field Survey, 2008
91
In the proceeding section the result of the logistic model for each variable
is discussed in detail. Besides, the findings of the chi-square and t-test
are used to supplement the result of the model.
5.4.1 Household age versus participation in water reclamation and utilization measures Age is an important demographic factor that may influence household's
participation in water reclamation activities. By conventional wisdom,
older household heads may participate in water reclamation activities by
the virtue of their experience. On the other hand, younger household
heads have the physical strength that may favor their participation in
water reclamation activities than their older counterparts.
Data presented on Table 5.22 presents the household's participation in
water reclamation measures by households’ median age. Accordingly,
among participant households 52.5 percent were aged above median age
while 48.5 percent were aged below the median age of the ‘experimental
group’ household heads (i.e. 38 years).
The result of logistic regression revealed that age of the household head
has a significant (at 90percent confidence level) and positive influence on
household participation in water reclamation measures (see Table 5.21).
Therefore, other things being constant, the probability of the
implementation of water reclamation measures by household heads aged
92

above the median age increases by a factor of 3.464. This implies that as
the age of the household heads increases, there is a higher probability to
implement water reclamation activities than their younger counterpart.
This can be attributed to their long age experience and asset they have
built over those times that may be required to do so.
5.4.2 Household size versus participation in water reclamation activities Household size is an important demographic variable that could affect
participation in water reclamation practices. The mean household size of
sample household engaged in water reclamation activities was 6.164
while that of non-participants were 4.89 with mean difference of -
1.269(see Table 5.23).The t- test result showed significant mean
difference in household size (t-value = -2.68 at p < 0.001) between the
two groups.
The result of logistic regression model in Table 5.21 disclosed that
household size has positive and significant (at 95percent confidence
level) influence on implementation of water reclamation measures.
Accordingly, the probability of participation in water reclamation
activities increases by a factor of 1.565 for a unit increase in household
size. This could be attributed to the fact that large sized households have
the obligation to feed many mouths which requires sustained increase in
agricultural production that, in turn, calls for water reclamation
93

activities. Besides, such households would have surplus labor that could
be used as input in water reclamation activities.
5.4.3 Literacy status versus participation in water reclamation
Activities
Literacy status of the household has an important bearing in influencing
household's participation in water reclamation activities. The result of
chi-square test between literacy status of the sample households to the
dependent variable indicates a significant association ( = 3.493, at p
< 0.1) between household's participation in water reclamation activities
and literacy status (see Table 5.22).
2χ
This finding was further supplemented by the result of logistic regression
that literacy status of the households has a significant (i.e, at 90 percent
confidence level) and positive effect on household’s water reclamation
decisions (see Table 5.21). Therefore, as a household becomes literate the
probability of engagement in water reclamation measures increases by a
factor of 4.037. This could be explained by the fact that literate
households have better awareness, perception and decision making
capacity in relation to the merits of water reclamation activities than
their illiterate counterparts.
94

5.4.4 Land size versus participation in water reclamation activities
Land is a very important asset and source of prestige and wealth in most
rural communities. Household’s land size has an important bearing in
influencing their participation in water reclamation measures.
Table 5.23 presents the mean land sizes of the sample households that
are participants and non- participants in water reclamation measures.
The result shows that the mean land size in timad for households
implementing water reclamation measures and those that did not is 3.6
and 2.3 timads, respectively. Thus the result of t-test revealed that the
mean difference in the landholding between the two groups is
statistically significant (i.e. t- value = -3.053 at p < 0.01).
Similarly, the result of logistic regression in Table 5.21 showed that land
size has a positive and significant (at 99 percent confidence level)
influence on household’s participation in water reclamation practices.
Put it another way, the probability of household's participation in water
reclamation practices increases by a factor of 1.449 for a unit increase in
land size, citrus Paribas. Thus, households with larger land holding have
better assets and wealth needed as inputs to undertake water
reclamation activities as opposed to those with smaller holdings. In other
95

words, households with larger land size are usually better off and thus
can afford inputs required for reclamation measures.
5.4.5 Off - farm income versus participation in water reclamation activities
Another socio-economic factor that could influence household
participation in water reclamation measures is access to off-farm income.
Data presented in table 5.22 shows that only 29.3 percent of the
households had access to off-farm income. When these households are
cross-tabulated with the dependent variable, 44.8 percent of them
implemented water reclamation while the remaining 55.2 percent did
not. Thus chi-square of independence between participation in water
reclamation measures and access to off farm income revealed a
significant but negative association (i.e. = 4.888 at p < 0.05). 2χ
The result of logistic regression model presented in Table 5.21 revealed
that access to off-farm income has a significant (at 95percent confidence
level) and negative influence on households participation in water
reclamation measures. The probability of household’s participation in
water reclamation measures decreases by a factor of 0.232 with
participation in off-farm income generation activities. This can be
justified by the fact that with participation in off- farm income generation
96

activities, households would have less time to spend in water reclamation
activities. Moreover, to these households, agriculture could be secondary
means of livelihood next to off- farm income source. Thus water
reclamation and conservation measures as a means to increase their
agricultural production are priority to those households whose
agriculture is their mainstay.
Therefore, the presupposed hypothesis of this study that household’s
access to off-farm income has positive influence on household’s
participation in water reclamation and conservation measures is rejected.
5.4.6 Access to credit service versus participation in water reclamation measures Household’s access to credit has a profound bearing on participation in
water reclamation measures. Credit service enables households to
purchase inputs required to undertake conservation measures.
It was found that 36.1percent of participants and 15.8 percent of non
participants of water reclamation measures had access to credit. There
was a systematic association (i.e. = 4.766, at p < 0.05) between
participation in water reclamation and conservation measures and
access to credit (see Table 5.22).
2χ
97
Access to credit which is significant at p< 0.05 level, increases the
likelihood of participation of water reclamation measure. The probability
that households who have access to credit would participate in water
reclamation measures increases by a factor of 3.861(see Table 5.21). This
finding also agrees with the information gathered through focus group
discussion which noted that owing to soaring price of chat, many
households are engaged the formal and informal credits to purchase
inputs such as motor pump, canvas, etc for water reclamation and
conservation to produce more chat.
5.4.7Fertilizer use versus participation in water reclamation measures
Both fertilizer and water are vital input to increase agricultural
production. Thus household could choose either one or both of these
inputs to improve their agricultural production under income and/or
resource constraints. Therefore the choice of one among the two inputs
by the household would make the other an opportunity cost, depending
on the decision by the household.
Data in Table 5.22 presents household’s participation in water
conservation measures by fertilizer use. Majority of the sample
households (68.7percent) were fertilizer users. When this data was cross
tabulated with the dependent variable there is statistically significant (i.e.
98

2χ = 4.766 at p < 0.05) but negative relation between dependent and
independent variables.
This finding was also confirmed by the result of logistic regression
presented in Table 5.21. Accordingly, the probability of participation in
water reclamation measures by households decreases by a factor of
0.159. Thus fertilizer use significantly (at P<0.01) hinders household’s
participation in water conservation measures. This is because, for the
households that choose fertilizer as input to boost agricultural
production water reclamation and conservation practice becomes an
opportunity cost as household's income and/ or resource could not allow
the implementation of both practices at the same time.
5.4.8 Household perception versus participation in water reclamation activities
Perception of the households towards anticipated environmental change
can influence their response when the actual event of change occurs.
Hence Table 5.21 presents households that had ever imagined the
disappearance of Lake Haramaya as inevitable and those that did not.
Accordingly, only 19.2 percent of the households perceived the
disappearance of the lake as inevitable event while the remainder did
not.
Chi-square test of independence( see Table 5.22) was employed to
investigate the association between household’s perceptions to the
99
implementation of water conservation measures. As a result, there is
statistically significant and positive relation between the dependent
variable and independent variable (i.e. = 5.075 at p < 0.05). 2χ
Model result also showed a significant (at p< 0.1) and positive relation
between households perception and participation in water reclamation
measures. In other words, the probability of participation in water
reclamation increased by a factor of 3.821 as household perceives the
disappearance of Lake Haramaya than otherwise. Thus it is reasonable
to believe that households that perceived the disappearance of the lake
before it actually happened are more likely to undertake precautionary
measures such as saving from their consumption to invest in water
reclamation and conservation measures prior to the actual disaster
period.
5.4.9 Participation in community resource management versus participation in water reclamation measures Participation in Community resource management can influence
individual's decision in water conservation practices. Participation in
community resource management provides experience, know how and
exposure to undertake conservation measures.
Table 5.22 presents data on household’s participation in community
resource management versus participation in water reclamation
100

activities. When the association was tested for independence, there is no
significant relationship between the two variables. Besides, the result of
logistic regression model also revealed that the association between
dependent and independent variable is statistically insignificant (see
Table 5.21)
Although both the results showed statistically insignificant relationships,
the coefficient is positive. Therefore household’s participation in
community resource management had some importance in conservation
decisions. However, this study could not validate its significance by the
sample size at hand.
Table 5. 22 Results of chi-square of independence by background Characteristics of the Respondents
101

Participation In WR
Measures
Yes No
Total
Background Characteristics
N percent N percent N percent
2χ
P- value
Below median age
29 47.5 19 50 48 48.5 Age
Above median age
32 52.5 19 50 51 51.5
.057
.812
Illiterate
41 67.2 32 84.2 73 73.7 Literacy
Literate 20 32.8 6 15.8 26 26.3
3.493
.062
Had no access
48 78.7 22 57.9 70 70.7 Off-farm income
Had access 13 21.3 16 42.1 29 29.3
4.888
.027
Had no access 39 63.9 32 84.2 71 71.7 Credit service Had access 22 36.1 6 15.8 28 28.3
4.750
.029
Non- users
24 39.3 7 18.4 31 31.3 Fertilizer use
Users 37 60.7 31 81.6 68 68.7
4.766
.029
not anticipated
45 73.8 35 92.1 80 80.8 Perception on dry up
Did anticipated 16 26.2 3 7.9 19 19.2
5.075
.024
Non participant
36 59 23 60.5 59 59.6 Community resource Mgt
Participant 25 41 15 39.5 40 40.4
.022
.882
Source: Based on Field Survey, 2008 NB: WR= water Reclamation Table 5. 23 T-test results of mean differences by participation in water reclamation for continuous variables. Variable WR Measures N Mean t-value Significance
Non participant 38 4.8947 Household size Participant 61 6.1639 2.684*** 0.009
Non participant 38 2.3026 Landholding in timad Participant 61 3.6148 3.057*** 0.003
Source: Based on Field Survey, 2008 NB: WR= water Reclamation, *** significant at 1percent
102

CHAPTER SIX
CONCLUSION AND RECOMMENDATION
6.1 CONCLUSION
The underlying conclusion of this study is that the dynamic inter-
relationship between society and the environment is in part mutually
deterministic. The Environment, at some initial stage, provides a given
society with a wide range of alternative goods and services that shape
their livelihood. Depletion of these environmental goods and services over
time would force the society to shape and reshape the existing livelihood
and social culture in response to the changes in their resource base.
Thus change in the environment, caused by human action or other
natural forces, indoctrinate the society to a new form of livelihood and
social interactions
The result of this study revealed that the impact of the disappearance of
lake Haramaya resulted in the loss of direct utilities that the near by
communities used to obtain from the lake. These range from direct
livelihood sources such as fishing and ferry renting to decline in
agricultural productivity, particularly on chat, vegetable and sorghum
production with spatial variations among the sample households. Of
course, the impact was much severe for those households located near
the lake than those located far away. Such spatial variations of impact
103

severity also dictate inter-household variations to respond to the
prevalent environmental shock, with households near the lake being
more responsive than those far away. Such uneven distribution of the
impact of environmental change, even at global level, poses challenge for
collective action among countries to deal with it.
Household’s response to the impacts mainly focuses on reclamation more
water either from underground sources or by harvesting rain water so as
to sustain agricultural production which was in continuous decline since
the lake had disappeared. Thus reclamation of underground water from
the former bed of the lake was the major responsive measure followed by
rain water harvesting. However, underground water reclamation by the
households as a dependable measure to boost agricultural production
has a number of challenges. Firstly, the water table is continuously
dropping due to excessive withdrawal of water by the farming households
as well as urban water supply agents. Secondly, due to scarcity of water,
households in upper catchment were sidelined which is currently
causing frequent conflict among households in upper and lower
catchment. Lastly, due to soaring cost of digging bore holes and raising
cost of fuel for motor pumps, some households were forced to use child
labor which resulted in school drop out. Therefore, all these problems
were borne by the households that use underground water. The trend
now is in favor of rain water harvesting. Thus, the disappearance of the
104
lake had shaped and continues to re-shape the community’s livelihood,
social network and resource use patterns.
Households’ successful response to the impacts of the disappearance of
the lake is a function of different endogenous and exogenous factors.
Households’ implementation of water reclamation and conservation
measures as a response to dryup the lake were influenced by
endogenous demographic factors (age of household head, household
size), socio-economic factors (land size, perception) and the existing
exogenous institutional factors such as market prices, fertilizer and
credit services. The combination of these factors explain Households’
success in implementation of water reclamation measures (i.e,
underground water withdrawal and /or rain water harvesting) so as to
boost agricultural production which is in continuous decline since the
lake disappeared. The long term impacts as well as responses to the
disappearance of the lake, which might include change in cropping
patterns, migration etc, are theme of interest for future study.
6.2 RECOMMENDATIONS
105
The result of this study exposed new development quests that emerged
from the existing socio-economic and environmental dynamism at
Haramaya Woreda that are relatively different from those that prevailed
while the lake was in existence. Therefore, these new social development
needs and challenges should be addressed in order to improve the
welfare of the people and promote sustainable resource use. To this end,
the study forwards the following measures as recommendation.
The government should enact, implement and follow up polices geared
towards sustainable use of open access resources and reduce population
pressure on the environment. Policy instruments that would help in
sustainable use of these resources include empowering local
communities through participatory community resource management,
provision of incentives for sustainable practices and introducing market
forces. These measures could salvage misuse of the resources and
enhance sense of ownership at local level. On the other hand, policy
instrument that reduces population pressure on these resources could
be provision of alternatives income and creation of off-farm employment
opportunities, livelihood diversification, reducing household size by
promoting family planning programmes.
Governmental and non- governmental organizations and other concerned
bodies should aim on the provision of services that would enhance
106
agricultural production and sound conservation practices. As confirmed
by this study, households’ participation in credit service, fertilizer use
and their perception to the depletion of the lake had significant influence
on the implementation of water conservation measures. As such,
provision of similar institutional services that increase agricultural
production and remedy sustainable conservation practices should be the
major focus of institutional interventions. Therefore, provision of these
services along with awareness creation in resources conservation and
management practices would help the local community to recover the
impacts quickly before further pressure is exerted on other resources in
the locality.
The finding of this study disclosed that there is an excessive withdrawal
of underground water by the household’s as response to the existing
water scarcity. This is manifested in sharp decline of the water table.
Such heavy reliance on the ground water may deplete the resource in the
long run. Besides, such immense removal of underground water can
result in land subsidence, which in turn causes cracking of the buildings
(Strahler and Strahler, 1997). Therefore, to save the resource and the
repercussions of its overuse and hence deletion, immediate intervention
should be taken to curb this unsustainable practice into sustainable
practice (e.g. rain water harvesting.
107

REFERENCE
Alemu Mekonnen (2003) ‘The Link between Environmental Change and
Poverty’ In Gideon Asfaw (ed) Environment, Poverty and Gender.
Consultation Papers on Environment No. 2 Addis Ababa: Forum for Social
Studies.
Bahiru Shikur (1993) Farmers’ Perception of Soil Erosion Problems and
their attitude towards Soil Conservation in Guraghe Highlands of
Butajira Awaraja, South Shoa. Unpublished M.A.Thesis. Addis Ababa
University.
Barrow, C. (1995) Developing the Environment: Problems and Management.
London. Longman Group.
Bekele Shifereaw and Stein Holden (1998) ‘Resource Degradation and Adoption
of Land Conservation Technologies in the Highlands of Ethiopia : a case
study of Andit Tid, North Shoa’, Agricultural Economics 18(1).
Bekele Wogayehu and Drake Lars (2002) Adoption of Soil and Water
Conservation Measures by Subsistence Farmers in Eastern Ethiopia..
Swedish University of Agricultural Science, Department of Economics.
Symposium No. 6.Paper No. 1747.
Belay Tegene (1995) Population Pressure and Problems of Arable Land
Degradation in Ethiopia; in Aklilu Kidanu, (ed) Integration of Population
Environment Equitable and Sustainable Development Issues into the
Curriculum of the Demographic Training and Research Center of the Institute
of Development Research at Addis Ababa University: A Workshop
Proceedings, Addis Ababa:35-47.
108

Boserup, E. (1965) The Conditions of Agricultural Growth: The Economics of
Agrarian Change under Population Pressure. London: Earthscan Publishers.
Burton, I., W. Kates and G.F. White (1993) The Environment as Hazard (2nd ed)
New York. Guildford press.
Central Statistics Authority (1996) The 1994 Population and Housing Census:
Results of Oromiya Region Statistical Report on Population Size and
Characteristics. Vol I, part I. Addis Ababa.
Chalachew Arega (2004) Environmental Responses to Socio-Demographic
Pressures in Alemaya District. Unpublished M.Sc Thesis. Addis Ababa
University.
Dejene Aredo (1996) ‘Population Density, Cultivation Systems and
Intensifying in Pre-Industrial Agriculture: Review of literature and
illustrations from Ethiopia’, in Mulat Demeke, et al (ed.) Sustainable
Intensification of Agriculture in Ethiopia. Proceedings of the Second Annual
Conference of Agricultural Economics Society of Ethiopia. Addis Ababa:
Agricultural Economics Society of Ethiopia.
Desgupta, P. (1992) Population, Resource, and Poverty. Special Issue Paper for
Natural Resources and Development, Ambio, 21(1), Feb 1992:1-16.
Ellen, R. (1982) Environment, Subsistence and System: the Ecology of Small
Scale Social Formations. Cambridge: Cambridge University Press.
Fortune News Paper, Vol. 8, No. 113, March 30, 2008.
109

Gidion Asfaw (2003) ‘Breaking the Cycle of Recurrent Famine in Ethiopia:
Natural Resource Management and Drought related Famine
Prevention’, in Economic Focus Bulletin of Ethiopian Economic Association.
Vol.5, No.5.
Gould, B.W., Saupe, W.E., and Klemme, R.M. (1989) ‘Conservation Tillage: The
Role of Farm and Operator Characteristics and the Perception of Soil
Erosion’. Land Economics 65(2): 167-82.
Gubrium, J.F. (1973) The Myth of the Golden Years as Socio-environmental
Theory of Aging. Springfield: Thomas Association.
Gujrati, D. N. (1995). Basic Econometrics. Third edition. McGraw hill, inc., New
York U.S.A.
Hammond, R. (1978) Quantitative Techniques in Geography: An Introduction.
New York. Oxford University Press.
Harper, C.L. (2004) Environment and Society: Human Perspectives on
Environmental Issues (3rd ed) New Jersey: Pearson Education Inc.
Hosmer, D.W. and S. Lemeshow (1989) Applied Logistic Regression. New York:
A Willey Inter-Science Publication
International Federation of Red Cross and Red Crescent Societies (1993) World
Disaster Report. Dordrecht.
Knees, A.V. (1977) Economics and the Environment. New York: Penguin Books.
110

Koning, N. and Eric Smaling (2002) Environmental Crises or “Lie of the
Land”? The Debate on Soil Degradation in Africa. Wageningen University,
North-South Center.
Livernash, R., and Rodenburg, E. (1998) Population Change, Resources and
the Environment. Population Bulletin, 53 (1), 20-21
Meyer, W.B. (1996) Human Impact on the Earth. Cambridge: Cambridge
University Press.
Miller, T.G. (1998) Living in the Environment (10th ed). Belmont, CA: Wadsworth.
Mohr, P.A (1960) The Geology of Ethiopia. Addis Ababa University College
Press.
Perry, R.W. and A.H. Mushkatel (1984) Disaster Management, Warning
Response and Community Relocation. Westport: Quorum.
Postel, S. (1996) ‘Forging a Sustainable Water Strategy’, in State of the World,
1996, Lester Brown et al, (eds). Washington DC: World Watch Institute pp.
17-21.
__________, (1993) ‘Water Scarcity Spreading’, in L. Starke (ed), Vital Signs 1993:
The Trends that are Shaping Our Future (pp106-7) New York.
Russell, D.W. and C,E. Cutrona (1991) Social Support, Stress and
Depressive Symptoms among Elderly. Journal of Psychology of Aging
6(2)190-211.
111

Shibiru Daba (2002) Investigation of the Physical and Socio-Economic
Determinants of Soil Erosion in Hararghe Highlands, Eastern Ethiopia.
Longautah State University.
Solomon Muleta (2002) Erosion and Sedimentation Analysis of Lake Alemaya
Catchment. Alemaya University: Unpublished M.Sc Thesis.
Solomon, S.D. et al (1987) Social Involvement as a Mediatory of Disaster
Induced Stress. Journal of Applied Social Psychology, 17(12) 1092-1112.
Southwick, C.H. (1996) Global Ecology in Human Perspectives. New York:
Oxford University Press.
Stern, P.C., Young, O.R. and Drukenman, D. (1992) Global Environmental
Change: Understanding the Human Dimensions. Washington D.C: National
Academy press.
Strahler Alan H. and Arthur N. Strahler (1997) Physical Geography: Science
and Systems of the Human Environment. New York: John Wiley and Sons.
Susman, P. et al (1983) ‘Global Disaster, Radical Interpretation’, in K. Hewitt
(ed) Interpretation of Calamites from view point of Human Ecology.
Bastion: Allen and Unwin: pp 263-72.
Tegegne Gebre Egziabher (1995) ‘Population and Renewable Resources in
Ethiopia, with emphasis on Forest, Rangeland and Water Resources’, in
Aklilu Kidanu, (ed) Integration of Population Environment Equitable and
Sustainable Development Issues into the Curriculum of the Demographic
Training and Research Center of the Institute of Development Research at
Addis Ababa University: A Workshop Proceedings, Addis Ababa:88-112.
112

Tobin, G.A. and B.E. Montz (1997) Natural Hazards: Explanation and
Integration. New York: Guilford Press.
United Nations (2001) Population, Environment and Development: The Concise
Report. Economic and Social Affairs. No Eo1. x 111.15. UN, New York.
White, G.F. (1974) Natural Hazards: Local, National and Global. New York:
Oxford University Press.
Yeraswork Admassie (1995) Twenty Years to Nowhere: Property Rights, Land
Management and Conservation in Ethiopia. Ph.D Dissertation, Uppsala
University.
Young, C. E. and J. S. Shortle (1984) ‘Investments in Soil Conservation
Structures: The Role of Operator and Operation Characteristics’.
Agricultural Economics Research 36 (2): 10-5
Zimmermann, E.W. (1951) World Resources and Industries. New York: Harper
and Brothers.
113

Annex. 1 Multicollinearity test for Continuous Variables
Collinearity Statistics
Variables Tolerance VIF
House hold size .921 1.086
Land holdings of sampled HH in timad .921 1.086
a Dependent Variable: Participation in water conservation activities Annex. 2 Multicollinearity test for Categorical Variables Age Literacy Off
farm
Credit Fertilizer use
Perception CRM
Age 1 Literacy 0.33 1 Off farm o.033 0.07 1 Credit 0.019 0.168 0.059 1 Fertilizer 0.086 0.188 0.052 0.133 1 Perception 0.091 0.058 0.088 0.148 0.107 1 CRM 0.10 0.291 0.032 0.209 0.278 0.017 1
114

Annex. 3 Questionnaire for Formal Survey
Addis Ababa University Institute of Development Research
Department of Environment and Development The Principal objective of this questionnaire is to investigate the livelihood
impacts of the disappearance of Lake Alemaya on the surrounding community,
and to explore the responses of the community to such environmental shock.
The study is intended for academic purpose. Hence, the responses from
respondents are confidential and can not be identified with the persons who
provided them. Thank you for your cooperation.
I. Identification
Name of the Enumerator
Date of interview
Name of the Kebele
Village name
II. Household characteristics
201. Name of the HH Age Sex
202. Marital Status: 1. Married n 2. Single 3. Divorced 4. Separated
203. Household Size(including HH Head
1. Male Children 2. Female Children
204. Education level 1, illiterate 2.Read 3. Write 4. Read and Write
205. Occupation: 1. Farmer 2. Civil Servant 3. Trader 4. Laborer
5. Other, (specify)
206. Religion: 1. Islam 2. Christian 3. Other (specify)
207. Land ownership 1. Own land 2. Rent in 3. Share cropping 4. Other
(specify)
208. Land size ___________(in Timad)
115
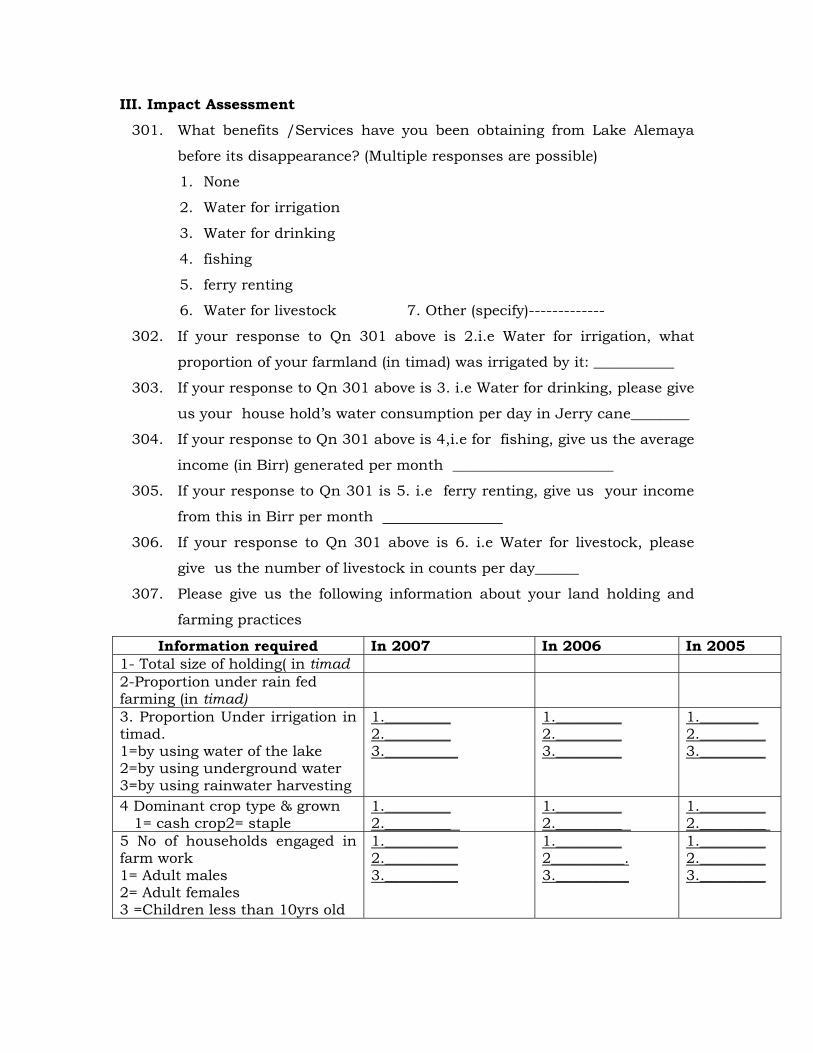
III. Impact Assessment
301. What benefits /Services have you been obtaining from Lake Alemaya
before its disappearance? (Multiple responses are possible)
1. None
2. Water for irrigation
3. Water for drinking
4. fishing
5. ferry renting
6. Water for livestock 7. Other (specify)-------------
302. If your response to Qn 301 above is 2.i.e Water for irrigation, what
proportion of your farmland (in timad) was irrigated by it: ___________
303. If your response to Qn 301 above is 3. i.e Water for drinking, please give
us your house hold’s water consumption per day in Jerry cane________
304. If your response to Qn 301 above is 4,i.e for fishing, give us the average
income (in Birr) generated per month ______________________
305. If your response to Qn 301 is 5. i.e ferry renting, give us your income
from this in Birr per month
306. If your response to Qn 301 above is 6. i.e Water for livestock, please
give us the number of livestock in counts per day______
307. Please give us the following information about your land holding and
farming practices
Information required In 2007 In 2006 In 2005 1- Total size of holding( in timad 2-Proportion under rain fed farming (in timad)
3. Proportion Under irrigation in timad. 1=by using water of the lake 2=by using underground water 3=by using rainwater harvesting
1._________ 2._________ 3.__________
1._________ 2._________ 3._________
1.________ 2._________ 3._________
4 Dominant crop type & grown 1= cash crop2= staple
1._________ 2._________
1._________ 2._________
1._________ 2._________
5 No of households engaged in farm work 1= Adult males 2= Adult females 3 =Children less than 10yrs old
1.__________ 2.__________ 3.__________
1._________ 2__________. 3.__________
1._________ 2._________ 3._________
116

308. Has any member of the household dropped out of schooling?
(1=Yes and 0=No)
1.In 2007 2. In 2006 3. In 2005__________
309. Is there any household member who abandoned the locality?
1. Yes 2. No (skip Qn 311)
310. If your response to Qn 309 above is yes, why do you think she/he
migrated from the area?
1. . Due to marriage 2.due to decline in household income
3. In search of job else where 4. Due to personal reasons
5. Due to land scarcity 6. Due to water shortage 7.Other (Specify)___
311. Please give us information on your households incident of conflict with
others in the use of the following resources over the periods indicated
(Write 1, if Yes and 0, if No under respective column below).
Resource type Incidents of conflict
Water Land Livestock Year Frequency
Once Twice
2007
More than twice Once
Twice 2006
More than twice Once
Twice 2005
More than twice
117

312. Please give us household’s crop production performance for the
indicated period.
Means of
production
1=Rain fed 2=irrigation
Area covered by the crop (in timad)
Amount
harvested
Crop type
2007 2006 2005 2007 2006 2005 2007 2006 2005
1.Sorghum(quintal)
2.Maize(quintal)
3.Teff(quintal)
4.Wheat (quintal)
5.Barley(quintal)
6.Chat( Kg)
7.Vegetables(Kg)
7.1 Potato
7.2 Cabbage
7.3 Onion
7.4 Others
313. How do you evaluate your household income over the last three years?
1. Increasing 2. Decreasing 3. No change
314. If your response to Qn 316above is’ decreasing’ what are the reasons?
1. Lack of water for irrigation
2. Low market prices for farm produces
3. High cost of living
4. increases in family size
5. high cost of farm input
6. other( specify)________
IV Response Assessment
401. How shocked were you by the disappearance of the lake Haramaya?
1. Very shocked 2. Shocked 3. Not shocked
118

402. Did you ever anticipate Lake Haramaya to disappear?
1. Yes 2. No
403. What did you account for its disappearance?
1. Punishment from God
2. Misuse and over use by both rural and urban population
3. Population growth
4. Climate change
5. Other (Specify)_________________
404. Had you been using water of Lake Haramaya for irrigation purpose
before its disappearance?
1. Yes 2. No
405. If Yes, how did you overcome water scarcity after it dried up?
1. By harvesting rain water
2. By using underground water
3. By shifting to less water dependent crops
4. By reducing water consumption
5. By shifting to rain fed farming
6. Others (Specify)
406. If your response to Qn 405 above is rain water harvesting, what are
your reasons?
1. Its simplicity
2. Local availability of technology
3. Exposure from my neighbors
4. Lesson by extension workers
5. Others (specify)
407. What are your constraints to rely on rain water harvesting?
_________________________________________________________________
_________________________________________________________________
_________________________________________________________________
119
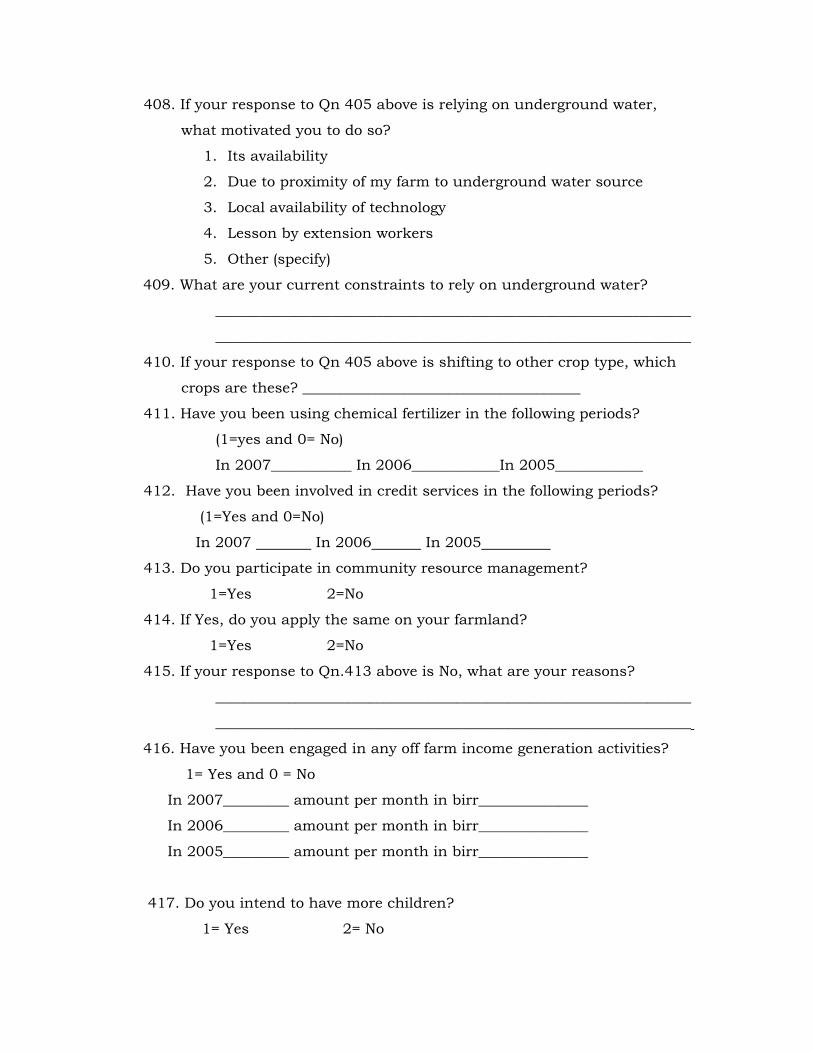
408. If your response to Qn 405 above is relying on underground water,
what motivated you to do so?
1. Its availability
2. Due to proximity of my farm to underground water source
3. Local availability of technology
4. Lesson by extension workers
5. Other (specify)
409. What are your current constraints to rely on underground water?
_________________________________________________________________
_________________________________________________________________
410. If your response to Qn 405 above is shifting to other crop type, which
crops are these? ______________________________________
411. Have you been using chemical fertilizer in the following periods?
(1=yes and 0= No)
In 2007___________ In 2006____________In 2005____________
412. Have you been involved in credit services in the following periods?
(1=Yes and 0=No)
In 2007 In 2006 In 2005
413. Do you participate in community resource management?
1=Yes 2=No
414. If Yes, do you apply the same on your farmland?
1=Yes 2=No
415. If your response to Qn.413 above is No, what are your reasons?
_________________________________________________________________
_________________________________________________________________
416. Have you been engaged in any off farm income generation activities?
1= Yes and 0 = No
In 2007_________ amount per month in birr_______________
In 2006_________ amount per month in birr_______________
In 2005_________ amount per month in birr_______________
417. Do you intend to have more children?
1= Yes 2= No
120

418.If not, what is/are your reason?
419. Do you allow children less than 10 years old in your household to work
in farm activities?
1=Yes 2=No
420. What other resources in the local area do you think are under threat of
disappearance? _____________________________________________________
421. What measures are you prepared to take to protect these resources at
individual level?
_________________________________________________________________
_________________________________________________________________
422. What do you think are the constraints to local resource management
and utilization (e.g. water) in your Kebele? (Multiple responses are
possible).
1. Competition between rural and urban users
2. Competition among rural household uses
3. Lack of social regulations and laws
4. Little or no awareness of resource management
5. Lack of leadership
6. Lack of required inputs
7. Other (specify)
423. What do you think should be done to solve these constraints?
_________________________________________________________________
_________________________________________________________________
424. Who do you think should solve these constraints?
_________________________________________________________________
_________________________________________________________________
425. How do you contribute in solving these constraints at individual level?
_________________________________________________________________
_________________________________________________________________
Thank you
121
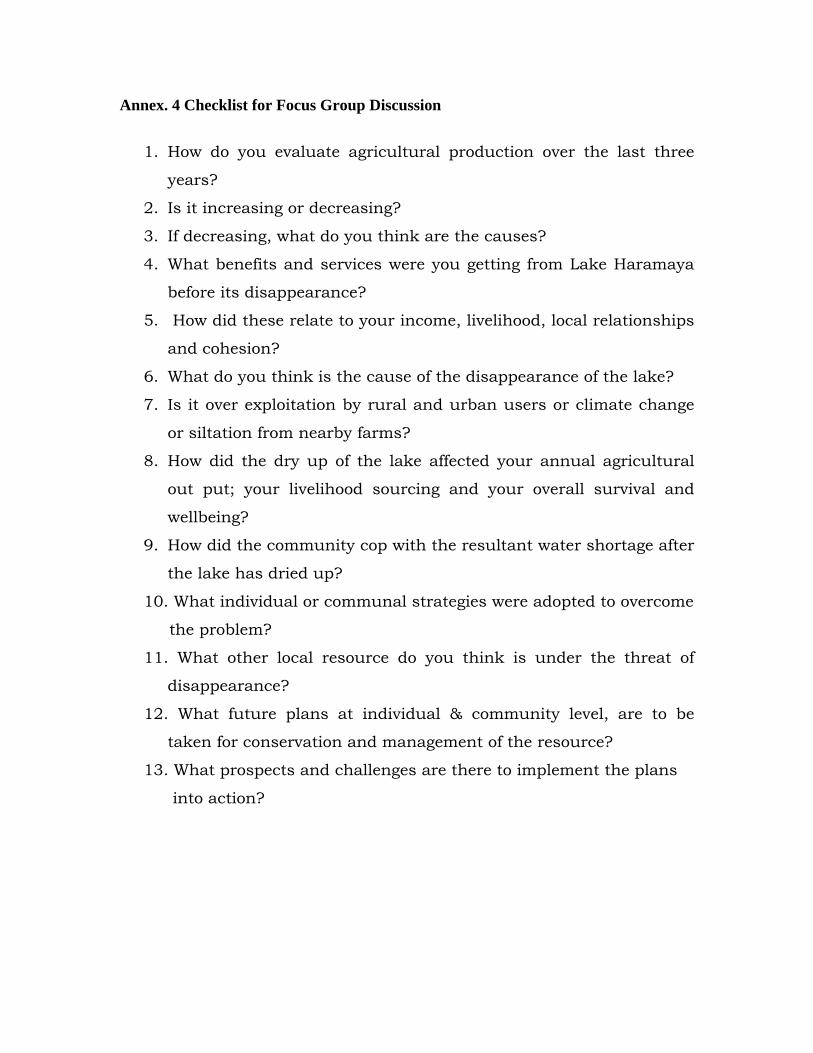
Annex. 4 Checklist for Focus Group Discussion
1. How do you evaluate agricultural production over the last three
years?
2. Is it increasing or decreasing?
3. If decreasing, what do you think are the causes?
4. What benefits and services were you getting from Lake Haramaya
before its disappearance?
5. How did these relate to your income, livelihood, local relationships
and cohesion?
6. What do you think is the cause of the disappearance of the lake?
7. Is it over exploitation by rural and urban users or climate change
or siltation from nearby farms?
8. How did the dry up of the lake affected your annual agricultural
out put; your livelihood sourcing and your overall survival and
wellbeing?
9. How did the community cop with the resultant water shortage after
the lake has dried up?
10. What individual or communal strategies were adopted to overcome
the problem?
11. What other local resource do you think is under the threat of
disappearance?
12. What future plans at individual & community level, are to be
taken for conservation and management of the resource?
13. What prospects and challenges are there to implement the plans
into action?
122

Declaration I, the undersigned, declare that this thesis is my original work and has
not been presented for a degree in any University. All the sources of
materials used for the thesis are duly acknowledged.
Name: _________________________________
Signature:_______________________________
Date: ___________________________________
Place: __________________________________
This thesis has been submitted for examination with my approval as a
University advisor.
Name: _________________________________
Signature:_______________________________
Date:___________________________________
Place:__________________________________
123