3d visual information and gis technologies for...
TRANSCRIPT

25
1. IntroductionThe graphic documentation of wall paintings and of the underly-ing architectural and/or archaeological structures must aim to fa-cilitate the highest grade of knowledge and communication.
As objective and metrically correct as such documentation maybe, it is, however, still subject to the interpretation of the persondocumenting it, whether obtained through traditional means orthrough the use of more advanced systems, such as, for example,photogrammetry. This does not mean that we must not search and,through experimentation, choose whichever methodology is bestsuited to tackle the diverse situations one may encounter.
In every documentation project, the first step is to create a spatialreference system used for proper positioning of all elements un-
der study both in absolute terms and in relation to each other,independent of the scale and complexity. Thanks to recent tech-nological advances, this part of the task has been greatly simpli-fied. New options and equipment are also beginning to aid us inthe successive part of the graphic documentation process: the ac-tual “retracing” of the objects of our study, either in high detail(as favoured by historians or archaeologists) or more schematically(to create a base for the conservationist’s thematic mappings) hasbeen made much simpler.
Digital technologies may be very helpful in the graphic documen-tation of wall paintings not only for the greater speed it offers,without compromising any detail, but in particular for the repre-sentation of data (structures and materials) in 3D; it offers thepossibility to have numerous dynamic views of the same model in
3D Visual Information and GIS Technologies for Documentation ofPaintings in the M Sepulcher in the Vatican Necropolis
Maurizio ForteCNR-ITABC, Istituto per le Tecnologie Applicate ai Beni Culturali
Via Salaria, km.29,300, C.P.10, 00016, Monterotondo St., Roma, Italy
e-mail: [email protected]
Stefano Tilia, Angela Bizzarro and Alessandro TiliaTREERRE sas, Roma, Via Gorgia di Leontini 170, 00124 Roma, Italy
e-mails: [email protected], [email protected], [email protected]
Abstract
Digital technologies may be very helpful in the graphic documentation of paintings, not only due to the inherently more detailedand faster method of drawing, but in particular due to the 3D representation of data (structures and materials) in real time, thatis, the possibility to have many dynamic views of the same model in order to visualize and interpret features and shapes, as wellas the state of conservation of structures and materials. Moreover, it is very important to highlight that paintings or mosaics areintelligible as 3D objects rather than 2D objects, since they ultimately represent solid objects. Thus, using GIS technologies forcollecting data, it is possible to process the relative information in detail.
There are many situations one has to face when dealing with graphical documentation of surfaces, whether flat, bossed orcurved, with or without decorations. The traditional form of graphic documentation, interpretative by definition, favours differ-ent levels of detail, depending on the scale of reduction and the different objectives under study (location of degraded areas asopposed to decorated ones, presence of discomformities and cracks, production of images and thematic maps derived fromparticular analyses, for example, thermal infrared surface scanning). It is certainly difficult to document a decorated vault. Forthis reason, we have chosen to consider the walls and the polychrome mosaic vault of the M sepulcher, also known as CristoSole (2.-3. cent. AD) which can be found in the Vatican Necropolis. The mosaic presents a small tessera decoration (of whichonly a fraction is still in place), on the walls and on the highly depressed vault; in places where the tesserae are missing, themosaic preparatory surface still enables us to interpret the original decoration.
Furthermore, the main goal of our project is a detailed virtual 3D reconstruction of a micro-model of the above mentioneddecorations through the use of digital techniques, in order to obtain a final “cognitive” representation. To obtain this, we haveimplemented new tools for the acquisition of detailed 3D surfaces.
The general positioning (georeferencing) was achieved using a Leica TCR 1103 total station; this instrument also enabled us toobtain vast amounts of surface data for the 3D model thanks to its reflectorless Laser EDM (Electronic Distance Measuring)range finder. Where more detail was necessary, further surface data was gathered using a Microscribe 3D Mechanical ArmDigitiser coupled to a laptop computer and driven by the Rhinoceros 3D surface modelling software.
The project involves the following main approaches: digital acquisition of surfaces, digital documentation of mosaics andpaintings, 3D virtual reconstruction of models and 3D virtual communication of the information by VRML metaphors throughthe Internet.
Key words: micro-GIS, 3D, M sepulcher, Cristo Sole, virtual reconstruction

26
order to visualise it and thus to interpret features, shapes, as wellas the state of conservation of structures and materials in real time.Moreover, it is very important to highlight that paintings or mosa-ics are intelligible more as 3D objects rather than 2D objects,because they represent a 3D class. As a result, using GIS tech-nologies, it is possible to process the collected data in detail inorder to interpret and analyse the digital content with multidimen-sional levels of overlay.
For this reason we have planned the following methodologicalgoals:
• Testing new systems for a micro-topological survey in emer-gency situations (very small spaces, detailed architectonicfeatures, preservation of materials).
• Considering digital graphic representation of mural paint-ings and mosaics as three-dimensional information (insteadof two-dimensional).
• Using 3D GIS techniques for an interactive visualisationof architectonic models and 3D databases (figures 6-9).
On the basis of the above mentioned approaches, we have imple-mented the following main stages:
• Digital acquisition of all architectonic surfaces with a 3Dpantograph (Microscribe, http://www.immerse.com/microscribe/digitizers.html) for a total of 11.000 points(figure 4).
• Rectification and digital photo-mosaic of all walls (3 wallsand 1 vault, figures 5-8)).
• Infrared thermal survey (thanks to ENEA’s contribution,Ente per Nuove Tecnologie, l’Energia e l’Ambiente).
• 3D interpolation of the micro-relief data (figure 9).
• Digital data-entry in a 3D GIS.
• Texture mapping and draping of all graphic surfaces of thewalls on the micro-DEM (figures 6-8).
• Virtual reconstruction of the tomb in VRML (figure 10).
2. The Vatican NecropolisThe work presented here was carried out during the restorationworks in the Vatican Necropolis (figure 3). This previously open-air burial ground is now placed under the nave of St. Peter’s Ba-silica. In fact, the Necropolis was covered when the ConstantinianBasilica was erected. Furthermore, successive burials have alteredthe stratigraphy of the site which was also influenced by the struc-tural works for the construction of Bernini’s Baldacchino and thesequence of constructed altars, the construction of which took placeduring the centuries gone by. All of this took place on top of thesacred spot considered to be St. Peter’s burial place. Today theNecropolis presents itself with walls of considerable size whichcan be found in a good state of conservation, although the view isat times obstructed by modern pillars needed to sustain the abovestructures. These proved necessary after the soil removal follow-ing the excavations carried out in the early 1940s. The exploredarea of the Necropolis covers an extension of about 69 x 18 me-ters and presents itself as a double row of burial edifices sepa-rated by a narrow passageway. In particular, the M sepulcher isinserted between two other structures of which it uses the outerwalls; this makes it one of the last, chronologically speaking, con-structions of the Necropolis (Apolloni Ghetti et al. 1951).
3. The M sepulcher, known as Cristo Sole(Christ the “Sun God”)The M sepulcher (figure 2) was discovered in 1574 during anexcavation carried out under the pavement of St. Peter’s Basilica(Guarducci 1997). Thanks to the discovery of an epigraph (ofwhich only a transcription of its text has reached us) and throughthe study of the wall typology, it was possible to suppose an origi-nally pagan structure, dated from the mid second century AD, andits successive transformation into a Christian mausoleum at thebeginning of the third century. A very rich mosaic decoration origi-nally covered the upper portions of the walls and the whole vault,while the lower portions of the walls were decorated with geo-metric patterned frescoes. Today the mosaic decoration is par-tially missing, however, it is possible to recognize the originaldesigns thanks to the traces left by the lost tesserae which indicateM sepulcher as the only entirely Christian burial in the Necropo-lis. On the preparation layer of the mosaic on the west side we cancatch a glimpse of the Good Shepherd; on the frontal (north) scenewe can see the Fisherman (Christ or Peter) with a fishing rod; onthe eastern most hand side lies the depiction of Jonah being swal-lowed by the Whale and finally, on the vault lies the image ofChrist as the “Sun God” ascending to the sky on a chariot drawnby four horses; the later image is surrounded by an interlacementof vine branches and leaves (Guarducci 1997, Apolloni Gheti etal. 1951). The complexity of the structure, the decorations and theindubitable importance of this sepulcher were decisive factors in
Figure 1: Total laser station for the topographic survey.

27
selecting it as an example for testing the integration of differentdocumentation and analysis methodologies.
4. The Micro-topographic surveyThe survey and graphic documentation of the Necropolis planwas carried out (thanks to a Sokkia SET 4C total station, figure 1)by creating an accurate surveying base through the establishmentof a closed traverse with branches entering into each and everymausoleum; this involved the placement of around 70 instrumen-tal stations. All mausoleums were documented in detail with alldocumentation referable to this topographical base (figures 2-3).
The surveying instrument also proved very useful at recording thesalient points necessary to carry out a metrically correct docu-mentation of wall paintings and architectural decorations eventhrough the subsequent use of traditional means (measuring tape,plumb bob, level etc). When faced with the particular conditionsposed by the “M” Mausoleum it was decided that a more uncon-ventional approach might not only simplify the task but also pro-vide the capability of representing the object of study in a radi-cally new way: by virtually recreating the actual surfaces of thewalls and vault, in full detail, with the obvious superimposition ofthe decorations (mosaic or painting) they were adorned with.
Although the concept of a computer generated 3D model was notnew, it had always been applied to generate, at the most, sche-matic exemplifications of structures on which to project the im-ages of any surface texture, obtaining a great general effect, butstill hardly useful for the purpose of study. We were encouragedin this by the availability of two new instruments: a total station(Leica TC1103) equipped with a coaxially (along the line of sight)mounted reflectorless EDM laser (this laser does not need reflect-ing prisms to measure distance) and a 3D digitising arm, that is asort of 3D pantograph (Microscribe 3DLX).
A few words should be said on this last item: the Microscribe is a3D digitising (figure 4) precision mechanical arm in which highperformance sensors embedded in its articulated joints track theposition and orientation of the stylus tip as it is moved in space bythe operator. By pressing a button or a foot pedal (depending onthe accessory in use), it is possible to record the relative spatialposition of the tip in any given moment and, through a serial con-nection, send such data to a computer. There are many CAD and/or 3D oriented software packages capable of making use of suchinputs just as if it were coming from a mouse or digitising tablet(with the fundamental difference of the 3D nature of such data).
Moreover, the system is highly portable: whether it is set on atable simply sitting on its base or on a tripod it can be placed justabout anywhere provided there is a power source and a connec-tion to a computer (a notebook for example). Not only is it possi-ble to record single points but also streams of points by keepingthe input button or pedal continuously pressed while the stylus tipis passed over the object we want to digitise; this method is par-ticularly useful in association with software that makes use of“point clouds”. Since the first three points recorded during a digi-tising session are used to establish the reference plane to which allsuccessive points are referenced, it is also possible to fix in a dif-ferent area, another set of three points during the same session tobe used as reference points for a subsequent session. This enablesmuch wider areas to be covered, far beyond the actual reach ofthe digitiser. As a last consideration we must not underestimatethe intuitive and easy operation of this device, with which theoperator is always in total control of all activities.
With these instruments, we were able to accurately reproduce avirtual representation of the actual surfaces in extreme detail andaccuracy and not only plot points or lines. The “M” Mausoleumpresented varying characteristics such as “frescoed” and “oncemosaic covered” (though still readable thanks to the traces left bythe lost tesserae on the preparation layer) wall surfaces and a vaultwith a rather undefined shape (a very low cross vault) only partlycovered with the polychrome mosaic that once characterised thewhole upper portion of the mausoleum.
The first step was to place the laser EDM total station inside themausoleum onto a predetermined station tied to the main traverseused in the survey of the Necropolis plan. Through the use of thisinstrument we were able to scan the different wall and ceilingsurfaces, carefully distinguishing the brick and plastered surfacesof the left wall, the mosaic preparatory layer, the corbel andfrescoed lower portion of the front wall, and the preparatory layerand fresco of the right wall. Furthermore, the total station wasused to record points for spatial referencing and geometric rectifi-cation of the photographs of various surfaces. Finally, we recordedthe points to be used later on in order to reference the 3D digitisersurvey sessions (3 points for every session).
The 3D digitiser was used to retrace the outer contour of the onlyremaining portion of the mosaic placed on the vault, point by point.A series of parallel lines running over the vault’s surfaces were
Figure 2: Entrance to the “M” Mausoleum, known as the“Cristo Sole” (Christ the Sun God).
Figure 3: Plan of the Vatican necropolis.
28
also digitised to be used as a basis for their reconstruction. Thisprocedure was chosen given the insufficient clearance betweenthe vault and the total station for the laser rangefinder to workproperly. All the frescoed designs and the traces of figures left onthe lost portions of the mosaics were digitised with the MicroscribeArm and, as a further test, a detail of the face of Christ was digi-tised tessera by tessera prior to the restoration operations.
At this point we had a clear indication of how helpful these tech-niques were in obtaining metrically correct graphic documenta-tion directly on site, through the detailed examination of all ele-ments necessary for the interpretation and comprehension of thestructures and of the decorative apparatus.
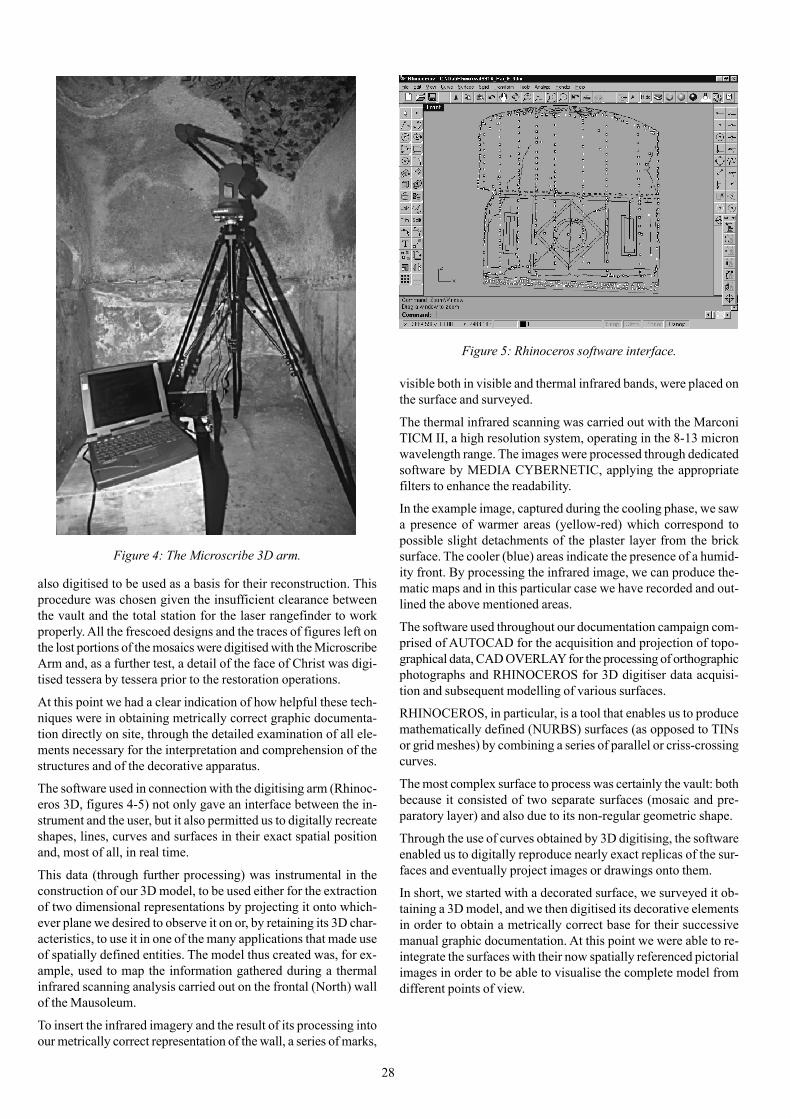
The software used in connection with the digitising arm (Rhinoc-eros 3D, figures 4-5) not only gave an interface between the in-strument and the user, but it also permitted us to digitally recreateshapes, lines, curves and surfaces in their exact spatial positionand, most of all, in real time.
This data (through further processing) was instrumental in theconstruction of our 3D model, to be used either for the extractionof two dimensional representations by projecting it onto which-ever plane we desired to observe it on or, by retaining its 3D char-acteristics, to use it in one of the many applications that made useof spatially defined entities. The model thus created was, for ex-ample, used to map the information gathered during a thermalinfrared scanning analysis carried out on the frontal (North) wallof the Mausoleum.
To insert the infrared imagery and the result of its processing intoour metrically correct representation of the wall, a series of marks,
visible both in visible and thermal infrared bands, were placed onthe surface and surveyed.
The thermal infrared scanning was carried out with the MarconiTICM II, a high resolution system, operating in the 8-13 micronwavelength range. The images were processed through dedicatedsoftware by MEDIA CYBERNETIC, applying the appropriatefilters to enhance the readability.
In the example image, captured during the cooling phase, we sawa presence of warmer areas (yellow-red) which correspond topossible slight detachments of the plaster layer from the bricksurface. The cooler (blue) areas indicate the presence of a humid-ity front. By processing the infrared image, we can produce the-matic maps and in this particular case we have recorded and out-lined the above mentioned areas.
The software used throughout our documentation campaign com-prised of AUTOCAD for the acquisition and projection of topo-graphical data, CAD OVERLAY for the processing of orthographicphotographs and RHINOCEROS for 3D digitiser data acquisi-tion and subsequent modelling of various surfaces.
RHINOCEROS, in particular, is a tool that enables us to producemathematically defined (NURBS) surfaces (as opposed to TINsor grid meshes) by combining a series of parallel or criss-crossingcurves.
The most complex surface to process was certainly the vault: bothbecause it consisted of two separate surfaces (mosaic and pre-paratory layer) and also due to its non-regular geometric shape.
Through the use of curves obtained by 3D digitising, the softwareenabled us to digitally reproduce nearly exact replicas of the sur-faces and eventually project images or drawings onto them.
In short, we started with a decorated surface, we surveyed it ob-taining a 3D model, and we then digitised its decorative elementsin order to obtain a metrically correct base for their successivemanual graphic documentation. At this point we were able to re-integrate the surfaces with their now spatially referenced pictorialimages in order to be able to visualise the complete model fromdifferent points of view.
Figure 5: Rhinoceros software interface.
Figure 4: The Microscribe 3D arm.

29
5. GIS and visual informationThe main goal of our project was a detailed virtual 3D reconstruc-tion of micro-models of paintings documentation by digital tech-niques and through different information layers, in order to obtaina final “cognitive” representation (Forte 2000). In the case of amonument such as a tomb, the best cognitive micro-representa-tion is increasing the level of knowledge and of interpretation,practically de-constructing in the first phase the pictorial andarchitectonic information, finally, recombining every componentof the structure into a unique, whole virtual model. The process ofde-construction and re-construction is a cognitive dynamic proc-ess of knowledge that we think is fundamental for a new approachto digital graphic representation: we disassemble and then reas-semble information. Thus a model becomes an articulated set ofmulti-layered information, where the whole increased model ismore significant than each single component.
In this context, 3D GIS (Geographic Information System) andvirtual reality technologies have been fundamental in obtaininggood results. In fact, even though GIS software is typically usedin territorial studies and analyses, it can give very interesting re-sults also in other non-traditional contexts. Furthermore we haveto consider GIS as an open planning platform, where the scien-tific user chooses the directions of research, combining severallayers of documentation.
All the work phases have been carried out exchanging all dataonline (by Internet tools) and creating a network of persons withdifferent roles and functions: topographic survey and acquisition(A. Bizzarro, S. Tilia), data processing (S. Tilia), rectification andtopological referencing of images (A. Tilia), GIS implementationand 3D processing (M. Forte), VRML reconstructions and virtualreality applications (A. Tilia, S. Tilia, M. Forte).
In order to process the digital data the following software wasused:
• ER Mapper 6.1 (3D visualisation and draping, infraredspectral analysis);
• Arcview 3.1 (GIS data-entry and overlay);
• VRML Cosmo Player (3D visualisation of the reconstructedmodel).
In our case the most important work phase was the superimposi-tion of data, that is the representation of data in a unique refer-enced co-ordinate system, through the exact use of a GIS imple-mentation.
Starting from the importation of data within the GIS, the mainsteps of the working project have been the following:
• Data entry of vector (drawings) and raster (images) files.
• Topological referencing of raster (photomosaics and graph-ics) and vector (decorations, drawings) layers in Arcview(figures 6-9).
• 3D interpolation of data by CAD and GIS software(Arcview 3D Analyst) for the creation of 3D surfaces (in-terpolation by GRID and by TIN, figure 8).
• 3D Superimposition of all the geometric and graphic lay-ers (figures 6-9).
• 3D Texture mapping of the graphic documentation overthe model and draping of all the referenced data over themicroDEM of the walls and of the vault (figure 9).
• Real time visualisation of the virtual models (in our case 4models for the documentation of the tomb) using Er Map-per and the 3D Analyst module of Arcview.
• Merging all types of data systems in order to analyse andto compare the different information layers (raster and vec-
Figure 6: N wall: GIS overlay of contour levels.
Figure 7: N wall: GIS 3D overlay of different layers (infraredprocessing, contour levels, drawings, outlines).

30
tor, such as images, contour lines, polylines, graphic edges,interpretations and so on).
• Z exaggeration of the interpolated models in order to stressthe surfaces for testing the state of conservation of the muralpaintings, and the relationships between mosaics, graphicdecorations, architectonic elements, lack of materials, etc.
• Model reconstruction in VRML (Virtual Reality Model-ling Language, see below) in order to visualise and to in-teract the data online using the Internet or offline on anyPC (figure 10).
One of the most important final steps of GIS applications shouldbe the communication of available data online. The chance to putinformation (raster, vector, 3D, etc.) on the Internet gives schol-ars and other interested people the possibility to access remotesystems, thus enabling them the comparison and analysis of dataand finds. The development of multimedia applications within aGIS environment is now in progress but it will represent one ofthe most interesting possibilities for communicating informationin the future. In particular the Internet or a net of georeferenced3D databases and graphic libraries could constitute the final goalof GIS, giving the users the possibility to obtain and add informa-tion in real time. In our case, using the 3D analyst module ofArcView, the 3D GIS models were reassembled in VRML 2.0, soas to explore them interactively through Internet browsers.
5.1. 3D InterpolationInterpolation methods allow the creation of 3D surfaces startingfrom scattered elevation points (or Z values); the choice of themethod of interpolation influences the interpretation of the model,thus it is important to know the main techniques in order to obtaingood results. In fact topographic, topological or digital terraindata, once “gridded”, can be processed and displayed to highlightimportant physiographic and/or geometric features in territorialor architectural contexts. The 3.0a release of 3D Analyst involves
two methods of interpolation, Grid and TIN (Triangulated Irregu-lar Networks).
• Grid interpolation is a representation of surfaces using amesh of regularly spaced points. The grid model is simpleand processes on them tend to be more efficient than thoseon other models. Elevation data in the grid format is rela-tively abundant and inexpensive. However, the mesh struc-ture prevents linear features from being represented suffi-ciently for large-scale applications.
• On the other hand, Triangulated irregular networks (TIN)represent surfaces using contiguous, non-overlapping tri-angle facets. One can estimate a surface value anywhere inthe triangulation by averaging node values of nearby tri-angles, giving more weight and influence to those that arecloser. The resolution of TINs can vary, because they canbe more detailed in areas where the surface is more com-plex and less detailed in areas where the surface is simpler.The coordinates of the source data are maintained as partof the triangulation, so subsequent analysis, like interpola-tion, will produce the source data precisely; no informa-tion is lost. Unfortunately TINs tend to be expensive tobuild and process. The cost for having good source datacan be high and processing them tends to be less efficientthan grids. We can consider this step a detailed“microrelief” of the structures.
6. VRML reconstructionThe Virtual Reality Modelling Language (VRML), is a 3D mod-elling language for virtual reality applications using 3D scenes.On the basis of the definition of the VRML consortium, VRML isan open standard for 3D virtual and multimedia worlds, connectedand linked by the Internet. In December 1997, VRML has beenclassified as an international standard (ISO/IEC-14772-1: 1997)from ISO (International Standard Organisation) and from the In-ternational Electro-technical Commission.
The VRML model was created in order to permit standard accesson the web to interactive virtual environments; in fact, over a fewyears, it has become the most used language for the representa-tion of 3D scenes online. Furthermore the new powerful versions
Figure 8: E wall: grid interpolation and vector overlay.
Figure 9: 3D visualization of the vault with contour levels.

31
of VRML (2.0 and VRML97) allow specific tools for animationsand interactions with the users, very important in the field of vir-tual reality.
Furthermore, in our project, after the GIS applications we com-pleted the 3D reconstruction of the tomb in VRML (figure10), sothat the whole monument could be explored in real time, includ-ing textures (photo-mosaics of the walls) and geometry.
The VRML model can be visualised using freeware browsers thatcan be downloaded from the Internet; to view our reconstructionwe use Cosmo Player (created by Silicon Graphics, http://www.cai.com/cosmo/). In this way access to VRML models isavailable to everybody. For instance the 3D models were createdand explored using Cosmo Player 2.1 (Silicon Graphics) as abrowser. Using the virtual console of the browser, and visualisingthe model, it is possible to move forward and back, turn left andright, tilt up and down, seeking, sliding, and so on. The interac-tion in real time and a user friendly interface allows us to describethe model as a cognitive model: in fact during the virtual naviga-tion we perceive new information and new ways of visualisation,without the need to have GIS software for representing the data.
7. ConclusionsThe digital project of the “Cristo Sole” tomb demonstrates that avisual information system is very important for a deep knowledgeof the monument and of the pictorial content, whether for a scien-tific analysis, or for technological communication (digital edit-ing). In fact the key point of the project was to test the possibilityof using GIS systems in “monumental archaeology”, mainly inte-grating 2D and 3D data sources. In this case we can talk of in-creased reality, because the digital technologies have introducednew levels of information, completely unknown before (Barcelóet al. 2000). This approach opens new directions in particular forgraphic representation, mainly because it encourages us to visual-ise multiple dynamic models, not only a simple “drawing”. Anopen platform, such as GIS or another specific visual informationsystem, gives the scientific community the possibility to interact,step by step, with a universe of information, always updateableand constantly increasing. In fact it is important to highlight that avirtual model is an open model, expandable with further docu-mentation and interpretation layers (Barceló et al. 2000).
Moreover the use of a 3D tool (Microscribe arm) for creating themodels has shown us another innovative system of micro-survey:at the same time it is possible to draw graphic outlines and toobtain architectonic geometry, verifying, point by point, the shapeand dimension of the 3D surface.
Finally, in a few words, we can summarise the main results andthe significant perspective that this project opens:
• 3D Data acquisition; new tools of 2D-3D data-acquisitionthrough the use of a digital pantograph (Microscribe arm)have shown great potentialities for micro-topologicalgraphic documentation, mainly in situations where it isdifficult to operate with other systems.
• 3D Visual Information by a GIS application and spatialanalyses. The creation of a visual information system (inour case GIS) has involved a different approach to thegraphic representation of mural paintings. A dynamic visualmodelling can open new perspectives in the study, analy-
sis and the scientific communication of a painting’s docu-mentation.
• 3D Multi-layered analysis. The combination and the over-lay of different sources of data increase the level of knowl-edge of the site on the basis of data-crossing; a more ad-vanced interpretation depends on the superimposition ofreferenced data.
• Monitoring of the monument through time. For monumentssuch as the Cristo Sole tomb, it is fundamental to monitorthe state of conservation, mainly analysing all the factorsof alteration (chemical, physical, architectonic) in a multi-layered visualisation (with the superimposition of graphicinformation).
• 3D Virtual reconstruction. By assembling every 3D com-ponent we have the possibility to visualise and study themodel through an interactive and full visualisation, in par-ticular excluding the difficulties existing with real viewson site.
• The next stage of possible processing concerns the crea-tion of a complete 3D database of the Vatican Necropoliswith further information layers of non-destructive chemi-cal-physical analyses.
AcknowledgementsSpecial thanks are due to His Eminency Cardinal Virgilio Noè,President of the Fabbrica di San Pietro, for having authorised thepublication of this paper and to ENEA for the thermal infraredanalysis.
ReferencesAPOLLONI GHETTI, B.M., FERRUA, A., JOSI, E., KIRSCH-
BAUM, E., 1951. Esplorazioni sotto la Confessione di S.Pietro in Vaticano, Vol. 1, 38-43, Città del Vaticano.
BARCELÓ, J.A., FORTE, M. and SANDERS, D., 2000. Aboutvirtual archaeology: disorders, cognitive interactions andvirtuality. In Barceló, J.A., Forte, M. and Sanders D. (eds.),Virtual Reality in Archaeology. ArcheoPress, Oxford (BAR,International Series 843).
GUARDUCCI, M., 1997. Fondamento della Chiesa. Itinerarionei Sotterranei della Basilica Vaticana, 20-21, Città delVaticano, 1997.
Figure 10: VRML reconstruction of the whole tomb.

32
FORTE, M., 2000. About virtual archaeology: disorders, cogni-tive interactions and virtuality. In Barceló, J., Forte, M.and Sanders, D. (eds.), Virtual reality in archaeology, Ox-ford, ArcheoPress (BAR International Series S 843), 247-263.