3d selection of envisat data for ... - earth online -...
TRANSCRIPT
Second Space for Hydrology Workshop 1
3D SELECTION OF ENVISAT DATA FOR IMPROVED
WATER STAGE TIMES SERIES ON THE RIO NEGRO AND
ADJACENT WETLANDS (AMAZON BASIN)
Joecila Santos da Silva1,2, Emmanuel Roux3, Otto Corrêa Rotunno Filho1, Marie-
Paule Bonnet3, Frédérique Seyler3 and Stéphane Calmant2
1 : Programa de Engenharia Civil – COPPE Universidade Federal do Rio de Janeiro – UFRJ Caixa Postal 68506 21945-970, Rio de Janeiro, Rio de Janeiro, Brasil. 2 : Laboratoire d’Etudes en Géophysique et Océanographie Spaciales – LEGOS (CNES/CNRS/IRD/UPS/OMP) 14 avenue Edouard Belin 31400, Toulouse, France. 3 : Laboratoire des Mécanismes et Transferts en Géologie – LMTG, (CNRS/IRD/OMP/UPS) 14 avenue Edouard Belin 31400, Toulouse, France. Corresponding author. E-mail addresse: [email protected] (J. S. Silva)
Second Space for Hydrology Workshop 2
ABSTRACT Time series of water stages derived from satellite radar altimetry are of very variable quality, depending on the mission, the tracking scheme and the geomorphological context of the crossing between the satellite track and the river. Also, it has long been observed that this quality is dependent on the hydrological cycle itself: stage values are often much worse at low water compared to those determined at high waters. This problem is mostly due to the data selection. Indeed, common window for data selection is mostly geographical. At low waters, measurements contaminated/distorted by non-water reflectors are more likely present within the selection window because of emerged river banks and/or islets. We have developped a processing scheme based on the GRASS freeware GIS to improve the selection of the satellite measurements and reduce the incorporation of non-water measurement within the dataset retained for estimating the water stage. This scheme has been successfully applied to the ENVISAT mission over the Rio Negro where reliable water stages could be obtained far upstream at both high and low waters, and also over adjacent wetlands.
Key-words: Spatial altimetry, Rio Negro basin, water level.
Second Space for Hydrology Workshop 3
Introduction
In the last decades, the demand for answering more challenging questions
related to the study of climate modifications posed a series of issues about the
understanding of hydrological systems. This type of scientific problem requires
knowledge of how physical processes take place and occur under a framework
that includes different spatial and temporal scales jointly with physical
constraints. Understand and forecast the effect of climate changing requires that
we understand the hydrological basin as a component of a broad system, which is
dynamic and highly complex, including in particular in temporarily inundated
zones that play an important role in the local hydrological cycle (Birkett, 1995).
Among these hydrological systems, the Amazon is one of the most important. The
Amazon basin is characterized by its large drained area (37% of South America),
together with the low altitude of the alluvial plain that presents a very mild
average slope (1cm/km) (Guyot et al. 1993 and 1994). Consequently, it is made
up of a complex net of lakes more or less connected to the main river channels
and covering areas estimated between 60 000 km2 (Sippel et al. 1998) and 300
000 km2 (Junk, 1983). During flooding season, waters of main stems drain into
these lakes and remain there for several months. As a consequence, this
outpouring modifies the flood peak of the rivers. In the dry season, the water
stored in the flooded plains is released, leading to an increase of the drought.
These great lakes work as natural reservoirs affecting the hydrological cycle of
the main Amazon River channel and main tributaries and therefore, that of the
global hydrological cycle. As many other large tropical basins, the Amazon basin
is poorly monitored and lacks stage information for all the aforementioned
components of the hydrographic network. Then, getting time series of water stage
by means other than readings at local gauges is mandatory. Therefore, this study
Second Space for Hydrology Workshop 4
focuses on building time series of water stage using satellite altimetry for the
large rivers channels, reduced-size tributaries and wetlands within a sub-basin of
the Amazon basin, the Rio Negro basin. The ~2000 km long Negro River is the
second river in the world in terms of water volume (IBAMA, 2007). Its basin
drains approximately 700.000Km², ~ 10% of the entire Amazon Basin. It starts
so-called Chamusiqueni river in the plateau of Guainia Comissary, Republic of
Colombia, at ~180m of altitude. Its name next turns to Guainia River in the
Colombia and Venezuela central lands and last changes to Negro river in the
Brazilian Amazon, after its confluence with the Casiquiare River at the Brazil-
Venezuela boundary. The riverbed roughly trends southeastwards until its
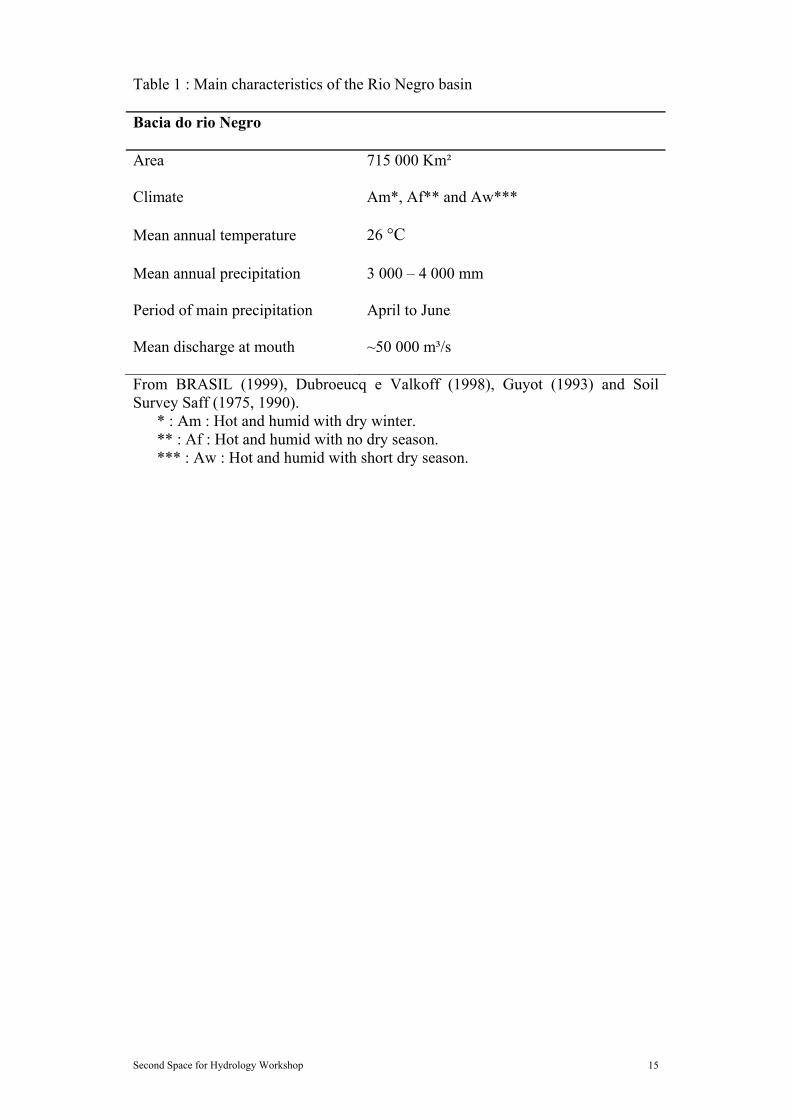
junction with the Solimões River at Manaus. Its main climatic characteristics are
listed in Table 1.
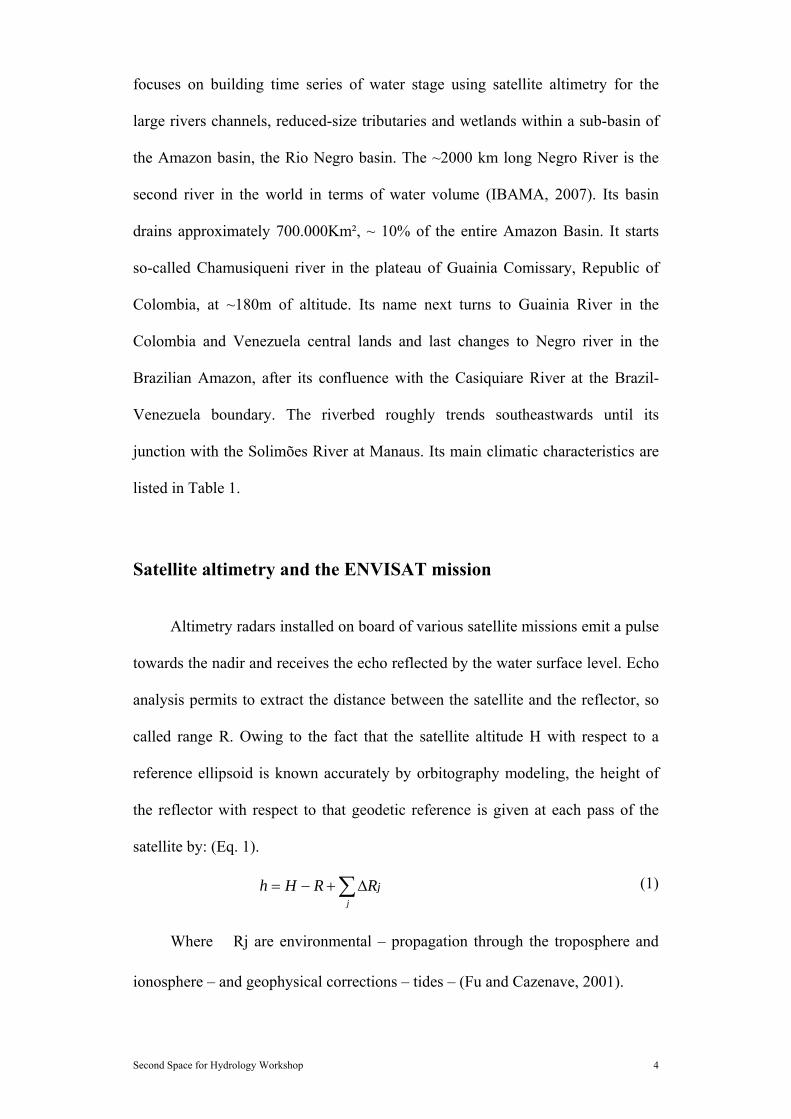
Satellite altimetry and the ENVISAT mission
Altimetry radars installed on board of various satellite missions emit a pulse
towards the nadir and receives the echo reflected by the water surface level. Echo
analysis permits to extract the distance between the satellite and the reflector, so
called range R. Owing to the fact that the satellite altitude H with respect to a
reference ellipsoid is known accurately by orbitography modeling, the height of
the reflector with respect to that geodetic reference is given at each pass of the
satellite by: (Eq. 1).
j
jh H R R= − + Δ∑ (1)
Where �Rj are environmental – propagation through the troposphere and
ionosphere – and geophysical corrections – tides – (Fu and Cazenave, 2001).
Second Space for Hydrology Workshop 5
In the frame of the Earth Observation Program, the European Spatial
Agency (ESA) launched the satellite ENVironmental SATellite (ENVISAT) in
March, 2002. It is the biggest satellite for Earth observation built until now. Data
collected by ENVISAT are dedicated for Earth environmental and climate change
analyses. ENVISAT embarks 10 instruments that allow a strict analysis of
atmosphere, continents, oceans and ice of the planet (Wehr and Attema, 2001)
including a nadir radar altimeter (RA-2 or Advanced Radar Altimeter). ENVISAT
orbits a helio-synchronous circular orbit with an inclination of 98.5° and a 35 day
repeat period. It fulfills a global cover of Earth within latitudes of ± 82.4° and an
intertrack distance of approximately 80 Km at the Equator.
ENVISAT embarks RA-2, a high precision radar pointing towards the
nadir and operating in two frequencies (Zelli, 1999), e.g. at 13.575 GHz (2.3 cm
wavelength, Ku band) and at 3.2 GHz (3.4 cm wavelength, S band). This dual-
frequency system enables estimating the ionospheric delay. The width of the
ground footprint is approximately 3.4 km.
Virtual Stations and altimetry data processing
A virtual station consists in the intersection of a satellite track with a water
body, making possible to derive time series of the water stage variations from the
radar measurements at each pass. However, all the radar measurements a priori
returned by a water surface are not necessarily valid measurements. Indeed,
several factors may affect the measurement among which the most frequent are:
+ non-water reflectors such as banks, islets, vegetation, etc… may have
bounced significant energy together with the water surface and affect the
computation of the range;
Second Space for Hydrology Workshop 6
+ the water surface at the rim of the footprint may dominate the energy
received by the satellite although the latter is not right over the water body (so-
called “hooking” artifact) and translate to an apparently valid – but slant- range.
In order to overcome these problems in the selection of the data to be
included in the estimate of a water height, we have developed a methodology to
altogether geographically and visually select the altimetry data at the virtual
stations. The VALS software (VALS standing for Virtual ALtimetry Station)
consists in routines developed in the frame of the GRAS GIS 6.1 freeware SIG.
The data processing is performed in three main steps:
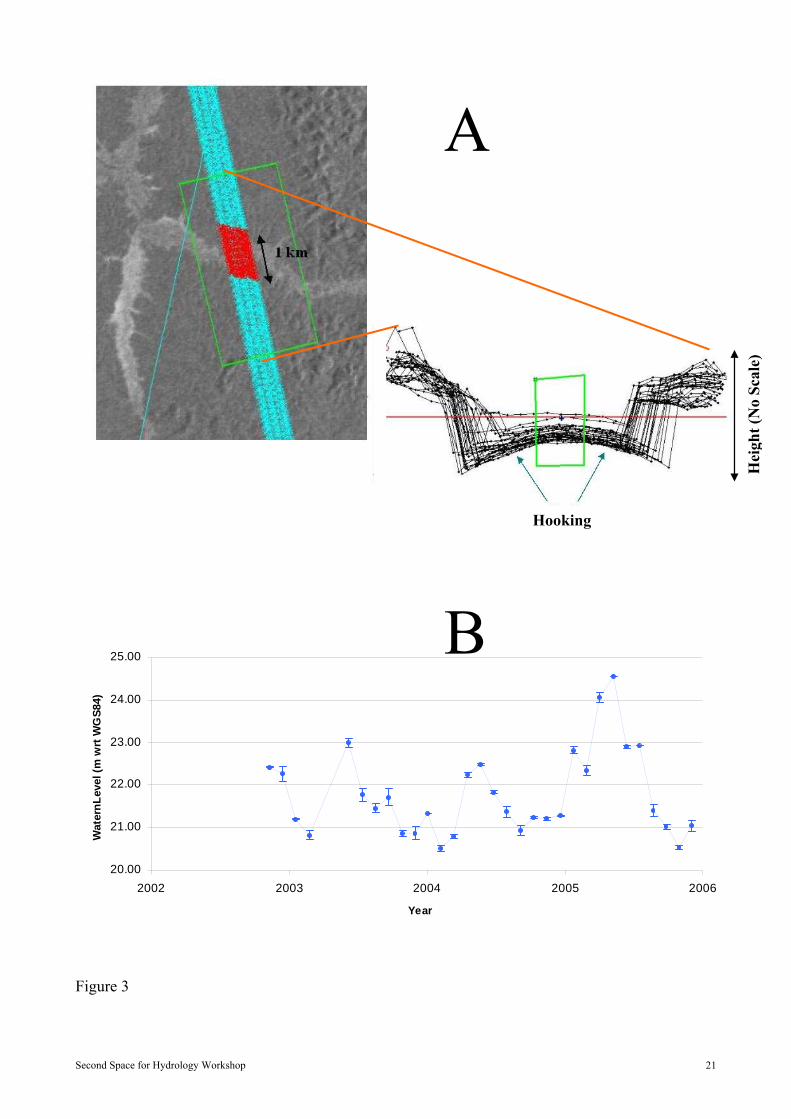
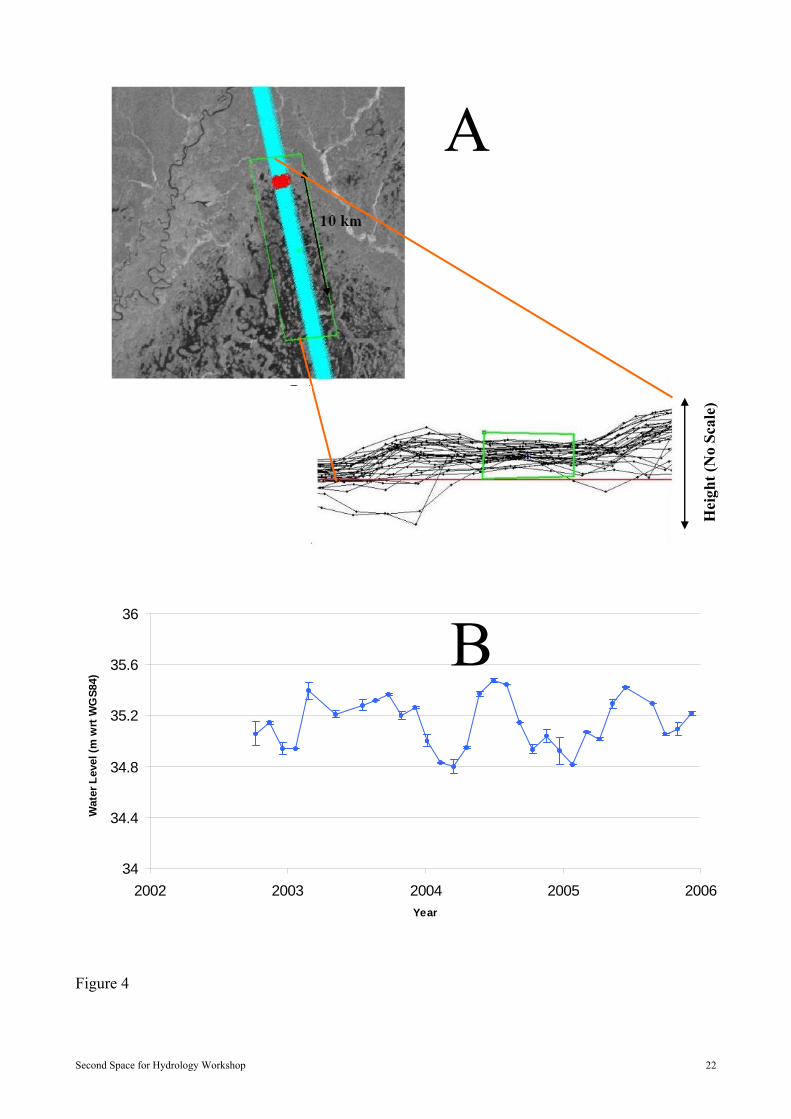
+ Rough selection guided by imagery (Figures 2a, 3a and 4a). The along
track measurements are displayed over a geo-referenced image chosen such as to
highlight the wet and dry areas in the vicinity of the studied virtual station. The
measurements in the close vicinity of the water surface – as shown by the image –
are selected and passed to the second step. In the present study the images we
used were mosaics of JERS-1 radar interferrometry produced in the frame of the
tropical forest global mapping – Global Rain Forest Mapping-GRFM projects
(GRFM 1995/1996). Both low waters and at flood periods are available. We used
the flood period images.
+ Refined selection in cross section (Figures 2b, 3b and 4b). The data
selected in the first step are now displayed in a height/cross-section abscissa
diagram. Again, the operator can draw a polygon inside which the data are
retained. Noteworthy, several disconnected polygons can be defined.
+ Computation of master points. The median and mean values are
computed for each pass using the data subset selected in the second step. In the
present study, we retained the median and associated mean absolute deviation to
construct the time series. Indeed, we have experienced that given the large
Second Space for Hydrology Workshop 7
number of possible outliers with respect to the little number of points selected for
each pass, the median offers a more robust predictor than the mean would do.
Frappart et al. (2006) already arrived at a similar conclusion.
Using the VALS toolbox for the ENVISAT tracks crossing the Negro river
bassin, we computed time series of water stage between 2002 and 2006 at about
150 virtual stations. As far as the ENVISAT data are concerned, we used the
ranges issued by the Ice-1 algorithm and geophysical corrections provided in the
standard GDRs, but the tropospheric corrections that are post processed using
meteorological models. Among the 4 ranges distributed in the ENVISAT GDRs,
The Ice-1 ranges option has been retained following Frappart et al. (2006) who
showed that Ice-1 was the algorithm performing best for continental waters. The
150 virtual stations include 34 stations on the river main stem, 66 over tributaries
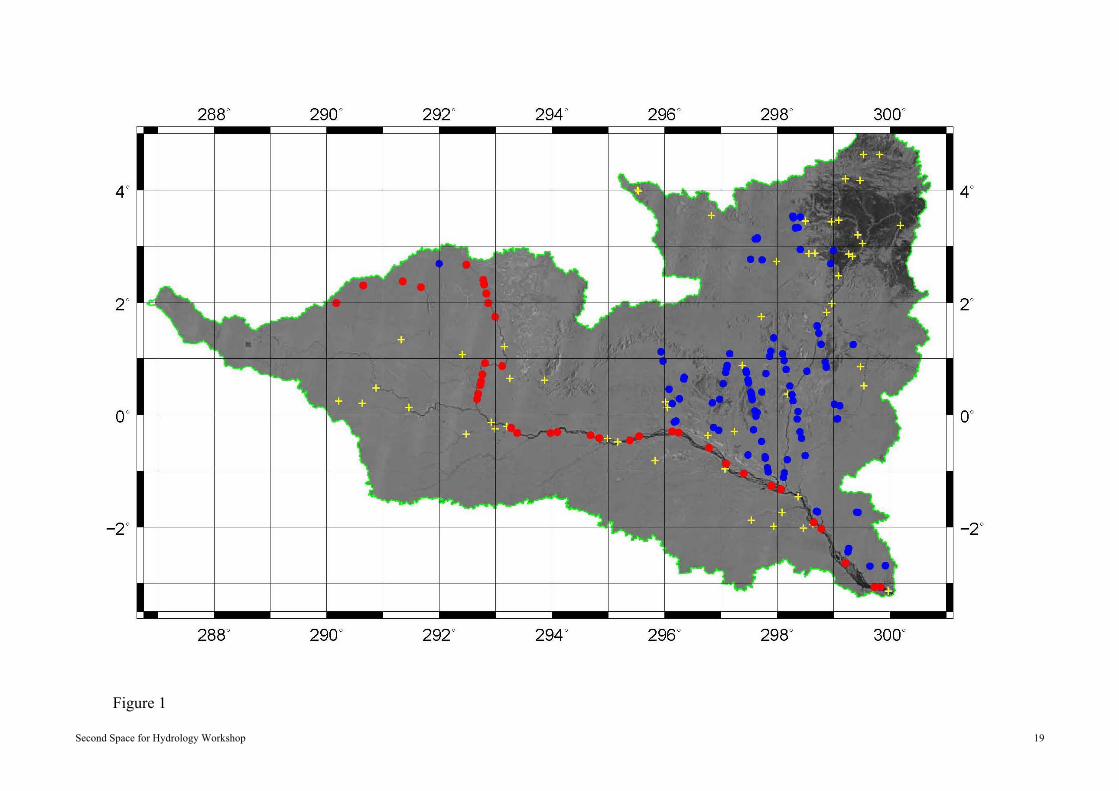
and 50 over wetlands. Their locations are shown in Figure 1. We present
examples of series obtained for these three types of water body: a large river, a
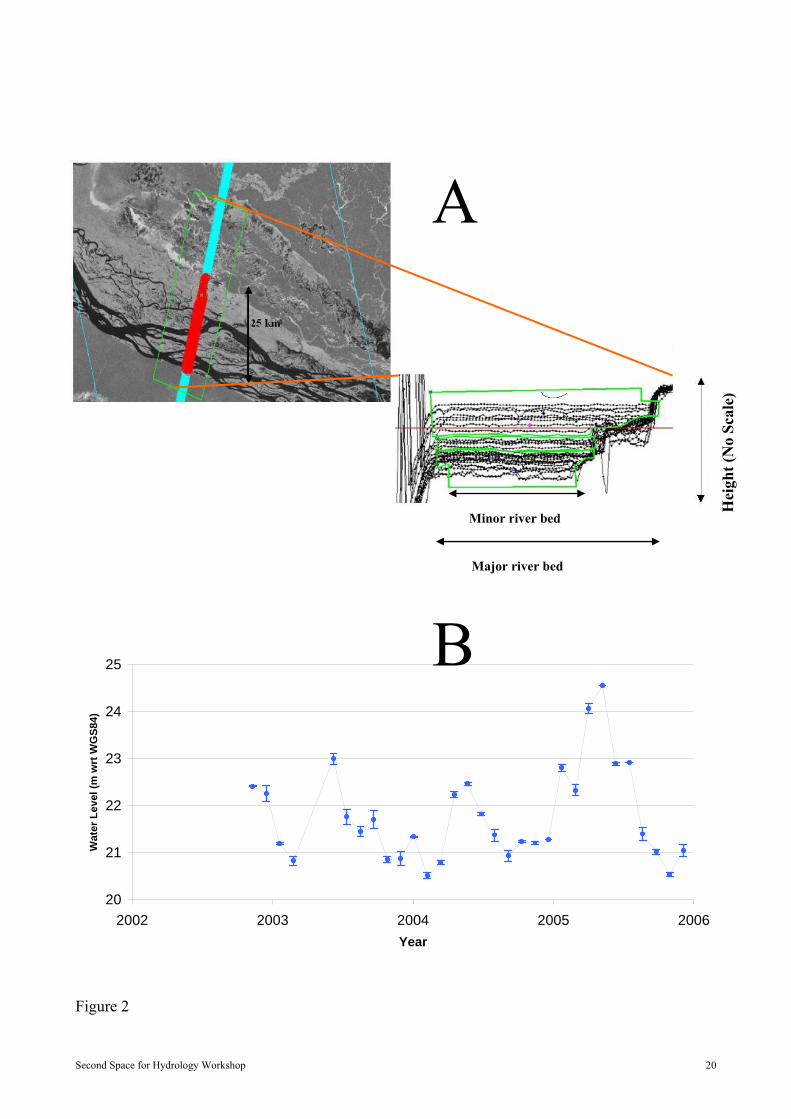
small tributary and a wetland. The data selection and time series of a virtual
station in the Anavilhanas Islands, where track 637 crosscuts the Rio Negro in its
widest portion, is shown in Figure 2. As shown on the cross-section, the width of
the river changes significantly between the low and high water. This case
highlights the great advantage provided by a supervised data selection that
enables on the one hand selecting smaller portions of tracks at low water to
eliminate the data on the river bank but on the other hand select all the data at
high waters and take advantage of the large number of samples at these
measurement times. The case of a small tributary is shown in Figure 3. The
virtual station is on the Pardo River, a river 300 to 400 m wide, that is narrower
than the beam footprint, crosscut by track 149. It is worth noting that larger
deviations are associated to the height values than for the Rio Negro. Noteworthy,
Second Space for Hydrology Workshop 8
this river is not monitored and then could not be taken into account in any
hydrological modeling until these ENVISAT series were computed. Last, we
present a series extracted where track # 235 passes over a wetland, the Caapiranga
Lake (297.48 °E and 0.63 S) (Figure 4). Wetlands are poorly monitored
worldwide. Indeed, it appears almost infeasible to monitor locally the stage
variations of such remote areas and the surface-integrating capability of the radar
beam is an advantage in this case and permits the computation of stage variations.
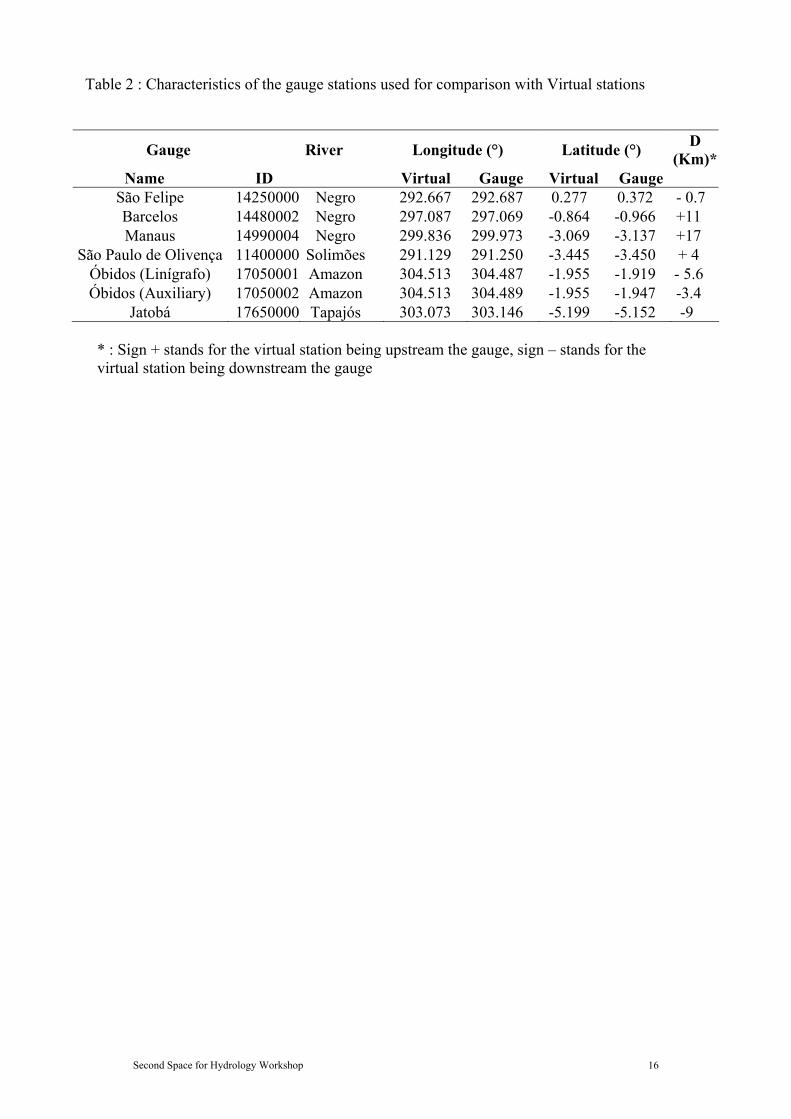
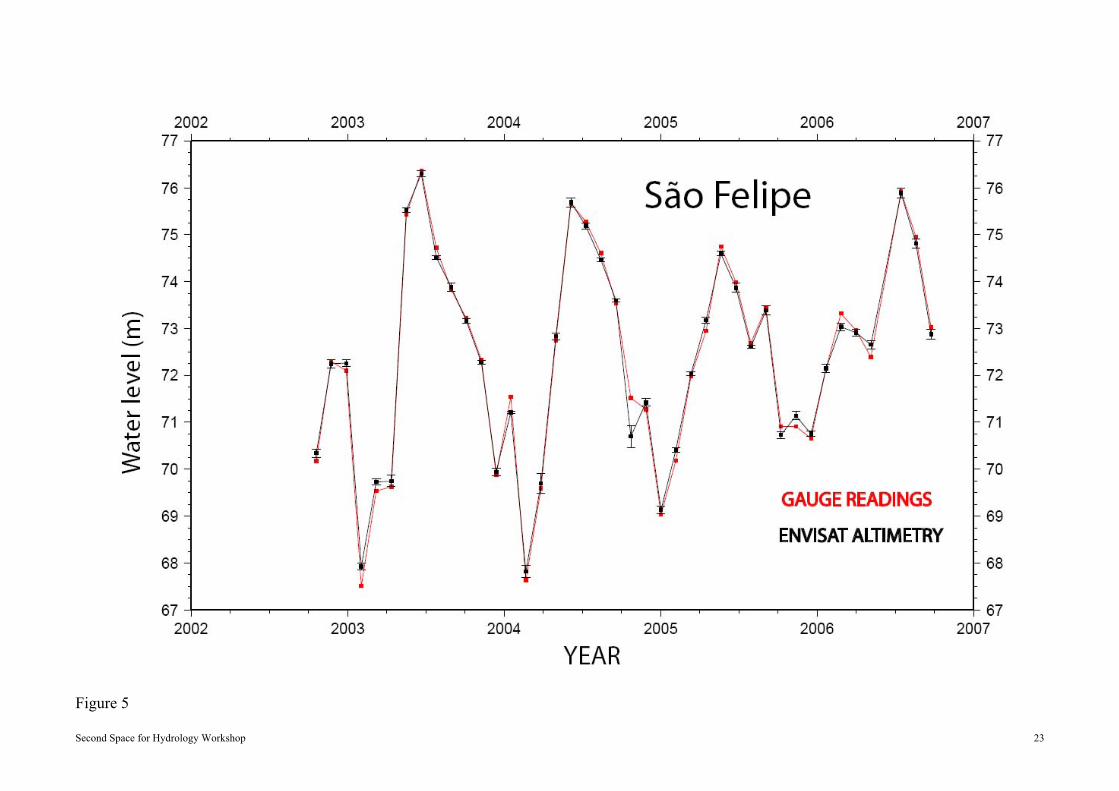
Given the very small number of gauges along the main stem of Rio Negro,
only one virtual station is located in the very close vicinity of a gauge (e.g. the
São Felipe station, 700m away only from the ENVISAT track). A single series is
not satisfactory to address the problem of the quality of the ENVISAT series by
comparison with a gauge series. Therefore, in order to perform such a comparison
on the basis of several pairs of series, we also computed the time series of water
stages at 5 other ENVISAT virtual stations that are located less than 20 km from a
gauge within the Amazon basin (Table 2), including two other stations along the
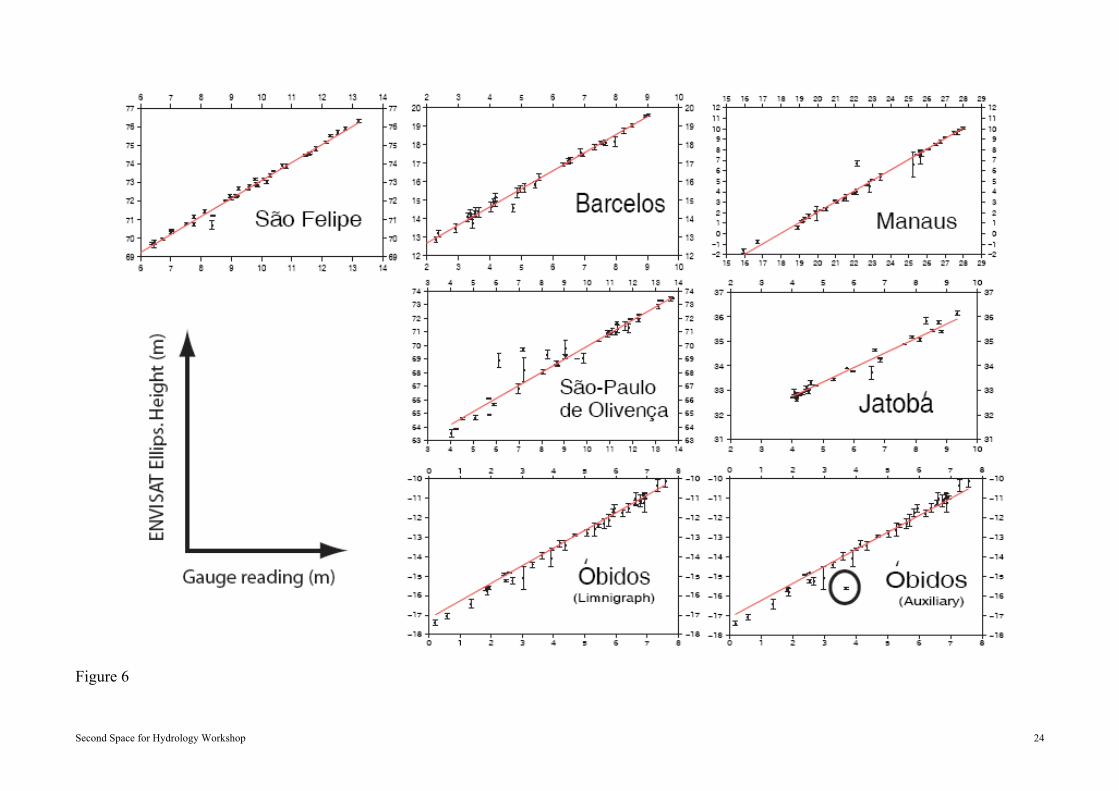
Negro basin. Comparison between ENVISAT time series and gauge time series is
presented in Figure 6. First, we computed the weighted linear regression between
both series at each gauge-SV pair. Regression coefficients range between 1.002
and 0.59 (Table 3). Yet, when this coefficient is close to one, it is suggested that
both series agree very well. However, a value significantly different from one
does not indicate that the ENVISAT series is necessarily bad. It can also evidence
that hydrological conditions are different between both locations. Therefore, we
also computed the ratio χ between on the one hand the discrepancy between the
ENVISAT master points and the linear regression and on the other hand
uncertainties associated to the ENVISAT master points (see formula in the
caption of Table 3). When χ equals one, the uncertainties are not under-estimated.
Second Space for Hydrology Workshop 9
When χ is greater than one, the uncertainties must be scaled by χ to globally range
as much as the discrepancies do. The χ value for the comparison at every
ENVISAT/gauge pair is reported in Table 3. Values range between 1 (Barcelos)
and 7 (São Paulo de Olivença). This means that the uncertainties of the ENVISAT
virtual station at Barcelos are realistic when those for the virtual station at S-P de
Olivença are 7 times under-estimated. At Jatoba, that χ = 3.6 suggests that the
ENVISAT series compares as well the corresponding in-situ series as the other
series do, and also suggest that the low regression coefficient (0.590) is due to a
significant change in river cross section between the location of the SV and that
of the gauge. When computed globally for all the stations, χ = 3.6. This suggests
that realistic uncertainties are obtained for ENVISAT series when those issued by
our selection procedure are multiplied by 3.6.
At Obidos, two gauges are available. We also compared these two gauges
together. The regression coefficient between both gauges is 0.966 and χ = 30,
using a 1 cm uncertainty to characterize the gauge readings (Table 3). Such
values, that suggest that the actual uncertainty of the reading is 30 cm are
surprisingly bad. Yet, inspection of the data series suggests that a measurement in
the auxiliary series is likely wrong (either because of a reading error or because of
an erroneous transcription). This outlier is circled in Figure 6. Thus, if this data is
removed from the series, the correlation rises up to 0.995 and χ = 3 (Table 3),
suggesting that the actual uncertainty of the readings is ~3 cm.
The gauges that we used were not leveled. Such linear regressions between
gauges series and ENVISAT series that are referenced with respect to the WGS84
ellipsoid enable to level the gauge zeros. However, such levelling using satellite
radar altimetry must accounts for the fact that the ranges drived by the Ice-1
trackers are potentially biased. Since no value has yet been published for the Ice-1
Second Space for Hydrology Workshop 10
tracker bias over the rivers, we used the value determined by Cretaux et al.
(submitted) over Lake Issyk-kul, namely 72.6 cm ± 5 cm. The levels of the zeros
of the gauges included in this study are reported in Table 3. These values might
need to be updated when a river-dedicated estimate of the bias is available.
Conclusion and perspectives
Large –metric– errors often observed in time series constructed using
satellite radar altimetry are proceeding of the difficulties found to adapt
measurement and processing procedures tuned for the oceanic domain. Most of
the errors come from the inclusion of non-water data in the set of measurements
retained for the computation of water stages, in particular at low water stages
(Birkett, 1998; De Oliveira Campos 2001). Most of this scatter can be
dramatically reduced if a supervised selection of the data is performed prior the
computation of the master points making the final time series. The method that
we propose to perform such a selection consists in adding to the common
geographical selection a second step of data selection, in a cross-section view.
After some satellite passes are available, such cross section displays permit a
satisfactory identification of non-water measurements, hooking disturbances and
change with hydrological cycle in the width of the geographical selection
window.
Unfortunately, no comparison could be performed over small tributaries or
wetlands; the most demanding places and this test remains to be performed. Yet, a
comparison performed at six gauges over different rivers within the Amazon
basin result in regression coefficient greater than 0.95 between the ENVISAT and
gauges series. Uncertainties appear under-estimated and a 3.6 scaling factor is
proposed. Although such a study requires to be conducted over a much larger
Second Space for Hydrology Workshop 11
dataset for definite conclusions are drawn, it is shown that ENVISAT altimetry
provides valuable measurements of the water level, of particular interest in poorly
monitored areas such as the Amazon basin.
Acknowledgements
This study was partly funded by TOSCA/CNES (France), CNPq (Conselho
Nacional de Desenvolvimento Científico e Tecnológico, Brazil) and CAPES
(Coordenação de Aperfeiçoamento de Pessoal de Nível, Brazil, contract
CAPES/COFECUB Nº 516/05). ANA (Agência Nacional de Águas, Brazil)
provided the gauge data and CTOH (Centre de Topographie des Océans et de
l'Hydrosphère, LEGOS, France ) provided the ENVISAT GDRs and additional
troposheric corrections.
References
BIRKETT, C. M. (1995). The global remote sensing of lakes, wetlands and rivers
for hydrological and climate research. IEEE Trans. 1979–1981.
BIRKETT, C. M. (1998). Contribution of the TOPEX NASA radar altimeter to
the global monitoring of large rivers and wetlands, Water Resour. Res., 34 (5),
1223-1239.
BRASIL. Departamento Nacional de Produção Mineral. Projeto
RADAMBRASIL. (1978). Manaus: Geologia, Geomorfologia, Pedologia,
Vegetação e Uso Potencial da Terra. Rio de Janeiro: DNPM, 18, AS. 20,
628p.
Second Space for Hydrology Workshop 12
CRETAUX, J. F.; S. CALMANT; V. ROMANOVSKI; A. SHABUNIN ; F.
LYARD ; M. BERGE-NGUYEN; A. CAZENAVE and F. HERNADEZ.
(2007). A new absolute calibration site for radar altimeter in the continental
domain: lake Issykkul in Central Asia. Submitted to Journal of Geodesy.
DUBROEUCQ, D. and B. VOLKOFF. (1998). From oxisols to spodosols and
histosols: evolution of the soil mantles in the Negro River basin (Amazonia).
Catena. 32, 245–280.
FRAPPART, F.; S. CALMANT; M. CAUHOPÉ; F. SEYLER and A. CAZENAVE.
(2006) Preliminary results of ENVISAT RA-2-derived water levels validation over
the Amazon basin. Remote Sensing of Environment. 100, 252–264.
FU, L. L. and A. CAZENAVE. (2001). Satellite Altimetry and Earth Science, A
Handbook of Techniques and Applications. London (UK), Academic Press.,
464p.
GUYOT, J. L. (1993). Hydrogéochimie des fleuves de l’Amazonie Bolivienne.
In: Géologie, Géochimie, Bordeaux, Université Bordeaux I, 261p.
GUYOT, J.L.; M. MOLINIER; E. DE OLIVEIRA; V. GUIMARAES and A.
CHAVES (1993). Hydrologie du Bassin de l'Amazone. In : OLIVRY, J. C. et
BOULEGUE, J. (eds) : Grands bassins fluviaux péri-atlantiques : Congo,
Niger, Amazone. Actes du Colloque PEGI/INSU/CNRS. ORSTOM, Paris,
France, 22-24 novembre 1993, 335-344.
GUYOT, J. L.; M. MOLINIER; V. GUIMARAES; K. CUDO and E. DE
OLIVEIRA. (1994). Nouveautés sur les débits monstrueux de l'Amazone.
Dossier de la Revue de Géographie Alpine, 12, 77-83.
Second Space for Hydrology Workshop 13
GRFM (1995/1996). Global Rain Forest Mapping Project, South America
(Amazon Basin), v. AM-1, National Space Development Agency of Japan
/Earth Observation Research Center (NASDA/EORC), Japão.
IBAMA. Instituto Nacional do Meio Ambiente e dos Recursos Naurais
Renováveis. (2007). Região hidrográfica amazônica. In:
www.ibama.gov.br/pndpa/index.php?id_menu=71
JUNK, W. J. (1983). As águas da Região Amazônica. In: SALATI, E. et al.
Amazônia: desenvolvimento, integração e ecologia. São Paulo: Brasiliense;
(Brasília): Conselho de Desenvolvimento Científico e Tecnológico, 45-100.
DE OLIVEIRA CAMPOS, I .; F. MERCIER; C. MAHEU; G. COCHONNEAU;
P. KOSUTH; D. BLITZKOW and A. CAZENAVE A. (2001). Temporal
variations of river basin waters from Topex/Poseidon satellite altimetry ;
application to the Amazon basin, C.R. Acad. Sci. Paris, Sciences de la Terre
et des planètes. 333, 1-11.
SIPPEL, S. J.; S. K. HAMILTON; J. M. MELACK and E. M. L. M. NOVO
(1998). Passive microwave observations of inundation area and the area/stage
relation in the Amazon River floodplain. International Journal of Remote
Sensing. 19, 3055–3074.
SOIL SURVEY STAFF (1975). Soil Taxonomy. Basic System of Soil
Classification for Making and Interpreting Soil Surveys. USDA, Washington,
Agricultural Handbook. 436, 754 pp.
SOIL SURVEY STAFF (1990). Keys to Soil Taxonomy. Agency for
International Development. USDA Soil Management Support Services.
Second Space for Hydrology Workshop 14
Technical Monograph 19, fourth ed., Virginia Polytechnic Institute and State
University.
WEHR, T. and E. ATTEMA. (2001). Geophysical validation of ENVISAT data
products, Adv. Space Res. 28 (1), 83-91.
ZELLI, C. (1999). ENVISAT RA-2 advanced radar altimeter: Instrument design
and pre-launch performance assessment review, Acta Astronautica. 44, 323-
333.
Second Space for Hydrology Workshop 15
Table 1 : Main characteristics of the Rio Negro basin
Bacia do rio Negro
Area 715 000 Km²
Climate Am*, Af** and Aw***
Mean annual temperature 26 °C
Mean annual precipitation 3 000 – 4 000 mm
Period of main precipitation April to June
Mean discharge at mouth ~50 000 m³/s
From BRASIL (1999), Dubroeucq e Valkoff (1998), Guyot (1993) and Soil Survey Saff (1975, 1990).
* : Am : Hot and humid with dry winter. ** : Af : Hot and humid with no dry season. *** : Aw : Hot and humid with short dry season.
Second Space for Hydrology Workshop 16
Table 2 : Characteristics of the gauge stations used for comparison with Virtual stations
Gauge River Longitude (°) Latitude (°) D (Km)*
Name ID Virtual Gauge Virtual Gauge São Felipe 14250000 Negro 292.667 292.687 0.277 0.372 - 0.7 Barcelos 14480002 Negro 297.087 297.069 -0.864 -0.966 +11 Manaus 14990004 Negro 299.836 299.973 -3.069 -3.137 +17
São Paulo de Olivença 11400000 Solimões 291.129 291.250 -3.445 -3.450 + 4 Óbidos (Linígrafo) 17050001 Amazon 304.513 304.487 -1.955 -1.919 - 5.6 Óbidos (Auxiliary) 17050002 Amazon 304.513 304.489 -1.955 -1.947 -3.4
Jatobá 17650000 Tapajós 303.073 303.146 -5.199 -5.152 -9 * : Sign + stands for the virtual station being upstream the gauge, sign – stands for the virtual station being downstream the gauge
Second Space for Hydrology Workshop 17
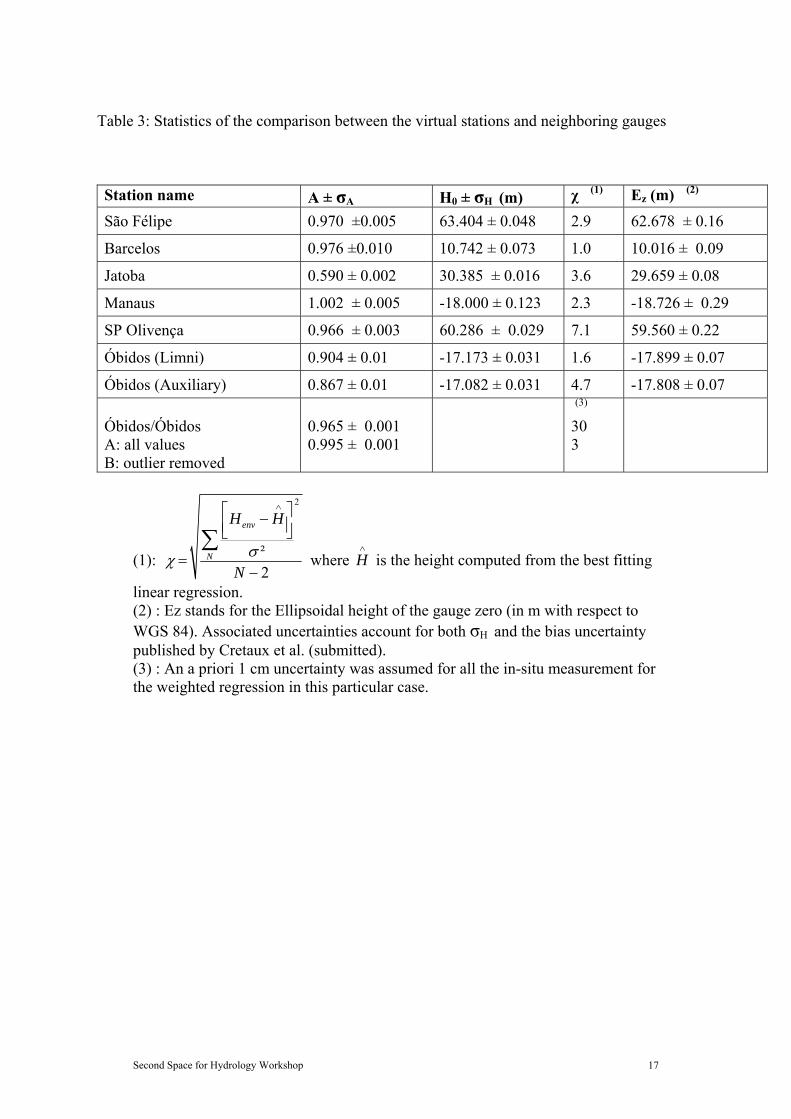
Table 3: Statistics of the comparison between the virtual stations and neighboring gauges
Station name A ± σA H0 ± σH (m) χ (1) Ez (m) (2) São Félipe 0.970 ±0.005 63.404 ± 0.048 2.9 62.678 ± 0.16
Barcelos 0.976 ±0.010 10.742 ± 0.073 1.0 10.016 ± 0.09
Jatoba 0.590 ± 0.002 30.385 ± 0.016 3.6 29.659 ± 0.08
Manaus 1.002 ± 0.005 -18.000 ± 0.123 2.3 -18.726 ± 0.29
SP Olivença 0.966 ± 0.003 60.286 ± 0.029 7.1 59.560 ± 0.22
Óbidos (Limni) 0.904 ± 0.01 -17.173 ± 0.031 1.6 -17.899 ± 0.07
Óbidos (Auxiliary) 0.867 ± 0.01 -17.082 ± 0.031 4.7 -17.808 ± 0.07 Óbidos/Óbidos A: all values B: outlier removed
0.965 ± 0.001 0.995 ± 0.001
(3)
30 3
(1):
2
²2
env
N
H H
Nσχ
∧⎡ ⎤−⎢ ⎥⎣ ⎦
=−
∑ where H
∧
is the height computed from the best fitting
linear regression. (2) : Ez stands for the Ellipsoidal height of the gauge zero (in m with respect to WGS 84). Associated uncertainties account for both σH and the bias uncertainty published by Cretaux et al. (submitted). (3) : An a priori 1 cm uncertainty was assumed for all the in-situ measurement for the weighted regression in this particular case.
Second Space for Hydrology Workshop 18
Figure Captions Figure 1: map of the Rio Negro basin together with the virtual stations defined by
the intersection of the river channels with the ground tracks of satellite ENVISAT. In situ stations used in this study are also shown. Background image is a JERS-1 mosaic made of images 304-305-306-311-312-313, e.g. Amazon high water images.
Figure 2: Virtual station on the Rio Negro at 297.41; -1.05, ENVISAT track #
736. A: Display of the geographical distribution of the data selected B: time series
Figure 3: Virtual station on the Rio Pardo (299.44; -1.74), ENVISAT track # 149.
A: Display of the geographical distribution of the data selected B: time series
Figure 4: Virtual station on the Lago Caapiranga (297.48; - 0.63), ENVISAT
track # 235. A: Display of the geographical distribution of the data selected B: time series
Figure 5: Comparison of water levels from both processing the altimetry data of
ENVISAT track # 536 at latitude 0.37 and readings at São Felipe gauge station ANA 14250000.
Figure 6: Comparison between the ENVISAT and the gauges values. Red lines
stand for the best fitting regression lines. The coeficients of the linear regressions are reported in Table 3.
Second Space for Hydrology Workshop 19
Figure 1
Second Space for Hydrology Workshop 20
20
21
22
23
24
25
2002 2003 2004 2005 2006Year
Wat
er L
evel
(m w
rt W
GS8
4)
Figure 2
Hei
ght (
No
Scal
e)
Minor river bed
Major river bed
A
B
Second Space for Hydrology Workshop 21
20.00
21.00
22.00
23.00
24.00
25.00
2002 2003 2004 2005 2006
Year
Wat
ernL
evel
(m w
rt W
GS8
4)
Figure 3
Hei
ght (
No
Scal
e)
Hooking
A
B
Second Space for Hydrology Workshop 22
34
34.4
34.8
35.2
35.6
36
2002 2003 2004 2005 2006Year
Wat
er L
evel
(m w
rt W
GS8
4)
Figure 4
Hei
ght (
No
Scal
e)
A
B
Second Space for Hydrology Workshop 23
Figure 5
Second Space for Hydrology Workshop 24
Figure 6