3d product visualisation for online retail an invariance analysis form1.pdf
TRANSCRIPT

1
3D Product Authenticity Model for Online Retail: An Invariance
Analysis.
Raed Algharabat
Brunel Business School, Marketing Department, Brunel University, U.K.
Phone: +44 (0) 1895 266251, Fax: +44 (0) 1895 269775
Charles Dennis
Brunel Business School, Marketing Department, Brunel University, U.K.
Phone: +44 (0) 1895 265242, Fax: +44 (0) 1895 269775
Raed Algharabat is a Ph.D. researcher at Brunel University, London, U.K. He has
won numerous research awards including Best Papers Award at the Academy of
Marketing Conference in 2009 and Brunel Business School Symposium 2009. Raed’s
research area is e-retailing, particularly, 3D virtual models and their impact on
consumers’ behaviour within the online retailer context.
Charles Dennis is a Senior Lecturer at Brunel University, London, UK. His teaching
and research area is (e-) retail and consumer behaviour – the vital final link of the
Marketing process – satisfying the end consumer. Charles is a Chartered Marketer and
has been elected as a Fellow of the Chartered Institute of Marketing for work helping
to modernise the teaching of the discipline. Charles was awarded the Vice
Chancellor’s Award for Teaching Excellence for improving the interactive student
learning experience. Charles’s publications include Marketing the e-Business, (1st &
2nd
editions) (joint-authored with Dr Lisa Harris), the research-based e-Retailing
(joint-authored with Professor Bill Merrilees and Dr Tino Fenech) and research
monograph Objects of Desire: Consumer Behaviour in Shopping Centre Choice. His
research into shopping styles has received extensive coverage in the popular media.

2
3D Product Authenticity Model for Online Retail: An Invariance
Analysis.
Abstract
This study investigates the effects of different levels of invariance analysis on three
dimensional (3D) product authenticity model (3DPAM) constructs in the e- retailing
context. A hypothetical retailer Web site presents a variety of laptops using 3D
product visualisations. The proposed conceptual model achieves acceptable fit and the
hypothesised paths are all valid. We empirically investigate the invariance across the
subgroups to validate the results of our 3DPAM. We concluded that the 3D product
authenticity model construct was invariant for our sample across different gender,
level of education and study backgrounds. These findings suggested that all our
subgroups conceptualised the 3DPAM similarly. Also the results show some non-
invariance results for the structural and latent mean models. The gender group posits a
non-invariance latent mean model. Study backgrounds group reveals a non-invariance
result for the structural model. These findings allowed us to understand the 3DPAMs
validity in the e-retail context. Managerial implications are explained.
Keywords: 3D product authenticity, control, animated colours, value, behavioural
intention, invariance analyses.
1. Introduction
Scholars (e.g., Li et al., 2001, 2002, 2003) classify experiences, based on the
interaction between a product or an environment and an individual, into three types.
First, direct experience permits consumers to interact (e.g., physically) directly with a
product. Second, indirect experience often allows consumers to interact with second-
hand source such as static visual pictures. Third, virtual experience allows consumers
to interact with three dimensional (3D) virtual models. According to Steuer (1992,
p.78) virtual reality (VR) is “a real or simulated environment in which a perceiver
experiences telepresence”. In contrast, virtual experience (VE) derives from VR and
can be defined as “psychological and emotional states that consumers undergo while
interacting with a 3D environment” (Li et al. 2001, p. 14). A 3D presentation enables

3
consumers to interact with products, enriches their learning processes, and creates a
sense of being in a simulated real world. Furthermore, direct and virtual experiences
combine within VR, such that the latter enhances and enriches the overall experience
because consumers use almost all of their senses when interacting with a 3D product
visualisation (Klein, 2003; Li et al., 2001, 2002, 2003). Despite widespread
discussions and various definitions of VE, we notice that previous scholars, within the
online retail context, consider the notions of 3D telepresence as virtual substitutes for
actual experience with the products. However, the telepresence and presence
constructs are not necessarily wholly appropriate concepts for marketers since they
represent a process of being mentally transported into other areas or being immersed
into an illusion environment. Such notions may not be particularly helpful for
marketers and website designers who are concerned with 3D product visualisation of
real products. Instead, we propose the 3D product authenticity construct, which refers
to simulating a real product authentically online. We therefore first discuss the notions
of telepresence or presence in the immersive virtual reality (IVR) environment then
proceed to explain applications of non-immersive virtual realties (NIVR i.e., an online
retailer context). We also offer a new definition and measurement scale for the
construct of authenticity. Furthermore, we introduce the 3D product authenticity
model to replace the telepresence model in the virtual reality environment. To validate
our findings of the 3D product authenticity model, we investigate the effects of
different levels of invariance analysis, across gender, levels of education and study
backgrounds subgroups.
2. Theoretical Background
2.1. 3D Product Visualisation in the Immersive and Non-Immersive VR
VR terminologies enter the vocabulary with the emergence of IVR devices, such as
head-mounted display, which allow users to interact with virtual environments and to
visualise different objects (Suh and Lee, 2005). As a result, the notions of
telepresence or presence emerge. Notwithstanding, previous literature in the IVR area
has provided readers with different classifications and conceptualisations of VR. For
example, Steuer's (1992, p. 76) definition of VR focuses on human experience, not
technological hardware, and differentiates between presence and telepresence.
Whereas presence refers to “the experience of one’s physical environment; it refers
4
not to one’s surroundings as they exist in the physical world, but to the perception of
those surroundings as mediated by both automatic and controlled mental processes”,
telepresence is “the experience of presence in an environment by means of a
communication medium”. In turn, Sheridan (1992) distinguishes between virtual
presence and telepresence, such that presence relates to the sense of being in a
computer-mediated environment, whereas telepresence indicates a sense of being in
any real remote location. To that end, Bioccca and Delaney (1995) argue that the
definition of VR depends on technological hardware and software. The authors define
VR as perceptual immersion presence. This type of presence depends on sensory
immersion in virtual environments. To extend prior literature, Lombard and Ditton
(1997) identify six taxonomies of VR presence: social richness, realism,
transportation, immersion, social actor within medium and medium as social actor.
Notwithstanding Lombard and Ditton’s (1997) classification, two types of presence
are identified in the NIVR area, concerning users interaction with e-retailers’ websites
and products using desktop or laptop computers (Suh and Lee, 2005). The first is
telepresence, or the illusion of being in a place far from the physical body (Biocca,
1997; Heeter, 1992). This conceptualisation of telepresence relates to transporting a
user, self, or place, to another place. The second form is telepresence in a social sense,
such that other beings exist in the VR world with whom users can interact (e.g.,
avatars). Authors such as Heeter (1992) and Lombard and Ditton (1997) empirically
test this concept, and McGoldrick and colleagues (2008) emphasise the avatar’s role
in enhancing virtual personal shopper capabilities. We notice that previous scholars,
within the online retail context, use the notions of 3D telepresence and presence to
surpass actual experience with the products. However, telepresence or presence
constructs are not the proper terminologies that marketers should use since they
represent a process of being mentally transported into other areas or being immersed
into an illusion environment. Moreover, such notions may not help marketers and
website designers to deal with 3D product visualisation as a real product. Instead,
using the 3D product authenticity construct to simulate a real authentic product that a
consumer can experience when engaging with an online retailer might be better. We
felt that it is important to measure how consumers, within the online retail context,
could imagine that 3D presented products. Particularly, we introduced our new
construct, namely, 3D product authenticity to reflect customers’ virtual experience,
where customers can feel the authenticity of the 3D products.
5
2.2. 3D Product Authenticity (3DPA) Construct
None of the previous definitions of telepresence or presence that use 3D virtual
models realistically taps consumers’ virtual experiences. A 3D virtual experience
should be an authentic representation of the direct (offline) experience. We therefore
propose a new notion that relates to the simulation of online products and virtual
experience, namely, the authenticity of the product visualisation. Telepresence and
presence are not particularly well suited to the online retail context, because they
reflect illusion and transportation to other places. In contrast, the concept of 3D
authenticity of the product visualisation implies the ability to simulate the product
experience in bricks-and-clicks contexts. We propose the following definition of
perceived 3D product authenticity in a computer-mediated environment: 3D Product
Authenticity (3DPA) is a psychological state in which virtual objects presented in 3D
in a computer-mediated environment are perceived as actual objects in a sensory
way.
2.3. 3D Product Authenticity Antecedents and Definitions
We use the control construct to represent interactivity in an online retail context.
Ariely’s (2000) definition of control refers to users’ abilities to customise and choose
Web site contents to achieve their goals. We focus more on consumers’ ability to
control and easily interact with the 3D virtual model. Therefore, we define control as
users’ abilities to customise and choose the contents of the virtual model (i.e., 3D
product visualisation), rotate, and zoom in or out on the product in the virtual model
and the ability of the virtual model (3D) to respond to participants’ orders properly.
Furthermore, 3D vividness should facilitate virtual experience by providing more
sensory depth and breadth (Li et al., 2002, 2003). High-quality online animations
enhance perceived telepresence (e.g., Fortin and Dholakia, 2005; Klein, 2003; Shih,
1998). Specifically, we consider vividness of the visual imagery, such that consumers
can see online products with different colours (skins) just as they would see them in
person. Media richness may lead to telepresence, according to research on online
6
shopping (Klein, 2003; Schlosser, 2003). Moreover, consumers’ ability to change the
animation (colours) of the 3D product might help them sense control over the product.
2.4. Effects of 3D products Authenticity on Utilitarian Value
Scholars (e.g., Fiore and Jin, 2003; Fiore et al., 2005a; Kim et al., 2007; Klein, 2003;
Li et al., 2001, 2002, 2003; Suh and Chang 2006) explain the importance of using 3D
product visualisations in enhancing consumers’ understanding of product attributes,
features and characteristics. 3D visualisation increases consumers’ involvement and
encourages them to seek more information about the products (Fiore et al., 2005a).
Suh and Lee (2005) posit a positive relationship between higher levels of 3D product
visualisation and seeking more information about the products’ characteristics and
features. Suh and Chang’s (2006) empirical research of the influence of 3D product
visualisation and product knowledge reveals a positive relationship between 3D and
perceived product knowledge. Using 3D product visualisation helps consumers to
imagine how a product may look and it gives them more details about the products’
characteristics (Fortin and Dholakia, 2005; Klein, 2003; Shih, 1998).
2.5. Effects of 3D Products Authenticity on Hedonic Value
Scholars (Fiore et al., 2005b; Kim and Forsythe, 2007; Lee et al., 2006; Schlosser,
2003) report the importance of 3D product visualisation in enhancing the experiential
aspects of a virtual shopping. The above researchers find that the ability of 3D
product visualisation to produce hedonic values for shoppers is greater than its ability
to produce utilitarian values. Fiore et al. (2005b) assert that image interactivity
technology produces hedonic value, which is highly correlated with consumers’
emotional pleasure and arousal variables. Fiore et al. (2005a) posit the importance of
virtual models in boosting hedonic value (enjoyment). Fiore et al. (2005a) also report
the importance of a high level of image interactivity technology in comparison to a
low level of image interactivity technology (in the low level conditions, consumers
could only enlarge the static picture of clothing) in producing more hedonic value.
Many scholars in the communication field (e.g., Heeter, 1992; Lombard and Ditton,
1997; Song et al., 2007) report the importance of enjoyment as a consequence of
7
using 3D. Consumers use 3D product visualisation to have more fun, enjoyment and
entertainment (Kim and Forsythe, 2007). Such sources of fun or enjoyment come
from consumers’ ability to rotate, and zoom in or out on the product (Fiore et al.,
2005a), seeing different animated coloured pictorial images that may enhance their
mental pleasure when using 3D sites.
2.6. Effects of 3D Product Authenticity, Utilitarian and Hedonic Value on
Behavioural Intention
The role of 3D product visualisation in enhancing behavioural intentions appears well
supported; 3D utilitarian and hedonic values improve willingness to purchase from an
online retailer (Fiore et al., 2005a, 2005b), intention to buy (Schlosser, 2003) and
purchase intentions (Li et al., 2001; 2003). Moreover, 3D realism improves users’
beliefs and attitudes towards an online store (Klein, 2003)
3. Invariance Analysis
We use the invariance analyses to determine the effects of gender, education levels
and study backgrounds and their relationships in our conceptual framework. Figure 1
explains the steps used in our invariance analyses. We start with conducting a
measurement invariance analysis (measurement weight) for gender, education levels
and study backgrounds to determine whether, for example, the males and females
groups would use the same pattern in measuring the observed items. If the result is
invariant, then the data of each group is suitable for further analysis (i.e., structural
invariance analysis). However, if the two groups understood the items in different
ways (i.e., non-invariance), then, we identify the source of the non-invariance. To do
so, we identify the observed item(s) that caused the non-invariance. If the result of the
measurement model is invariance, then, we go to the next step. However, if the results
still non-invariant, then, we stop the analysis.
Secondly, after having the insignificant results in the measurement model, we conduct
the invariance structural model analysis to determine if gender, education levels and
study background groups have invariance or non-invariance results in perceiving the
relationships between the unobserved constructs. In conducting this analysis, we

8
follow two steps (i) if the members of any group (e.g., the males and females groups)
perceive the relationships between the constructs similarly (i.e., invariance), then, we
move to the third step (i.e., latent mean invariance analysis), (ii) however, if the
members of any group perceive the relationships between the constructs differently
(i.e., non-invariance), then we determine the source of the non-invariance. Moreover,
regardless whether the structural model analyses are variance or non-invariance we
calculate the un-standardised direct, indirect and total effects. Thirdly, we conduct the
latent mean invariance analyses among latent constructs to determine if the groups
have perceived each construct similarly (invariance) or differently (non-invariance).
In all the three previous steps, we report ∆χ2 and ∆df and fit indices (TLI, CFI and
RAMSE) models for the comparison purposes.
Figure 1. Invariance analysis steps
Step one:
Conduct factor
(measurement) invariance
analysis
Non-invariance
Step two:
Conduct the Structural
invariance analysis
Identify the source of
the non-invariance
Non-invariance
Invariance Invariance
Step three:
Conduct the Mean invariance
analysis
Stop the analysis
Report the Un-standardised indirect,
direct and total effects
Invariance/Non-
invaririance
If Then
If
Then
If
Then
If
Then
Then
If
Finall

9
Source: the authors.
4. Research Model
We demonstrate our research model in Figure 2. Our model is testing the relationships
between control, animated colours, 3D product authenticity, hedonic and utilitarian
value and behavioural intention. As the objective of our study is 3D product
authenticity model’s measurement equivalence, the focus of our model is
concentrated on whether gender, education levels and study backgrounds affect
participants’ responses to our 3D product authenticity model.
Figure 2: conceptual framework (source: the authors).
5. METHODS
5.1. Design and Participants
We designed a retailer website with one stimulus. The stimulus allowed participants
to view a laptop’s attributes, functions and characteristics; they also can zoom in or
out, rotate it and see it with different colours. Moreover, unlike previous studies that
focused on perceived product knowledge, our design enhances consumers’ actual
product knowledge (see Appendix A). The website that we created for this study was
not previously known to users, nor did users have any knowledge of the fictitious
brands on the site. Thus, we eliminated any impact of previous experiences or
attitudes (Fiore et al., 2005a). The site offers a wide variety of laptops, similar to
Control
Animated
colours
3D
Authenticity
Utilitarian
Value
Hedonic
Value
Behavioural
intention
H1a
H1b
H3a
H3b
H4a
H4b
H3c H2

10
those that many college-aged women and men currently buy and use. We used a
sample of 312 students to perform this experiment. The sample was gender balanced,
consisting of 48% women and 52% men, and 90% of the sample ranged from 18 to 30
years of age. Approximately 90% reported having had prior online shopping
experience.
5.2. Instrument
Participants were informed that this study pertained to consumers’ evaluations of an
electrical retailer’s Web site. The questionnaire contained five-point Likert-type
scales, anchored by “strongly disagree” and “strongly agree”.
To measure the control construct, we developed a five-item scale that centres on
users’ ability to rotate and zoom in or out the virtual model based on Liu and Shrum’s
(2002); McMillan and Hwang’s (2002) and Song and Zinkhan’s (2008) studies. To
measure animated colours, we developed a four-item animated colour scale based on
Fiore and colleagues (2005a), Klein’s (2003), Steuer’s (1992) studies. The items tap
how closely the simulated sensory information reflects the real product. We could not
find an existing scale to measure 3D product authenticity so we developed a new five-
item scale. We submitted the items to evaluations by academics (lecturers in online
retailing and Ph.D. students); these respondents considered the items relevant for
measuring the authenticity construct. We followed Churchill’s (1979) procedures for
developing a marketing construct scale and adopted Christodoulides and colleagues
(2006) procedures for developing a scale for the online context. Each item began with
“After surfing the 3D sites”, and then obtained responses to the following: “3D
creates a product experience similar to the one I would have when shopping in a
store”, “3D let me feel like if I am holding a real laptop and rotating it” (i.e. virtual
affordance), “3D let me feel like I am dealing with a salesman who is responding to
my orders”, “3D let me see the laptop as if it was a real one”, and “Being able to
zoom in/out and rotate the laptop let me visualise how the laptop might look in an
offline retailer”.
To measure hedonic values, we adopted a modified version of Babin and colleagues
(1994) scale. We based the study on 4 of the 11 items. To measure utilitarian values,
we adopted a modified version of Fiore and colleagues (2005a) scale. To measure

11
Behavioural intention, we used a modified version of Fiore and colleagues (2005a)
scale (see Table ).
6. RESULTS
6.1. Respondent’s Profile
Table 5.4 shows the demographics of the respondents including age, levels of
education and educational backgrounds. Table (5.4) shows a gender balance, male
(53.2%) to female (47.8%). In regard to level of education, 58.7% of the sample are
undergraduate students and 41.3% are postgraduate students. In terms of the study
backgrounds, the sample represents two main subjects as follows; Business and Social
Science (55.1%) and Maths-IT and engineering Science (44.9%).
Table 1: Demographic Items
Demographic profile Number of
respondent N= 312
Valid
percentage
Gender
Male
Female
162
149
53.2
47.8
Level of education
Under graduate
Post graduate
183
129
58.7
41.3
Study background.
Business school and Social science school.
Maths and IT school and Engineering school
172
140
55.1
44.9
6.2. Measurement Model for the 3D Product Authenticity Model
We evaluated the measurement and structural equation models using AMOS 16. The
measurement model includes 23 indicators, and we provide its results in Table 2,
including the standardised factor loading, standard error (S.E), critical ratios (C.R),
composite reliability, squared multiple correlation and average variance extracted
(AVE) for each construct. The standardised factor loadings (λ) are all greater than .61.
The composite reliabilities for control (.80), animated colours, (.782), 3D authenticity

12
(.86), utilitarian (.85), hedonic (.86) and behavioural intention (.88) are acceptable
(Hair et al., 2006). Moreover, average variance extracted by each construct exceeds
the minimum value recommended by Hair et al. (2006), (i.e., exceeds .5).
Table 2. Measurement model results for hypothetical 3DPAM.
Construct
Indicator
Standardized
factor loading
( λ)
S.E. C.R. Average
Variance
extracted
Squared
multiple
correlation
Composite
reliability
η1 (control)
- I felt that I could choose freely what I
wanted to see
- I felt that I had a lot of control over the
content of the laptop’s options (i.e.
angles and information)
- I felt it was easy to rotate the laptop the
way I wanted.
- I felt I could control the laptop
movements.
.78
.71
.71
.61
¯
0.077
0.076
0.071
12.097
10.009
8.916
0.50
0.602
0.508
0.503
0.369
0.80
η2 (animated colours)
-There are lots of colours on 3D laptop
websites.
- Colours brightness of the 3D laptop let
me visualize how the real laptop might
look.
- The laptop illustrated by 3D was very
colourful
.79
.71
.61
¯
0.067
0.064
11.391
10.099
.502
0.631
0.499
0.375
0.78
η3 (Authenticity)
- 3D Creates a product experience similar
to the one I would have when shopping
in a store.
- 3D Let me feel like if I am holding a
real laptop and rotating it (i.e. virtual
affordance)
- 3D Let me feel like I am dealing with a
salesman who is responding to my
orders.
- 3D let me see the laptop as if it was a
real one.
.77
.79
.81
.74
¯
0.078
0.078
0.076
14.093
14.581
13.293
.608
0.598
0.628
0.656
0.550
0.86
η4 (hedonic value)
- Would be like an escape.
- Would be truly enjoyable
- Would be enjoyable for its own sake,
not just for the items I may have
purchase.
- Would let me enjoy being immersed in
an existing new product.
.64
.77
.88
.79
¯
0.105
0.128
0.144
12.752
11.987
11.123
0.59
0.411
0.589
0.722
0.618
.86
η5(utilitarian value)
- Help me make a better decision about
the product.
- help me buy the right product.
- Aid me in evaluating the laptop items.
- Help me in finding what I am looking
for
.80
.92
.69
.61
¯
0.079
0.067
0.066
16.179
12.481
11.002
.582
0.637
0.844
0.475
0.375
0.85
η6 (Behavioural intention)
- After seeing the web site, how likely is
it that you would buy a laptop from this
online store.
- I would be willing to purchase a laptop
through this online store.
- I intend to buy a laptop from this online
store.
- I would be willing to recommend this
.81
.82
.82
.72
¯
0.061
0.075
0.059
16.151
15.323
13.160
0.631 .88

13
online retailer to my friends.
6.3. Structural Equation Model for the 3D Product Authenticity Model
The hypothesised model achieves a chi-square of 350.225 (df = 219), with a
goodness-of-fit index (GFI) of .911, comparative fit index (CFI) of .965, root mean
square residual (RMR) of .038 and root mean square error of approximation
(RMSEA) of .044, normed fit index (NFI) of .912, relative fit index (RFI) of .9,
incremental fit index (IFI) of .965, and χ2/df = 1.599. These results indicate a good fit
of the data to the model (Byrne, 2001; Hair et al., 2006). Furthermore, the structural
equation model confirms that control and animated colours have significant positive
effects on authenticity (H1a t = 2.098; H1b t = 7.951). Moreover, animated colour
exhibits a significant positive effect on control (H2 t = 7.888). Finally, as we
hypothesized, authenticity, hedonic and utilitarian values have positive effects on
behavioural intention (H3c: 2.465, H4a: t = 2.216, H4b: t= 2.454). Table 3 reports
estimates, standardised estimates, and critical ratio for each hypothesized path. All the
hypothesized paths are supported (p < .05).
Table 3. Summary of results of structural model estimation
Standardised regression paths (β) Estimate S.E. C.R. P hypothesis
H1 Animated colours → Control .539 .068 7.888 *** Supported
H2a Control →Authenticity .165 .079 2.098 .036 Supported
H2b Animated colours →Authenticity .672 .085 7.951 *** Supported
H3a Authenticity → Utilitarian .470 .055 8.567 *** Supported
H3b Authenticity → Behavioural intention .229 .093 2.465 .014 Supported
H3c Authenticity → Hedonic .483 .054 8.875 *** Supported
H4a Utilitarian → Behavioural intention .211 .086 2.454 .014 Supported
H4b Hedonic → Behavioural intention ..274 .124 2.216 .027 Supported
6.4. Invariance Analysis Results
14
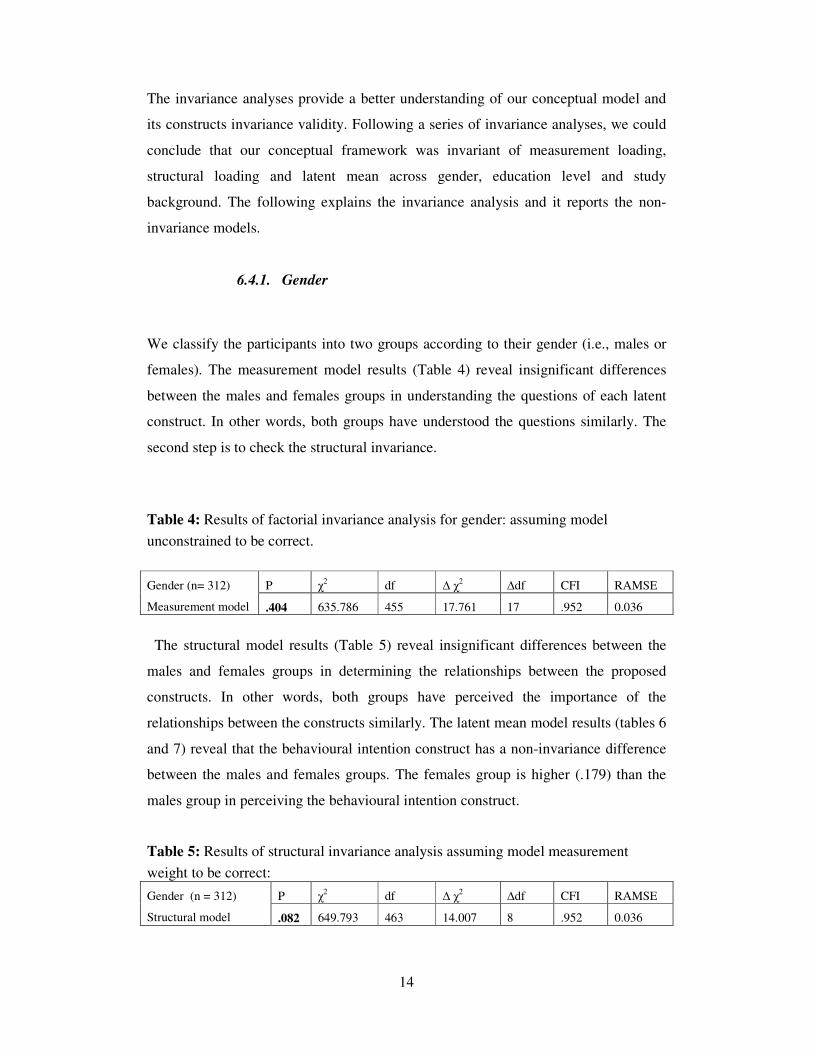
The invariance analyses provide a better understanding of our conceptual model and
its constructs invariance validity. Following a series of invariance analyses, we could
conclude that our conceptual framework was invariant of measurement loading,
structural loading and latent mean across gender, education level and study
background. The following explains the invariance analysis and it reports the non-
invariance models.
6.4.1. Gender
We classify the participants into two groups according to their gender (i.e., males or
females). The measurement model results (Table 4) reveal insignificant differences
between the males and females groups in understanding the questions of each latent
construct. In other words, both groups have understood the questions similarly. The
second step is to check the structural invariance.
Table 4: Results of factorial invariance analysis for gender: assuming model
unconstrained to be correct.
Gender (n= 312)
Measurement model
P χ2 df ∆ χ
2 ∆df CFI RAMSE
.404 635.786 455 17.761 17 .952 0.036
The structural model results (Table 5) reveal insignificant differences between the
males and females groups in determining the relationships between the proposed
constructs. In other words, both groups have perceived the importance of the
relationships between the constructs similarly. The latent mean model results (tables 6
and 7) reveal that the behavioural intention construct has a non-invariance difference
between the males and females groups. The females group is higher (.179) than the
males group in perceiving the behavioural intention construct.
Table 5: Results of structural invariance analysis assuming model measurement
weight to be correct:
Gender (n = 312)
Structural model
P χ2 df ∆ χ
2 ∆df CFI RAMSE
.082 649.793 463 14.007 8 .952 0.036

15
Table 6: Mean: (Male-Unconstrained): assuming model measurement weight to be
correct:
Gender (n = 312)
Structural mean
model
P χ2 df ∆ χ
2 ∆df TLI CFI RAMSE
.019 650.619 464 15.136 6 .946 .950 0.036
Table 7: Means: (male-Measurement weight)
Construct (gender mean 312) Estimate S.E C.R P
Control -.138 .088 -1.562 .118
Animation .069 .069 .994 .320
Authenticity .016 .097 .168 .867
Hedonic .071 .065 1.092 .275
Utilitarian .048 .055 .875 .382
Behavioural intention .179 .069 2.581 .010
Table 8 shows the results of un-standardised indirect, direct and total effects-
estimates for the females and meals groups. The females group perceives the total
effects of the 3D product authenticity construct on behavioural intention more (.479)
than the males group (.402) does. Moreover, the females group perceives the total
effects of the animated colours construct (.366) more than the males group does
(.316), also the females group perceives the total effects of the hedonic values on
behavioural intention (.366) more than the males group does. However, the males
group perceives the total effects of the utilitarian values on behavioural intention
(.282) more than the females group does (.135).
The females group perceives the total effects of the hedonic values (.366) on
behavioural intention more than the total effects of the utilitarian values (.135). In
turn, the males group perceives the total effects of the utilitarian values (.282) on
behavioural intention more than the total effects of hedonic values (.152). The
animated colours construct has the strongest indirect effect (females = .366, males =
316) in both groups. Finally, the females group perceives the indirect effect of the

16
control construct on behavioural intention (.190) more than the males group (.003)
does.
Table 8: Results of un-standardised indirect, direct and total effects- estimates
6.4.2. Education Level
The second invariance analysis classifies participants into two groups according to the
participants’ educational levels (undergraduates and postgraduates groups). The
measurement model results (Table 9) reveal invariance differences (i.e., insignificant
differences) between the undergraduates and postgraduates groups in understanding
the questions of each latent construct. In other words, both groups have perceived the
questions similarly.
Table 9: Results of factorial invariance analysis for education: assuming model
unconstrained to be correct.
education level (n =
312)
P χ2 df ∆ χ
2 ∆df CFI RAMSE
.562 649.828 455 15.466 17 .949 0.37
Direct, indirect and total effects-estimates Direct, indirect and total effects-estimates Females.
Males.
Predictor
variables
Behavioural intention toward the
online retailer
Indirect
effects
Direct
effects
Total
effects
Animated
colours
.366 ------ .366
Control 0.190 ------ .190
Authenticity .262 .217 .479
Utilitarian
value
------ .135 .135
Hedonic value ------ .366 .366
R2 .36
Predictor
variables
Behavioural intention toward
the online retailer
Indirect
effects
Direct
effects
Total
effects
Animated
colours
.316 ------ .316
Control 0.003 ------ .003
Authenticity .185 .217 .402
Utilitarian
value
------ .282 .282
Hedonic value ------ .152 .152
R2 .36
Un-standardised indirect, direct and total effects- estimates

17
Measurement model
The structural model results (Table 10) reveal invariance (insignificant) differences
between the undergraduates and the postgraduates groups in determining the
relationships between the proposed constructs. In other words, both groups have
perceived the importance of the relationships among the constructs similarly.
Table 10: Results of structural invariance analysis assuming model measurement
weight to be correct:
education level
(n = 312)
Structural model
P χ2 df ∆ χ
2 ∆df TLI CFI RAMSE
.240 660.190 463 10.363 8 .943 .948 .037
The latent mean model results (Tables 11 and 12) reveal invariance differences
between the undergraduates and the postgraduates groups. In other words, both
groups perceive the latent constructs similarly.
Table 11: Mean: (undergraduate -Unconstrained): assuming model measurement
weight to be correct:
education level
(n = 312)
Structural mean
model
P χ2 df ∆ χ2 ∆df TLI CFI RAMSE
.072 656.679 464 11.575 6 .945 .949 0.037
Table 12: Mean: (undergraduate –Measurement weight)
Construct (education level mean 312) Estimate S.E C.R P
Control .178 .091 1.957 .050
Animation .125 .071 1.775 .076
Authenticity .001 .096 .010 .992
Hedonic -.029 .066 -.447 .655
Utilitarian .016 .056 .291 .771
Behavioural intention .080 .069 1.167 .243
Table 13 shows the results of un-standardised indirect, direct and total effects-
estimates for the undergraduate students group and the postgraduate students group.
The undergraduate students group perceives the total effects of the 3D product

18
authenticity construct on behavioural intention more (.489) than the postgraduate
students (.404) group does. In turn, the postgraduate group perceives the total effects
of the utilitarian and hedonic values on behavioural intention more than the
undergraduate students group does. The undergraduate group perceives the direct
effect of the utilitarian values on behavioural intention more (.163) than the direct
effect of the hedonic values (.148). In contrast to the undergraduate students, the
postgraduate students perceive the direct effect of the hedonic values on behavioural
intention more (.478) than the utilitarian values (.243). The animated colour has the
strongest indirect effect (The undergraduate group = .361, postgraduate group = .338)
in both groups. However, the indirect effect of the control construct in the
undergraduate group (.133) is greater than the indirect effect of the postgraduate
group (.001).
Table 13: Results of un-standardised indirect, direct and total effects- estimates
Direct, indirect and total effects-estimates Direct, indirect and total effects-estimates
Undergraduates Postgraduates
Predictor
variables
Behavioural intention toward the
online retailer
Indirect
effects
Direct
effects
Total
effects
Animated
colours
.361 ------ .361
Control .133 ------ .133
Authenticity .161 .329 .489
Utilitarian
value
------ .163 .163
Hedonic value ------ .148 .148
R2 .37
Predictor
variables
Behavioural intention toward
the online retailer
Indirect
effects
Direct
effects
Total
effects
Animated
colours
.338 ------ .338
Control .001 ------ .001
Authenticity .317 .087 .404
Utilitarian
value
------ .243 .243
Hedonic value ------ .478 .478
R2 .37
Un-standardised indirect, direct and total effects- estimates

19
6.4.3. Participants’ Study Backgrounds
The third invariance analysis classifies the participants into two groups according to
the participants’ study backgrounds (Business-Social and Maths-IT-Engendering
groups). The measurement model results (Table 14) reveal insignificant differences
between the Business-Social studies and the Maths-IT-Engendering studies
backgrounds in understanding the questions. In other words, both groups have
perceived the questions similarly. The second step is to check the structural
invariance.
Table 14: Results of factorial invariance analysis for background: assuming model
unconstrained to be correct
Background
(n= 312)
Measurement model
P χ2 df ∆ χ
2 ∆df CFI RAMSE
.221 675.953 455 21.115 17 .943 0.040
Structural model results (Table 15) reveal non-invariance (significant) differences
between the Business-Social studies and the Maths-IT-Engendering studies groups in
determining the relationships between the proposed constructs. The following section
explains the source of the non-invariance in the structural model.
Table 15: Results of structural invariance analysis assuming model measurement
weight to be correct
Background
(n = 312)
Structural model
P χ2 df ∆ χ
2 ∆df TLI CFI RAMSE
.010 696.033 463 20.080 8 .934 .939 0.040
The structural model results (Table 16) reveal significant differences between the
Business-Social studies and the Maths-IT-Engendering studies groups. The
relationships between 3D product authenticity→ hedonic, and hedonic → behavioural
intention are the source of this non-invariance. In other words, both groups perceive
the importance of the hedonic values differently.

20
Table 16: Results of path coefficient invariance analysis for study background.
Model
P χ2 df ∆ χ
2 ∆
df
TLI CFI RAMSE
Animation →Authenticity
Control→ Authenticity
Authenticity→ Hedonic
Authenticity →Utilitarian
Utilitarian →BI
Hedonic → BI
Animation →Control
AU→BI
.221
.589
.002**
.128
.295
.048*
.326
.419
654.963
655.131
664.788
657.156
655.934
658.745
655.804
655.493
439
439
439
439
439
439
439
441
.125
.292
9.950
2.317
1.096
3.906
.966
.654
1
1
1
1
1
1
1
1
.935
.935
.932
.935
.935
.934
.935
.935
.944
.944
.941
.943
.944
.943
.944
.944
.040
.040
.041
.040
.040
.040
.040
.040
* p < 0.05; ** p <0.01.
Table 17 shows the results of un-standardised indirect, direct and total effects-
estimates for the Maths-IT-Engendering studies background group and the Business-
Social studies background group. The Maths-IT-Engendering group perceives the
total effects of the 3D product authenticity construct on the behavioural intention
more (.574) than the Business-Social studies group (.306) does. However, the
Business-Social studies group perceives the total effects of the utilitarian values (.169)
on the behavioural intention more than the Maths-IT-Engendering group does. On the
other hand, the Maths-IT-Engendering group perceives the total effects of the hedonic
values (.225) on the behavioural intention more than the Business-Social studies
group (.029) does. In contrast to the Maths-IT-Engendering group who perceives the
direct effect of the hedonic values (.225) on the behavioural intention more than the
utilitarian values (.069), the Business-Social studies group perceives the direct effect
of the utilitarian values on the behavioural intention more (.169) than the hedonic
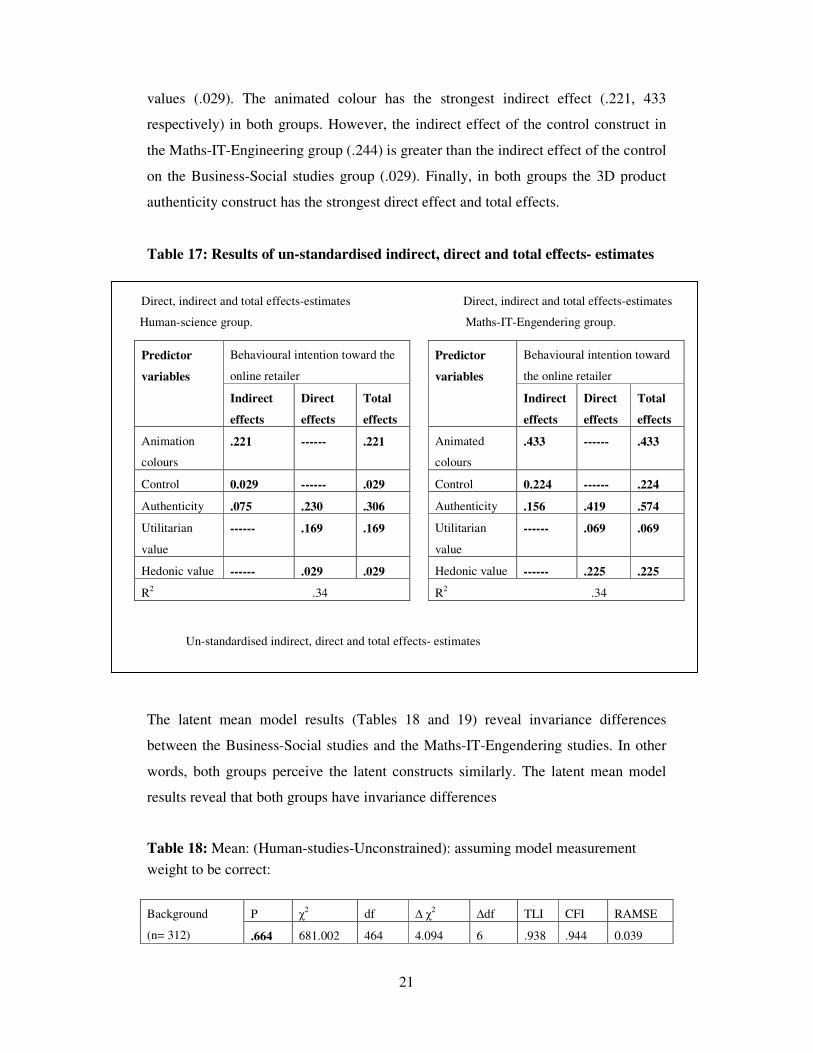
21
values (.029). The animated colour has the strongest indirect effect (.221, 433
respectively) in both groups. However, the indirect effect of the control construct in
the Maths-IT-Engineering group (.244) is greater than the indirect effect of the control
on the Business-Social studies group (.029). Finally, in both groups the 3D product
authenticity construct has the strongest direct effect and total effects.
Table 17: Results of un-standardised indirect, direct and total effects- estimates
The latent mean model results (Tables 18 and 19) reveal invariance differences
between the Business-Social studies and the Maths-IT-Engendering studies. In other
words, both groups perceive the latent constructs similarly. The latent mean model
results reveal that both groups have invariance differences
Table 18: Mean: (Human-studies-Unconstrained): assuming model measurement
weight to be correct:
Background
(n= 312)
P χ2 df ∆ χ
2 ∆df TLI CFI RAMSE
.664 681.002 464 4.094 6 .938 .944 0.039
Direct, indirect and total effects-estimates Direct, indirect and total effects-estimates
Human-science group. Maths-IT-Engendering group.
Predictor
variables
Behavioural intention toward the
online retailer
Indirect
effects
Direct
effects
Total
effects
Animation
colours
.221 ------ .221
Control 0.029 ------ .029
Authenticity .075 .230 .306
Utilitarian
value
------ .169 .169
Hedonic value ------ .029 .029
R2 .34
Predictor
variables
Behavioural intention toward
the online retailer
Indirect
effects
Direct
effects
Total
effects
Animated
colours
.433 ------ .433
Control 0.224 ------ .224
Authenticity .156 .419 .574
Utilitarian
value
------ .069 .069
Hedonic value ------ .225 .225
R2 .34
Un-standardised indirect, direct and total effects- estimates

22
Structural mean
model
Table 19: Mean: (human-studies- Measurement weight)
Construct (Background mean 312) Estimat
e
S.E C.R P
Control .080 .092 .873 .382
Animation .036 .068 .530 .596
Authenticity .084 .097 .871 .384
Hedonic .045 .065 .698 .485
Utilitarian 0.068 .056 1.214 .225
Behavioural intention .127 .068 1.873 .061
7. Discussion
7.1. Genders
Following a series of invariance analyses, it can be concluded that our 3D product
authenticity model is invariant in respect of measurement model and structural model
across gender. The un-standardised effects show that females group perceives the total
effects of the animated colours (.366) on the behavioural intention more than the
males group does (.316). This finding could be interpreted by using the media
richness theory, which Dennis et al. (1999) apply on the computer-mediated
environment and find that females’ ability to understand and use nonverbal cues are
better than males. The females group perceives the total effects of the 3D authenticity
construct on the behavioural intention more (.479) than the males group (.402) does.
This result supports Tversky and Morrison’s (2002) findings regarding the ability of
the animated graphics to increase females’ comprehension and learning. In support of
previous scholarly literature (e.g., Dennis and McCall, 2005; Carpenter and Moore,
2009; Chang et al., 2005; Overby and Lee, 2006), this study finds that the females
group perceives the total effects of the hedonic values on behavioural intention (.366)
more than the males group does. However, the males group perceives the total effects
of the utilitarian values on behavioural intention (.282) more than the females group
does (.135). Moreover, this result supports the findings of Dennis and King (2009)
23
and Dholakia and Chiang (2003) regarding the Empathising and Systemising nature
of shopping styles in males and females. The difference (non-invariance) in the latent
mean between males and females groups suggests that females tend to accept the idea
of buying from our fictitious e-retailer more than the males group does.
7.2. Educational levels
The invariance analysis across educational levels shows similarity in measurement
model, structural model, and latent mean model. The un-standardised effects show
that undergraduate students perceive the total effects of the 3D authenticity construct
on behavioural intention (.489) more than the postgraduate students (.404) do.
Undergraduate students perceive the direct effect of utilitarian values on behavioural
intention (.163) more than the direct effect of the hedonic values (.148). In contrast to
the undergraduate students, postgraduate students perceive the direct effect of the
hedonic values on behavioural intention (.478) more than the utilitarian values (.243).
The above results support Raijas’ (2002) findings that highly educated people may
have the experience that they need to buy a laptop and they know the characteristics
that they seek. To ensure this result, we go back to the participants’ demographic
variables and find that the postgraduate students bought on average two laptops
online, whereas undergraduate students bought on average one laptop online. This
result indicates that highly educated people enjoyed the 3D for the sake of enjoyment.
7.3. Study backgrounds
The invariance analysis results reveal similarity in measurement and latent mean
models. However, the non-invariance (significant) differences between Business-
Social group and Maths-IT-Engendering groups clearly come in the relationships
between the proposed constructs (i.e., the structural model). The authenticity→
hedonic and the hedonic→ behavioural intention relationships are the source of the
coefficients non-invariance. In other words, both groups perceive the importance of
the hedonic values and the behavioural intention differently. That is, Maths-IT-
Engendering group tend to accept that the 3D authenticity and the novelty of the 3D
flash increases the level of fun and entertainment. On the other hand, Maths-IT-
Engendering group does not accept that the high level of entrainment may end with a
positive behavioural intention towards the online retailer. In regards to the un-

24
standardised effects, students with the Maths-IT-Engendering backgrounds perceive
the total effects of the 3D authenticity construct on the behavioural intention (.574)
more than the Business-Social backgrounds (.306) do. This could be justified due to
the Maths-IT- Engineering group ability to understand and criticize the novelty of the
3D more than the Business-Social backgrounds. However, the Business-Social
background group perceives the total effects of the utilitarian values (.169) on
behavioural intention more than the Maths-IT-Engendering group does. On the other
hand, the Maths-IT- Engineering group perceives the total effects of the hedonic
values (.225) on behavioural intention more than the human-studies group (.029)
does. In contrast to the Maths-IT-Engendering group who perceives the direct effect
of the hedonic values (.225) on behavioural intention more than utilitarian values
(.069), the Business-Social studies group perceives the direct effect of the utilitarian
values on behavioural intention (.169) more than the hedonic values (.029). These
results could be explained as follows. First, Raijas (2002) finds that the experienced
people know what they are looking for. Moreover, these results support the findings
of Dennis and King (2009) and Dholakia and Chiang (2003) regarding shopping
styles. In other words, when shopping for technical and expensive products shoppers
who are Empathisers turn to become Systemisers and vise verse. Second, in
comparison to the Business-Social group, the Maths-IT- Engineering group bought on
average more laptops online (M Maths-IT-Engendering = 1.33, M human-studies = 1.3) than the
Business-Social group did. The Business-Social group are more interested in a laptop
features and characteristics than entertainment features. The animation construct had
the strongest indirect effect (.221, 433 respectively) in both groups. However, the
indirect effect of the control construct in the Maths-IT- Engineering group (.244) is
greater than the indirect effect of control on the Business-Social studies group (.029).
Finally, in both groups, the 3D authenticity construct has the strongest direct effect
and total effects.
8. Conclusion
Our invariance analyses highlight the importance of 3DPAMs applicability in e-
retailing and its construct invariance validity. Following a series of invariance
analyses, it can be concluded that our 3DPAM is invariant in respect of measurement
model and latent mean model across gender, education level and study background.

25
Of the nine invariance tests conducted, three were found to be non-invariant. This
conclusion posits that females and males, undergraduates and postgraduates,
Business-Social and Mathes-IT- Engineering groups, overall, conceptualise the
3DPAMs constructs and its variables: animated colours, control, authenticity,
utilitarian, hedonic and behavioural intention similarly. These results confirm the
applicability of our model in the e-retailing area, unaffected by bias of gender,
education level and study background (Lai and Li, 2005).
9. Managerial Implications
E-retailers should pay more attention to 3D product authenticity antecedents, i.e.,
control and animated colour when designing their 3D virtual models. Including real
colours and flashes that consumers can control easily will lead to more authentic
online experiences. The direct and indirect effects of animated colours and control
constructs reveal the importance of these constructs within the 3D e-retail context.
Any 3D flash should include the essential information that consumers seek rather than
just a pretty picture. For example, consumers should be able to click on any part of the
3D flash to get access to information about it. Web site developers should take
advantage of technological advancements to develop and update online retailers’ 3D
flashes. Pechtl (2003) asserts a positive relationship between perceived innovation
attributes and online adoption behaviour. Algharabat and Dennis (2009a) posit the
importance of authentic 3D product to enhance users’ hedonic and utilitarian values.
Managers and Web sites designers should work together to ensure that the 3D product
visualisation provides customers with the complete and accurate information they
need. In addition, marketers should decide what information (or knowledge) to focus
on before developing 3D flashes. It should be accepted that developing 3D flashes is
not a money-free issue. Nevertheless, many companies have already claimed to have
improved their sales as a result of designing and using 3D flashes. For example, J.C.
Penny, eBags and Wal-Mart claimed that their online sales have increased 10% to
50% after using rich media such as 3D flashes (Demery, 2003). Moreover, Demery
(2006) posits that the numbers of companies who are investing in 3D virtual models is
increasing steadily because these companies are seeing the potential of the technology
for selling more products. Nantel (2004) asserts that consumers shopping online for
clothing are 26% more likely to purchase from the sites that have 3D virtual model
26
than from sites that have not. Moreover, Fiore (2008) posits that media richness is an
important way to differentiate retailers. Wagner (2000) asserts that online retailers
with 3D product visualisations may reap benefits that extend beyond sales. For
example, 3D increases site stickiness: users will spend more time on the online
retailer, which leads to more opportunities to learn more about the products, interact
with them, build trust and confidence. Finally, according to the Social Issues Research
Centre (SIRC, as cited in Herrod, 2007) study it is expected that “by 2020 virtual
commerce (v-commerce) will replace e-commerce” and the development of 3D
virtual models (such as 3D virtual shopping malls) will be leading the whole industry
by 2020.
10. Limitations and Further Studies
Although the generalisability of the results is limited by the student sample, and
cannot be generalised to all online consumer groups, we argue that students represent
the shoppers of tomorrow (Algharabat and Dennis, 2009b; Balabanis and Reynolds,
2001) and the research thus has prescient value. Second, since this study has focused
only on laptops, which we consider to be products that are associated with more
search or experience, it is unclear to what extent the results can be generalised and
applied to other online products. On the bases of our results, we recommend that Web
site developers should pay more attention to simulating 3D animation colours to
reflect the real products more authentically. Moreover, they should work to create an
environment in which consumers sense that they can feel the online products when
they navigate the site. We recommend research efforts to extend the generalisability
of our findings to other contexts (e.g., clothing) and to non-student samples. Further
research may add and test other stimuli, for example by simulating real sounds to
investigate how auditory vividness may influence 3DPAM.
11. References
Algharabat, R. and Dennis, C. (2009a). Using authentic 3D product visualisation for
an electrical online retailer. 12th
International Conference on Retailing and
Commercial Distribution Teaching and Research Issues, EAERCD, Surrey
University, 15-17 July.

27
Algharabat, R. and Dennis, C. (2009b). Modelling 3D product visualisation on the
online retailer. Academy of Marketing, Annual conference 2009, Putting
Marketing in Its Place, Leeds Metropolitan University, 6-9 July.
Ariely, D. (2000). Controlling the information flow: Effects on consumers’ decision
making and preferences. Journal of Consumer Research, Vol. 26 (September), pp.
233-248.
Balabanis, G., and Reynolds, N. (2001). Consumer attitudes towards multi-Channel
retailers’ Web Sites: The role of involvement, brand attitude, internet knowledge
and visit duration. Journal of Business Strategies, Vol. 18 (Fall), pp. 105-131.
Biocca, F. (1997). The cyborg’s dilemma: progressive embodiment in virtual
environments. Journal of Computer-Mediated Communication, Vol. 3, No 2.
Available at: http://www.ascusc.org/jcmc/vol3/issue2/biocca2.html, [Accessed 14th
November 2007]
Biocca, F., and Delaney, B. (1995). Immersive virtual reality technology”, In
F.Biocca, and M. Levy (Eds.). Communication in the age of virtual reality (pp.57-
124). Hillsdale, NJ: Erlbaum.
Byrne, B. (2001).Structural Equation Modeling with AMOS. Lawrence Erlbaum
Associate New Jersey, U.S.A.
Carpenter, J., and Moore, M. (2009). Utilitarian and Hedonic Shopping Value in the
US Discount Sector. Journal of Retailing and Consumer Services, Vol. 16, pp. 68-
74
Chang, E., Burns, L., and Francis, S. (2005). Gender Differences in the Dimensional
Structure of Apparel Shopping Satisfaction Among Korean Consumers: The Role
of Hedonic Shopping Value. Clothing and Textiles Research Journal, Vol. 22, No.
4, pp. 185-199.
Christodoulides, G., Leslie, C., Olivier, F., Eric, S., and Temi, A. (2006).
Conceptualising and Measuring the Equity of Online Brands. Journal of
Marketing Management, Vol. 22, pp. 799-825.
Churchill, G. (1979). A Paradigm for Developing Better Measures of Marketing
Constructs. Journal of Marketing Research, Vol. XVI, pp. 64-73.
Demery, P. (2003, October). The latest flash”, Internet Retailer. Available at
http://www.internetretailer.com/article.asp?id=10323 , [Accessed 15th
May 2009]
Demery, P. (2006, January). As consumers flock to high bandwidth, e-retailers shake,
rattle and roll. Internet Retailer, pp. 23-28

28
Dennis, A., Kinney, S., and Hung, Y. (1999). Gender Differences in the Effects of
Richness. Small Group Research, Vol. 30, No.4, pp. 405-437.
Dennis, C. and King, T. (2009). Development of a cross-market scale for femininity
and masculinity expressed in shopping styles’. 12th
International Conference on
Retailing and Commercial Distribution Teaching and Research Issues, EAERCD,
Surrey University, 15-17 July.
Dennis, C. and McCall, A. (2005). The savannah hypothesis of shopping. Business
Strategy Review, 16 (3): 12-16.
Dholakia R, R. and Chiang, K-P. (2003). Shoppers in cyberspace: are they from
Venus or Mars and does it matter?. Journal of Consumer Psychology, 13 (1/2):
171-176.
Fiore, A. M., Kim, J. and Lee, H.H. (2005a). Effects of image interactivity technology
on consumer responses toward the online retailing. Journal of Interactivity
Marketing, Vol. 19, No. 3, pp. 39-53.
Fiore, A., Jin, H. and Kim, J. (2005b). For fun and profit: hedonic value from image
interactivity and responses towards an online store. Psychology & Marketing, Vol.
22, No. 8, pp. 669-94.
Fiore, A.M., & Jin, H.J. (2003). Influence of Image Interactivity on Approach
Responses Towards an Online Retailer. Internet Research: Electronic Networking
Applications and Policy, Vol. 13, pp.38-48.
Fiore, Ann. (2008). The digital consumer: Valuable partner for product development
and production. Clothing and Textiles Research Journal, Vol. (26), No. (2), pp.
177-190
Fortin, D., and Dholakia, R. (2005). Interactivity and vividness effects on social
presence and involvement with a web-based advertisement. Journal of Business
Research, Vol. 58, 387-396.
Hair, J., Anderson, R., Tatham, R., and Black, W. (2006). Multivariate Data Analysis,
Prentice-Hall, Upper Saddle River, NJ.
Heeter, C. (1992). Being there: the subjective experience of presence. Presence:
Teleoperators and Virtual Environments, Vol. 1, pp. 262-71.
Heeter, C. (2000). Interactivity in the context of designed experiences. Journal of
Interactive Advertising, Vol. 1, No. 1, pp. 75-89.
Herrod, E. (2007, May). E-commerce to 2020. Internet Retailing. Available at
http://www.internetretailing.net/news/e-commerce-to 2020/?searchterm=3D
[Accessed 15th
May 2009]
29
Kim, J & Forsythe, S. (2007). Hedonic usage of product virtualisation technology in
online apparel shopping. International Journal of Retail and Distribution
Management, Vol. 35, No. 6, pp. 502-514
Kim, J., Fiore, A., and Lee, H. (2007). Influence of online store perception, shopping
enjoyment, and shopping involvement on consumer patronage behaviour towards
an online retailer. Journal of Retailing and Consumer Services, No.14, pp. 95-107.
Klein, L. (2003). Creating virtual product experiences: the role of telepresence.
Journal of Interactive Marketing, Vol. 17, No. 1, pp. 41-55.
Lai, V., and Li, H. (2005). Technology acceptance model for internet banking: an
invariance analysis. Information & Management, Vol. 42, pp. 373-386.
Lee, H.H., Fiore, A.M., Kim, J., (2006). The role of the technology acceptance model
in explaining effects of image interactivity technology on consumer responses.
International Journal of Retail & Distribution Management, Vol. 34, No. 8, pp.
621-644.
Li, H., Daugherty, T. and Biocca, F. (2001). Characteristics of virtual experience in
electronic commerce: a protocol analysis. Journal of Interactive Marketing, Vol.
15, No. 3, pp. 13-30.
Li, H., Daugherty, T. and Biocca, F. (2002). Impact of 3-D advertising on product
knowledge, brand attitude and purchase intention: the mediating role of presence.
Journal of Advertising, Vol. 31, No. 3, pp. 43-57.
Li, H., Daugherty, T. and Biocca, F. (2003). The role of virtual experience in
consumer learning. Journal of Consumer Psychology, Vol. 13, No. 4, pp. 395-407.
Liu, Y. and Shrum, L.J. (2002). What is interactivity and is it always such a good
thing? Implications of definition, person, and situation for the influence of
interactivity on advertising effectiveness. Journal of Advertising, Vol. 31. No. 4,
pp. 53-64.
Lombard, M and Ditton, T. (1997). At the heart of it all: the concept of presence.
Journal of Computer-Mediated Communication, Vol. 3, No. 2. Available at:
http://jcmc.indiana.edu/vol3/issue2/lombard.html.
McGoldrick, P., Keeling, K., and Beatty, S., (2008). A typology of roles for avatars in
online retailing. Journal of Marketing Management, Vol. 24, No. 3-4, pp. 433-461.
McMillan, S.J. and Hwang, J.-S. (2002). Measures of perceived interactivity: an
exploration of the role of direction of communication, user control, and time in

30
shaping perceptions of interactivity. Journal of Advertising, Vol. 31, No. 3, pp. 29-
42.
Nantel, J. (2004). My virtual model: Virtual reality comes into fashion. Journal of
Interactive Marketing, Vol. 18, No. 3, 73-86.
Overby, J., and Lee, E. (2006). The Effects of Utilitarian and Hedonic Online
Shopping Value on Consumer Preference and Intention. Journal of Business
research, Vol. 59, pp. 1160-1166.
Pechtl, H. (2003). Adoption of online shopping by German grocery shoppers. The
International Review of Retail, Distribution and Consumer Research, No. 13, Vol.
2, pp. 145-159.
Raijas, A. (2002). The Consumer Benefits and Problems in the Electronic Grocery
Store. Journal of Retailing and Consumer Services, Vol. 9, pp. 107-113.
Schlosser, A. (2003). Experiencing products in the virtual world: the role of goal and
imagery in influencing attitudes versus purchase intentions. Journal of Consumer
Research, Vol. 30, No. 2, pp. 184-198.
Sheridan, T.B. (1992). Musings on telepresence and virtual presence. Presence,
Teleoperators and Virtual Environments, Vol. 1, No. 1, pp. 120-126.
Shih, C. (1998). Conceptualizing consumer experiences in cyberspace. European
Journal of Marketing. Vol. 32, No. (7/8), pp. 655-663.
Song, J.H., and Zinkhan, G. M. (2008). Determinants of Perceived Web Site
Interactivity. Journal of Marketing, Vol. 72(March), pp. 99-113.
Song, K., Fiore, A., and Park, J. (2007). Telepresence in online apparel shopping
experience. Journal of Fashion Marketing and Management. Vol. 11, No. 4, pp.
553-570.
Steuer, J. (1992). Defining virtual reality: dimensions determining telepresence.
Journal of Communication, Vol. 42, No. 4, pp. 73-93.
Suh, K., and Chang, S. (2006). User interface and consumer perceptions of online
stores: the role of telepresence. Journal of Behaviour & Information Technology,
Vol. 25, No. 2, pp. 99-113.
Suh, K., and Lee, Y. (2005). The effects of virtual reality on consumer learning: an
empirical investigation. MIS Quarterly, Vol. 29. No. 4, pp. 673-697.
Wagner, M. (2000). Picture this: E-retailers aims to zoom, spin and model their way
to higher sales. Internet Retailer”. Available at:
http://www.internetretailer.com/internet/marketing-conference/90763-picture-this-

e-retailers-aim-zoom-spin
2009]
Appendix A
31
spin-model-their-way-higher-sales.html, [Accessed 15[Accessed 15th
May