3d modeling of the virtasalmi cu deposit in eastern finland
TRANSCRIPT

Geological 3D-modeling of the
Virtasalmi Cu deposit in eastern
Finland
LAURI TAPIO VIRNES
MASTER’S THESIS
OULU MINING SCHOOL
UNIVERSITY OF OULU
2018

Abstract
Modern computing power and advanced 3D-modeling software have made the
modeling of geological, geophysical, geochemical and structural data a widely used
method in active mine production as well as in brownfield exploration, where it can be
used for visualization, planning and target generation. In this study, the
Paleoproterozoic Cu-dominated VMS deposit of Virtasalmi and related mine were
modeled to produce the first modern 3D-model of the deposit and to test the accuracy of
the digitized historical datasets. A total of 239 drill holes from the Virtasalmi mine area
were used, from which the collar locations, downhole surveys, lithological logs and
geochemical assays were digitized and added to a geological database. Around 3000 Cu
analyses were utilized for modeling of the general low-grade (0.2–0.7 wt.% Cu) and
high-grade (>0.7 wt.% Cu) mineralization solids. The results show that before the
mining operations were started, the Virtasalmi deposit consisted of several high-aspect-
ratio lenses, which had a combined strike length of ~626 m near the surface and
extended up to ~344 meters below the surface. The performed unofficial resource
estimation indicates that the area contained a total of 4.83 Mt of mineralized material, of
which ~3.51 Mt was low-grade mineralization and 1.32 Mt high-grade mineralization.
Based on the model, roughly 500 000 tons of mineralized material is still left unmined
in the Virtasalmi mine area.
Keywords: 3D-modelling, Resource estimation, Virtasalmi Mine, VMS deposits.

Contents
1. Introduction ............................................................................................................... 1
2. Volcanogenic massive sulfide deposits .................................................................... 2
3. Regional geology ...................................................................................................... 6
4. Geology of the Virtasalmi district ............................................................................ 9
4.1 Amphibolites .................................................................................................... 10
4.1.1 Suite 3 amphibolites .................................................................................. 11
4.2 Skarn rocks ....................................................................................................... 12
4.2.1 Type 5 skarns ............................................................................................ 13
5. Geology of the Virtasalmi mine .............................................................................. 13
5.1 Amphibolites .................................................................................................... 14
5.2 Garnet skarns .................................................................................................... 17
5.3 Intrusive rocks .................................................................................................. 17
5.4 Local deformational structures ......................................................................... 19
5.5 Copper mineralization ...................................................................................... 19
5.5.1 Disseminated Cu mineralization ............................................................... 20
5.5.2 Network Cu mineralization ....................................................................... 20
5.6 Remobilization of the sulfides ......................................................................... 21
5.7 Local stratigraphy ............................................................................................. 21
5.8 Relative timing and genesis of the Virtasalmi mineralization ......................... 23
6. Methods and materials ............................................................................................ 24
6.1 Copper grade modeling .................................................................................... 24
6.2 Open pit, stope and mineralization solid tonnage estimation .......................... 29
6.3 Coordinate grid and elevation system .............................................................. 32
7. Results ..................................................................................................................... 34
7.1 Collar and mineralization distribution and general extents .............................. 34

7.2 Distribution of high-grade mineralization ........................................................ 38
7.3 Resource estimation ......................................................................................... 40
8. Discussion ............................................................................................................... 41
8.1 Coordinate and elevation system conversion ................................................... 41
8.2 Model validation .............................................................................................. 41
8.3 Resource estimation ......................................................................................... 43
8.4 Comparison of the Virtasalmi mineralization with other similar deposits ...... 44
8.5 Further research ................................................................................................ 44
9. Conclusions ............................................................................................................. 45
Acknowledgements ......................................................................................................... 46
References ....................................................................................................................... 46
Appendix: Drill hole information

1
1. Introduction
Within the past couple of decades, 3D-modeling of geological, geophysical,
geochemical and structural data in both greenfield and brownfield exploration has
become a household discipline for many researchers, and exploration and mining
companies. Understanding the complexity of the geology in a mining district has been
shown to lead to the extension of life-of-mine of operating mines and discoveries of
continuations of ore-bearing horizons in the subsurface or even new, prospective areas
(e.g., Fan et al. 2017, Li et al. 2015, Jansson et al. 2013, Martin et al. 2007).
The Cu-bearing stratabound, polydeformed and metamorphosed volcanogenic massive
sulfide deposit (VMS) of Virtasalmi is located close to the Virtasalmi town in the
municipality of Pieksänmäki in eastern Finland. Historically, the deposit has also been
called the Hällinmäki deposit or Karsikumpu deposit. The mineralization was exploited
by Outokumpu Oy between 1966 and 1984 in two stages, which included open pit
mining and underground operations. A total of ~4.2 Mt of Cu ore was extracted during
these mining operations (Puustinen 2003). After the initial exploration drilling by GTK,
Hyvärinen (1966, 1969) presented a comprehensive geological description, a model for
ore genesis as well as an initial resource estimate. Later Lawrie (1988, 1992) conducted
a structural and geochemical study of the Virtasalmi district and defined the Virtasalmi
mineralization as a VMS deposit. Since Lawrie’s investigations, no comprehensive
studies of the Virtasalmi amphibolites have been undertaken. During the operation of
the Virtasalmi mine, near-mine exploration for ore lenses at greater depth was generally
minor and unsuccessful.
The purpose of this thesis was to collect, digitize and exploit historical data from the
Virtasalmi mine in modern modeling software in order to reconstruct the pre-mining
extent of the mineralization by generating a 3D-model of the Cu mineralization. The
work was conducted using GEOVIA Surpac 6.7.2 for 3D-modeling and ESRI ArcMap
10.3 for map digitization and georeferencing. The data utilized come from 239 diamond
drill holes which were drilled and analyzed for copper during the exploration and
operation of the mine. The model presented here can act as a starting point for further
research or exploration and can be useful for resource classification in a system like

2
UNFC (United Nations Framework Classification for Resources). The aim is also to
explore the accuracy and validity of a model generated from the historical data.
2. Volcanogenic massive sulfide deposits
Volcanogenic massive sulfide deposits (VMS), also called volcanic-hosted massive
sulfide deposits (VHMS) are a major source of base metals, such as Cu, Zn and Pb.
Additionally, precious metals Au and Ag are a common side product obtained from
VMS deposits (Koski and Moiser 2012, Shanks and Koski 2012, Pirajno 2008, Galley
et al. 2007). Globally around 1100 VMS deposits are currently known. More than 800
of these deposits are of a significant size, containing sulfide ore from 200 Kt to more
than 150 Mt (Koski and Moiser 2012, Galley et al. 2007). Age-wise, the VMS deposits
range from modern active systems to early Archean deposits. However, there are time
periods in the geological record when the formation of VMS deposits was especially
active, including ~2.76 Ga, ~1.96 Ga, 0.6-0.25 Ga and 0.03 Ga. These times are
temporally associated with ocean closing phases in the supercontinent cycle (Cawood
and Hawkesworth, 2013, Koski and Moiser 2012, Bradley 2011). Preservation bias
towards back arc-related VMS deposits means that many of the known VMS deposits
are connected to periods of major ocean closing and deposits tend to be found near
continental margins or in a proximity to suture zones (Cawood and Hawkesworth 2013,
Galley et al. 2007, Groves et al. 2005).
VMS deposits form near or directly on the sea floor as stratabound, sometimes
exhalative, mineralization when acidic metal-bearing hydrothermal fluids are subjected
to changes in pressure, temperature, oxidation or pH (Pirajno 2008, Huston and Large
1989). The change in these conditions induces the precipitation of various sulfides,
sulfates, calcite, amorphous silica, quartz and Fe oxides. Usually the most abundant
sulfide species are iron sulfides, such as pyrite, pyrrhotite and marcasite. In economic
deposits, the Fe sulfides are accompanied by sphalerite, chalcopyrite and sometimes
galena (Shanks and Koski 2012, Koski and Moiser 2012, Pirajno 2008, Peter et al.
1988).
Formation of VMS deposits generally takes place in mid-ocean spreading centers and
back-arc spreading basins, which are dominantly extensional tectonic settings.
However, VMS deposits are likely to occur anywhere with submarine volcanism, and

3
thus probable tectonic environments include also subduction-related, intra-oceanic and
continental margin magmatic arcs (Shanks and Koski 2012, Huston et al. 2010, Pirajno
2008, Van Kranendonk et al. 2006a, Kerrich et al. 2005). High thermal input of
volcanically active areas in combination with crustal extension are important factors for
VMS formation. In these tectonic environments, high heat flow provides the necessary
energy for driving hydrothermal fluid circulation and extension-related faulting and
fracturing provide channel ways for concentrated fluid movement and discharge
(Pirajno 2008, Galley et al. 2007).
An idealized example of a VMS deposit consists of a VMS mound structure, which is
situated on the sea floor at a depth of more than 1000 meters. The mound can be tens of
meters high and hundreds of meters long and wide. This main mound can show
additional relief formed of smaller mounds (Thompson et al. 1988). The main mound
can be formed from a combination of fragmented country rocks with blocks and pieces
of massive sulfide material. The smaller, additional mounds are made of fragments of
sulfide material and indicate locations of vigorous exhalation of hydrothermal fluids.
Depending on the environment, features between active smaller vent mounds can be
covered by metalliferous sediments (Herzing and Hannington 1995, Thompson et al.
1988). The venting or exhalation of hydrothermal fluids takes place from chimney
structures and cones forming on top of the VMS mounds. These chimneys can be either
high-temperature, sulfide-venting black smokers (over 350 °C) or cooler, barite-, silica-
and sphalerite-venting, white smokers (100–350 °C) (Pirajno 2008, Humphris et al.
1995b, Herzing and Hannington 1995). Normally black smokers form in the inner parts
of a VMS mound while the white smokers occupy distal parts of the system.
Precipitation of sulfides and additional gangue material takes place in the vent zones
immediately at contact with the cool seawater. Minerals add material to the growth of
the existing chimneys or they are dispersed in the water column in a cloud and proceed
to fall on the sea floor in the proximity of the chimney structures (Pirajno 2008, Herzing
and Hannington 1995, Thompson et al. 1988).
Underneath the VMS mounds, footwall lithologies can consists of a variety of volcanic
rocks and sedimentary units, both which are dependent on the overall tectonic setting of
the area. In an idealized example, the footwall rocks are the host to a discordant,
subvertical, pipe- or carrot-shaped alteration zone, which can be several hundreds of
meters deep (Hannington et al. 1998). However, deposits where fluids have moved

4
laterally in permeable horizons do not exhibit these discordant alteration zones
(Raymond 1996). The alteration zone consists of a fractured and pervasively altered
country rocks and is commonly called a feeder or stringer zone. The feeder zone
signifies an area of concentrated hydrothermal fluid ascension before the fluids are
vented on the sea floor (Shanks and Koski 2012, Pirajno 2008, Hannington et al. 1998,
Herzing and Hannington 1995). The alteration mineral assemblage present in and
around the feeder zone and the alteration intensity are controlled by temperature, pH,
fluid/rock ratio and activity of cations (Mg, Ca, Na) (Pisutha-Arnond and Ohmoto
1983). Normally, heat flow and F/R ratio are high and alteration strong beneath the
VMS mounds. The intensity of alteration decreases with distance to the mound. The
central part is altered by strong silification and have a mineral assemblage of sericite +
chlorite + quartz ± clays. More distal parts of the system are less serisitic and chloritic
with montomorillonite and zeolites taking their place. Common components of the
feeder zones are also chalcopyrite and quartz veins and disseminated Cu-rich sulfide
mineralization (Shanks and Koski 2012, Bonnet and Corriveau 2007, Herzing and
Hannington 1995).
Thermal gradient not only contributes to the intensity and type of alteration surrounding
a VMS mineralization, but it also effects the metal zonation exhibited by many VMS
deposits. Metal zonation is formed during the gradual growth of the VMS mound when
additional sulfide mass insulates the inner zones of the mound and low temperature
sulfides, such as sphalerite and marcasite, migrate towards the outer shell of the mound
while they are being replaced by high-temperature sulfide species including
chalcopyrite, cubanite, bornite and pyrrhotite. For this reason, the sulfide mineralization
in a VMS feeder zone is dominated by Cu sulfides (Shanks and Koski 2012, Pirajno
2008).
The metals enriched in VMS deposits are mostly scavenged from the oceanic
lithosphere that surround the deposit. Copper, Zn and Fe are derived from mafic or
ultramafic country rocks. A VMS system with a significant amount of Pb requires a Pb
source, such as sedimentary units or felsic volcanic rocks (Rona 1984). Additional
metals to the VMS forming hydrothermal fluids are contributed by magmatic fluids
generated by magma degassing (Bonnet and Corriveau 2007, Yang and Scott 1996,
Lydon 1988). This could especially be the case in fast spreading ridges, back-arc basins
and suprasubduction-related VMS deposits since the heat-providing magma chambers

5
are relatively shallowly emplaced (Yang and Scott 1996, Pirajno 2008). The sulfur in
the VMS systems is mostly derived by reduction of seawater sulfate while leaching of
sulfides already present in the country rocks is also likely to contribute (Huston et al.
2001, Walshe and Solomon 1981, Solomon 1976).
While VMS deposits tend to be polymetallic ore formations, there is still a number of
deposits, including Virtasalmi, where the mineralization consists mainly of Cu sulfides.
A modern example exists on the Galapagos rift where venting hydrothermal fluids at
350–400 °C are creating Cu-dominated mineralization (Skirrow 1982). In the Solean
graben in Cyprus, a late Cretaceous Cu-dominated hydrothermal convection system is
part of the Troodos ophiolite. There a hydrothermal convection cell was active away
from the major spreading axis. The Cu mineralization and the alteration of country
rocks postdate the magmatism, faulting and deformation related to extension at the
spreading ridge. An argillic altered feeder zone has been identified from the area.
Underlying the feeder zone is an intensely hydrothermally metasomatized zone where
original sheeted dikes have been altered into granular epidote-quartz-chlorite
“epidosites” (Schiffman et al. 1987).
The Mt. Lyell mining field located on the Tasmanian west coast near Queenstown is a
host to seventeen large VMS deposits, some of which are still being exploited
(Raymond 1996). The Mt. Lyell area has a mixture of traditional VMS-type deposits
and disseminated Cu-rich lenses hosted by hydrothermally altered middle Cambrian
volcanic and volcanoclastic rocks (Perkins and Walshe 1993). The more typical VMS
mineralization consists of massive pyrite-galena-sphalerite and pyrite-chalcopyrite
mineralization lenses. Stratigraphically underlying the massive sulfide lenses are high-
grade lenses containing disseminations and stringers of pyrite and chalcopyrite as well
as zones with mainly bornite and chalcopyrite in them (Walshe and Solomon 1981).
Some of these areas with a high Cu grade lack the traditional overlying massive sulfide
mounds, and it is assumed that the original mounds have been eroded away (Corbett
2001).
An Archean example of the VMS system where the mineralization consists mainly of
chalcopyrite and minor pyrrhotite has been reported from the ~3.7 Ga Isua supracrustal
belt in western Greenland. In the Isua area, the disseminated, Cu-dominated
mineralization is situated mainly in layered/banded tuffaceous amphibolites. The

6
mineralization has been interpreted to have an exhalative origin. It is associated with
various iron formations, which also have been suggested to be related to the venting that
created the disseminated Cu mineralization (Appel 1997).
3. Regional geology
The Virtasalmi area is located in the south-eastern corner of the Savo belt (Figs. 1 and
2). Geologically, the area is part of the supracrustal rocks of the Raahe-Ladoga zone,
being situated near the Raahe-Ladoga suture, which separates the Svecofennian island
arc complex (west) and the Karelian craton (east) (Fig. 1) (Korsman et al. 1997, Kärki
et al. 1995). The eastern and northern parts of the Svecofennian island arc complex and
especially the Raahe-Ladoga zone host several VMS deposits including those of the
Vihanti-Pyhäsalmi area north of Virtasalmi (Fig. 2). North-east of Virtasalmi lies the
allochtonous Outokumpu nappe complex, which is also characterized by the presence of
various VMS deposits (Peltonen et al., 2008) (Figs. 1 and 2).
The supracrustal rocks of the Virtasalmi area are ~1.91-1.92 Ga in age (Pekkarinen
2002, Vaasjoki and Sakko 1988) and consist of metasediments, such as mica schists or
gneisses, and variably banded amphibolites (Kähkönen 2005). The protoliths of the
amphibolites have been submarine subalkaline mafic volcanic rocks of andesitic to
basaltic composition (Pekkarinen 2002, Lawrie 1992, Lawrie 1988). At Virtasalmi, the
Svecofennian intrusive rocks are represented by a gabbro-diorite-quartz-diorite-tonalite-
trondhjemite suite, which comprises ~60% of the rocks in the area (Lawrie 1988).
The rocks in the Virtasalmi area have undergone two major peaks of metamorphism.
During D1, granulite facies conditions prevailed. This was followed by incomplete
retrogression under lower amphibolite facies conditions during D2 (Vaasjoki and Sakko
1988; Lawrie 1988). Deformation in the region is expressed by folds, ductile shearing
and younger brittle and semi-brittle reactivation of older shear zones (Kärki et al. 1995).

7
Fig. 1. Approximate distribution of major geological complexes in southern Finland and locations of
major VMS deposits. Simplified after Hanski (2015).

8
Fig. 2. A) Geological map of eastern Finland. B) Local geology of the Virtasalmi area. Based on
maps Bedrock of Finland in scale 1:5 000 000 and Bedrock of Finland in scale 1:200 000 ©
Geological Survey of Finland

9
4. Geology of the Virtasalmi district
The Virtasalmi mineralization occurs in the Virtasalmi volcanic belt in the southern part
of the Savo belt (SB), some 50 km north of the city of Mikkeli. The Savo belt runs
roughly from Oulu to Joroinen and is roughly parallel to the NW-SE-trending Raahe-
Ladoga suture zone (Figs. 1 and 2). In general, the supracrustal rocks of the Savo Belt
consist of mica schists and migmatized gneisses. Locally, felsic and basaltic
metavolcanites, now metamorphosed to quartz-feldspar schists and amphibolites, can be
abundant (Kähkönen 2005, Lawrie 1992). Dating of the Virtasalmi belt is difficult
because felsic metavolcanic rocks are missing in the rock sequence, but a U-Pb zircon
age from a rhyolitic unit from a nearby locality at Joroinen (~30 km away) has yielded
an age of 1906±4 Ma (Vaasjoki and Sakko 1988). This is somewhat younger than the
age of metavolcanic rocks in the northern Savo Belt where a rhyolite from the
Pyhäsalmi area has been dated at 1921±2 Ma (Kousa et al. 1994).
The most prevalent supracrustal rocks in the Virtasalmi area are fine-grained
metasediments surrounding the Virtasalmi metavolcanic belt and carbonate rock units.
The carbonate rocks range from thin interlayers to thicker lenticular units (Reinikainen
2001, Hyvärinen 1966). The supracrustal rocks of the Virtasalmi metavolcanic belt are
amphibolites with skarns and minor carbonate rocks. Primary structures have been
poorly preserved in the amphibolized metavolcanites but some local occurrences of
pillow lavas, lava tubes, sills and dikes can be recognized (Lawrie 1988). As with the
rest of the Svecofennian domain, the Virtasalmi belt has been dissected by pre-, syn-
and late-kinematic intrusions (Kähkönen 2005, Kärki et al. 1995).
Lawrie (1992) describes three major and four local deformation phases in the Virtasalmi
area. D1 folds have been overprinted but D1 fabrics have been preserved in rare
localities. D2 and D3 features are preserved, with the deformation of these phases
consisting of ductile deformational and upright and reclined folding. The four localized
post-D3 deformational phases likewise formed upright folds and subvertical fabrics but
these features are only local. Connected to the deformational phases, two major
metamorphic peaks have affected the Virtasalmi area. The first peak (M1) took place
under granulite fasies conditions, at 750-800 °C and 3.5-5.5 kbar. During D2,
metamorphic peak M2 affected the rocks under lower amphibolite facies conditions, at
450-550 °C and 2-3.5 kbar. M2 caused retrogression and amphibolization of the

10
previous granulite mineral assemblages but this process was only partial and resulted in
polymetamorphic mineral assemblages (Lawrie 1988).
4.1 Amphibolites
Some primary features, such as pillow lavas and lava tubes, have survived locally in
low-strain zones. They indicate a submarine volcanic origin of the Virtasalmi
amphibolites (Lawrie 1988). The stratigraphy or thickness of the volcanic pile has not
been established mostly due to the wide distribution of intrusive lithologies in the area
(Hyvärinen 1966, Lawrie 1988). Based on geochemistry, petrological differences and
field relationships, Lawrie (1988) recognized four main suites and several subsuites of
amphibolites in the Virtasalmi metavolcanic belt. All suites plot mostly in the tholeiitic
Fig. 3. Distribution of amphibolites near the Virtasalmi mine. Modified after Lawrie (1992).

11
field in the Jensen cation plot (Fig. 4). All suites show low Zr/Nb and Y/Nb ratios. They
also exhibit enrichment in light rare earth element (LREE), large-ion lithophile elements
(LILE) and Nb relative to N-MORB. These features are most akin to within-plate
basalts or E-MORB. Lawrie (1992) suggests an intra-cratonic or a passive continental
margin setting for the Virtasalmi amphibolites.
The amphibolites hosting the ore body at the Virtasalmi mine are part of the suite 3. A
summary of the most salient features after Lawrie (1988, 1992) is given below. Figure 3
illustrates the general distribution of amphibolitic rocks around the mine.
4.1.1 Suite 3 amphibolites
Suite 3 amphibolites are fine-grained, greenish black rocks consisting of clinopyroxene,
hornblende, andesine-labradorite and titanite. The rocks of this suite are the host rocks
for the disseminated Cu mineralization at Virtasalmi and they are often skarn-altered to
varying degree or interlayered with skarn rocks. The suite has been divided into 3
subgroups (a-c). Geochemically, suite 3 is separated from suites 1 and 2 by its relatively
low Y/Nd ratio, higher Zr/Y ratio and high Nb content. According to Lawrie (1988,
1992), olivine and clino- or orthopyroxene were important fractionated phases during
crystallization of suite 3 and, compared with other amphibolites in the Virtasalmi belt,
the parental magma was derived through a relatively low degree of partial melting.
Batch melting and open system fractional crystallization are also suggested by
variations in Cr/Zr and Ni/Zr ratios and initial Zr contents (Lawrie 1988).

12
4.2 Skarn rocks
The term “skarn” is usually connected to lithologies that were formed when a carbonate
rock was replaced with silicates. However, in the previous studies of the Virtasalmi area
(Hyvärinen 1966; Lawrie 1988), “skarn” has been applied in a broad sense when
dealing with metamorphosed sedimentary and volcanogenic rocks where alteration has
created Ca-rich silicate mineral assemblages. Lawrie (1992) prefers the term “calc-
silicate rock” for the intensively metasomatized rocks in the Virtasalmi belt. Calc-
silicate minerals associated with the skarnified rocks of the Virtasalmi area are
andradite-grossular garnet, diopside-hedenbergite pyroxene and scapolite mixed with a
lower metamorphic assemblage consisting of hornblende, actinolite, epidote and quartz
(Lawrie 1992). Lawrie (1988) described 8 types of skarns and their relation to the other
country rocks in the Virtasalmi area. Type 1 skarns occur within carbonate layers as
sharp bands of calc-silicate minerals. Type 2 skarns are found as concentrations of calc-
Fig. 4. Jensen cation plot for Virtasalmi amphibolites. Modified after Lawrie (1992).

13
silicate minerals embedded in amphibolites in the contact zones between altered
amphibolites and carbonate units. Type 3 and 4 skarns occur as ovoid batches of calc-
silicates in pillow lavas and lava tubes. Type 5 skarnification is observed in the
amphibolite units where carbonate interlayers are generally absent. Type 6 and 7 skarns
occur mixed with amphibolite fragments with abundant epidote and magnetite. Type 8
skarns have garnet and pyroxene mixed with abundant magnetite and occur sometimes
interlayered with Cu-mineralized amphibolites. Type 5 skarns are chiefly connected to
the Cu mineralization while most of the other skarn types are barren. A short description
of type 5 skarns is give below after Lawrie (1988).
4.2.1 Type 5 skarns
Type 5 skarns exhibit a gradual change between unaltered amphibolites and massive
calc-silicate-dominated skarn rocks. This transition is observed in a scale from 2 cm to
10 m. Mineralogically, the intensity of alteration is indicated by an increasing
abundance of andradite garnet. The mode of occurrence of garnet changes from scarce
to strong dissemination and where the skarnification is most intense, 90% of the rock
can consist of garnet. Diopside and plagioclase exhibit a compositional change in
transition zones. Diopside changes to hedenbergite and plagioclase incorporates
additional Ca. The intensity of skarn alteration can generally be seen in the increase of
bulk CaO in the altered rocks (Hokka and Virnes 2017, Lawrie 1988). Where
retrogression has changed the mineral assemblage, epidote and quartz is common. At
the Virtasalmi mine, there are places where type 5 skarnified amphibolite units are cut
by relatively unaltered amphibolites with disseminated Cu mineralization. These type 5
skarns are interpreted by Lawrie (1988) as a stock work zone for the associated
mineralized amphibolites.
5. Geology of the Virtasalmi mine
The Virtasalmi mine, which is now exhausted from resources, is located ~10 km to the
south from the Virtasalmi town. Lithological features of the supracrustal rocks around
the mine area strike roughly SE-NW and have a steep dip of ~75° towards NE. Intrusive
rocks cut other rock units at a high angle. The amphibolite sequence and carbonate unit
of the mine area are surrounded by diorite and gabbro intrusions (Fig. 5). The
amphibolites are made of a fine-grained, tuffaceous and mineralogically diverse group
of rocks, which are commonly sandwiched with each other. The prevailing supracrustal

14
metavolcanites are cut by various coarser-grained intrusive dikes and sills, which
mainly are dioritic and gabbroic in composition. Granitic intrusions are present,
comprising coarser-grained pegmatitic rocks and fine-grained aplitic veins, both which
are common but not voluminous.
5.1 Amphibolites
There are multiple variants of fine-grained amphibolites in the mine area. They form
interlayered mixed rock types where one type dominates while the other(s) forms thin
layers or bands (Hyvärinen 1966). Geochemically, the amphibolites of the mine area
belong to suite 3 and in some cases to suite 1 (Lawrie 1992). Generally, the
amphibolites are made of varying amounts of hornblende, plagioclase and biotite.
Hyvärinen (1966) described 3 different variants of amphibolites from the Virtasalmi
mine: hornblende-, diopside- and biotite amphibolites.
Fig. 5. Lithological map around the open pit of the Virtasalmi mine. Modified after Pekkarinen
(2002).

15
Hornblende amphibolites are formed of fine-grained, green hornblende and plagioclase
with minor biotite. Hornblende amphibolites can be severely fractured and commonly
form a mixture with intrusive rocks. Diopside amphibolites consist of diopside-
hedenbergite, plagioclase and hornblende with lesser amounts of epidote and garnet
(Fig. 6). They are consists of alternating hornblende-poor, pale bands and hornblende-
rich, dark bands. Diopside amphibolites are often interlayered with garnet skarns and
there is an observable increase of epidote and garnet near the skarn layers. Biotite
amphibolites are fine grained, consist of hornblende, biotite and plagioclase and are
observed to crosscut diopside amphibolites and their compositional banding (Fig. 7).
Fig. 6. Diopside amphibolite with disseminated chalcopyrite. A) Split core sample. B) Full core
sample, wet. Hole R3, depth 19.75 m. Photos: Geological Survey of Finland 2017.

16
Fig. 7. Non-mineralized biotite amphibolite. A) Dry sample. B) Wet sample. Hole R28, depth 213.70
m. Photos: Geological Survey of Finland 2017.
Fig. 8. Weakly mineralized garnet skarn with hedenbergite (green) on contact with diorite. A) Full
core sample, dry. B) Split core sample, wet. Hole R28, depth 230.60 m. Photos: Geological Survey of
Finland.

17
5.2 Garnet skarns
Skarnified rock units at the Virtasalmi mine can be 0.5 to 10 m thick and hundreds of
meters long and they occur mixed and interlayered with amphibolites. The skarns
consist mainly of garnet, which is a solid solution between andradite and grossular or
almandine. Also present is hedenbergitic pyroxene, which sometimes is more abundant
than garnet (Fig. 8). Epidote, plagioclase and scapolite are common accessory phases
while microcline, quartz and sometimes chalcopyrite occur as secondary fracture
fillings (Hyvärinen 1966). The calc-silicates in these skarn units occur as fine
dissemination, as batches of small minerals or as massive monomineralic zones (Lawrie
1988, Hyvärinen 1966).
5.3 Intrusive rocks
Intrusive rocks represent the prevailing rock types in and around the Virtasalmi mine
area. They have various modes of occurrence ranging from large intrusions to dikes,
sills and thin veins. They are usually medium grained and gabbroic or dioritic in
composition.

18
Granitic intrusive rocks are abundant but do not form large bodies. Especially aplitic
and pegmatitic veins are common in fault, shear and fracture zones.
Diorites are the most common intrusive rock type. It is mainly composed of hornblende
and plagioclase with minor biotite and cummingtonite (Fig. 9). Less commonly they
grade to finer-grained quartz diorites with more biotite and additional quartz (Hyvärinen
1966). Diorites and quartz diorites form a suite comprising rocks of multiple age
generations, ranging from early kinematic to late kinematic (Lawrie 1988). Larger
gabbro intrusions are common in the Virtasalmi district but at the mine site, they form
relatively thin, 4- to 10-meter-wide dikes which cut amphibolites in a high angle.
Gabbros consist mainly of hornblende and plagioclase (Fig. 10). In gabbro intrusions
amphibolite fragments are common and partial assimilation of the fragments has often
happened (Hyvärinen 1966). In terms of timing, the gabbro dikes are mostly early to
mid-kinematic (Lawrie 1988).
Fig. 9. Diorite. Hole R3, depth 97.15 m. Photos: Geological Survey of Finland 2017.

19
5.4 Local deformational structures
Structurally, the mine area is dominated by a large and tight anticlinal F2 fold, which
along with minor structures was described by Lawrie (1988). The F2 fold structure has
an axial trend that crosses through the main open pit in a NW-SE direction. The fold has
a variable, gentle plunge of ~20° towards north and an inclined axial plane dipping 60°
to E. Minor D3 structures are very common around the mine. These F3 folds are
upright, have axes plunging 50-70° to SE and have axial planes which dip 60-80° to E.
Minor F5 and F6 folds are recorded from the mine area. They commonly refold F3 folds
but do not form large structural features. Faulting is common and in places, a major (up
to 50 m) displacement has taken place, but the overall effect of faulting on the deposit
geometry is poorly confined.
5.5 Copper mineralization
The mineralized zone at the Virtasalmi mine has a strike length of ~650 m long. Under
the open pit, the zone continues ~350 m below the surface (218 m below sea level, Fig.
17). The mineralization is irregular and often truncated by barren granitic intrusions.
Continuous parts of the mineralization form several lenticular bodies with a general
strike and dip of 120/~75°. In surface exposures, the thickness of the mineralized zone
Fig. 10. Gabbro. Hole R28, depth 241.50. Photo: Geological Survey of Finland 2017.

20
varies from 2 to 30 m, while at depth, the zone becomes narrower and is generally
between 5 and 15 m in thickness. Spatially, the mineralization occurs near the contact to
the dioritic intrusions (Fig. 5). The major sulfide phases which make up the
mineralization are chalcopyrite, cubanite and pyrrhotite. Two modes of mineralization
are present: 1) the disseminated type, which is more abundant and common in diopside-
rich amphibolite layers; 2) the network type, which is normally associated with garnet
skarn layers and their immediate surroundings, but also, less commonly, occurs with
fractured amphibolites.
5.5.1 Disseminated Cu mineralization
The grade of the disseminated mineralization varies from low to medium (0.2-0.7 wt.%
Cu). Sulfides are either uniformly distributed within the host amphibolite or it form
bands in diopside-rich amphibolite layers (Fig. 6). Where sulfide bands occur, they are
separated from each other by non-mineralized hornblende amphibolite (Hyvärinen
1966). The disseminated sulfide mineralization is fine grained and chalcopyrite
occupies ~80 vol.% of the sulfide minerals (Hyvärinen 1966). Minor cubanite occurs as
exsolutions in chalcopyrite. The amount of cubanite exsolutions is higher where the
grain size of the dissemination is larger. Only ~6 vol.% of the disseminated ore minerals
is pyrrhotite but its proportion increases where dissemination is very weak (Hyvärinen
1966).
5.5.2 Network Cu mineralization
In the high-grade (0.7-8 wt.% Cu) network mineralization sulfides commonly form
networks around skarn and amphibolite fragments, but in some places, massive, 5- to
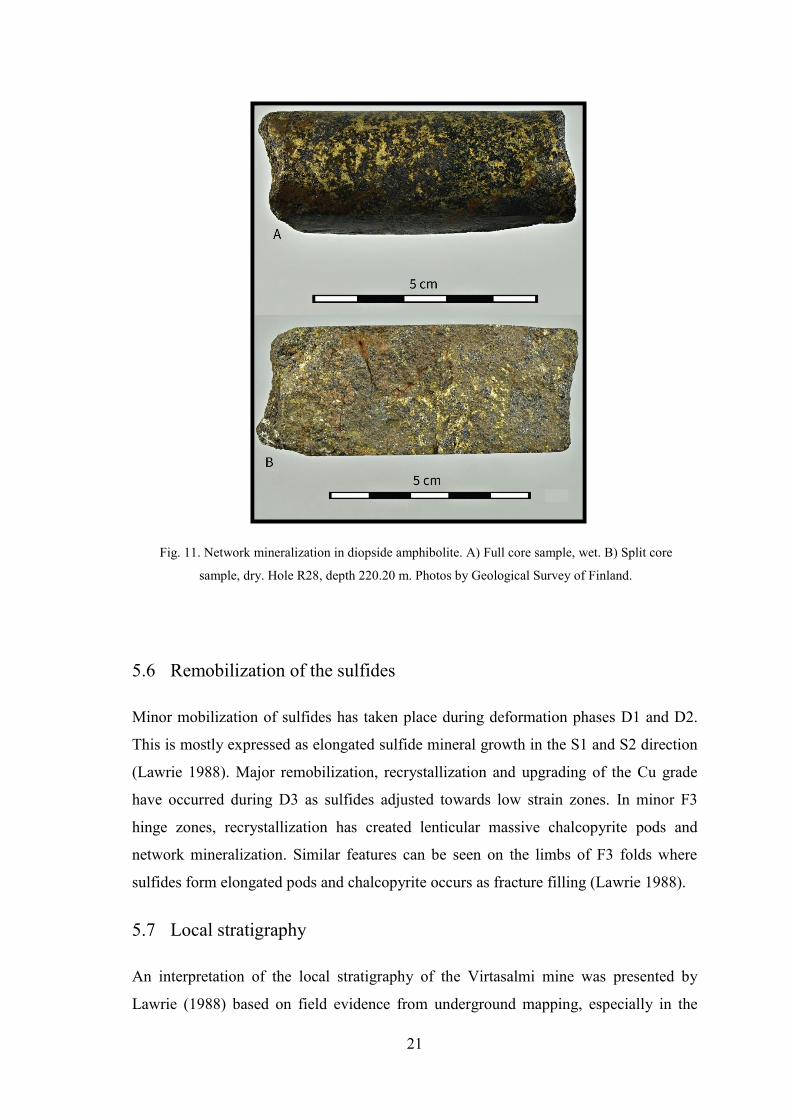
10-cm-long and several-cm-wide lenses of massive sulfide ore exist (Fig. 11). The
sulfides in the network mineralization have migrated into structurally weakened skarns
and amphibolites during remobilization related to deformation. The major ore minerals
which occur in the zones of network mineralization are chalcopyrite, cubanite,
pyrrhotite and minor pyrite. Cubanite can make up to 40 vol.% of bulk sulfides while
pyrrhotite and pyrite make up to ~15% and chalcopyrite the rest (Hyvärinen 1966). The
average grain size of chalcopyrite and cubanite is much coarser than in disseminated
ore, reaching 4 cm. On a microscopic scale, bornite, machinawiite, pentlandite,
bravoite, sphalerite, molybdenite, linneite, gersdorfite, ludwigite and millerite have been
observed as exsolutions in chalcopyrite and pyrrhotite (Hyvärinen 1966).
21
5.6 Remobilization of the sulfides
Minor mobilization of sulfides has taken place during deformation phases D1 and D2.
This is mostly expressed as elongated sulfide mineral growth in the S1 and S2 direction
(Lawrie 1988). Major remobilization, recrystallization and upgrading of the Cu grade
have occurred during D3 as sulfides adjusted towards low strain zones. In minor F3
hinge zones, recrystallization has created lenticular massive chalcopyrite pods and
network mineralization. Similar features can be seen on the limbs of F3 folds where
sulfides form elongated pods and chalcopyrite occurs as fracture filling (Lawrie 1988).
5.7 Local stratigraphy
An interpretation of the local stratigraphy of the Virtasalmi mine was presented by
Lawrie (1988) based on field evidence from underground mapping, especially in the
Fig. 11. Network mineralization in diopside amphibolite. A) Full core sample, wet. B) Split core
sample, dry. Hole R28, depth 220.20 m. Photos by Geological Survey of Finland.

22
production areas under the open pit at levels 55, 140 and 335 meters below the surface.
An inferred and simplified stratigraphical column after Lawrie (1988) is illustrated in
Fig. 12.
The lowest stratigraphic unit, A, consists of relatively homogenous amphibolite with
strongly skarnified zones near the contact with the overlying unit B. The unit A skarn
zones are discordant with respect to the unit B banding and the sharp contact between A
and B. Unit A is generally barren, but some chalcopyrite dissemination is present near
the A-B contact. Unit B comprises hedenbergite-rich, banded amphibolites and skarn
layers, with the thickness of the banding and layering varying greatly from some
centimeters to some meters. Banding and layering are subparallel to the A-B contact.
Unit B is the main ore horizon as it contains a strong sulfide dissemination in its basal
part in addition to lenses of network mineralization. Unit C consists of interlayered
hornblende and diopside amphibolite and is generally free of sulfide mineralization. The
contact between units B and C is unconformable and crosscuts the banding and layering
of unit B and was used as a way-up indicator by Lawrie (1988). The two uppermost
stratigraphic units, D and E, are made of thinly banded amphibolites overlying
conformably unit C. Unit D is free of sulfide mineralization but does have some
skarnified networks, above which unit E contains weak sulfide mineralization in the
form of disseminated pyrrhotite.

23
5.8 Relative timing and genesis of the Virtasalmi mineralization
During the operation of the Virtasalmi mine, Hyvärinen (1969) suggested that the
mineralization was of a contact-pneumatolytic type and that it was likely to be late-
orogenic and connected to the emplacement of the diorite-quartz diorite intrusive suite.
However, Lawrie (1988) showed that the Virtasalmi area has a very complex tectonic
history, which is accompanied by several sets of intrusions with different ages and these
Fig. 12. Simplified and inferred local stratigraphy in the Virtasalmi mine area after Lawrie (1988).

24
intrusions, especially the diorites, postdate the amphibolites. The majority of the
intrusions do not show early S1 and S2 metamorphic fabrics, which are observed in the
amphibolites and to a lesser extent in the sulfides. Lawrie (1988) suggests that the
mineralization is of a volcanogenic exhalative type as evidenced by the locally
outcropping pillow lavas and lava tubes and the overall N-MORB affinity of the
amphibolites, which imply an oceanic and possible passive continental margin setting.
In addition, the basal unit A contains skarn stockworks formed at a high angle to S0,
and such features as banding of the amphibolites. Above these skarn stockworks, the
most abundant mineralization appears in basal parts of unit B where skarn layers are
subparallel to S0. There are also amphibolite suites where leaching has taken place and
suites where mobile elements, such as Ca and Cu, have elevated concentrations. Suite 1
amphibolites with low CaO and elevated Na2O and Si2O represent the rocks from which
leaching has extracted metals. The suite 3 amphibolites, common within the mine,
display elevated CaO values with high S and Cu and in turn represent rocks where
metasomatic fluids has caused alteration and precipitation of sulfides near or at the sea
floor (Lawrie 1988).
6. Methods and materials
6.1 Copper grade modeling
The data utilized in this thesis have been collected and created by the Geological Survey
of Finland (GTK) and Outokumpu Oy (OKU) during the exploration and operation of
the Virtasalmi mine, between 1964 and 1982. The historical data have since been
recovered from the national archive for the use in this thesis. The original data consist
of hand- and machine-typed core logs, hand-drawn technical mine plans and geological
profiles and maps. At least six geologists were responsible for the collection of the
original core log data during the exploration and operation of the mine. The core logs
were digitized by hand using Excel and converted to a geological database, which
includes collar, survey and assay files. The majority of the maps were georeferenced
and most relevant ones were redrawn in a digital form. These maps were used for
quality checking of the geological database and the mine plans were used to reconstruct
the original mine infrastructure. The assay file contains Cu analyses from a total of 239
drill holes, totaling 2995 individual analyses and ~4760 m meters of analyzed drill hole

25
core with an average sample length of 1.6 m (Tables 1, 2 and 3). Only copper and sulfur
values have been consistently reported in the original drill logs. Gold, silver and iron
contents have been only occasionally recorded and no whole-rock geochemical data
have been recorded. The drilling machinery has varied during the drilling years and the
drill core diameter has either been 21 or 32 mm. Original logs or technical reports
which are available are unspecific about which core diameter was used and for which
collars. Likewise, no reference to the method of Cu analysis was found in the Virtasalmi
mine
technical reports.
Table 1. Total collar summary.
Table 2. GTK collar summary.
Total drill holes 239
Total drill hole length 30582.13 m
Total samples collected 2995
Total sample length 4764.63 m
Average sample length 1.59 m
Average Cu grade 0.633 wt.%
Drill holes (surface) 83
Drill hole length 16475.51 m
Sample count 880
Total sample length 1947 m
Average sample length 2.21 m
Average Cu grade 0.707 wt.%
Operation years 1964-1966

26
Table 3. Outokumpu Oy collar summary.
Drill holes (underground) 156
Drill hole length 14106.62 m
Sample count 2115
Total sample length 2817.63 m
Average sample length 1.33 m
Average Cu grade 0.602%
Operation years 1973-1982
The original drill core logs were placed in a local coordinate grid, which was part of a
custom regional grid created by the GTK for regional exploration and mapping. In order
to facilitate the handling of the database with the GEOVIA Surpac 3D modeling
software, the local coordinate grid was converted to the EUREFIN coordinate system.
This was done using the Arc Map GIS software where collar maps containing surface
hole location data were first georeferred based on the remaining infrastructure. The full
database was input to ArcMap, mirrored and moved to its correct location by
georeferencing based on the surface collar map. The elevation data in collar file was
originally measured partly in a local system and partly in the national n43 system. The
collars whose elevation was recorded in this local system were converted and the whole
database was updated to the national n2000 elevation system. In addition, the surface
collars were snapped to a high resolution topographical LIDAR surface (Light Imaging,
Detection, And Ranging) provided by the GTK and the underground collars were
adjusted accordingly. Visual comparison between the collar file and reconstructed mine
infrastructure was used to quality check the elevation data conversion. In the assay file,
copper values which were either missing or had a zero value were set to 0.0001.
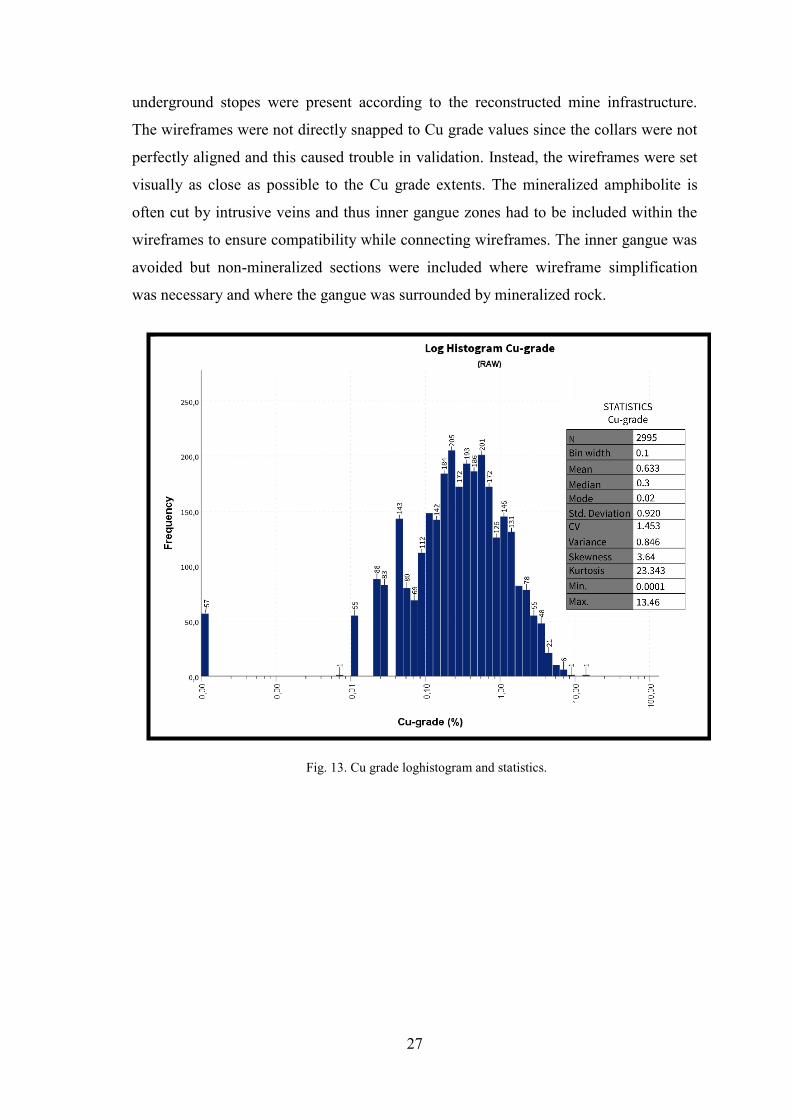
The cut-off grade of 0.2 wt.% Cu was chosen to display the general extent of the
mineralization. The raw data are very skewed towards the low Cu grades with ~38%
being 0.19 wt.% or less (Fig. 13). The mineralization was divided into 13 main crosscut
profiles and 1-3 supporting profiles between them (Fig. 14). The main crosscut profiles
are set according to the original drilling plan. The collar profiles have a 12.5-m distance
between each other in the vicinity of the open pit and 25-m dispersion SE of the open
pit. The additional crosscut profiles (drill core data) were used as support where
27
underground stopes were present according to the reconstructed mine infrastructure.
The wireframes were not directly snapped to Cu grade values since the collars were not
perfectly aligned and this caused trouble in validation. Instead, the wireframes were set
visually as close as possible to the Cu grade extents. The mineralized amphibolite is
often cut by intrusive veins and thus inner gangue zones had to be included within the
wireframes to ensure compatibility while connecting wireframes. The inner gangue was
avoided but non-mineralized sections were included where wireframe simplification
was necessary and where the gangue was surrounded by mineralized rock.
Fig. 13. Cu grade loghistogram and statistics.

28
The Cu mineralization solids were closed by copying and extruding the fringe
wireframes to a complete close using half of the distance of the crosscut profile distance
~6 m in this case. The original sampling has been selective and raw sample lengths vary
between ~10 cm and ~5 m (Fig. 15). The selective sampling has not caused a
considerable “nugget effect” even though there is some correlation between short
samples and higher Cu grade (Fig. 16).
Fig. 14. Crosscut profile plan and the location of the open pit and underground stopes. Primary
profiles in red and additional profiles in white.

29
6.2 Open pit, stope and mineralization solid tonnage estimation
In order to compare the mineralization model with historical records and quantify the
correctness of the model, tonnages were estimated for the open pit, underground stopes
and to the whole mineralization solid (Figs. 17 and 18). Significant errors were expected
Fig. 15. Sample length distribution of the raw data.
Fig. 16. Correlation between sample length and Cu grade.

30
to occur when calculating the total tonnage because the technical reports obtained for
this study did not state the methods used for production estimation at the Virtasalmi
mine. The only historical reference from Hyvärinen (1966) is a crude average density of
3.2 g/cm3, which was used during an early mineralization potential estimation by the
GTK.
To make the tonnage estimation more precise, drill core samples were collected from
typical mine site lithologies and the samples were analyzed for their physical properties
including density (Table 4). The sampled rock types included gabbro, diorite, non-
mineralized amphibolite, non-mineralized garnet skarn, amphibolite with disseminated
mineralization and network-mineralized garnet skarn. The densities of the above-
mentioned rock types were applied together or individually for tonnage and production
estimation.
The total excavated rock tonnage from the open pit was calculated by using the average
rock density of all drill core samples, since a large amount of waste rock had to be
quarried with the ore. For estimation of the excavated rock mass from the underground
stopes, an average density of mineralized rock was used to optimize for the lower
amount of waste rock (Table 4).
Ore production and mineralization potential tonnages were calculated by applying the
disseminated mineralization density for the “low-grade” zone and the network
mineralization density for the “high-grade” zone of the mineralization solids (Table 4).
Table 4. Rock densities from drill core samples.
Average rock density 3.226 g/cm3
Average mineralized rock density 3.5 g/cm3
Amphibolite (disseminated mineralization) 2.84 g/cm3
Garnet skarn (network mineralization) 4.175 g/cm3

31
Fig. 17. General extents of the mineralization with cut-off at 0.2 wt.% Cu and the mine infrastructure
including the open pit and underground stopes. A) Looking down. B) Looking north.

32
6.3 Coordinate grid and elevation system
During the exploration and operation of the Virtasalmi mine, all drill hole locations
were recorded in a local coordinate grid, which was established by the Geological
Survey of Finland in 1964. This local coordinate grid was set up at a 45-degree angle so
Fig. 18. A) Reconstructed mine infrastructure. Looking NE. B) Original profile from Outokumpu Oy
technical reports.

33
that in the Virtasalmi area, the coordinates grew towards NW and NE. Setting up a
custom coordinate grid is possible in the GEOVIA Surpac and Arcmap 10 softwares,
but to make the data set compatible with the GTK database, it was converted to the
EUREFIN coordinate system. A mathematical approach was initially attempted but this
proved to be a confusing method and ultimately resulted in erroneous coordinate
conversion. A far better result was achieved by loading the raw collar location data to
Arcmap 10, mirroring the dataset to match the x-y axes of modern maps and moving
and rotating the dataset to its correct location and orientation by georeferencing
according to original, georeferred collar maps. Twenty collars were moved by hand to
their correct locations and an algorithm moved the rest of the collars accordingly. The
distance between two collars in a profile changed less than a meter (10–70 cm).
Comparison between the fixed collar positions and original, hand drawn, georeferred
maps showed a maximum of ±2-meter error.
During the exploration, the Geological Survey of Finland recorded the elevation data (Z
coordinate) directly in the old national N43 system. Afterwards, during the operation of
the mine, Outokumpu Oy recorded the collar elevations and planned the mine
operations in their own local Z coordinate grid. The Z0 of this local grid was placed at
the height of 150 (N43). To make the dataset work better with modern softwares, the
local Z coordinates were converted, first to the old N43 system and then to the modern
national N2000 system, which accommodates for postglacial lift around the area.
Furthermore, a high precision LIDAR topographic surface, provided by the GTK, was
compared with the corrected collar locations. Most of the original collar positions were
situated underneath the LIDAR surface with an average displacement of 1.7 m. Collars
were above the topographic surface only around the Hällinmäki hill, which has since
been mined flat. The surface collars (R collars) were tied to the LIDAR surface and the
underground collars were adjusted accordingly with +1.7 m displacement to unify the
elevation dataset. Therefore, the full conversion from local Z coordinate grid to the
modern N2000 elevation system with additional correction according to the LIDAR
surface and glacial uplift is as follows:
ZN2000 = (150 - Zlocal_grid) + 0.34 + 1.7 (1)
where 150 is the Z0 in the old national N43 system, 0.34 is the correction for glacial
uplift and 1.7 is the average correction according to the LIDAR data.

34
7. Results
7.1 Collar and mineralization distribution and general extents
The diamond drill holes are distributed roughly in two different sets according to the
data from collar and survey files. The “R collars” were drilled by the Geological Survey
of Finland (GTK) during exploration. They originate from the surface and were drilled
roughly towards SW, perpendicular to the general strike of the mineralization. The
“HM-collars” were drilled by Outokumpu Oy during the operation of the mine. They
originate from underground tunnels and have been usually drilled in a fan shape towards
various directions. The selective sampling method implemented by the GTK and
Outokumpu Oy is seen in the data from assay files. The sample length ranges from
some tens of centimeters to several meters (Figs. 15 and 19).
By connecting wireframes drawn with cut-off grade of 0.2 wt.% copper on multiple
crosscut profiles, three main mineralization bodies can be distinguished (Fig. 20).
Together they have a total strike length of ~626 m (NW – SE) and the maximum depth
of mineralization is ~344 m (mineralization bodies A and C). All three bodies form out
of one or more mineralization lenses which dip steeply towards NE (Fig. 21). The
mineralization is most abundant near surface at mineralization body A where the
mineralization is at its widest (Fig. 20). The body A, and the other mineralization
bodies, become progressively thinner at depth. Below 250 m (sea level) the
mineralization occurs as small lenses under the body A. These small pods also exist
under the mineralization B, but at a shallower depth (Figs. 20 and 21).

35
Fig. 19. Collar and Cu grade distribution. A) From above. B) Looking north.

36
Fig. 20. Distribution of mineralization, cut-off at 0.2 wt.% Cu. A) From above. B) Looking north.
Mineralization coloring according to original division: A (brown), B (red) and C (green).

37
Fig. 21. Distribution of mineralization. A) View towards NW ( 310°/00. B) View towards SE
(130°/00).

38
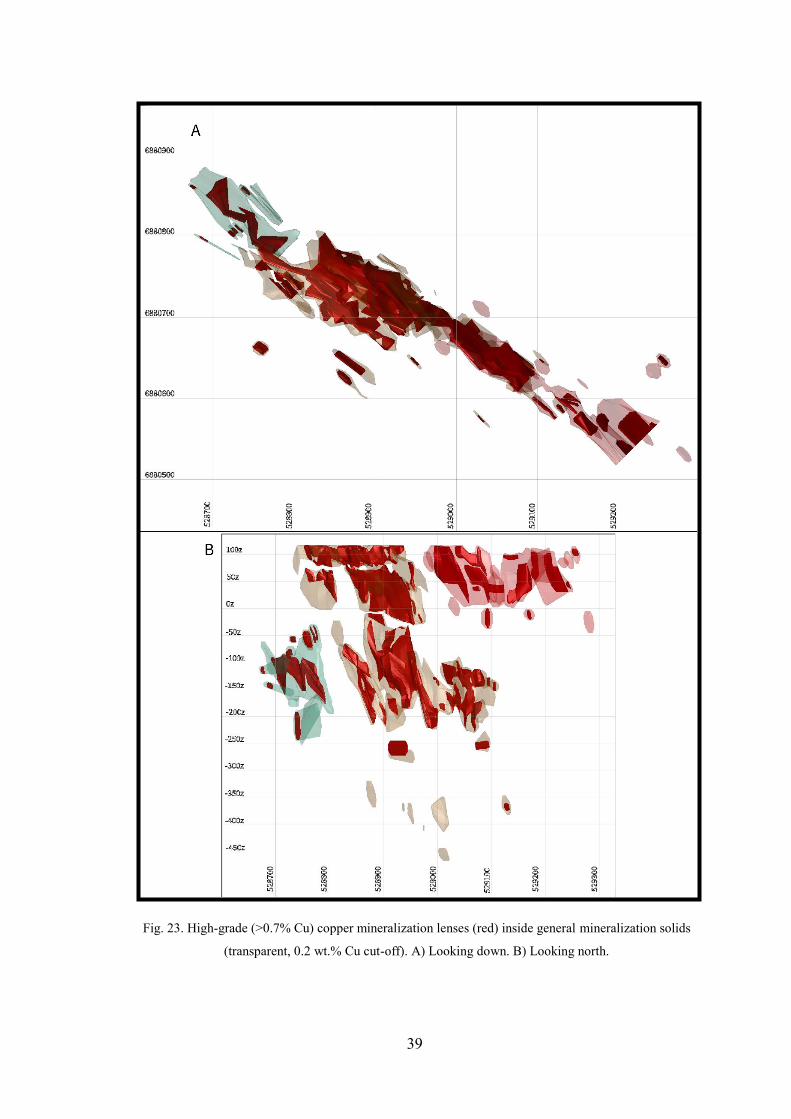
7.2 Distribution of high-grade mineralization
High-grade (<0.7 wt.% Cu) zones are distributed in relatively thin lenses and are
generally surrounded by disseminated mineralization (Fig. 23). The thickness of the
lenses is 1–3 meters but occasionally they can be 7–8 meters thick. The strike length of
an individual lens varies greatly, being from less than 10 meters to more than 100
meters at best. High-grade mineralization is most abundant in the mineralization body A
(Fig. 20) in the open pit and under it in the A1–A3 underground stopes (Fig. 18), but
generally some high-grade sheets are associated with nearly all mineralization lenses.
The high-grade zones are usually connected to garnet skarns or occur in their immediate
proximity. Some remobilization has taken place and intrusive diorites are occasionally
highly mineralized next to garnet skarn units (Fig. 22).
Fig. 22. Crosscut section through the open pit (CC9 in Fig. 12). High copper grades are generally
connected to the vicinity of garnet skarns.
39
Fig. 23. High-grade (>0.7% Cu) copper mineralization lenses (red) inside general mineralization solids
(transparent, 0.2 wt.% Cu cut-off). A) Looking down. B) Looking north.

40
7.3 Resource estimation
In the present study, a crude pre-mining mineralization estimate, including all
mineralization lenses, was calculated for the model using a general cut-off of 0.2 wt.%
Cu for low grade mineralization and >0.7 wt.% Cu for high-grade network mineralized
zones. Disseminated and network mineralization lenses were calculated with separate
densities to increase accuracy (Table 4). The results indicate that the Virtasalmi mine
area contained ~4.83 Mt of copper-mineralized rock. Using 0.5 wt.% Cu as the low-
grade cut-off value and >0.8 wt.% Cu as the high-grade cut-off value, Hyvärinen (1966)
estimated previously that the Virtasalmi mine area contained ~2 Mt of ore. Taking into
consideration the open pit and underground production (Table 5), it can be shown that
some 1.2 Mt of Cu-disseminated rock was left unmined. Approximately 650 000 tons of
mineralized rock occur near the edges of the production pit and galleries and ~570 000
Fig. 24. Remaining mineralization solids after the production from the open pit and underground galleris
has been subtracted. Brown solids are near the edges of the quarry and stopes. Blue solids are clearly
outside the production areas. Looking north.

41
tons of mineralized rock is located clearly outside the production infrastructure. Outside
the production areas of the mine, the mineralization is contained in unevenly distributed
and variably sized lenses. These lenses are located on the extreme sides or underneath
the main mineralization (Fig. 24).
8. Discussion
8.1 Coordinate and elevation system conversion
Even though the modeling and mapping software can be tweaked to work with custom
coordinate grids and elevation systems, it was necessary to convert the collar database
into the EUREFIN and N2000 systems so that the data can be added to the national
GTK database. Conversion also causes further work and makes updates to the model
easier since working with a custom grid makes mixing different data sources
cumbersome. Especially, adding new, high-precision measurements would be difficult,
if not impossible, without conversion, which would degrade the quality of the data.
Especially the coordinate system conversion proved to be very effective and accurate
and could easily be implemented to a far larger dataset. A larger potential for errors is in
the height data of the collar positions, which is caused partly by the original data being
recorded in two different height systems and partly because the elevation data of the
collars were eventually defaulted to a high-precision LIDAR topo-surface. This method
leaves some uncertainty to the elevation position of the collars because of the LIDAR
correction was applied in bulk and the underground collars had no reference point into
which they could be tied to. Still the potential error is only up to ±2 meters and visual
comparison between the reconstructed mine infrastructure and underground collar
positions correlate well within the error limit.
8.2 Model validation
To test the accuracy of the model, tonnage estimation of the modeled mineralization
bodies and the production stopes were calculated, and the results were compared with
historical data obtained from unpublished Outokumpu Oy technical reports and third-
party publications.

42
Comparison with the historical data shows good correlation between unified ore and
waste production and would imply that the modeled open pit and production stopes are
accurate (Table 6). However, the “true” ore production, especially from the
underground stopes, initially lacked roughly 1 Mt of mineralized rock. The underground
stope sizes had to be increased by 1.5 meters to accommodate more mineralized rock
inside the stope solids and to make the modeled ore production fit better with the
historical data (Table 6). Further stope optimization and more precise density data
would likely account for the missing 0.3–0.46 Mt of estimated production.
It is a positive sign that the digitized mine has less production than its historical
equivalent. Where drill core data were lacking, unoptimized underground stope solids
were used as a guide for the mineralization shape and even though the stope-solids are,
to a degree, too small, it has not affected the dimension of the overall mineralization. A
substantial error source could have been the old hand-drawn mine maps, which were
used for the digitalization and modeling of the production stopes. Errors in stope sizes
could have occurred during the drawing of the original maps, during the digitalization
process or during both simply by human error. The latest map with the drawing year
stated is from 1971 but most of the underground level maps lack clear dates.
Furthermore, there is no clear indication in the maps whether they are plans or actual
representations of the finished stopes.
Table 5. Total volumes of Cu mineralization solids, open pit and underground galleries.
Volume
(m3)
High-grade mineralization zone 314521
Low-grade mineralization zone 1237921
Open pit 505521
Underground galleries 974524
Optimized underground galleries 1285331

43
Table 6. Historical and modeled production estimates.
Reported
(Mt)
Modeled
(Mt)
Diff.
(Mt)
Open pit and underground stopes (ore
and waste)
5.39 (OKU report) 5.04 0.35
Total mine production (ore) 4.3 (OKU report) 3.85 0.45
Total mine production (ore) 4.18 (Puustinen 2003) 3.85 0.33
Total mineralization estimation ~2 (Hyvärinen 1966) 4.83 2.83
8.3 Resource estimation
The overall mineralization estimation, which is presented in this study, of ~4.83 Mt
copper (table 5), is a crude and unofficial estimation based only on historical data. Still
it correlates well with the presently modeled and historically reported ore production of
the Virtasalmi mine and additionally, is well over the initial ~2 Mt of ore estimated by
Hyvärinen (1966). With a modeled total production of 3.85 Mt of ore, it means that
estimated 1.2 Mt of mineralized material would have be left unmined after the closure
of the Virtasalmi mine. However, this number is likely erroneous. Most of the ~650 000
tonnes of mineralized material near the underground stope edges (Fig. 24) could likely
be removed by stope optimization. Assuming that the mine operators had more drill
information at their disposal than in this study, it is unlikely that this amount of
potential ore would have been left behind so close to the existing infrastructure. The
mineralized material away from production areas which was left unmined accounts to
roughly half a million tonnes of ore material and is scattered into lenses around the main
mineralization. Most of the lenses are very small, far apart and would have been
unfeasible to mine out. The estimated ~570 000 tonnes of mineralization in these
separated lenses is likewise, prone to error since most of the lenses outside the main
mineralization are based only on one or two drill core intersections (Figs. 20 and 21).
While some of the intersections contain notable Cu grades associated with skarnified
rocks, the size of these lenses could be anything from some meters to several tens of
meters. Further drilling and modeling would be needed to ascertain the true amount of
mineralized rock away from the production areas.
44
8.4 Comparison of the Virtasalmi mineralization with other similar
deposits
In addition to the Cu sulfide-dominated mode of mineralization, the Virtasalmi deposit
shares some features with some other Cu-rich VMS deposits, which range greatly in
their age of formation (Corbett 2001, Appel 1997, Schiffman et al. 1987, Skirrow
1982). The disseminated VMS mineralization in the Isua area in western Greenland is,
like the Virtasalmi deposit, hosted by banded tuffaceous amphibolites. In addition, the
disseminated Cu mineralization at Isua occurs spatially close to iron formations which
are possibly genetically connected with the disseminated sulfides (Appel 1997). This is
also the case at Virtasalmi where Lawrie (1988) reported magnetite overtaking Cu
sulfides distal to the main ore zones and hinted towards a genetic link.
The Troodos ophiolite in Cyprus hosts a Cu-dominated VMS deposit, which has been
shown to have formed distal to a major spreading center. This deposit contains granular
epidote-rich rocks underneath the feeder zone of the VMS system. A passive continental
margin, a tectonic setting likely situated away from major spreading centers, was
suggested by Lawrie (1992). Also, the “epidosites” identified in the Troodos deposit
could be a lower metamorphic grade equivalents of the massive garnet rocks found at
Virtasalmi (Lawrie 1988). The Mt. Lyell mining district in Tasmania hosts several VMS
deposits, some of which include traditional massive VMS mounds. A few deposits at
Mt. Lyell consist of Cu sulfide-dominated dissemination and veining. Corbett (2001)
suggests that the Cu-disseminated areas used to have massive sulfide mounds
stratigraphically above them, but later erosion has destroyed the deposits. The situation
could be similar at Virtasalmi where chalcopyrite dominates the mineralization and the
system lacks clear massive sulfide lenses (Lawrie 1988).
8.5 Further research
It could be beneficial to structurally relog some or all of the remaining drill cores from
the Virtasalmi mine. Structural observations made from the drill cores during
exploration and operation of the mine have been sparse and while these data were
digitized for this thesis, the amount of the data points is far too small to be useful in 3D
analysis. Shear zones with a “large” but uncertain amount of movement have been

45
recorded in the mine area (Hyvärinen 1966, Lawrie 1988), Better structural information
could be a key in finding deeper parts of the mineralization.
Whole-rock geochemistry from the Virtasalmi rocks has not been obtained or, if
existent, the data are missing. Re-analysis of the remaining drill cores could provide
further information about the alteration halos proximal and distal to the high-grade
garnet skarn zones. Deeper understanding on how the alteration envelopes behave near
the mineralization would be very useful if further drilling underneath or near the
Virtasalmi mineralization is to be conducted.
Based on unpublished Outokumpu Oy records, the mine was commonly struggling to
meet production goals and suffered from over-estimation of ore grades. Re-analysis for
copper should be conducted on old drill cores and comparison to the historical data
conducted to pin-point possible errors in the historical dataset. Additionally, the drill
core dataset has not yet been analyzed for gold even though gold is a common element
in VMS systems and one of the first exploration holes (R3) showed weak indications of
gold and silver, but the contemporary workers did not identify the Virtasalmi deposit as
an example of VMS mineralization.
9. Conclusions
1. According to the model developed in this work, there was ~4.83 Mt of copper ore in
the Virtasalmi mine area before the mining operations were started. After the production
ceased, roughly 500 000 tons of ore is estimated to have remained unmined.
2. High-grade and low-grade mineralization is most abundant near the surface in the
mineralization lens A. With depth, the mineralized lenses become thinner and
eventually break into small singular lenses under the main mineralization lenses.
3. Lenses with high copper grades are associated with the proximity of garnet skarns.
4. Despite the shortcomings of the historical data and the human factor in drawing and
digitalization, the modeled mine infrastructure can be regarded as a good representation
of the real life mine at Virtasalmi. The unoptimized underground stopes provide a
relatively accurate starting point for further stope optimization if more historical
reference material should become available.

46
Acknowledgements
I would like to thank the Geological Survey of Finland for providing me access to the
historical data used and presented in this study and University of Oulu for providing
access to the software needed for data manipulation. I would like to thank Janne Hokka
from GTK for his invaluable guidance on the subject, principles of 3D-modeling and for
the opportunity to see some rocks from the Virtasalmi mine. Sincere thanks to Marko
Moilanen for helping me in getting started with SURPAC and for helpful tips on the
thesis, to Holger Paulick for review and suggestions on corrections and for Prof. Eero
Hanski for helping me to cross the finish line. Also, I must express my warmest
gratitude towards the good people of honorofboys.club for company during many a long
nights of work. Finally, thousands of thanks to my wife Anne for sharing her thoughts
on the subject and for infinite support and encouragement during the thesis project.
References
Appel, P. 1979. Stratabound copper sulfides in a banded iron-formation and in basaltic
tuffs in the early Precambrian Isua supracrustal belt, West Greenland. Economic
Geology 74, 45-52.
Arndt, N.T., Briigmann, G.E., Lehnert, K., Chauvel, C., Chappell, B.W. 1987. In: T.C.
Pharaoh, R.D. Beckinsale and D. Rickard (Eds.) Geochemistry and Mineralization of
the Proterozoic Volcanic Suites. Geological Society, Special Publication 33, 133-145.
Barager, W.R., Scoates, R.F.J. 1987. Volcanic geochemistry of the northern segments
of the Circum-Superior Belt of the Canadian Shield. In: T.C. Pharaoh, R.D. Beckinsale
and D. Rickard (Eds.) Geochemistry and Mineralization of the Proterozoic Volcanic
Suites. Geological Society, Special Publication 33, 113-131.
Bonnet, A.-L., Corriveau, L. 2007. Alteration vectors to metamorphosed hydrothermal
systems in gneissic terranes. In: Goodfellow, W.D. (Ed.) Mineral deposits of Canada -
A synthesis of major deposit-types, district metallogeny, the evolution of geological
provinces, and exploration methods. Geological Association of Canada, Mineral
Deposits Division, Special Publication 5, 1035–1049.
Bradley, D.C. 2011. Secular trends in the geologic record and the supercontinent cycle.
Earth-Science Reviews 108, 16-33.

47
Cawood, P.A., Hawkesworth C.J. 2013. Temporal relations between mineral deposits
and global tectonic cycles. Geological Society of London, Special Publications 393, 9-
21.
Corbett, K.D. 2001. The geology of The Mount Lyell mines area, Tasmania – a re-
interpretation based on studies at Lyell Comstock, North Lyell and The Iron Blow area.
Master’s thesis, University of Tasmania, department of earth sciences. 116 p. Retrieved
from: https://eprints.utas.edu.au/19127/
Galley, A.G., Hannington, M.D., Jonasson, I.R. 2007. Volcanogenic massive sulfide
deposits. In: W.D. Goodfellow (Ed.) Mineral Deposits of Canada: A Synthesis of Major
Deposit-Types, District Metallogeny, the Evolution of Geological Provinces, and
Exploration Methods. Geological Association of Canada, Special publication 5, 141-
161.
Groves, D.I., Vielreicher, R.M., Goldfarb, R.J., Condie, K.C. 2005. Controls on the
heterogeneous distribution of mineral deposits through time. Geological Society of
London, Special Publications 248, 71-101.
Hannington, M.D., Galley, A.G., Herzig, P.M., Petersen, S. 1998. Comparison of the
TAG mound and stockwork complex with Cyprus-type massive sulfide deposits;
Proceedings of the Ocean Drilling Program. Scientific Results 158, College Station, TX,
389-415.
Hanski, E. 2015. Synthesis of the geological evolution and metallogeny of Finland. In:
Maier, W.D., Lahtinen, R., O'Brien H. (Eds.) Mineral deposits of Finland, Elsevier,
Amsterdam, p. 507-530.
Herzig, P.M., Hannington, M.D. 1995. Polymetallic massive sulfides at the modern
seafloor: A review. Ore Geology Reviews 10, 95-115.
Hokka, J., Virnes, L. 2017. Lithogeochemical pXRF study on the Virtasalmi Cu deposit,
Eastern Finland. Manuscript submitted for publication.
Huhma, H. 1986. Sm-Nd, U-Pb and Pb-Pb isotopic evidence for the origin of the Early
Proterozoic Svecokarelian crust in Finland. Geological Survey of Finland, Bulletin 337,
48 p.

48
Humphris, S.E. and 24 others 1995b. The internal structure of an active seafloor
massive sulfide deposit. Nature 377, 713-716.
Huston, D.L., Brauhart, C.W., Drieberg, S.L., Davidson, G.J., Groves, D.I. 2001. Metal
leaching and inorganic sulfate reduction in volcanic-hosted massive sulfide mineral
systems: Evidence from the paleo-Archean Panorama district, Western Australia.
Geology 29, 687-690.
Huston, D.L., Large, R.R. 1989. A chemical model for the concentration of gold in
volcanogenic massive sulfide deposits. Ore Geology Reviews 4, 171-200.
Huston, D.L., Pehrsson, S., Eglington, B.M., Zaw, K. 2010. The geology and
metallogeny of volcanic-hosted massive sulfide deposits: variations through geologic
time and with tectonic setting. Economic Geology 105, 571-591.
Hyvärinen, L. 1966. Karsikummun kupariesiintymän geologiasta. Geological Survey of
Finland. Unpublished report M17/Vrs-/66/1 (in Finnish).
Hyvärinen, L. 1969. On the geology of the copper ore field in the Virtasalmi area,
eastern Finland. Geological survey of Finland, Bulletin 240, 87 p.
Hölttä, P. 1995. Contact metamorphism of the Vaaraslahti pyroxene granitoid intrusion
in Pielavesi, central Finland. In: P. Hölttä (Ed.) Relationship of granitoids, structures
and metamorphism at the eastern margin of the Central Finland Granitoid Complex.
Geological Survey of Finland. Bulletin 382, 27-79.
Hölttä, P. 1988. Metamorphic zones and the evolution of granulite grade metamorphism
in the early Proterozoic Pielavesi area, central Finland. Geological Survey of Finland.
Bulletin 344, 1-50.
Jansson, N., Hermansson, T., Fjellerad Persson, M., Berglund, A., Kruuna, A., Skyttä,
P., Bachmann, K., Gutzmer, J., Chmielowski, R.M., Weihed, P. 2013. Recent advances
in structural geology, lithogeochemistry and exploration for VHMS deposits,
Kristineberg area, Skellefte District, Sweden. In: 12th Biennial SGA Meeting: Mineral
deposit research for a high-tech world. Uppsala, Sweden 12/08/2013-15/08/2013, 545-
548.
Kerrich, R., Goldfarb, R.J., Richards J. 2005. Metallogenic provinces in an evolving
geodynamic framework. Economic Geology 100th Anniversary Volume, 1097-1136.

49
Kontinen, A., Peltonen, P., Huhma, H. 2006. Description and genetic modelling of the
Outokumpu-type rock assemblage and associated sulfide deposits. GTK report M
10.4/2006/1.
Korsman, K., Koistinen, T., Kohonen, J., Wennerström, M., Ekdahl, E., Honkamo, M.,
Idman, H., Pekkala, Y. (Eds.) 1997. Bedrock map of Finland 1:1 000 000. Espoo.
Geological Survey of Finland.
Korsman, K., Korja, T., Pajunen, M., Virransalo, P., and GGT/SVEKA Working Group.
1999. The GGT/SVEKA Transect: Structure and Evolution of the Continental Crust in
the Paleoproterozoic Svecofennian Orogen in Finland. International Geology Review
41, 287-333.
Koski, R.A., Mosier, D.L. 2012. Deposit type and associated commodities in
volcanogenic massive sulfide occurrence model. U.S. Geological Survey Scientific
Investigations. Report 2010–5070 –C. Chap. 2. pp. 8.
Kousa, J., Marttila, E., Vaasjoki, M. 1994. Petrology, geochemistry and dating of Paleo
proterozoic metavolcanic rocks in the Pyhäjärvi area, central Finland. In: M. Nironen,
Y. Kähkönen (Eds.) Geochemistry of Proterozoic supracrustal rocks in Finland.
Geological Survey of Finland, Special Paper 19, 7-27.
Kähkönen, Y. 2005. Svecofennian supracrustal rocks. In: M. Lehtinen, P.A. Nurmi and
O.T. Rämö (Eds.) Precambrian Geology of Finland – Key to the Evolution of the
Fennoscandian Shield. Elsevier, Amsterdam, p. 343 – 406.
Kärki, A., Laajoki, K. 1995. An interlinked system of fold and ductile shear zones – late
stage Svecokarelian deformation in the central Fennoscandian Shield, Finland. Journal
of Structural Geology 17 (9), 1233 – 1247.
Lawrie, K.C. 1992. Geochemical characterisation of a polyphase, deformed, altered and
high grade metamorphosed volcanic terrane: implications for the tectonic setting of the
Svecofennides, south-central Finland. Precamprian Research 59, 171 – 205.
Lawrie, K.C. 1988. The origin, nature and tectonic significance of the Hällinmäki
copper deposit, south-central Finland. Unpub. PhD thesis. Glasgow University.
Lewry, J.F., Macdonald, R., Livesy, C., Meyer, M., Van Schmus, R., Bickford, M.E.
1987. U-Pb geochronology of accreted terranes in the Trans-Hudson Orogen, Northern

50
Saskatchewan, Canada. In: T.C. Pharaoh, R.D. Beckinsale and D. Rickard (Eds.)
Geochemistry and Mineralization of the ProterozoicVolcanic Suites. Geological
Society. Special Publication 33, 147-166.
Li, X., Yuan, F., Zhang, M., Jia, C., Jowitt, S., Ord, A., Zheng, T., Hu, X., Li, Y. 2015.
Three-dimensional mineral prospectivity modelling for targeting of concealed
mineralizations within the Zhonggu iron orefield, Ningwu Basin, China. Ore Geology
Reviews 71, 633-654.
Lydon, J.W. 1988. Ore deposit models #14. Volcanogenic massive sulfide deposits Part
2: Genetic models. Geoscience Canada 15 (1), 43-65.
Martin, L., Perron, G., Masson, M. 2007. Discovery from 3D Visualization and
Quantitative Modelling. In B. Milkereit (Ed.) Proceedings of Exploration 07: Fifth
Decennial International Conference on Mineral Exploration, 543-550.
Nironen, M. 1989. Emplacement and structural setting of granitoids in the early
proterozoic Tampere and Savo schist belts, Finland - Implications for contrasting crustal
evolution. Geological Survey of Finland, Bulletin 346, 83 p.
Pekkarinen, L. 2002. Haukivuoren ja Pieksämäen kartta-alueiden kallioperä. Summary:
Pre-Quaternary rocks of the Haukivuori and Pieksämäki map-sheet areas.
Kallioperäkartan selitys 1:100 000 - Expl. to Maps of Pre-Quat. Rocks, sheets 3231 and
3232. Geological survey of Finland, 98 p.
Peltonen, P., Kontinen, A., Huhma, H., Kuronen, U., 2008. Outokumpu revisited: New
mineral deposit model for the mantle peridotite-associated Cu-Co-Zn-Ni-Ag-Au
sulphide deposits. Ore Geology Reviews 33, 559–617.
Perkins, C., Walshe, J.L. 1993. Geochronology of the Mount Read Volcanics,
Tasmania, Australia. Economic Geology 88, 1176-1197.
Peter, J.M., Scott, S.D. 1988. Mineralogy, composition, and fluid-inclusion
microthermometry of seafloor hydrothermal deposits in the southern trough of Guaymas
Basin, Gulf of California. Canadian Mineralogist 26, 567-587.
Pisutha-Arnond, V., Ohmoto, H. 1983. Thermal history and chemical and isotopic
compositions of ore-forming fluids responsible for kuroko massive sulfide deposits in
the Hokoruku district of Japan. Economic Geology Monograph 5, 523-558.

51
Puustinen, K. 2003. Suomen kaivosteollisuus ja mineraalisten raaka-aineiden tuotanto
vuosina 1530–2001, historiallinen katsaus erityisesti tuotantolukujen valossa.
Geological Survey of Finland. M10.1/2003/3 (in Finnish).
Raymond, O.L. 1996. Pyrite composition and ore genesis in the Prince Lyell copper
deposit, Mt Lyell mineral field, western Tasmania, Australia. Ore Geology Reviews 10,
231-250.
Reinikainen, J. 2001. Petrogenesis of Paleoproterozoic marbles in the Svecofennian
Domain, Finland. Geological Survey of Finland, Report of Investigation 154, 84 p.
Rona, P.A. 1980. TAG hydrothermal field: Mid-Atlantic Ridge crest at latitude 268N. J.
Geological Society of London 137, 385-402.
Rona, P.A. 1984. Hydrothermal mineralization at sea floor spreading centers. Earth-
Science Reviews 20, 1-104.
Shanks III, P.W.C., Koski, R.A. 2012. Volcanogenic massive sulfide occurrence model
U.S. Geological Survey Scientific Investigations Report 2010–5070–C. chap. 1. p. 4.
Shirozu, H. 1974. Clay minerals in altered wall rocks of the kuroko-type deposits.
Mining Geology Special Issue 6, 303-311.
Skirrow, R. 1982. Origin of sulphur and geothermometry of hydrothermal sulfides from
the Galapagos Rift, 86 °W. Nature 299, 142-144.
Solomon, M. 1976. "Volcanic" massive sulfide deposits and their host rocks - a review
and explanation. In: Wolf K. (Ed.). Handbook of Stratabound and Stratiform Ore
Deposits. Elsevier, Amsterdam, p. 21-54.
Thompson, G., Humphris, S.E., Schroeder, B., Sulanowska, M., Rona, P.A. 1988.
Active vents and massive sulfides at 268N (TAG) and 238N (Snakepit) on the Mid-
Atlantic-Ridge. Canadian Mineralogist 26, 697-711.
Vaasjoki, M., Sakko, M. 1988. The U-Pb mineral chronology of the Raahe-Ladoga
zone. In: Pajunen, M. (Ed.) Project No. 235 “Metamorphism and geodynamics”
excursion in Finland 15.6.-19.6.1988. Geological Survey of Finland, Guide 21, 23-24.
Van Kranendonk, M.J., Hickman, A.H., Smithies, R.H., Williams, I.R., Bagas, L.,
Farrell, T.R. 2006a. Revised lithostratigraphy of Archean supracrustal and intrusive

52
rocks in the northern Pilbara Craton, Western Australia. Western Australia Geological
Survey Record 2006/15. 57 p.
Väisänen, M., Mänttäri, I., Kriegsman, L.M., Hölttä, P. 2000. Tectonic setting of post-
collisional magmatism in the Palaeoproterozoic Svecofennian Orogen, SW Finland.
Lithos 54 (1-2), 63-81.
Walshe, J.L., Solomon, M. 1981. An investigation into the environment of formation of
the volcanic-hosted Mt Lyell copper deposits using geology, mineralogy, stable isotopes
and a six-component chlorite solid solution model. Economic Geology 76, 246-284.
Yang, F., Wang, G., Santosh, M., Li, R., Tang, L., Cao, H., Guo, N., Liu, C. 2017.
Delineation of potential exploration targets based on 3D geological modelling: A case
study from the Laoangou Pb-Zn-Ag polymetallic ore deposit, China. Ore Geology
Reviews 89, 228-252.
Yang, K., Scott, S.D. 1996. Possible contribution of a metal-rich magmatic fluid to a
seafloor hydrothermal system. Nature 383, 420-423.

Appendix: Drill hole information
Hole ID Easting Northing Collar Depth Collar azimuth Collar dip LENGTH YEAR
(EUREFIN) Meters Degrees Degrees Meters
HM1 528832 6880768 101.8 270 -46 35.3
HM2 528843 6880761 102.3 270 -31 35.3
HM3 528852 6880752 102.2 270 -42 36.2
HM4 528871 6880736 103.0 270 -31 45.1
HM5 528881 6880728 103.0 270 -35 45.1
HM6 528904 6880714 105.5 270 -35 46.5
HM7 528914 6880707 106.6 270 -40 45.3
HM8 528924 6880699 108.0 270 -41 45.3
HM9 528811 6880748 112.6 270 -19 43.4
HM10 528854 6880720 112.0 90 -19 23.7
HM11 528891 6880685 111.4 270 -37 13.4
HM12 528898 6880676 111.0 270 -42 13.4
HM13 528914 6880673 111.5 270 -35 20.0
HM14 528877 6880741 102.4 270 -55 28.4
HM15 528887 6880733 103.2 270 -54 29.4
HM19 529135 6880539 42.9 45 -27 50.6
HM20 529136 6880539 42.8 136 -27 62.0
HM21 529135 6880540 42.8 17 -18 63.5
HM31 528848 6880728 -13.5 45 -33 51.6 1973
HM32 528846 6880726 -14.8 225 -45 55.6 1973
HM33 528900 6880695 -37.8 45 0 45.7 1973
HM36 528810 6880713 -46.1 225 -10 86.1 1973
HM37 528810 6880713 -46.7 45 -42 120.3 1973
HM40 528808 6880746 -65.9 45 21 32.5 1974
HM41 528808 6880746 -67.3 45 -30 70.2 1974
HM42 528851 6880732 -69.0 45 18 48.3 1974
HM43 528899 6880694 -75.6 45 -16 45.5 1974
HM44 528886 6880714 -73.8 45 0 40.3
HM45 528886 6880714 -74.7 45 -53 111.0 1974
HM46 528899 6880694 -76.3 45 -58 125.3 1974
HM47 528915 6880675 -79.2 45 -43 80.6 1974
HM48 528948 6880637 -84.3 45 -19 91.1 1974
HM49 528948 6880637 -84.6 45 -36 115.1 1974
HM50 528981 6880599 -90.0 45 -34 114.7 1974
HM51 528932 6880656 -81.7 45 -25 65.2 1974
HM52 528965 6880618 -87.3 45 -46 126.1 1974
HM53 528932 6880656 -82.0 45 -50 118.1 1974
HM54 529010 6880592 -94.3 45 -44 123.0 1974
HM55 528946 6880703 -1.1 45 0 41.0 1974
HM56 529010 6880592 -93.9 45 -26 90.3
HM57 529035 6880581 -95.5 45 -48 135.5 1975

Hole ID Easting Northing Collar Depth Collar azimuth Collar dip LENGTH YEAR
(EUREFIN) Meters Degrees Degrees Meters
HM58 529035 6880581 -95.2 45 -20 85.6 1975
HM59 529248 6880498 24.1 45 -54 139.7 1976
HM60 528932 6880656 -79.4 45 45 120.1 1975
HM61 529248 6880498 24.1 45 -73 174.3 1975
HM62 529179 6880524 15.8 45 -45 140.6 1976
HM63 529250 6880496 24.2 80 -40 131.7 1975
HM64 529009 6880592 -94.4 45 -70 181.5
HM65 529009 6880592 -94.4 45 -62 160.3 1975
HM66 528851 6880731 -114.3 45 -15 85.3 1975
HM67 528834 6880735 -117.1 45 -35 89.5 1976
HM68 528762 6880771 -129.9 45 0 65.7 1976
HM69 528775 6880750 -126.6 45 -37 85.6 1976
HM70 528805 6880743 -121.1 45 -16 96.6 1976
HM71 528754 6880780 -130.7 354 0 70.3 1976
HM72 528762 6880771 -130.9 45 -48 94.0 1976
HM73 528762 6880771 -128.4 45 45 47.5 1976
HM74 528710 6880759 -128.6 1 0 106.8 1976
HM75 528711 6880758 -127.7 45 30 83.8 1976
HM76 528711 6880758 -129.0 45 -23 120.6 1976
HM77 528762 6880771 -130.2 45 -27 52.1 1976
HM78 528750 6880763 -58.1 45 0 45.8 1976
HM79 528749 6880764 -58.1 358 0 59.1 1976
HM80 528750 6880763 -56.9 45 42 40.1 1976
HM81 528750 6880763 -59.0 45 -32 45.6 1976
HM82 528883 6880713 -149.6 45 28 65.6 1976
HM159 529172 6880709 -216.1 263 -61 328.4 1982
HM158 529171 6880707 -216.1 199 -52 249.3 1982
HM157 529171 6880707 -216.1 198 -23 177.5 1982
HM156 529172 6880709 -216.2 231 -55 281.5 1982
HM155 528982 6880635 -211.4 45 -60 151.9 1982
HM154 528950 6880639 64.7 45 -27 101.1 1982
HM153 529061 6880640 -218.2 225 -76 140.2 1982
HM152 528770 6880666 -191.4 253 -49 348.6 1981
HM151 528764 6880670 -191.1 50 -48 349.2 1981
HM150 528767 6880665 -191.3 90 -43 404.3 1981
HM149 528762 6880671 -191.1 3 -47 348.9 1981
HM147 529032 6880627 -96.7 13 0 43.6 1981
HM146 529032 6880628 -97.5 13 -35 55.6 1981
HM145 528723 6880837 -164.3 225 -23 67.0 1981
HM144 528939 6880663 -202.1 45 -47 138.6
HM143 529036 6880581 -94.9 72 -30 82.0
HM142 529011 6880610 -168.3 45 7 76.2
HM141 528900 6880690 -196.0 45 -51 113.5
HM140 529030 6880594 -168.6 45 0 70.6

Hole ID Easting Northing Collar Depth Collar azimuth Collar dip LENGTH YEAR
(EUREFIN) Meters Degrees Degrees Meters
HM139 528640 6880828 -126.1 45 -52 171.0 1980
HM138 528711 6880758 -129.7 45 -52 166.0
HM137 528676 6880793 -127.4 45 -54 164.9
HM136 528675 6880793 -127.2 45 -44 154.6
HM135 528874 6880739 -188.7 45 -57 110.2 1979
HM134 528875 6880739 -187.5 45 -35 68.1 1979
HM133 528875 6880739 -186.5 23 0 51.0 1979
HM132 529021 6880602 -170.0 45 -55 130.9 1979
HM131 529038 6880585 -168.7 45 -51 134.0
HM130 529013 6880629 -170.9 45 -57 120.5 1978
HM129 528895 6880758 -106.6 225 -48 43.9 1978
HM128 528875 6880739 -186.5 45 0 53.2 1978
HM127 528874 6880739 -185.9 45 25 53.9 1978
HM126 528761 6880804 -166.1 45 -40 53.2 1978
HM125 528917 6880744 -181.2 45 58 37.2 1978
HM124 528746 6880765 -58.2 342 0 69.4 1978
HM123 528931 6880723 -182.7 45 -21 44.7 1978
HM122 528931 6880723 -181.2 45 30 48.8 1978
HM121 528965 6880687 -178.9 45 -20 40.1 1978
HM120 528965 6880686 -177.3 45 40 29.0 1978
HM119 528985 6880671 -175.9 45 -32 40.8 1978
HM118 528985 6880671 -174.5 45 30 31.4 1978
HM117 528943 6880666 -157.0 45 30 57.1 1978
HM116 529036 6880582 -168.2 225 -35 60.3
HM115 529040 6880584 -167.4 50 0 90.5 1978
HM114 529039 6880585 -167.8 45 -15 76.9 1978
HM113 529039 6880585 -166.5 45 35 66.7 1978
HM112 529021 6880603 -167.4 45 20 70.0 1978
HM111 529014 6880630 -170.4 45 -23 67.6 1978
HM110 528676 6880793 -125.3 45 16 86.2 1978
HM109 528693 6880775 -125.6 45 44 84.3 1978
HM108 528693 6880775 -126.4 45 12 81.2
HM107 528693 6880775 -126.9 45 -16 104.2 1977
HM106 528984 6880670 -173.7 45 0 66.9 1977
HM105 528640 6880828 -123.0 45 45 103.0 1977
HM104 529021 6880603 -168.1 45 -14 79.9 1977
HM103 528640 6880828 -124.9 45 -30 117.5 1977
HM102 528640 6880828 -123.7 45 10 84.8 1977
HM101 528910 6880704 -151.1 45 35 52.5 1977
HM100 528675 6880792 -124.3 45 60 79.7 1977
HM99 529006 6880657 -173.2 45 -45 91.0 1977
HM98 529039 6880585 -168.0 45 -33 109.9 1977
HM97 529039 6880585 -167.0 45 10 78.1 1977
HM96 529006 6880657 -171.5 45 30 51.5 1977
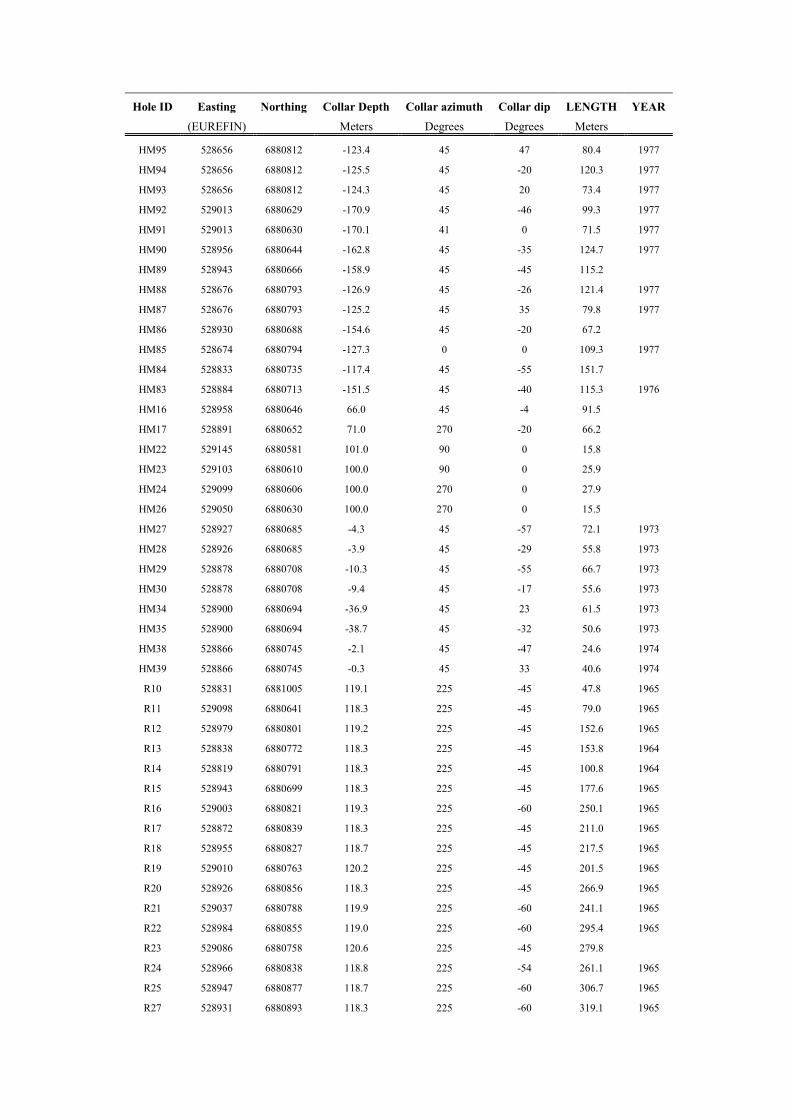
Hole ID Easting Northing Collar Depth Collar azimuth Collar dip LENGTH YEAR
(EUREFIN) Meters Degrees Degrees Meters
HM95 528656 6880812 -123.4 45 47 80.4 1977
HM94 528656 6880812 -125.5 45 -20 120.3 1977
HM93 528656 6880812 -124.3 45 20 73.4 1977
HM92 529013 6880629 -170.9 45 -46 99.3 1977
HM91 529013 6880630 -170.1 41 0 71.5 1977
HM90 528956 6880644 -162.8 45 -35 124.7 1977
HM89 528943 6880666 -158.9 45 -45 115.2
HM88 528676 6880793 -126.9 45 -26 121.4 1977
HM87 528676 6880793 -125.2 45 35 79.8 1977
HM86 528930 6880688 -154.6 45 -20 67.2
HM85 528674 6880794 -127.3 0 0 109.3 1977
HM84 528833 6880735 -117.4 45 -55 151.7
HM83 528884 6880713 -151.5 45 -40 115.3 1976
HM16 528958 6880646 66.0 45 -4 91.5
HM17 528891 6880652 71.0 270 -20 66.2
HM22 529145 6880581 101.0 90 0 15.8
HM23 529103 6880610 100.0 90 0 25.9
HM24 529099 6880606 100.0 270 0 27.9
HM26 529050 6880630 100.0 270 0 15.5
HM27 528927 6880685 -4.3 45 -57 72.1 1973
HM28 528926 6880685 -3.9 45 -29 55.8 1973
HM29 528878 6880708 -10.3 45 -55 66.7 1973
HM30 528878 6880708 -9.4 45 -17 55.6 1973
HM34 528900 6880694 -36.9 45 23 61.5 1973
HM35 528900 6880694 -38.7 45 -32 50.6 1973
HM38 528866 6880745 -2.1 45 -47 24.6 1974
HM39 528866 6880745 -0.3 45 33 40.6 1974
R10 528831 6881005 119.1 225 -45 47.8 1965
R11 529098 6880641 118.3 225 -45 79.0 1965
R12 528979 6880801 119.2 225 -45 152.6 1965
R13 528838 6880772 118.3 225 -45 153.8 1964
R14 528819 6880791 118.3 225 -45 100.8 1964
R15 528943 6880699 118.3 225 -45 177.6 1965
R16 529003 6880821 119.3 225 -60 250.1 1965
R17 528872 6880839 118.3 225 -45 211.0 1965
R18 528955 6880827 118.7 225 -45 217.5 1965
R19 529010 6880763 120.2 225 -45 201.5 1965
R20 528926 6880856 118.3 225 -45 266.9 1965
R21 529037 6880788 119.9 225 -60 241.1 1965
R22 528984 6880855 119.0 225 -60 295.4 1965
R23 529086 6880758 120.6 225 -45 279.8
R24 528966 6880838 118.8 225 -54 261.1 1965
R25 528947 6880877 118.7 225 -60 306.7 1965
R27 528931 6880893 118.3 225 -60 319.1 1965

Hole ID Easting Northing Collar Depth Collar azimuth Collar dip LENGTH YEAR
(EUREFIN) Meters Degrees Degrees Meters
R28 528967 6880839 118.8 225 -60 246.9 1965
R29 528906 6880736 118.3 225 -45 169.0 1965
R3 528878 6880756 118.3 225 -45 137.2 1964
R32 529015 6880947 119.7 225 -65 445.8 1965
R33 528996 6880927 119.6 225 -60 201.6 1965
R34 529049 6880916 120.1 225 -65 446.0 1965
R35 528786 6880828 121.3 225 -45 154.5 1965
R36 528981 6880941 118.8 225 -63 411.1 1965
R37 529052 6880870 119.9 225 -63 345.5 1965
R38 528816 6880797 118.3 225 -45 151.5 1965
R39 528893 6880822 118.3 225 -40 171.4 1965
R4 528912 6880788 118.5 225 -45 109.6 1964
R40 528819 6880772 118.3 225 -30 83.2 1965
R41 528716 6880896 119.6 225 -42 140.0 1965
R42 528831 6880766 118.3 225 -30 80.4 1965
R43 529011 6880687 118.6 225 -45 71.5 1965
R44 529042 6880655 118.3 225 -45 83.2 1965
R45 529143 6880683 121.1 225 -45 157.8 1965
R46 529188 6880658 120.4 225 -45 157.1 1965
R47 529259 6880585 122.6 225 -30 109.2 1965
R48 529087 6880834 120.4 225 -63 378.1 1965
R49 528909 6880873 118.3 225 -55 260.7 1965
R5 529032 6880707 120.2 225 -45 112.8 1964
R51 529110 6880855 120.7 225 -67 453.6 1965
R52 528843 6880761 118.3 225 -45 106.2 1965
R53 528854 6880754 118.3 225 -30 90.6 1965
R54 528864 6880746 118.3 225 -30 74.1 1965
R55 528875 6880739 118.3 225 -30 67.6 1965
R56 528885 6880732 118.3 225 -30 65.6 1965
R57 528895 6880724 118.3 225 -30 65.6 1965
R58 528907 6880717 118.3 225 -30 64.4 1965
R59 528917 6880709 118.3 225 -30 66.3 1965
R6 529033 6880708 120.4 225 -90 150.9 1964
R60 528808 6880779 118.3 225 -30 66.2 1965
R61 529062 6880810 120.2 225 -62 307.6 1965
R62 529145 6880820 121.3 225 -65 383.8 1965
R63 529141 6880614 116.0 225 -30 114.1 1965
R64 529185 6880583 115.3 225 -45 101.9 1965
R65 528909 6880739 118.3 225 -90 321.4 1965
R66 529226 6880622 121.0 225 -45 140.3 1965
R67 529225 6880691 121.3 225 -46 194.4 1965
R68 529108 6880716 121.2 225 -45 189.2 1965
R69 529123 6880799 121.0 225 -63 354.6 1965
R7 528984 6880738 121.0 225 -45 263.9 1964

Hole ID Easting Northing Collar Depth Collar azimuth Collar dip LENGTH YEAR
(EUREFIN) Meters Degrees Degrees Meters
R70 529181 6880786 121.3 225 -65 413.9 1966
R71 529195 6880731 121.3 225 -63 330.9 1965
R72 529286 6880678 121.3 225 -63 351.2 1966
R73 529296 6880621 122.9 225 -50 229.8 1965
R74 528797 6880786 118.3 225 -30 63.5 1965
R75 529223 6880829 119.6 225 -67 649.0 1965
R76 529265 6880658 121.3 225 -50 329.9 1965
R77 528787 6880793 118.6 225 -30 58.5 1965
R78 528775 6880799 121.3 225 -30 70.0 1965
R79 528763 6880806 121.3 225 -30 56.7 1965
R8 528934 6880761 119.8 225 -45 110.7 1965
R80 529168 6880705 121.3 225 -60 383.8 1965
R82 529150 6880756 121.3 225 -55 346.5 1966
R83 529330 6880515 121.4 225 -45 122.5 1965
R84 529014 6880724 121.3 225 -30 218.7 1966
R85 529220 6880548 115.3 225 -45 71.9 1965
R86 528927 6880702 118.3 225 -30 67.1 1965
R87 528939 6880695 118.3 225 -30 71.3 1965
R88 529226 6880693 121.3 225 -58 258.2 1966
R89 528848 6880781 118.3 225 -45 129.2 1966
R9 529062 6880676 119.2 225 -45 79.7 1965
R70A 529181 6880786 -31.0 225 -65 235.0 1966