3d-computed tomography over four … · 3d-computed tomography over four orders of magnitude of...
TRANSCRIPT

3D-COMPUTED TOMOGRAPHY OVER FOUR ORDERS OF MAGNITUDE OF X-RAY ENERGIES J. Goebbels, B. Illerhaus, Y. Onel, H. Riesemeier, G. Weidemann
Federal Institute for Materials Research and Testing (BAM), Berlin, Germany Abstract: In the last twenty years the Federal Institute for Materials Research and Testing (BAM) has developed several tomographs from high resolution computed tomography with synchrotron radiation at the Berlin Electron Storage Ring Company for Synchrotron Radiation (BESSY) in the energy range from 8 to 80 keV, over laboratory equipment using different kind of micro focus X-ray tubes (a 100 kV transmission type X-ray tube, a conventional 225 kV and a 320 kV bi-polar micro focus X-ray tube up to high energy sources like 60Co and an 12 MeV electron linear accelerator. Different kind of detectors are used either flat panel detectors on the basis of amorphous silicon or cooled 16 Bit CCD-cameras coupled to a coated fiber taper, to an X-ray image intensifier or to a scintillating plate by a lens optic. The limits of detectors are shown together with the applied methods to reduce artifacts. The applications cover a broad spectrum analyzing the structure and assembly of rare small insects, characterizing fiber reinforced materials, metal matrix composites up to the dimensional analysis of castings and flaws in welding seams. Introduction: The study of volume properties as well as of dimensional features with computed tomography requires an optimized selection of source-detector combination depending on material composition (energy dependent linear attenuation coefficient µ), size of the samples and maximum thickness of material d which has to be irradiated. Additionally the manipulator system and the mounting needs to suffice the accuracy required. The maximum S/N ratio of a CT measurement of an homogenous sample is given for µ∗d≅2.2 corresponding to a transmission of about 11 %. Due to limitations especially of flat detectors conditions for optimum image quality differ from this theoretical value. This article concerns the presently used CT equipment at BAM and presents some technical and biological applications performed with the apparatus described in detail before. Experimental Setup: At BAM four tomographs developed for own use in the laboratory are available presently and additionally there is a computed tomography facility at the beam line of BAM at the Berlin Electron Storage Ring Company for Synchrotron Radiation (BESSY). Some of the details of all apparatus are described elsewhere therefore only some newer specifications are described. Universal Tomograph Starting with a multi-detector system for a 380 kV X-ray tube and a 60Co radionuclide source described as early as 1985 [1], the universal scanner was extended for measurements with a 12 MeV electron linear accelerator (LINAC, Raytech 4000) in combination with a multi-detector system with step-motor controlled collimator slits [2]. Since last year an a-Si flat panel detector (Perkin Elmer, 16 Bit ADC, 256∗256 pixel à (0.8 mm)2) was used to study some effects of high-energy cone beam CT with the LINAC and 60Co. The constant intensity output of 60Co together with the low angular intensity decay can be used to perform measurements with up to five positions of the detector extending the usable object diameter range from 140 mm up to 500 mm. For the LINAC source it is necessary to monitor always intensity variations by measuring the light intensity, that means without an additional external detector only the conventional two-circle measurement can be applied. 320 kV micro focus tomograph

attenuation for Fe with 2 mm Cu filter
0,001
0,01
0,1
10 5 10 15 20 25 30
thickness [mm]at
tenu
atio
n
100kV160kV200kV320kV380kV
Fig. 1a: 320kV micro focus tube Fig. 1b: attenuation versus material thickness For many objects it would be desirable to extend the energy range of micro focus X-ray tubes. As an example most of cellular metals are made from aluminum and thus have a high penetration depth for X-rays. But they are often used to produce objects of non-regular shapes (with an outer cover of a different material or the foam skin itself). This produces artifacts due to the high attenuating parts. In some applications foams of high attenuating materials (up to iron) are used. In these cases the choice of an X-ray energy as high as possible reduces the artifacts from beam hardening and exponential edge gradient effects. Fig. 1b gives a graph, which shows the gain in attenuation possible with an extended range of kV. For CT measurements the maximum absorption to free beam ratio is about 20. From the graph it is seen that this means an extension of measurable ‘material in object thickness’ from 20 mm to 30 mm of steel. End of 2002 a 320kV micro focus X-tray tube [MX-5 tube, build by YXLON, Halfdangsgade 8, 2300 S Copenhagen] was integrated into a CT system (Fig. 1a). The bipolar tube is build up from a standard -200 kV tube. The original probe head is changed to the bipolar part which has a build in anode with an additional high voltage supply of up to +120 kV. The distance between X-ray spot to tube outside is enlarged to 25 mm because the target position is no longer at ground voltage level. This means that the tube in this modification has a lower maximal magnification, but this corresponds to the bigger object size. For example with 320 kV and 0.1 mA the optimum spatial resolution is about 35 µm. In practical operation the second part is fixed to +120kV while the variation in energy is done with the first. A range of 130kV to 320kV results. To the first part a standard micro focus target can be attached and the tube can thus be used as normal 200kV micro focus tube with high magnification. As detector an a-Si flat panel detector (Perkin Elmer, 16 Bit ADC, 1024∗1024 pixel à (0.4 mm)2) is used [3]. 225 kV micro focus tomograph The first 3D scanner of BAM running since more than ten years consists of an 12 inch image intensifier coupled to a cooled CCD camera (Photometrics CH220, CCD type THX 31156, 16 Bit ADC, 40kHz, 1024 x 1024 pixel à (19 µm)2 together with an 225 kV micro focus X-ray tube (Feinfocus FXE-225.20), which replaced the formerly 200 kV tube. The spherical aberrations of the image intensifier require a careful procedure to determine these nonlinearities which are corrected for each projection in real time. Due to the fixed gain factor of the image intensifier an improvement of ratio of X-ray photons to electrons in the CCD camera can be reached by introducing optical grey filters in the optical light path with an attenuation factor up to ten. With a magnification of 40 and a voxel size of (8µm)3 the 10% value of MTF is 27 Lp/mm, which corresponds to a spatial resolution of about 18 µm [4].

100 kV micro focus tomograph The source of this high-resolution tomograph is a transmission target X-ray tube (Feinfocus FXE-100.53, 100 kV, 1mA). The focal spot is about 1-2 µm. As detector system a cooled CCD camera (Photometrics CH250, CCD type TK1024 AF2, 16 BIT ADC, 200 kHz, 1024∗1024 pixel, pixel size (24 µm)2) was used coupled to a 2:1 reducing fiber taper, which is coated with a GdOS scintillator screen of thickness of about 25 µm. The read-out rate of the CCD camera is 200 kHz with 16 Bit. The magnification, that means the ratio of the distance detector source to the distance object source can be adjust up to a factor of 100 (only for small objects with an diameter of less than 1 mm). Objects up to a diameter of 15 mm can be measured [5]. The spatial resolution is usually defined as the 10% value of modulation transfer function (MTF). The experimental procedure determining the MTF is to measure a sharp edge of a homogenous material. From the edge response function (ERF) the MTF can be derived directly by integration, without calculating the line spread function (LSF), which leads to an enhanced noise, as an intermediate step [6]. With a voxel size of (1.1 µm)3 the ten percent value is about 320 Lp/mm corresponding to a spatial resolution of about 1.5 µm. The standard deviation σ of the contrast resolution ∆µ/µ which is defined as the FWHM value of the histogram of a homogenous sample was determined according the ISO norm from an area of 10∗10 pixel of a tomogram of a SiO2 sample. For binning 1 of the CCD camera (1024 x 1024 image matrix) the standard deviation is σ = 11.4 grey levels at a mean value of 110.0 corresponding to a contrast resolution of ∆µ/µ = 10.3 % and for binning 2, that means 4 pixel are averaged before read-out the CCD camera, σ = 7.4 at a mean value of 155.7 and ∆µ/µ = 4.8 %. That means the photon statistic is the limiting factor for contrast resolution. These measurements are performed with an X-ray energy of 50 kV, current of 160 µA and prefiltering the X-ray spectra with 3 mm Al. The integration time was 50 sec per image without read-out time. At binning 1 a gain factor of 2 was selected to reduce the digitizing noise. Synchrotron CT To extend the usable energy range at Berlin Electron Storage Ring Company for Synchrotron Radiation (BESSY) a 7 T wavelength shifter with a critical energy of 13.5 keV has been installed in the storage ring to operate the first hard X-ray beam line at BESSY called BAMline. The main optical components of the beam line are a double crystal monochromator (DCM) and a double multilayer monochromator (DMM, 320 double layers of W and Si, thickness 1.2 nm respectively 1.6 nm). The latter is preferably used for tomographic facilities giving a factor of 100 higher photon flux due to the increased bandwidth of 2 % compared with 0.01 % of the DCM [7]. The detector system consists on a 2048 x 2048 photometrics camera system together with a scintillator screen of GdOS. Depending of the used lens combination nominal voxel sizes of 3.6 µm and 7.2 µm can be used. Results: According the different equipment optimized conditions can be selected for the required applications. Flaw extraction in Cu samples As first example results are shown from flaw extraction in electron beam welded Cu samples (size about 40 x 100 x 300 mm) with the high energy 3D CT (Fig. 2). For POD studies a 100 % inspection of volumetric flaws are performed. Due to the limited size of the flat panel detector the sample was measured in three positions and after the image reconstruction the overlapping data sets are joined. The reconstructed images show some artifacts given by scattered radiation, beam hardening and detector inherent effects. Therefore a filter was used to reduce these artifacts. Fig. 2 shows as result a cross section trough the sample.
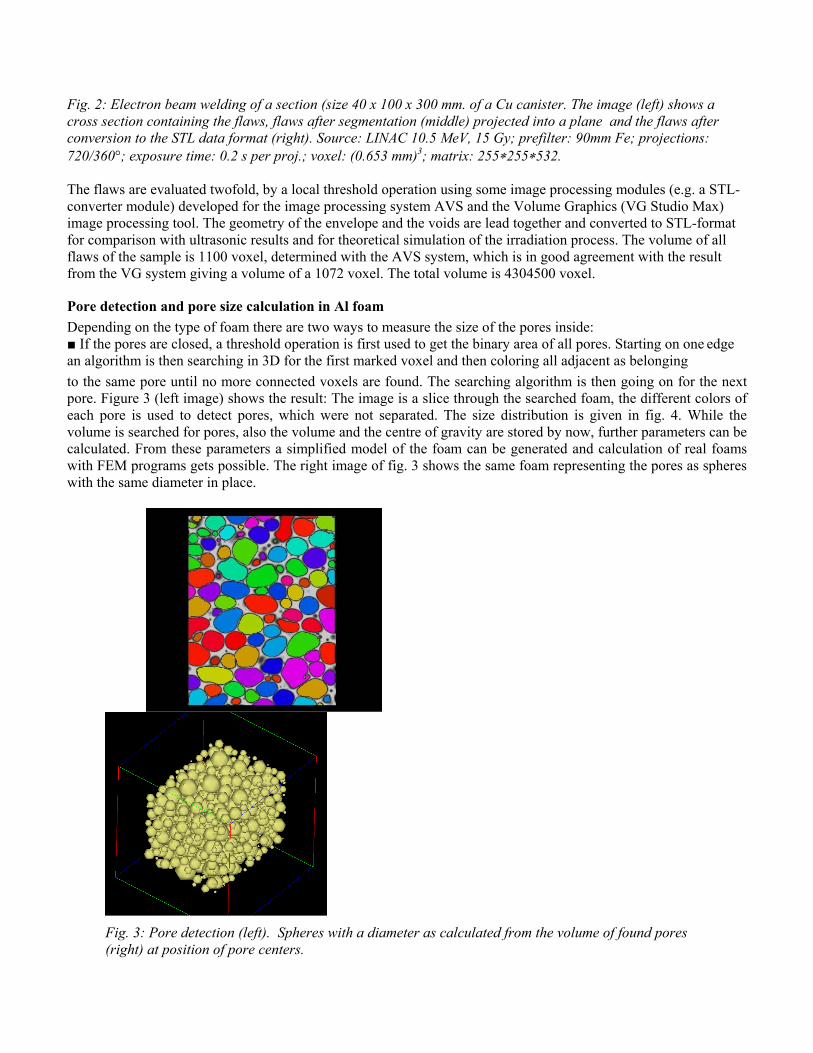
Fig. 2: Electron beam welding of a section (size 40 x 100 x 300 mm. of a Cu canister. The image (left) shows a cross section containing the flaws, flaws after segmentation (middle) projected into a plane and the flaws after conversion to the STL data format (right). Source: LINAC 10.5 MeV, 15 Gy; prefilter: 90mm Fe; projections: 720/360°; exposure time: 0.2 s per proj.; voxel: (0.653 mm)3; matrix: 255∗255∗532. The flaws are evaluated twofold, by a local threshold operation using some image processing modules (e.g. a STL-converter module) developed for the image processing system AVS and the Volume Graphics (VG Studio Max) image processing tool. The geometry of the envelope and the voids are lead together and converted to STL-format for comparison with ultrasonic results and for theoretical simulation of the irradiation process. The volume of all flaws of the sample is 1100 voxel, determined with the AVS system, which is in good agreement with the result from the VG system giving a volume of a 1072 voxel. The total volume is 4304500 voxel.
Pore detection and pore size calculation in Al foam Depending on the type of foam there are two ways to measure the size of the pores inside: ■ If the pores are closed, a threshold operation is first used to get the binary area of all pores. Starting on one edge an algorithm is then searching in 3D for the first marked voxel and then coloring all adjacent as belonging to the same pore until no more connected voxels are found. The searching algorithm is then going on for the next pore. Figure 3 (left image) shows the result: The image is a slice through the searched foam, the different colors of each pore is used to detect pores, which were not separated. The size distribution is given in fig. 4. While the volume is searched for pores, also the volume and the centre of gravity are stored by now, further parameters can be calculated. From these parameters a simplified model of the foam can be generated and calculation of real foams with FEM programs gets possible. The right image of fig. 3 shows the same foam representing the pores as spheres with the same diameter in place.
Fig. 3: Pore detection (left). Spheres with a diameter as calculated from the volume of found pores (right) at position of pore centers.

■ If the pores are open, the inverted non-metal part has to be 3D-eroded until single areas for all pores result. The pore radius can then be calculated from counted voxels per pore (see second method). Knowing the number of erode steps the pore radius has to be enlarged by this value.
Before compression after 2% compression after 5%compression after 10%compression Fig. 5. A vertical slice through the foam before and after compression Before compression after 2% compression after 5%compression after 10%compression Fig. 6. The shift of the parts of strength tested sample
0
10
20
30
40
50
60
70
80
90
100
0,00 0,19 0,37 0,56 0,74 0,93 1,11 1,30 1,49
Radius [mm]
Anz
ahl P
oren
Fig. 4: Pore size distribution (c.f. left image of fig. 3)
Internal deformation The failure mechanisms of strength-tested foams were studied on samples before the compression and after the compression. 3D-CT images of the samples were used to find out, in which place of the foam deformation has started. For that a program for image comparison in 3D was developed. First the size of the region, which will be compared with the region of the sample after the compression test has to be defined. This region has to be bigger as the size of the mean pore. The region is moved in different directions in 3D, until it fits best with respect to the initial sample, and the shift of the parts of strength tested sample is written to an array. So for all small regions of the probe we get shifts in respect to the initial sample in three directions: ∆x, ∆y and ∆z. The displacement after compression test is shown (unit mm) using different grey levels, which are painted over the original foam structure, in order to show the displacement of compressed foam compared to original foam
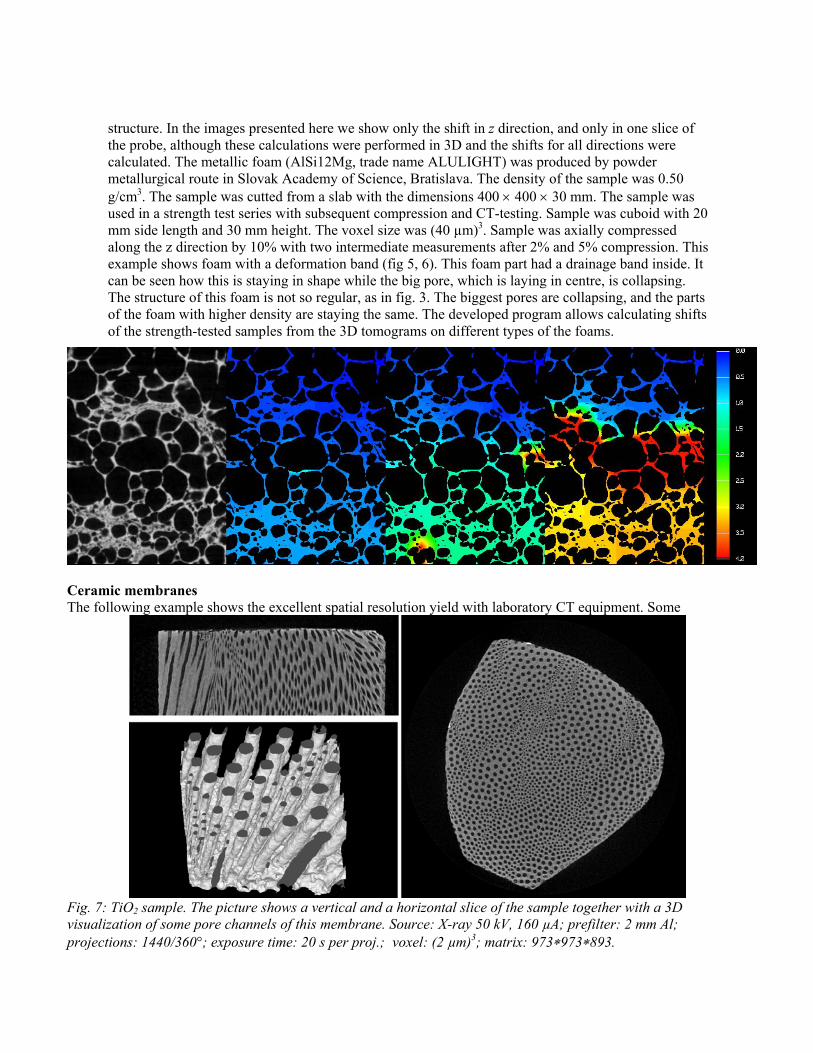
structure. In the images presented here we show only the shift in z direction, and only in one slice of the probe, although these calculations were performed in 3D and the shifts for all directions were calculated. The metallic foam (AlSi12Mg, trade name ALULIGHT) was produced by powder metallurgical route in Slovak Academy of Science, Bratislava. The density of the sample was 0.50 g/cm3. The sample was cutted from a slab with the dimensions 400 × 400 × 30 mm. The sample was used in a strength test series with subsequent compression and CT-testing. Sample was cuboid with 20 mm side length and 30 mm height. The voxel size was (40 µm)3. Sample was axially compressed along the z direction by 10% with two intermediate measurements after 2% and 5% compression. This example shows foam with a deformation band (fig 5, 6). This foam part had a drainage band inside. It can be seen how this is staying in shape while the big pore, which is laying in centre, is collapsing. The structure of this foam is not so regular, as in fig. 3. The biggest pores are collapsing, and the parts of the foam with higher density are staying the same. The developed program allows calculating shifts of the strength-tested samples from the 3D tomograms on different types of the foams.
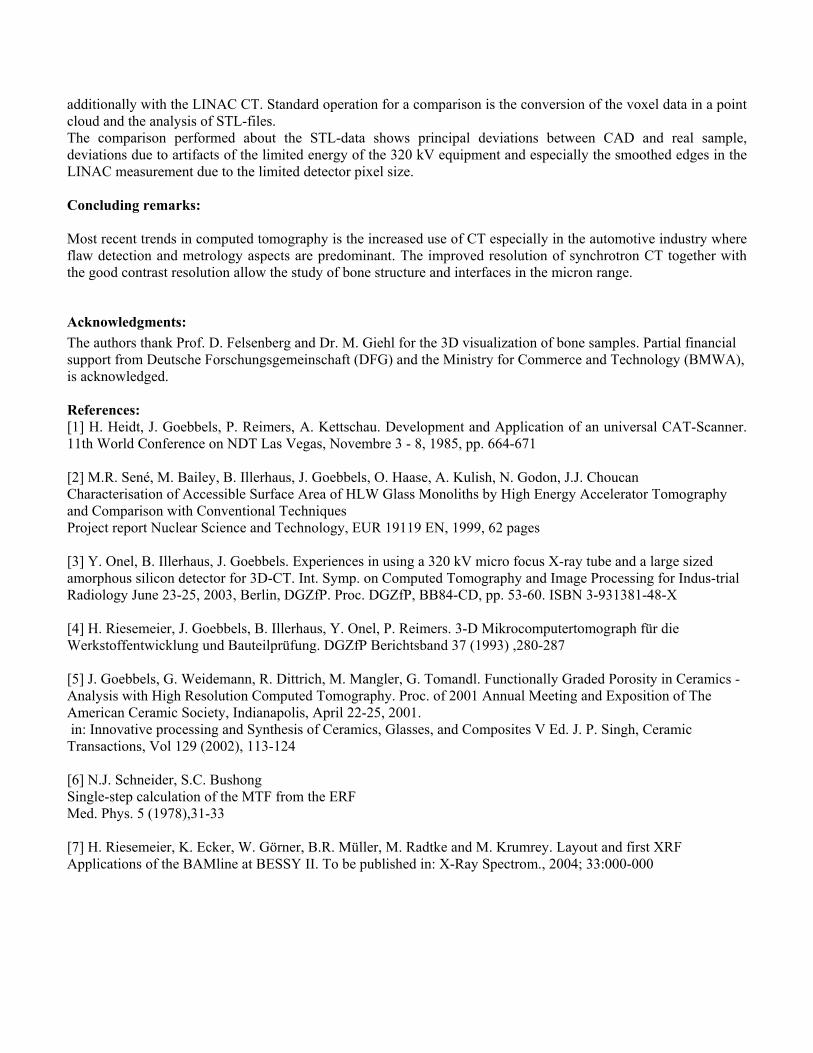
Ceramic membranes The following example shows the excellent spatial resolution yield with laboratory CT equipment. Some
Fig. 7: TiO2 sample. The picture shows a vertical and a horizontal slice of the sample together with a 3D visualization of some pore channels of this membrane. Source: X-ray 50 kV, 160 µA; prefilter: 2 mm Al; projections: 1440/360°; exposure time: 20 s per proj.; voxel: (2 µm)3; matrix: 973∗973∗893.

samples from Al2O3, Hydroxylapatite and TiO2 were studied to analyze pore size distribution and capillary structure [5]. Structure of Bone samples and implants The main advantage using synchrotron radiation for characterizing bone samples and implants is a better signal to noise ratio together with a sharper transition between bone and air or implant and bone as quantified by a comparison of different laboratory equipment and synchrotron facility. In cooperation with Charité Berlin (Benjamin Franklin Hospital) bone surfaces has been investigated.
Fig. 8: The image at right shows a cross section through a bone, the left image a section of the isosurface visua-lization. Synchrotron: 27 keV; projections: 1200/180°; exposure time: 0.5 s per proj.; voxel: (3.6 µm)3; matrix: 1987∗1987∗419. Dimensional control An actual point of research is the improvement of dimensional control with CT. As an example fig. 9 shows a cross section of a aluminum test sample investigated with the 320 kV equipment. This sample was measured
Fig. 9 Test sample of Aluminum (∅ about 100 mm). The image (left) shows a cross section of the measurement with the 320 kV equipment ( 320 kV X-ray: 220 kV, 100µA; prefilter: 1.5 mm Sn; projections: 900/360°; exposure time: 2.28 s per proj.; voxel: (0.12 mm)3; matrix: 1023∗1023∗605. The image (middle shows the deviation against the CAD Data and the image (right) the deviation again the measurement with LINAC (10.5 MeV, 20 Gy; prefilter: 90 mm Fe; projections: 720/360°; exposure time: 0.8 s per proj.; voxel: (0.65 mm)3; matrix 255 x 255 x 201).
additionally with the LINAC CT. Standard operation for a comparison is the conversion of the voxel data in a point cloud and the analysis of STL-files. The comparison performed about the STL-data shows principal deviations between CAD and real sample, deviations due to artifacts of the limited energy of the 320 kV equipment and especially the smoothed edges in the LINAC measurement due to the limited detector pixel size. Concluding remarks: Most recent trends in computed tomography is the increased use of CT especially in the automotive industry where flaw detection and metrology aspects are predominant. The improved resolution of synchrotron CT together with the good contrast resolution allow the study of bone structure and interfaces in the micron range.
Acknowledgments: The authors thank Prof. D. Felsenberg and Dr. M. Giehl for the 3D visualization of bone samples. Partial financial support from Deutsche Forschungsgemeinschaft (DFG) and the Ministry for Commerce and Technology (BMWA), is acknowledged. References: [1] H. Heidt, J. Goebbels, P. Reimers, A. Kettschau. Development and Application of an universal CAT-Scanner. 11th World Conference on NDT Las Vegas, Novembre 3 - 8, 1985, pp. 664-671 [2] M.R. Sené, M. Bailey, B. Illerhaus, J. Goebbels, O. Haase, A. Kulish, N. Godon, J.J. Choucan Characterisation of Accessible Surface Area of HLW Glass Monoliths by High Energy Accelerator Tomography and Comparison with Conventional Techniques Project report Nuclear Science and Technology, EUR 19119 EN, 1999, 62 pages [3] Y. Onel, B. Illerhaus, J. Goebbels. Experiences in using a 320 kV micro focus X-ray tube and a large sized amorphous silicon detector for 3D-CT. Int. Symp. on Computed Tomography and Image Processing for Indus-trial Radiology June 23-25, 2003, Berlin, DGZfP. Proc. DGZfP, BB84-CD, pp. 53-60. ISBN 3-931381-48-X [4] H. Riesemeier, J. Goebbels, B. Illerhaus, Y. Onel, P. Reimers. 3-D Mikrocomputertomograph für die Werkstoffentwicklung und Bauteilprüfung. DGZfP Berichtsband 37 (1993) ,280-287 [5] J. Goebbels, G. Weidemann, R. Dittrich, M. Mangler, G. Tomandl. Functionally Graded Porosity in Ceramics - Analysis with High Resolution Computed Tomography. Proc. of 2001 Annual Meeting and Exposition of The American Ceramic Society, Indianapolis, April 22-25, 2001. in: Innovative processing and Synthesis of Ceramics, Glasses, and Composites V Ed. J. P. Singh, Ceramic Transactions, Vol 129 (2002), 113-124 [6] N.J. Schneider, S.C. Bushong Single-step calculation of the MTF from the ERF Med. Phys. 5 (1978),31-33 [7] H. Riesemeier, K. Ecker, W. Görner, B.R. Müller, M. Radtke and M. Krumrey. Layout and first XRF Applications of the BAMline at BESSY II. To be published in: X-Ray Spectrom., 2004; 33:000-000