>??@3;?%a!*+,!$%81$/!b%c*#* c*/2:% ’d%(’*:%.0!e!#*$b%(!)10#) … · 2010-06-10 ·...
TRANSCRIPT
Cen ter for Research & Evaluation - Charlotte-M eck lenburg SchoolsReport produced on M arch 16 , 2010
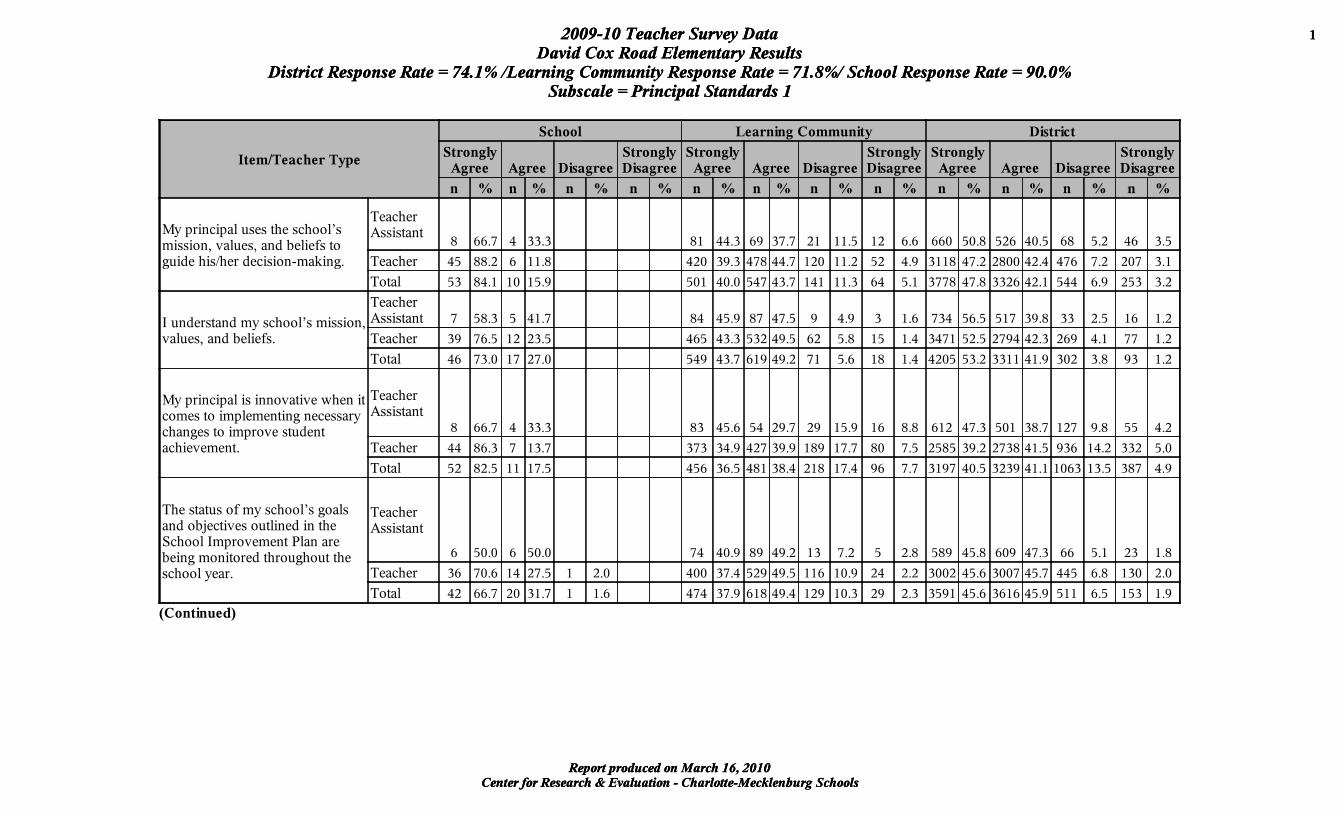
2009-10 Teacher Survey Data 1
David Cox Road Elementary ResultsD istrict Response Rate = 74.1% /Learning Community Response Rate = 71.8% / School Response Rate = 90.0%
Subscale = Principal Standards 1
Cen ter for Research & Evaluation - Charlotte-M eck lenburg SchoolsReport produced on M arch 16 , 2010
2009-10 Teacher Survey Data 1
David Cox Road Elementary ResultsD istrict Response Rate = 74.1% /Learning Community Response Rate = 71.8% / School Response Rate = 90.0%
Subscale = Principal Standards 1
I t e m /T e a c h e r T y p e
S c h o o l L e a r n in g C o m m u n it y D is t r ic t
S t r o n g lyA g r e e A g r e e D is a g r e e
S t r o n g lyD is a g r e e
S t r o n g lyA g r e e A g r e e D is a g r e e
S t r o n g lyD is a g r e e
S t r o n g lyA g r e e A g r e e D is a g r e e
S t r o n g lyD is a g r e e
n % n % n % n % n % n % n % n % n % n % n % n %
M y p r in c ip a l u s e s th e s c h o o l ’ sm is s io n , v a lu e s , a n d b e l ie f s tog u id e h is /h e r d e c is io n -m a k in g .
T e a c h e rA s s is ta n t
8 6 6 .7 4 3 3 .3 8 1 4 4 .3 6 9 3 7 .7 2 1 1 1 .5 1 2 6 .6 6 6 0 5 0 .8 5 2 6 4 0 .5 6 8 5 .2 4 6 3 .5
T e a c h e r 4 5 8 8 .2 6 1 1 .8 4 2 0 3 9 .3 4 7 8 4 4 .7 1 2 0 1 1 .2 5 2 4 .9 3 1 1 8 4 7 .2 2 8 0 0 4 2 .4 4 7 6 7 .2 2 0 7 3 .1
T o ta l 5 3 8 4 .1 1 0 1 5 .9 5 0 1 4 0 .0 5 4 7 4 3 .7 1 4 1 1 1 .3 6 4 5 .1 3 7 7 8 4 7 .8 3 3 2 6 4 2 .1 5 4 4 6 .9 2 5 3 3 .2
I u n d e r s ta n d m y s c h o o l ’ s m is s io n ,v a lu e s , a n d b e l ie f s .
T e a c h e rA s s is ta n t 7 5 8 .3 5 4 1 .7 8 4 4 5 .9 8 7 4 7 .5 9 4 .9 3 1 .6 7 3 4 5 6 .5 5 1 7 3 9 .8 3 3 2 .5 1 6 1 .2
T e a c h e r 3 9 7 6 .5 1 2 2 3 .5 4 6 5 4 3 .3 5 3 2 4 9 .5 6 2 5 .8 1 5 1 .4 3 4 7 1 5 2 .5 2 7 9 4 4 2 .3 2 6 9 4 .1 7 7 1 .2
T o ta l 4 6 7 3 .0 1 7 2 7 .0 5 4 9 4 3 .7 6 1 9 4 9 .2 7 1 5 .6 1 8 1 .4 4 2 0 5 5 3 .2 3 3 1 1 4 1 .9 3 0 2 3 .8 9 3 1 .2
M y p r in c ip a l i s in n o v a t iv e w h e n i tc o m e s to im p lem e n t in g n e c e s s a r yc h a n g e s to im p ro v e s tu d e n ta c h ie v em e n t .
T e a c h e rA s s is ta n t
8 6 6 .7 4 3 3 .3 8 3 4 5 .6 5 4 2 9 .7 2 9 1 5 .9 1 6 8 .8 6 1 2 4 7 .3 5 0 1 3 8 .7 1 2 7 9 .8 5 5 4 .2
T e a c h e r 4 4 8 6 .3 7 1 3 .7 3 7 3 3 4 .9 4 2 7 3 9 .9 1 8 9 1 7 .7 8 0 7 .5 2 5 8 5 3 9 .2 2 7 3 8 4 1 .5 9 3 6 1 4 .2 3 3 2 5 .0
T o ta l 5 2 8 2 .5 1 1 1 7 .5 4 5 6 3 6 .5 4 8 1 3 8 .4 2 1 8 1 7 .4 9 6 7 .7 3 1 9 7 4 0 .5 3 2 3 9 4 1 .1 1 0 6 3 1 3 .5 3 8 7 4 .9
T h e s ta tu s o f m y s c h o o l ’ s g o a lsa n d o b je c t iv e s o u t l in e d in th eS c h o o l Im p ro v em e n t P la n a r eb e in g m o n i to r e d th r o u g h o u t th es c h o o l y e a r .
T e a c h e rA s s is ta n t
6 5 0 .0 6 5 0 .0 7 4 4 0 .9 8 9 4 9 .2 1 3 7 .2 5 2 .8 5 8 9 4 5 .8 6 0 9 4 7 .3 6 6 5 .1 2 3 1 .8
T e a c h e r 3 6 7 0 .6 1 4 2 7 .5 1 2 .0 4 0 0 3 7 .4 5 2 9 4 9 .5 1 1 6 1 0 .9 2 4 2 .2 3 0 0 2 4 5 .6 3 0 0 7 4 5 .7 4 4 5 6 .8 1 3 0 2 .0
T o ta l 4 2 6 6 .7 2 0 3 1 .7 1 1 .6 4 7 4 3 7 .9 6 1 8 4 9 .4 1 2 9 1 0 .3 2 9 2 .3 3 5 9 1 4 5 .6 3 6 1 6 4 5 .9 5 1 1 6 .5 1 5 3 1 .9
(C o n t in u e d )
Cen ter for Research & Evaluation - Charlotte-M eck lenburg SchoolsReport produced on M arch 16 , 2010
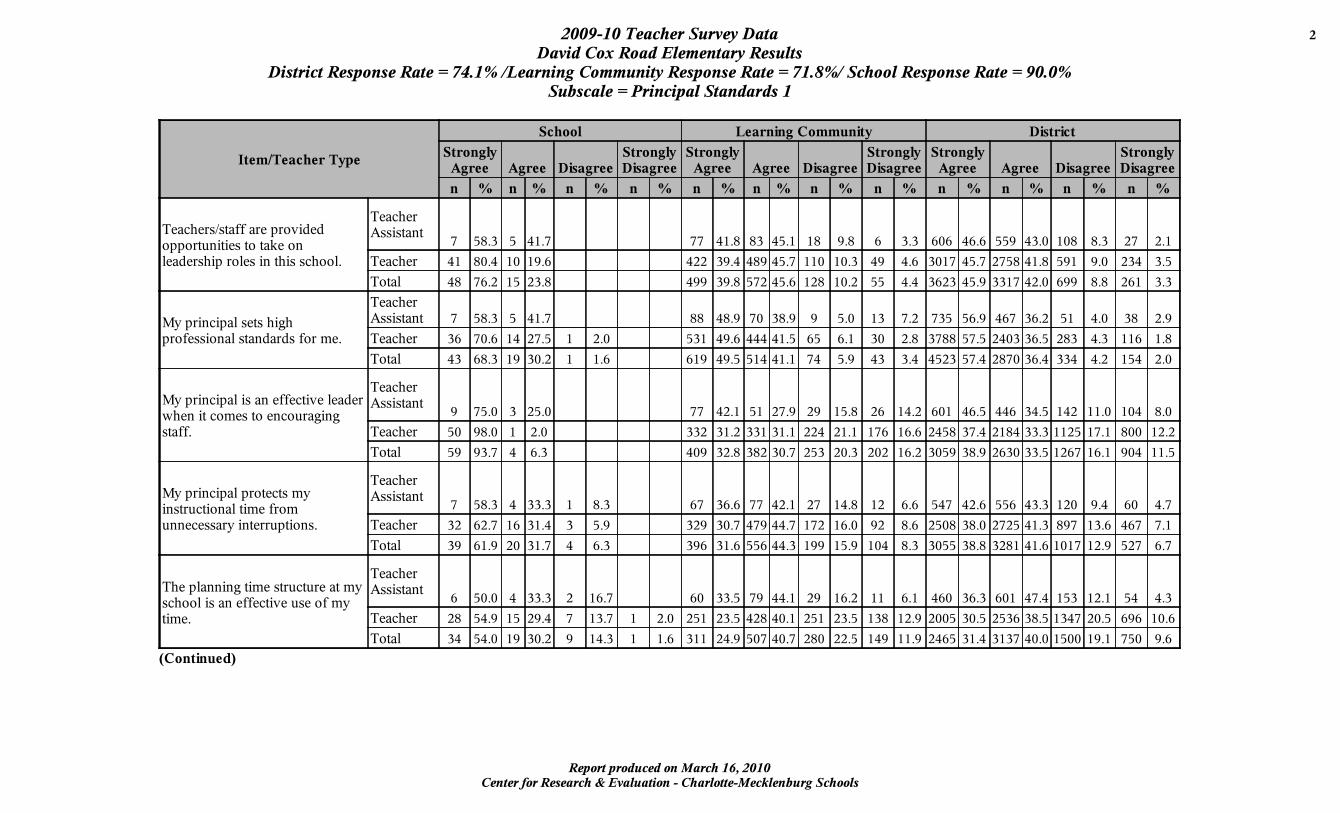
2009-10 Teacher Survey Data 2
David Cox Road Elementary ResultsD istrict Response Rate = 74.1% /Learning Community Response Rate = 71.8% / School Response Rate = 90.0%
Subscale = Principal Standards 1
I t e m /T e a c h e r T y p e
S c h o o l L e a r n in g C o m m u n it y D is t r ic t
S t r o n g lyA g r e e A g r e e D is a g r e e
S t r o n g lyD is a g r e e
S t r o n g lyA g r e e A g r e e D is a g r e e
S t r o n g lyD is a g r e e
S t r o n g lyA g r e e A g r e e D is a g r e e
S t r o n g lyD is a g r e e
n % n % n % n % n % n % n % n % n % n % n % n %
T e a c h e r s /s ta f f a r e p r o v id e do p p o r tu n i t ie s to ta k e o nle a d e r s h ip r o le s in th is s c h o o l .
T e a c h e rA s s is ta n t
7 5 8 .3 5 4 1 .7 7 7 4 1 .8 8 3 4 5 .1 1 8 9 .8 6 3 .3 6 0 6 4 6 .6 5 5 9 4 3 .0 1 0 8 8 .3 2 7 2 .1
T e a c h e r 4 1 8 0 .4 1 0 1 9 .6 4 2 2 3 9 .4 4 8 9 4 5 .7 1 1 0 1 0 .3 4 9 4 .6 3 0 1 7 4 5 .7 2 7 5 8 4 1 .8 5 9 1 9 .0 2 3 4 3 .5
T o ta l 4 8 7 6 .2 1 5 2 3 .8 4 9 9 3 9 .8 5 7 2 4 5 .6 1 2 8 1 0 .2 5 5 4 .4 3 6 2 3 4 5 .9 3 3 1 7 4 2 .0 6 9 9 8 .8 2 6 1 3 .3
M y p r in c ip a l s e ts h ig hp ro f e s s io n a l s ta n d a rd s f o r m e .
T e a c h e rA s s is ta n t 7 5 8 .3 5 4 1 .7 8 8 4 8 .9 7 0 3 8 .9 9 5 .0 1 3 7 .2 7 3 5 5 6 .9 4 6 7 3 6 .2 5 1 4 .0 3 8 2 .9
T e a c h e r 3 6 7 0 .6 1 4 2 7 .5 1 2 .0 5 3 1 4 9 .6 4 4 4 4 1 .5 6 5 6 .1 3 0 2 .8 3 7 8 8 5 7 .5 2 4 0 3 3 6 .5 2 8 3 4 .3 1 1 6 1 .8
T o ta l 4 3 6 8 .3 1 9 3 0 .2 1 1 .6 6 1 9 4 9 .5 5 1 4 4 1 .1 7 4 5 .9 4 3 3 .4 4 5 2 3 5 7 .4 2 8 7 0 3 6 .4 3 3 4 4 .2 1 5 4 2 .0
M y p r in c ip a l i s a n e f f e c t iv e le a d e rw h e n i t c o m e s to e n c o u r a g in gs ta f f .
T e a c h e rA s s is ta n t
9 7 5 .0 3 2 5 .0 7 7 4 2 .1 5 1 2 7 .9 2 9 1 5 .8 2 6 1 4 .2 6 0 1 4 6 .5 4 4 6 3 4 .5 1 4 2 1 1 .0 1 0 4 8 .0
T e a c h e r 5 0 9 8 .0 1 2 .0 3 3 2 3 1 .2 3 3 1 3 1 .1 2 2 4 2 1 .1 1 7 6 1 6 .6 2 4 5 8 3 7 .4 2 1 8 4 3 3 .3 1 1 2 5 1 7 .1 8 0 0 1 2 .2
T o ta l 5 9 9 3 .7 4 6 .3 4 0 9 3 2 .8 3 8 2 3 0 .7 2 5 3 2 0 .3 2 0 2 1 6 .2 3 0 5 9 3 8 .9 2 6 3 0 3 3 .5 1 2 6 7 1 6 .1 9 0 4 1 1 .5
M y p r in c ip a l p r o te c ts m yin s t r u c t io n a l t im e f r o mu n n e c e s s a r y in te r r u p t io n s .
T e a c h e rA s s is ta n t
7 5 8 .3 4 3 3 .3 1 8 .3 6 7 3 6 .6 7 7 4 2 .1 2 7 1 4 .8 1 2 6 .6 5 4 7 4 2 .6 5 5 6 4 3 .3 1 2 0 9 .4 6 0 4 .7
T e a c h e r 3 2 6 2 .7 1 6 3 1 .4 3 5 .9 3 2 9 3 0 .7 4 7 9 4 4 .7 1 7 2 1 6 .0 9 2 8 .6 2 5 0 8 3 8 .0 2 7 2 5 4 1 .3 8 9 7 1 3 .6 4 6 7 7 .1
T o ta l 3 9 6 1 .9 2 0 3 1 .7 4 6 .3 3 9 6 3 1 .6 5 5 6 4 4 .3 1 9 9 1 5 .9 1 0 4 8 .3 3 0 5 5 3 8 .8 3 2 8 1 4 1 .6 1 0 1 7 1 2 .9 5 2 7 6 .7
T h e p la n n in g t im e s t r u c tu r e a t m ys c h o o l i s a n e f f e c t iv e u s e o f m yt im e .
T e a c h e rA s s is ta n t
6 5 0 .0 4 3 3 .3 2 1 6 .7 6 0 3 3 .5 7 9 4 4 .1 2 9 1 6 .2 1 1 6 .1 4 6 0 3 6 .3 6 0 1 4 7 .4 1 5 3 1 2 .1 5 4 4 .3
T e a c h e r 2 8 5 4 .9 1 5 2 9 .4 7 1 3 .7 1 2 .0 2 5 1 2 3 .5 4 2 8 4 0 .1 2 5 1 2 3 .5 1 3 8 1 2 .9 2 0 0 5 3 0 .5 2 5 3 6 3 8 .5 1 3 4 7 2 0 .5 6 9 6 1 0 .6
T o ta l 3 4 5 4 .0 1 9 3 0 .2 9 1 4 .3 1 1 .6 3 1 1 2 4 .9 5 0 7 4 0 .7 2 8 0 2 2 .5 1 4 9 1 1 .9 2 4 6 5 3 1 .4 3 1 3 7 4 0 .0 1 5 0 0 1 9 .1 7 5 0 9 .6
(C o n t in u e d )
Cen ter for Research & Evaluation - Charlotte-M eck lenburg SchoolsReport produced on M arch 16 , 2010
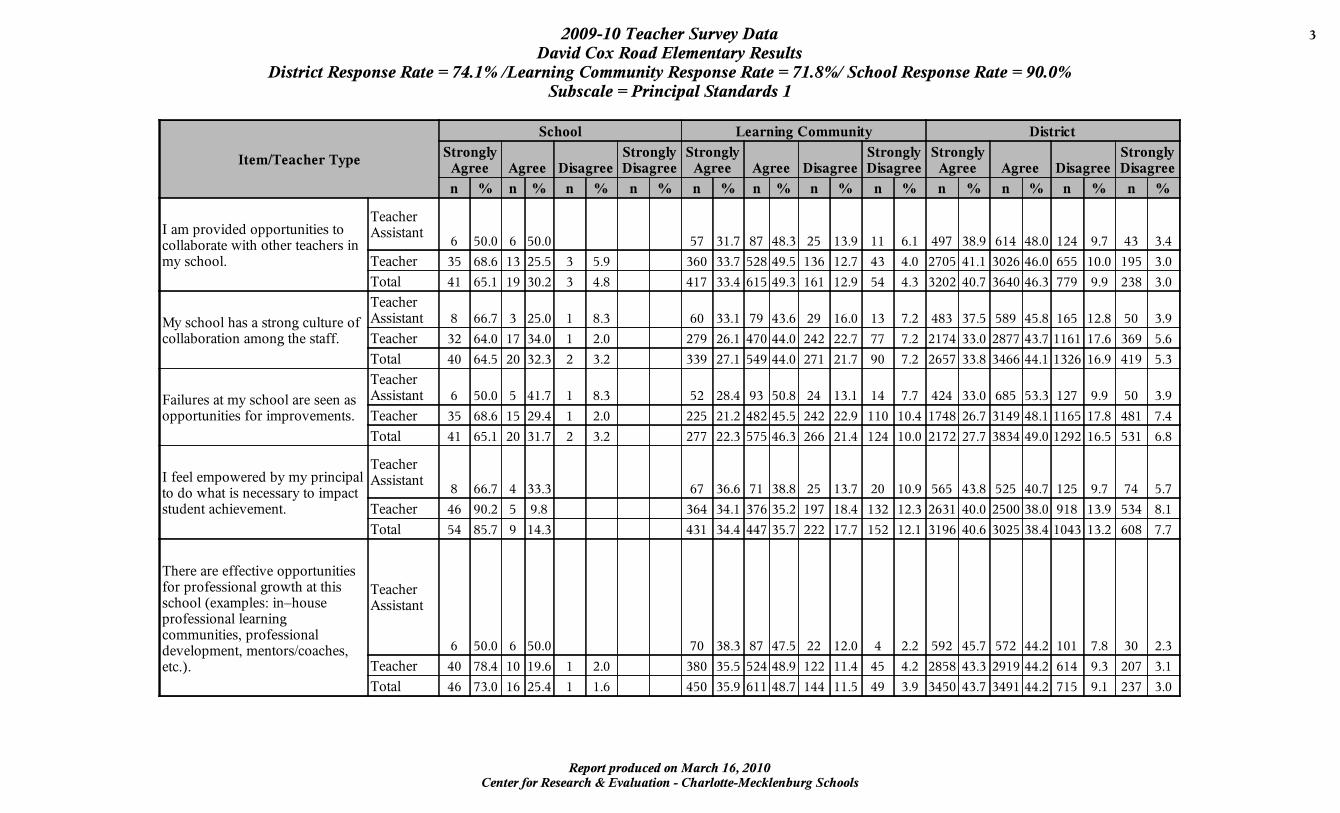
2009-10 Teacher Survey Data 3
David Cox Road Elementary ResultsD istrict Response Rate = 74.1% /Learning Community Response Rate = 71.8% / School Response Rate = 90.0%
Subscale = Principal Standards 1
I t e m /T e a c h e r T y p e
S c h o o l L e a r n in g C o m m u n it y D is t r ic t
S t r o n g lyA g r e e A g r e e D is a g r e e
S t r o n g lyD is a g r e e
S t r o n g lyA g r e e A g r e e D is a g r e e
S t r o n g lyD is a g r e e
S t r o n g lyA g r e e A g r e e D is a g r e e
S t r o n g lyD is a g r e e
n % n % n % n % n % n % n % n % n % n % n % n %
I a m p ro v id e d o p p o r tu n i t ie s toc o l la b o r a te w i th o th e r te a c h e r s inm y s c h o o l .
T e a c h e rA s s is ta n t
6 5 0 .0 6 5 0 .0 5 7 3 1 .7 8 7 4 8 .3 2 5 1 3 .9 1 1 6 .1 4 9 7 3 8 .9 6 1 4 4 8 .0 1 2 4 9 .7 4 3 3 .4
T e a c h e r 3 5 6 8 .6 1 3 2 5 .5 3 5 .9 3 6 0 3 3 .7 5 2 8 4 9 .5 1 3 6 1 2 .7 4 3 4 .0 2 7 0 5 4 1 .1 3 0 2 6 4 6 .0 6 5 5 1 0 .0 1 9 5 3 .0
T o ta l 4 1 6 5 .1 1 9 3 0 .2 3 4 .8 4 1 7 3 3 .4 6 1 5 4 9 .3 1 6 1 1 2 .9 5 4 4 .3 3 2 0 2 4 0 .7 3 6 4 0 4 6 .3 7 7 9 9 .9 2 3 8 3 .0
M y s c h o o l h a s a s t r o n g c u l tu r e o fc o l la b o r a t io n am o n g th e s ta f f .
T e a c h e rA s s is ta n t 8 6 6 .7 3 2 5 .0 1 8 .3 6 0 3 3 .1 7 9 4 3 .6 2 9 1 6 .0 1 3 7 .2 4 8 3 3 7 .5 5 8 9 4 5 .8 1 6 5 1 2 .8 5 0 3 .9
T e a c h e r 3 2 6 4 .0 1 7 3 4 .0 1 2 .0 2 7 9 2 6 .1 4 7 0 4 4 .0 2 4 2 2 2 .7 7 7 7 .2 2 1 7 4 3 3 .0 2 8 7 7 4 3 .7 1 1 6 1 1 7 .6 3 6 9 5 .6
T o ta l 4 0 6 4 .5 2 0 3 2 .3 2 3 .2 3 3 9 2 7 .1 5 4 9 4 4 .0 2 7 1 2 1 .7 9 0 7 .2 2 6 5 7 3 3 .8 3 4 6 6 4 4 .1 1 3 2 6 1 6 .9 4 1 9 5 .3
F a i lu r e s a t m y s c h o o l a r e s e e n a so p p o r tu n i t ie s f o r im p ro v em e n ts .
T e a c h e rA s s is ta n t 6 5 0 .0 5 4 1 .7 1 8 .3 5 2 2 8 .4 9 3 5 0 .8 2 4 1 3 .1 1 4 7 .7 4 2 4 3 3 .0 6 8 5 5 3 .3 1 2 7 9 .9 5 0 3 .9
T e a c h e r 3 5 6 8 .6 1 5 2 9 .4 1 2 .0 2 2 5 2 1 .2 4 8 2 4 5 .5 2 4 2 2 2 .9 1 1 0 1 0 .4 1 7 4 8 2 6 .7 3 1 4 9 4 8 .1 1 1 6 5 1 7 .8 4 8 1 7 .4
T o ta l 4 1 6 5 .1 2 0 3 1 .7 2 3 .2 2 7 7 2 2 .3 5 7 5 4 6 .3 2 6 6 2 1 .4 1 2 4 1 0 .0 2 1 7 2 2 7 .7 3 8 3 4 4 9 .0 1 2 9 2 1 6 .5 5 3 1 6 .8
I f e e l e m p o w e r e d b y m y p r in c ip a lto d o w h a t i s n e c e s s a r y to im p a c ts tu d e n t a c h ie v em e n t .
T e a c h e rA s s is ta n t
8 6 6 .7 4 3 3 .3 6 7 3 6 .6 7 1 3 8 .8 2 5 1 3 .7 2 0 1 0 .9 5 6 5 4 3 .8 5 2 5 4 0 .7 1 2 5 9 .7 7 4 5 .7
T e a c h e r 4 6 9 0 .2 5 9 .8 3 6 4 3 4 .1 3 7 6 3 5 .2 1 9 7 1 8 .4 1 3 2 1 2 .3 2 6 3 1 4 0 .0 2 5 0 0 3 8 .0 9 1 8 1 3 .9 5 3 4 8 .1
T o ta l 5 4 8 5 .7 9 1 4 .3 4 3 1 3 4 .4 4 4 7 3 5 .7 2 2 2 1 7 .7 1 5 2 1 2 .1 3 1 9 6 4 0 .6 3 0 2 5 3 8 .4 1 0 4 3 1 3 .2 6 0 8 7 .7
T h e r e a r e e f f e c t iv e o p p o r tu n i t ie sf o r p r o f e s s io n a l g r o w th a t th iss c h o o l ( e x am p le s : in – h o u s ep ro f e s s io n a l le a r n in gc o m m u n i t ie s , p r o f e s s io n a ld e v e lo p m e n t , m e n to r s /c o a c h e s ,e tc . ) .
T e a c h e rA s s is ta n t
6 5 0 .0 6 5 0 .0 7 0 3 8 .3 8 7 4 7 .5 2 2 1 2 .0 4 2 .2 5 9 2 4 5 .7 5 7 2 4 4 .2 1 0 1 7 .8 3 0 2 .3
T e a c h e r 4 0 7 8 .4 1 0 1 9 .6 1 2 .0 3 8 0 3 5 .5 5 2 4 4 8 .9 1 2 2 1 1 .4 4 5 4 .2 2 8 5 8 4 3 .3 2 9 1 9 4 4 .2 6 1 4 9 .3 2 0 7 3 .1
T o ta l 4 6 7 3 .0 1 6 2 5 .4 1 1 .6 4 5 0 3 5 .9 6 1 1 4 8 .7 1 4 4 1 1 .5 4 9 3 .9 3 4 5 0 4 3 .7 3 4 9 1 4 4 .2 7 1 5 9 .1 2 3 7 3 .0
Cen ter for Research & Evaluation - Charlotte-M eck lenburg SchoolsReport produced on M arch 16 , 2010
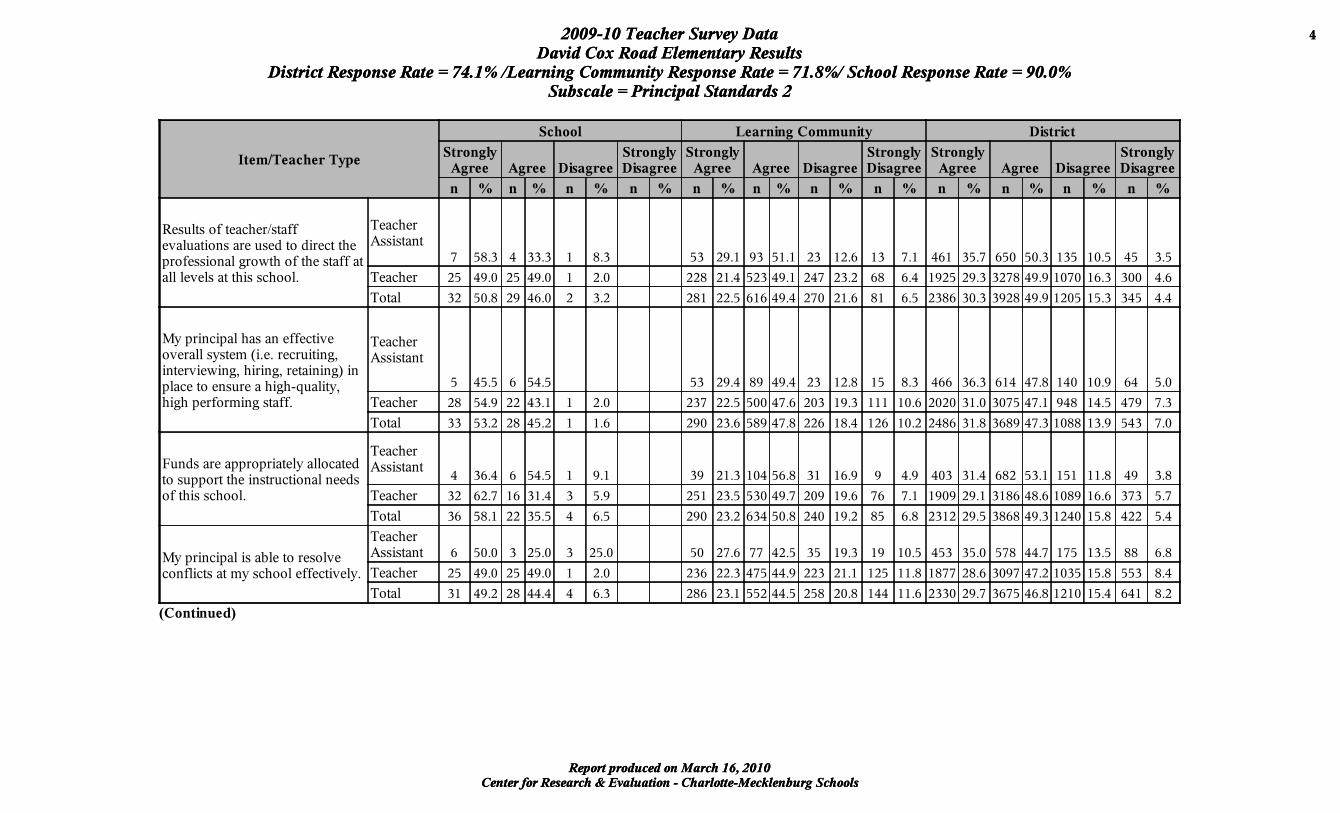
2009-10 Teacher Survey Data 4
David Cox Road Elementary ResultsD istrict Response Rate = 74.1% /Learning Community Response Rate = 71.8% / School Response Rate = 90.0%
Subscale = Principal Standards 2
Cen ter for Research & Evaluation - Charlotte-M eck lenburg SchoolsReport produced on M arch 16 , 2010
2009-10 Teacher Survey Data 4
David Cox Road Elementary ResultsD istrict Response Rate = 74.1% /Learning Community Response Rate = 71.8% / School Response Rate = 90.0%
Subscale = Principal Standards 2
I t e m /T e a c h e r T y p e
S c h o o l L e a r n in g C o m m u n it y D is t r ic t
S t r o n g lyA g r e e A g r e e D is a g r e e
S t r o n g lyD is a g r e e
S t r o n g lyA g r e e A g r e e D is a g r e e
S t r o n g lyD is a g r e e
S t r o n g lyA g r e e A g r e e D is a g r e e
S t r o n g lyD is a g r e e
n % n % n % n % n % n % n % n % n % n % n % n %
R e s u l ts o f te a c h e r /s ta f fe v a lu a t io n s a r e u s e d to d i r e c t th ep ro f e s s io n a l g r o w th o f th e s ta f f a ta l l le v e ls a t th is s c h o o l .
T e a c h e rA s s is ta n t
7 5 8 .3 4 3 3 .3 1 8 .3 5 3 2 9 .1 9 3 5 1 .1 2 3 1 2 .6 1 3 7 .1 4 6 1 3 5 .7 6 5 0 5 0 .3 1 3 5 1 0 .5 4 5 3 .5
T e a c h e r 2 5 4 9 .0 2 5 4 9 .0 1 2 .0 2 2 8 2 1 .4 5 2 3 4 9 .1 2 4 7 2 3 .2 6 8 6 .4 1 9 2 5 2 9 .3 3 2 7 8 4 9 .9 1 0 7 0 1 6 .3 3 0 0 4 .6
T o ta l 3 2 5 0 .8 2 9 4 6 .0 2 3 .2 2 8 1 2 2 .5 6 1 6 4 9 .4 2 7 0 2 1 .6 8 1 6 .5 2 3 8 6 3 0 .3 3 9 2 8 4 9 .9 1 2 0 5 1 5 .3 3 4 5 4 .4
M y p r in c ip a l h a s a n e f f e c t iv eo v e r a l l s y s tem ( i . e . r e c r u i t in g ,in te r v ie w in g , h i r in g , r e ta in in g ) inp la c e to e n s u r e a h ig h -q u a l i ty ,h ig h p e r f o rm in g s ta f f .
T e a c h e rA s s is ta n t
5 4 5 .5 6 5 4 .5 5 3 2 9 .4 8 9 4 9 .4 2 3 1 2 .8 1 5 8 .3 4 6 6 3 6 .3 6 1 4 4 7 .8 1 4 0 1 0 .9 6 4 5 .0
T e a c h e r 2 8 5 4 .9 2 2 4 3 .1 1 2 .0 2 3 7 2 2 .5 5 0 0 4 7 .6 2 0 3 1 9 .3 1 1 1 1 0 .6 2 0 2 0 3 1 .0 3 0 7 5 4 7 .1 9 4 8 1 4 .5 4 7 9 7 .3
T o ta l 3 3 5 3 .2 2 8 4 5 .2 1 1 .6 2 9 0 2 3 .6 5 8 9 4 7 .8 2 2 6 1 8 .4 1 2 6 1 0 .2 2 4 8 6 3 1 .8 3 6 8 9 4 7 .3 1 0 8 8 1 3 .9 5 4 3 7 .0
F u n d s a r e a p p ro p r ia te ly a l lo c a te dto s u p p o r t th e in s t r u c t io n a l n e e d so f th is s c h o o l .
T e a c h e rA s s is ta n t
4 3 6 .4 6 5 4 .5 1 9 .1 3 9 2 1 .3 1 0 4 5 6 .8 3 1 1 6 .9 9 4 .9 4 0 3 3 1 .4 6 8 2 5 3 .1 1 5 1 1 1 .8 4 9 3 .8
T e a c h e r 3 2 6 2 .7 1 6 3 1 .4 3 5 .9 2 5 1 2 3 .5 5 3 0 4 9 .7 2 0 9 1 9 .6 7 6 7 .1 1 9 0 9 2 9 .1 3 1 8 6 4 8 .6 1 0 8 9 1 6 .6 3 7 3 5 .7
T o ta l 3 6 5 8 .1 2 2 3 5 .5 4 6 .5 2 9 0 2 3 .2 6 3 4 5 0 .8 2 4 0 1 9 .2 8 5 6 .8 2 3 1 2 2 9 .5 3 8 6 8 4 9 .3 1 2 4 0 1 5 .8 4 2 2 5 .4
M y p r in c ip a l i s a b le to r e s o lv ec o n f l ic ts a t m y s c h o o l e f f e c t iv e ly .
T e a c h e rA s s is ta n t 6 5 0 .0 3 2 5 .0 3 2 5 .0 5 0 2 7 .6 7 7 4 2 .5 3 5 1 9 .3 1 9 1 0 .5 4 5 3 3 5 .0 5 7 8 4 4 .7 1 7 5 1 3 .5 8 8 6 .8
T e a c h e r 2 5 4 9 .0 2 5 4 9 .0 1 2 .0 2 3 6 2 2 .3 4 7 5 4 4 .9 2 2 3 2 1 .1 1 2 5 1 1 .8 1 8 7 7 2 8 .6 3 0 9 7 4 7 .2 1 0 3 5 1 5 .8 5 5 3 8 .4
T o ta l 3 1 4 9 .2 2 8 4 4 .4 4 6 .3 2 8 6 2 3 .1 5 5 2 4 4 .5 2 5 8 2 0 .8 1 4 4 1 1 .6 2 3 3 0 2 9 .7 3 6 7 5 4 6 .8 1 2 1 0 1 5 .4 6 4 1 8 .2
(C o n t in u e d )
Cen ter for Research & Evaluation - Charlotte-M eck lenburg SchoolsReport produced on M arch 16 , 2010
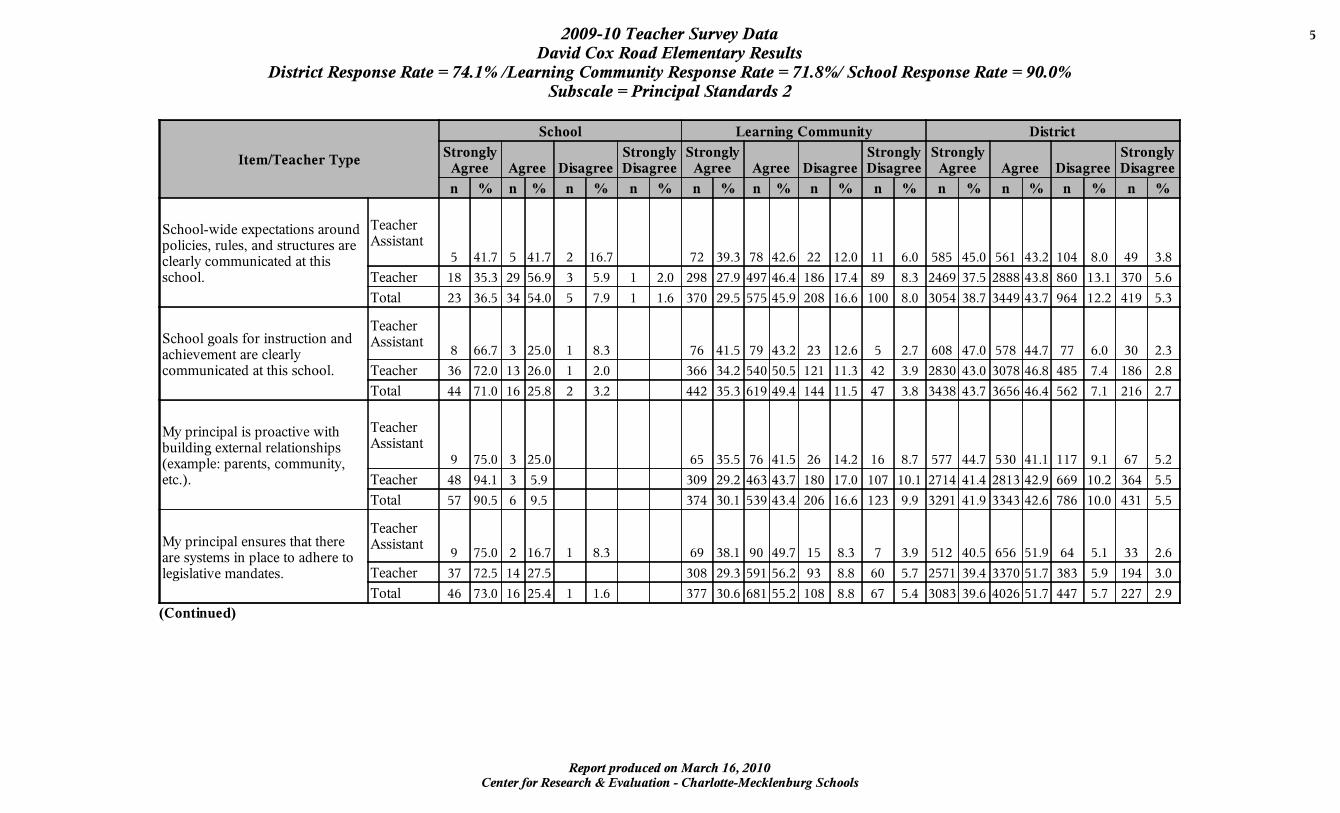
2009-10 Teacher Survey Data 5
David Cox Road Elementary ResultsD istrict Response Rate = 74.1% /Learning Community Response Rate = 71.8% / School Response Rate = 90.0%
Subscale = Principal Standards 2
I t e m /T e a c h e r T y p e
S c h o o l L e a r n in g C o m m u n it y D is t r ic t
S t r o n g lyA g r e e A g r e e D is a g r e e
S t r o n g lyD is a g r e e
S t r o n g lyA g r e e A g r e e D is a g r e e
S t r o n g lyD is a g r e e
S t r o n g lyA g r e e A g r e e D is a g r e e
S t r o n g lyD is a g r e e
n % n % n % n % n % n % n % n % n % n % n % n %
S c h o o l-w id e e x p e c ta t io n s a r o u n dp o l ic ie s , r u le s , a n d s t r u c tu r e s a r ec le a r ly c o m m u n ic a te d a t th iss c h o o l .
T e a c h e rA s s is ta n t
5 4 1 .7 5 4 1 .7 2 1 6 .7 7 2 3 9 .3 7 8 4 2 .6 2 2 1 2 .0 1 1 6 .0 5 8 5 4 5 .0 5 6 1 4 3 .2 1 0 4 8 .0 4 9 3 .8
T e a c h e r 1 8 3 5 .3 2 9 5 6 .9 3 5 .9 1 2 .0 2 9 8 2 7 .9 4 9 7 4 6 .4 1 8 6 1 7 .4 8 9 8 .3 2 4 6 9 3 7 .5 2 8 8 8 4 3 .8 8 6 0 1 3 .1 3 7 0 5 .6
T o ta l 2 3 3 6 .5 3 4 5 4 .0 5 7 .9 1 1 .6 3 7 0 2 9 .5 5 7 5 4 5 .9 2 0 8 1 6 .6 1 0 0 8 .0 3 0 5 4 3 8 .7 3 4 4 9 4 3 .7 9 6 4 1 2 .2 4 1 9 5 .3
S c h o o l g o a ls f o r in s t r u c t io n a n da c h ie v em e n t a r e c le a r lyc o m m u n ic a te d a t th is s c h o o l .
T e a c h e rA s s is ta n t
8 6 6 .7 3 2 5 .0 1 8 .3 7 6 4 1 .5 7 9 4 3 .2 2 3 1 2 .6 5 2 .7 6 0 8 4 7 .0 5 7 8 4 4 .7 7 7 6 .0 3 0 2 .3
T e a c h e r 3 6 7 2 .0 1 3 2 6 .0 1 2 .0 3 6 6 3 4 .2 5 4 0 5 0 .5 1 2 1 1 1 .3 4 2 3 .9 2 8 3 0 4 3 .0 3 0 7 8 4 6 .8 4 8 5 7 .4 1 8 6 2 .8
T o ta l 4 4 7 1 .0 1 6 2 5 .8 2 3 .2 4 4 2 3 5 .3 6 1 9 4 9 .4 1 4 4 1 1 .5 4 7 3 .8 3 4 3 8 4 3 .7 3 6 5 6 4 6 .4 5 6 2 7 .1 2 1 6 2 .7
M y p r in c ip a l i s p r o a c t iv e w i thb u i ld in g e x te r n a l r e la t io n s h ip s( e x am p le : p a r e n ts , c o m m u n i ty ,e tc . ) .
T e a c h e rA s s is ta n t
9 7 5 .0 3 2 5 .0 6 5 3 5 .5 7 6 4 1 .5 2 6 1 4 .2 1 6 8 .7 5 7 7 4 4 .7 5 3 0 4 1 .1 1 1 7 9 .1 6 7 5 .2
T e a c h e r 4 8 9 4 .1 3 5 .9 3 0 9 2 9 .2 4 6 3 4 3 .7 1 8 0 1 7 .0 1 0 7 1 0 .1 2 7 1 4 4 1 .4 2 8 1 3 4 2 .9 6 6 9 1 0 .2 3 6 4 5 .5
T o ta l 5 7 9 0 .5 6 9 .5 3 7 4 3 0 .1 5 3 9 4 3 .4 2 0 6 1 6 .6 1 2 3 9 .9 3 2 9 1 4 1 .9 3 3 4 3 4 2 .6 7 8 6 1 0 .0 4 3 1 5 .5
M y p r in c ip a l e n s u r e s th a t th e r ea r e s y s tem s in p la c e to a d h e r e tole g is la t iv e m a n d a te s .
T e a c h e rA s s is ta n t
9 7 5 .0 2 1 6 .7 1 8 .3 6 9 3 8 .1 9 0 4 9 .7 1 5 8 .3 7 3 .9 5 1 2 4 0 .5 6 5 6 5 1 .9 6 4 5 .1 3 3 2 .6
T e a c h e r 3 7 7 2 .5 1 4 2 7 .5 3 0 8 2 9 .3 5 9 1 5 6 .2 9 3 8 .8 6 0 5 .7 2 5 7 1 3 9 .4 3 3 7 0 5 1 .7 3 8 3 5 .9 1 9 4 3 .0
T o ta l 4 6 7 3 .0 1 6 2 5 .4 1 1 .6 3 7 7 3 0 .6 6 8 1 5 5 .2 1 0 8 8 .8 6 7 5 .4 3 0 8 3 3 9 .6 4 0 2 6 5 1 .7 4 4 7 5 .7 2 2 7 2 .9
(C o n t in u e d )
Cen ter for Research & Evaluation - Charlotte-M eck lenburg SchoolsReport produced on M arch 16 , 2010
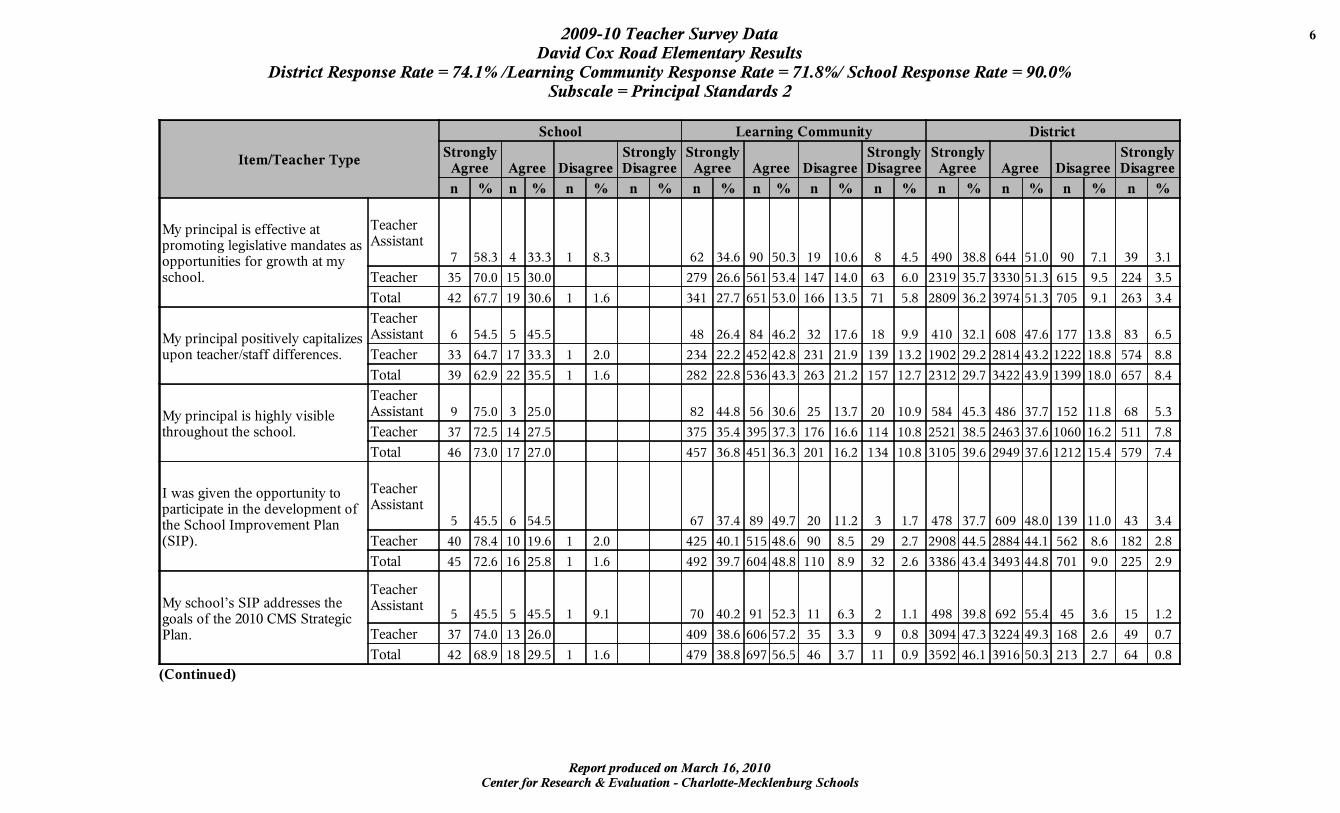
2009-10 Teacher Survey Data 6
David Cox Road Elementary ResultsD istrict Response Rate = 74.1% /Learning Community Response Rate = 71.8% / School Response Rate = 90.0%
Subscale = Principal Standards 2
I t e m /T e a c h e r T y p e
S c h o o l L e a r n in g C o m m u n it y D is t r ic t
S t r o n g lyA g r e e A g r e e D is a g r e e
S t r o n g lyD is a g r e e
S t r o n g lyA g r e e A g r e e D is a g r e e
S t r o n g lyD is a g r e e
S t r o n g lyA g r e e A g r e e D is a g r e e
S t r o n g lyD is a g r e e
n % n % n % n % n % n % n % n % n % n % n % n %
M y p r in c ip a l i s e f f e c t iv e a tp r o m o t in g le g is la t iv e m a n d a te s a so p p o r tu n i t ie s f o r g r o w th a t m ys c h o o l .
T e a c h e rA s s is ta n t
7 5 8 .3 4 3 3 .3 1 8 .3 6 2 3 4 .6 9 0 5 0 .3 1 9 1 0 .6 8 4 .5 4 9 0 3 8 .8 6 4 4 5 1 .0 9 0 7 .1 3 9 3 .1
T e a c h e r 3 5 7 0 .0 1 5 3 0 .0 2 7 9 2 6 .6 5 6 1 5 3 .4 1 4 7 1 4 .0 6 3 6 .0 2 3 1 9 3 5 .7 3 3 3 0 5 1 .3 6 1 5 9 .5 2 2 4 3 .5
T o ta l 4 2 6 7 .7 1 9 3 0 .6 1 1 .6 3 4 1 2 7 .7 6 5 1 5 3 .0 1 6 6 1 3 .5 7 1 5 .8 2 8 0 9 3 6 .2 3 9 7 4 5 1 .3 7 0 5 9 .1 2 6 3 3 .4
M y p r in c ip a l p o s i t iv e ly c a p i ta l i z e su p o n te a c h e r /s ta f f d i f f e r e n c e s .
T e a c h e rA s s is ta n t 6 5 4 .5 5 4 5 .5 4 8 2 6 .4 8 4 4 6 .2 3 2 1 7 .6 1 8 9 .9 4 1 0 3 2 .1 6 0 8 4 7 .6 1 7 7 1 3 .8 8 3 6 .5
T e a c h e r 3 3 6 4 .7 1 7 3 3 .3 1 2 .0 2 3 4 2 2 .2 4 5 2 4 2 .8 2 3 1 2 1 .9 1 3 9 1 3 .2 1 9 0 2 2 9 .2 2 8 1 4 4 3 .2 1 2 2 2 1 8 .8 5 7 4 8 .8
T o ta l 3 9 6 2 .9 2 2 3 5 .5 1 1 .6 2 8 2 2 2 .8 5 3 6 4 3 .3 2 6 3 2 1 .2 1 5 7 1 2 .7 2 3 1 2 2 9 .7 3 4 2 2 4 3 .9 1 3 9 9 1 8 .0 6 5 7 8 .4
M y p r in c ip a l i s h ig h ly v is ib leth r o u g h o u t th e s c h o o l .
T e a c h e rA s s is ta n t 9 7 5 .0 3 2 5 .0 8 2 4 4 .8 5 6 3 0 .6 2 5 1 3 .7 2 0 1 0 .9 5 8 4 4 5 .3 4 8 6 3 7 .7 1 5 2 1 1 .8 6 8 5 .3
T e a c h e r 3 7 7 2 .5 1 4 2 7 .5 3 7 5 3 5 .4 3 9 5 3 7 .3 1 7 6 1 6 .6 1 1 4 1 0 .8 2 5 2 1 3 8 .5 2 4 6 3 3 7 .6 1 0 6 0 1 6 .2 5 1 1 7 .8
T o ta l 4 6 7 3 .0 1 7 2 7 .0 4 5 7 3 6 .8 4 5 1 3 6 .3 2 0 1 1 6 .2 1 3 4 1 0 .8 3 1 0 5 3 9 .6 2 9 4 9 3 7 .6 1 2 1 2 1 5 .4 5 7 9 7 .4
I w a s g iv e n th e o p p o r tu n i ty top a r t ic ip a te in th e d e v e lo p m e n t o fth e S c h o o l Im p ro v em e n t P la n(S IP ) .
T e a c h e rA s s is ta n t
5 4 5 .5 6 5 4 .5 6 7 3 7 .4 8 9 4 9 .7 2 0 1 1 .2 3 1 .7 4 7 8 3 7 .7 6 0 9 4 8 .0 1 3 9 1 1 .0 4 3 3 .4
T e a c h e r 4 0 7 8 .4 1 0 1 9 .6 1 2 .0 4 2 5 4 0 .1 5 1 5 4 8 .6 9 0 8 .5 2 9 2 .7 2 9 0 8 4 4 .5 2 8 8 4 4 4 .1 5 6 2 8 .6 1 8 2 2 .8
T o ta l 4 5 7 2 .6 1 6 2 5 .8 1 1 .6 4 9 2 3 9 .7 6 0 4 4 8 .8 1 1 0 8 .9 3 2 2 .6 3 3 8 6 4 3 .4 3 4 9 3 4 4 .8 7 0 1 9 .0 2 2 5 2 .9
M y s c h o o l ’ s S IP a d d r e s s e s th eg o a ls o f th e 2 0 1 0 C M S S tr a te g icP la n .
T e a c h e rA s s is ta n t
5 4 5 .5 5 4 5 .5 1 9 .1 7 0 4 0 .2 9 1 5 2 .3 1 1 6 .3 2 1 .1 4 9 8 3 9 .8 6 9 2 5 5 .4 4 5 3 .6 1 5 1 .2
T e a c h e r 3 7 7 4 .0 1 3 2 6 .0 4 0 9 3 8 .6 6 0 6 5 7 .2 3 5 3 .3 9 0 .8 3 0 9 4 4 7 .3 3 2 2 4 4 9 .3 1 6 8 2 .6 4 9 0 .7
T o ta l 4 2 6 8 .9 1 8 2 9 .5 1 1 .6 4 7 9 3 8 .8 6 9 7 5 6 .5 4 6 3 .7 1 1 0 .9 3 5 9 2 4 6 .1 3 9 1 6 5 0 .3 2 1 3 2 .7 6 4 0 .8
(C o n t in u e d )
Cen ter for Research & Evaluation - Charlotte-M eck lenburg SchoolsReport produced on M arch 16 , 2010
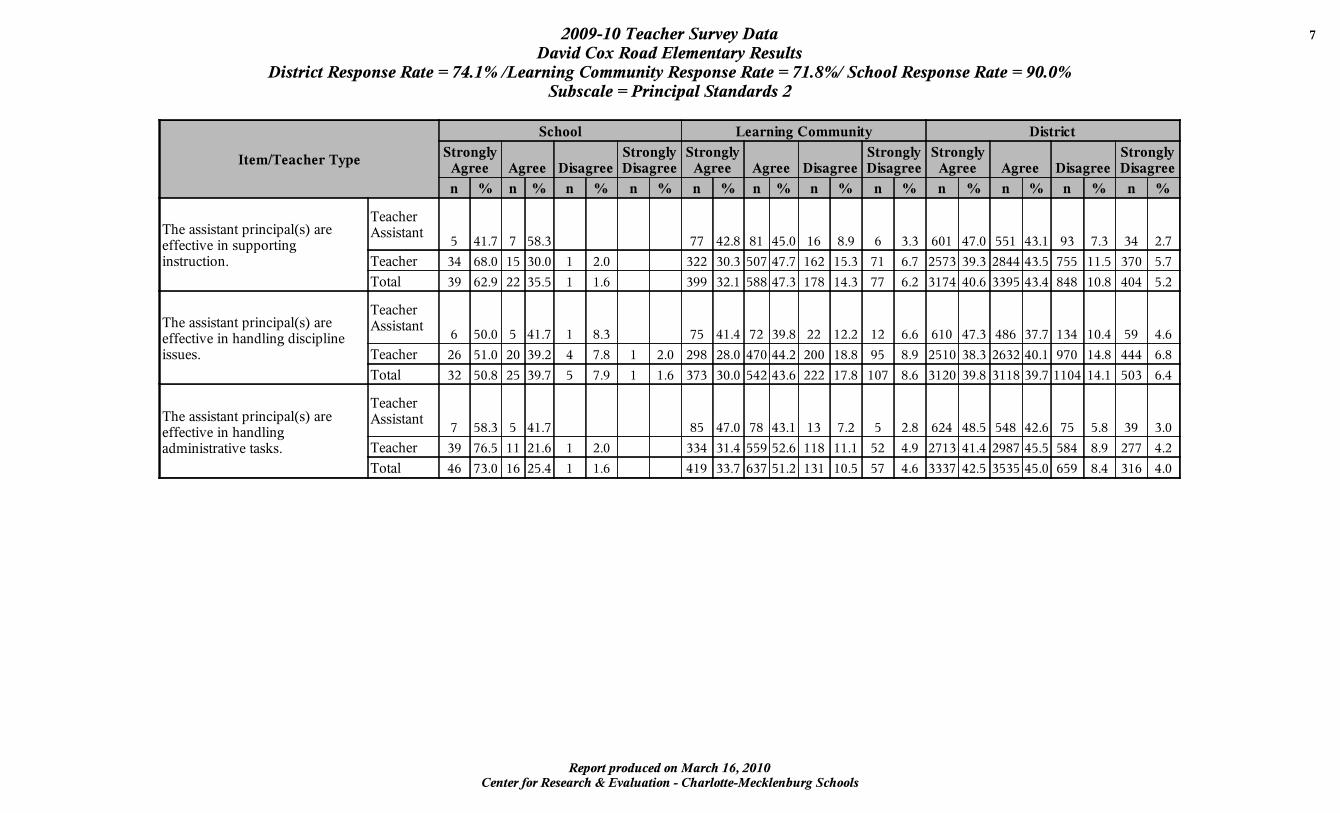
2009-10 Teacher Survey Data 7
David Cox Road Elementary ResultsD istrict Response Rate = 74.1% /Learning Community Response Rate = 71.8% / School Response Rate = 90.0%
Subscale = Principal Standards 2
I t e m /T e a c h e r T y p e
S c h o o l L e a r n in g C o m m u n it y D is t r ic t
S t r o n g lyA g r e e A g r e e D is a g r e e
S t r o n g lyD is a g r e e
S t r o n g lyA g r e e A g r e e D is a g r e e
S t r o n g lyD is a g r e e
S t r o n g lyA g r e e A g r e e D is a g r e e
S t r o n g lyD is a g r e e
n % n % n % n % n % n % n % n % n % n % n % n %
T h e a s s is ta n t p r in c ip a l( s ) a r ee f f e c t iv e in s u p p o r t in gin s t r u c t io n .
T e a c h e rA s s is ta n t
5 4 1 .7 7 5 8 .3 7 7 4 2 .8 8 1 4 5 .0 1 6 8 .9 6 3 .3 6 0 1 4 7 .0 5 5 1 4 3 .1 9 3 7 .3 3 4 2 .7
T e a c h e r 3 4 6 8 .0 1 5 3 0 .0 1 2 .0 3 2 2 3 0 .3 5 0 7 4 7 .7 1 6 2 1 5 .3 7 1 6 .7 2 5 7 3 3 9 .3 2 8 4 4 4 3 .5 7 5 5 1 1 .5 3 7 0 5 .7
T o ta l 3 9 6 2 .9 2 2 3 5 .5 1 1 .6 3 9 9 3 2 .1 5 8 8 4 7 .3 1 7 8 1 4 .3 7 7 6 .2 3 1 7 4 4 0 .6 3 3 9 5 4 3 .4 8 4 8 1 0 .8 4 0 4 5 .2
T h e a s s is ta n t p r in c ip a l( s ) a r ee f f e c t iv e in h a n d l in g d is c ip l in eis s u e s .
T e a c h e rA s s is ta n t
6 5 0 .0 5 4 1 .7 1 8 .3 7 5 4 1 .4 7 2 3 9 .8 2 2 1 2 .2 1 2 6 .6 6 1 0 4 7 .3 4 8 6 3 7 .7 1 3 4 1 0 .4 5 9 4 .6
T e a c h e r 2 6 5 1 .0 2 0 3 9 .2 4 7 .8 1 2 .0 2 9 8 2 8 .0 4 7 0 4 4 .2 2 0 0 1 8 .8 9 5 8 .9 2 5 1 0 3 8 .3 2 6 3 2 4 0 .1 9 7 0 1 4 .8 4 4 4 6 .8
T o ta l 3 2 5 0 .8 2 5 3 9 .7 5 7 .9 1 1 .6 3 7 3 3 0 .0 5 4 2 4 3 .6 2 2 2 1 7 .8 1 0 7 8 .6 3 1 2 0 3 9 .8 3 1 1 8 3 9 .7 1 1 0 4 1 4 .1 5 0 3 6 .4
T h e a s s is ta n t p r in c ip a l( s ) a r ee f f e c t iv e in h a n d l in ga d m in is t r a t iv e ta s k s .
T e a c h e rA s s is ta n t
7 5 8 .3 5 4 1 .7 8 5 4 7 .0 7 8 4 3 .1 1 3 7 .2 5 2 .8 6 2 4 4 8 .5 5 4 8 4 2 .6 7 5 5 .8 3 9 3 .0
T e a c h e r 3 9 7 6 .5 1 1 2 1 .6 1 2 .0 3 3 4 3 1 .4 5 5 9 5 2 .6 1 1 8 1 1 .1 5 2 4 .9 2 7 1 3 4 1 .4 2 9 8 7 4 5 .5 5 8 4 8 .9 2 7 7 4 .2
T o ta l 4 6 7 3 .0 1 6 2 5 .4 1 1 .6 4 1 9 3 3 .7 6 3 7 5 1 .2 1 3 1 1 0 .5 5 7 4 .6 3 3 3 7 4 2 .5 3 5 3 5 4 5 .0 6 5 9 8 .4 3 1 6 4 .0
Cen ter for Research & Evaluation - Charlotte-M eck lenburg SchoolsReport produced on M arch 16 , 2010
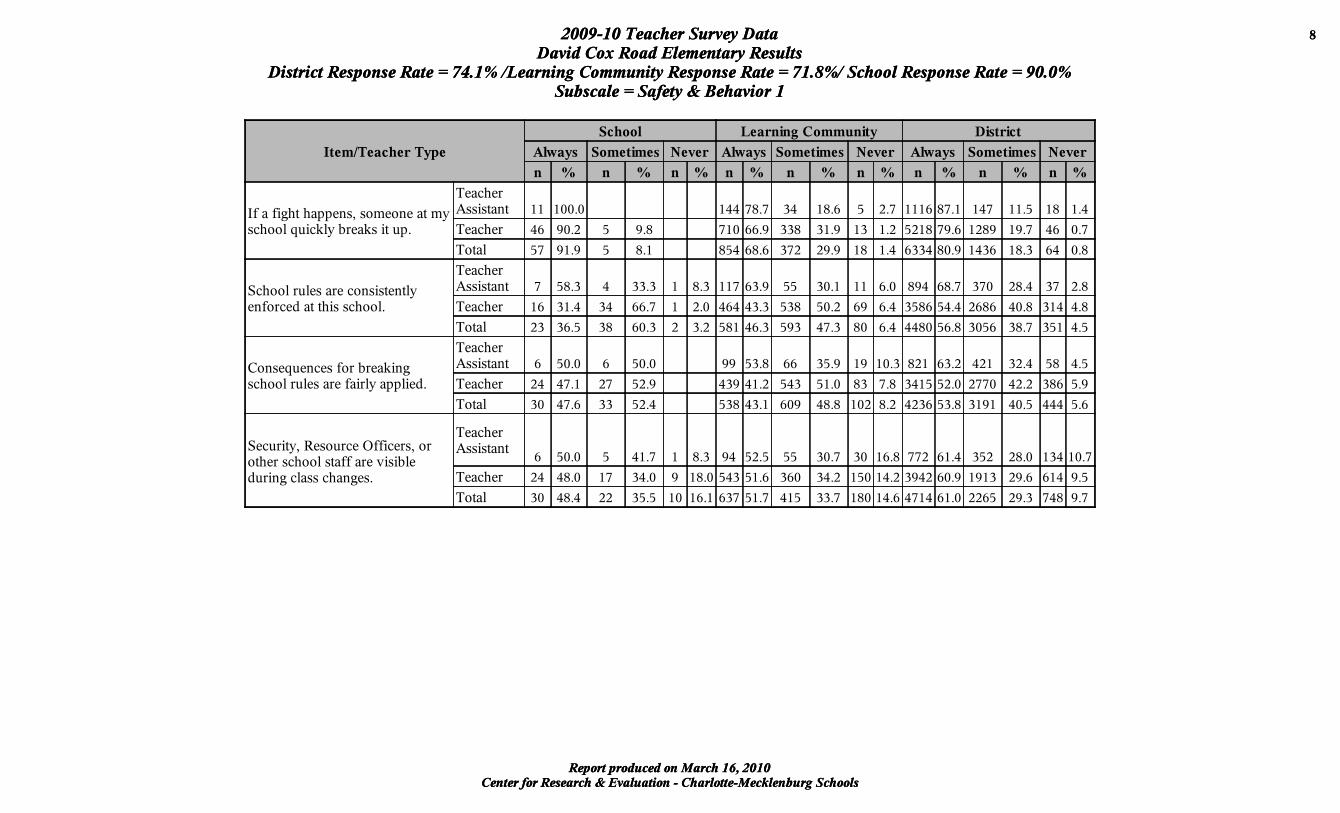
2009-10 Teacher Survey Data 8
David Cox Road Elementary ResultsD istrict Response Rate = 74.1% /Learning Community Response Rate = 71.8% / School Response Rate = 90.0%
Subscale = Safety & Behavior 1
Cen ter for Research & Evaluation - Charlotte-M eck lenburg SchoolsReport produced on M arch 16 , 2010
2009-10 Teacher Survey Data 8
David Cox Road Elementary ResultsD istrict Response Rate = 74.1% /Learning Community Response Rate = 71.8% / School Response Rate = 90.0%
Subscale = Safety & Behavior 1
I t e m /T e a c h e r T y p e
S c h o o l L e a r n in g C o m m u n it y D is t r ic t
A lw a y s S o m e t im e s N e v e r A lw a y s S o m e t im e s N e v e r A lw a y s S o m e t im e s N e v e r
n % n % n % n % n % n % n % n % n %
I f a f ig h t h a p p e n s , s o m e o n e a t m ys c h o o l q u ic k ly b r e a k s i t u p .
T e a c h e rA s s is ta n t 1 1 1 0 0 .0 1 4 4 7 8 .7 3 4 1 8 .6 5 2 .7 1 1 1 6 8 7 .1 1 4 7 1 1 .5 1 8 1 .4
T e a c h e r 4 6 9 0 .2 5 9 .8 7 1 0 6 6 .9 3 3 8 3 1 .9 1 3 1 .2 5 2 1 8 7 9 .6 1 2 8 9 1 9 .7 4 6 0 .7
T o ta l 5 7 9 1 .9 5 8 .1 8 5 4 6 8 .6 3 7 2 2 9 .9 1 8 1 .4 6 3 3 4 8 0 .9 1 4 3 6 1 8 .3 6 4 0 .8
S c h o o l r u le s a r e c o n s is te n t lye n fo r c e d a t th is s c h o o l .
T e a c h e rA s s is ta n t 7 5 8 .3 4 3 3 .3 1 8 .3 1 1 7 6 3 .9 5 5 3 0 .1 1 1 6 .0 8 9 4 6 8 .7 3 7 0 2 8 .4 3 7 2 .8
T e a c h e r 1 6 3 1 .4 3 4 6 6 .7 1 2 .0 4 6 4 4 3 .3 5 3 8 5 0 .2 6 9 6 .4 3 5 8 6 5 4 .4 2 6 8 6 4 0 .8 3 1 4 4 .8
T o ta l 2 3 3 6 .5 3 8 6 0 .3 2 3 .2 5 8 1 4 6 .3 5 9 3 4 7 .3 8 0 6 .4 4 4 8 0 5 6 .8 3 0 5 6 3 8 .7 3 5 1 4 .5
C o n s e q u e n c e s f o r b r e a k in gs c h o o l r u le s a r e f a i r ly a p p l ie d .
T e a c h e rA s s is ta n t 6 5 0 .0 6 5 0 .0 9 9 5 3 .8 6 6 3 5 .9 1 9 1 0 .3 8 2 1 6 3 .2 4 2 1 3 2 .4 5 8 4 .5
T e a c h e r 2 4 4 7 .1 2 7 5 2 .9 4 3 9 4 1 .2 5 4 3 5 1 .0 8 3 7 .8 3 4 1 5 5 2 .0 2 7 7 0 4 2 .2 3 8 6 5 .9
T o ta l 3 0 4 7 .6 3 3 5 2 .4 5 3 8 4 3 .1 6 0 9 4 8 .8 1 0 2 8 .2 4 2 3 6 5 3 .8 3 1 9 1 4 0 .5 4 4 4 5 .6
S e c u r i ty , R e s o u r c e O f f ic e r s , o ro th e r s c h o o l s ta f f a r e v is ib led u r in g c la s s c h a n g e s .
T e a c h e rA s s is ta n t
6 5 0 .0 5 4 1 .7 1 8 .3 9 4 5 2 .5 5 5 3 0 .7 3 0 1 6 .8 7 7 2 6 1 .4 3 5 2 2 8 .0 1 3 4 1 0 .7
T e a c h e r 2 4 4 8 .0 1 7 3 4 .0 9 1 8 .0 5 4 3 5 1 .6 3 6 0 3 4 .2 1 5 0 1 4 .2 3 9 4 2 6 0 .9 1 9 1 3 2 9 .6 6 1 4 9 .5
T o ta l 3 0 4 8 .4 2 2 3 5 .5 1 0 1 6 .1 6 3 7 5 1 .7 4 1 5 3 3 .7 1 8 0 1 4 .6 4 7 1 4 6 1 .0 2 2 6 5 2 9 .3 7 4 8 9 .7
Cen ter for Research & Evaluation - Charlotte-M eck lenburg SchoolsReport produced on M arch 16 , 2010
2009-10 Teacher Survey Data 9
David Cox Road Elementary ResultsD istrict Response Rate = 74.1% /Learning Community Response Rate = 71.8% / School Response Rate = 90.0%
Subscale = Safety & Behavior 2
I t e m /T e a c h e r T y p e
S c h o o l L e a r n in g C o m m u n it y D is t r ic t
S t r o n g lyA g r e e A g r e e D is a g r e e
S t r o n g lyD is a g r e e
N o tS u r e
S t r o n g lyA g r e e A g r e e D is a g r e e
S t r o n g lyD is a g r e e
S t r o n g lyA g r e e A g r e e D is a g r e e
S t r o n g lyD is a g r e e
n % n % n % n % n % n % n % n % n % n % n % n % n %
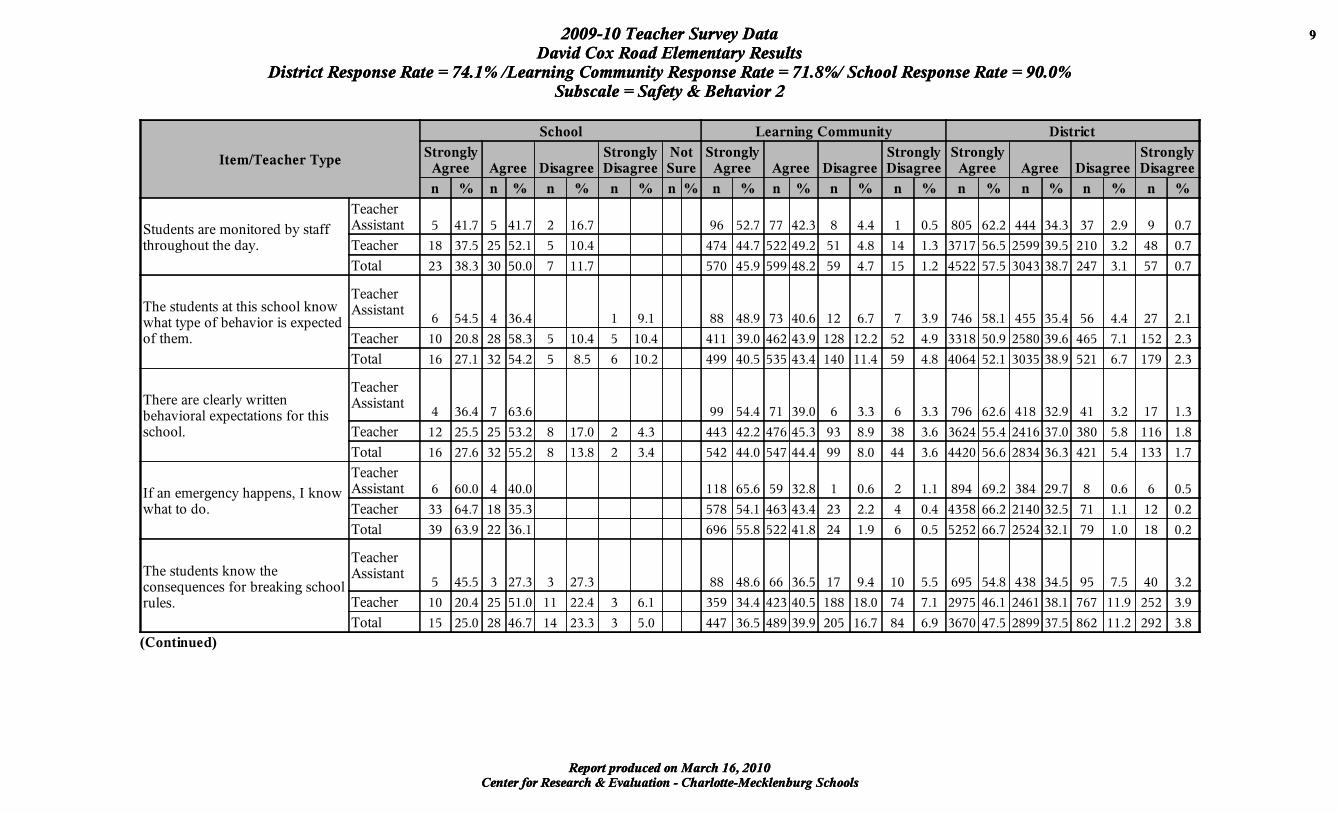
S tu d e n ts a r e m o n i to r e d b y s ta f fth r o u g h o u t th e d a y .
T e a c h e rA s s is ta n t 5 4 1 .7 5 4 1 .7 2 1 6 .7 9 6 5 2 .7 7 7 4 2 .3 8 4 .4 1 0 .5 8 0 5 6 2 .2 4 4 4 3 4 .3 3 7 2 .9 9 0 .7
T e a c h e r 1 8 3 7 .5 2 5 5 2 .1 5 1 0 .4 4 7 4 4 4 .7 5 2 2 4 9 .2 5 1 4 .8 1 4 1 .3 3 7 1 7 5 6 .5 2 5 9 9 3 9 .5 2 1 0 3 .2 4 8 0 .7
T o ta l 2 3 3 8 .3 3 0 5 0 .0 7 1 1 .7 5 7 0 4 5 .9 5 9 9 4 8 .2 5 9 4 .7 1 5 1 .2 4 5 2 2 5 7 .5 3 0 4 3 3 8 .7 2 4 7 3 .1 5 7 0 .7
T h e s tu d e n ts a t th is s c h o o l k n o ww h a t ty p e o f b e h a v io r i s e x p e c te do f th em .
T e a c h e rA s s is ta n t
6 5 4 .5 4 3 6 .4 1 9 .1 8 8 4 8 .9 7 3 4 0 .6 1 2 6 .7 7 3 .9 7 4 6 5 8 .1 4 5 5 3 5 .4 5 6 4 .4 2 7 2 .1
T e a c h e r 1 0 2 0 .8 2 8 5 8 .3 5 1 0 .4 5 1 0 .4 4 1 1 3 9 .0 4 6 2 4 3 .9 1 2 8 1 2 .2 5 2 4 .9 3 3 1 8 5 0 .9 2 5 8 0 3 9 .6 4 6 5 7 .1 1 5 2 2 .3
T o ta l 1 6 2 7 .1 3 2 5 4 .2 5 8 .5 6 1 0 .2 4 9 9 4 0 .5 5 3 5 4 3 .4 1 4 0 1 1 .4 5 9 4 .8 4 0 6 4 5 2 .1 3 0 3 5 3 8 .9 5 2 1 6 .7 1 7 9 2 .3
T h e r e a r e c le a r ly w r i t te nb e h a v io r a l e x p e c ta t io n s f o r th iss c h o o l .
T e a c h e rA s s is ta n t
4 3 6 .4 7 6 3 .6 9 9 5 4 .4 7 1 3 9 .0 6 3 .3 6 3 .3 7 9 6 6 2 .6 4 1 8 3 2 .9 4 1 3 .2 1 7 1 .3
T e a c h e r 1 2 2 5 .5 2 5 5 3 .2 8 1 7 .0 2 4 .3 4 4 3 4 2 .2 4 7 6 4 5 .3 9 3 8 .9 3 8 3 .6 3 6 2 4 5 5 .4 2 4 1 6 3 7 .0 3 8 0 5 .8 1 1 6 1 .8
T o ta l 1 6 2 7 .6 3 2 5 5 .2 8 1 3 .8 2 3 .4 5 4 2 4 4 .0 5 4 7 4 4 .4 9 9 8 .0 4 4 3 .6 4 4 2 0 5 6 .6 2 8 3 4 3 6 .3 4 2 1 5 .4 1 3 3 1 .7
I f a n em e r g e n c y h a p p e n s , I k n o ww h a t to d o .
T e a c h e rA s s is ta n t 6 6 0 .0 4 4 0 .0 1 1 8 6 5 .6 5 9 3 2 .8 1 0 .6 2 1 .1 8 9 4 6 9 .2 3 8 4 2 9 .7 8 0 .6 6 0 .5
T e a c h e r 3 3 6 4 .7 1 8 3 5 .3 5 7 8 5 4 .1 4 6 3 4 3 .4 2 3 2 .2 4 0 .4 4 3 5 8 6 6 .2 2 1 4 0 3 2 .5 7 1 1 .1 1 2 0 .2
T o ta l 3 9 6 3 .9 2 2 3 6 .1 6 9 6 5 5 .8 5 2 2 4 1 .8 2 4 1 .9 6 0 .5 5 2 5 2 6 6 .7 2 5 2 4 3 2 .1 7 9 1 .0 1 8 0 .2
T h e s tu d e n ts k n o w th ec o n s e q u e n c e s f o r b r e a k in g s c h o o lr u le s .
T e a c h e rA s s is ta n t
5 4 5 .5 3 2 7 .3 3 2 7 .3 8 8 4 8 .6 6 6 3 6 .5 1 7 9 .4 1 0 5 .5 6 9 5 5 4 .8 4 3 8 3 4 .5 9 5 7 .5 4 0 3 .2
T e a c h e r 1 0 2 0 .4 2 5 5 1 .0 1 1 2 2 .4 3 6 .1 3 5 9 3 4 .4 4 2 3 4 0 .5 1 8 8 1 8 .0 7 4 7 .1 2 9 7 5 4 6 .1 2 4 6 1 3 8 .1 7 6 7 1 1 .9 2 5 2 3 .9
T o ta l 1 5 2 5 .0 2 8 4 6 .7 1 4 2 3 .3 3 5 .0 4 4 7 3 6 .5 4 8 9 3 9 .9 2 0 5 1 6 .7 8 4 6 .9 3 6 7 0 4 7 .5 2 8 9 9 3 7 .5 8 6 2 1 1 .2 2 9 2 3 .8
(C o n t in u e d )
Cen ter for Research & Evaluation - Charlotte-M eck lenburg SchoolsReport produced on M arch 16 , 2010
2009-10 Teacher Survey Data 1 0
David Cox Road Elementary ResultsD istrict Response Rate = 74.1% /Learning Community Response Rate = 71.8% / School Response Rate = 90.0%
Subscale = Safety & Behavior 2
I t e m /T e a c h e r T y p e
S c h o o l L e a r n in g C o m m u n it y D is t r ic t
S t r o n g lyA g r e e A g r e e D is a g r e e
S t r o n g lyD is a g r e e
N o tS u r e
S t r o n g lyA g r e e A g r e e D is a g r e e
S t r o n g lyD is a g r e e
S t r o n g lyA g r e e A g r e e D is a g r e e
S t r o n g lyD is a g r e e
n % n % n % n % n % n % n % n % n % n % n % n % n %
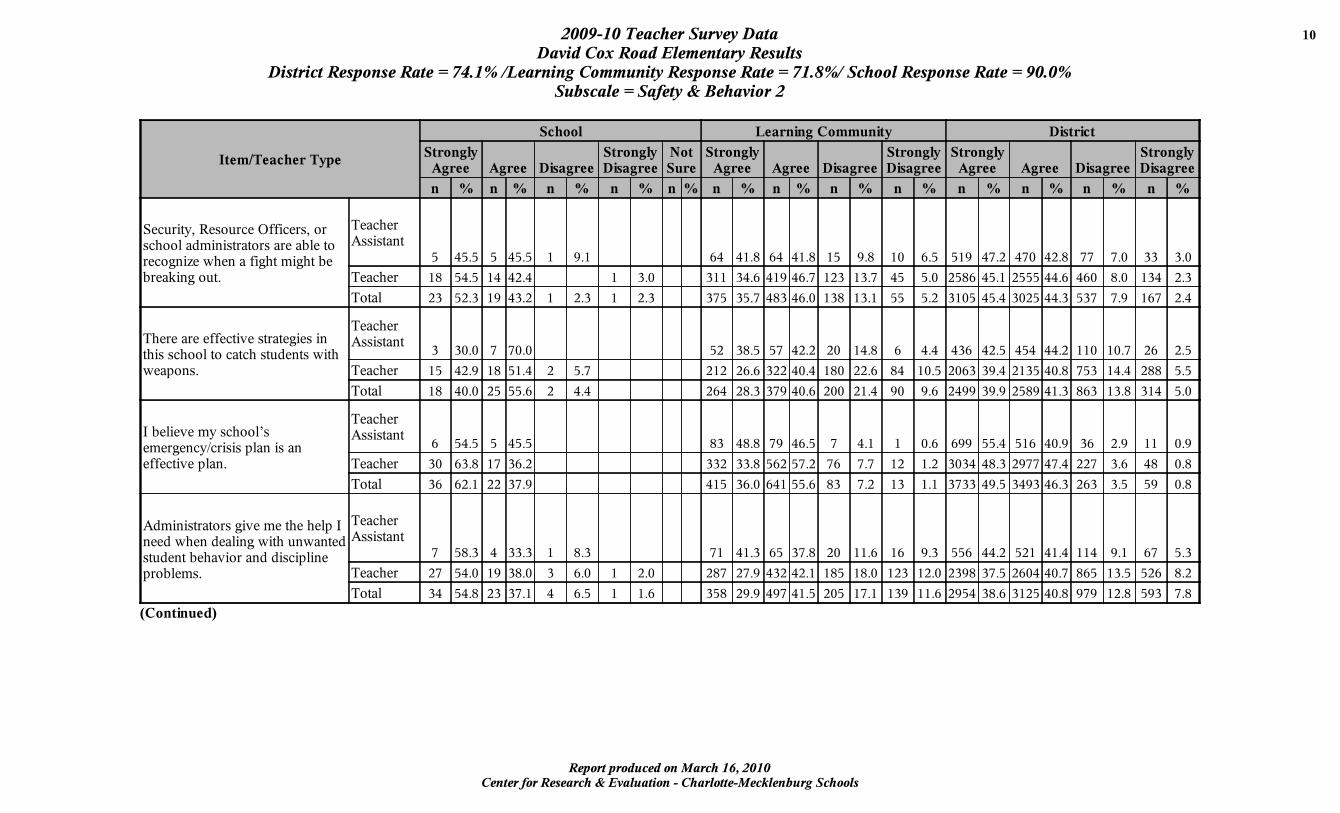
S e c u r i ty , R e s o u r c e O f f ic e r s , o rs c h o o l a d m in is t r a to r s a r e a b le tor e c o g n iz e w h e n a f ig h t m ig h t b eb r e a k in g o u t .
T e a c h e rA s s is ta n t
5 4 5 .5 5 4 5 .5 1 9 .1 6 4 4 1 .8 6 4 4 1 .8 1 5 9 .8 1 0 6 .5 5 1 9 4 7 .2 4 7 0 4 2 .8 7 7 7 .0 3 3 3 .0
T e a c h e r 1 8 5 4 .5 1 4 4 2 .4 1 3 .0 3 1 1 3 4 .6 4 1 9 4 6 .7 1 2 3 1 3 .7 4 5 5 .0 2 5 8 6 4 5 .1 2 5 5 5 4 4 .6 4 6 0 8 .0 1 3 4 2 .3
T o ta l 2 3 5 2 .3 1 9 4 3 .2 1 2 .3 1 2 .3 3 7 5 3 5 .7 4 8 3 4 6 .0 1 3 8 1 3 .1 5 5 5 .2 3 1 0 5 4 5 .4 3 0 2 5 4 4 .3 5 3 7 7 .9 1 6 7 2 .4
T h e r e a r e e f f e c t iv e s t r a te g ie s inth is s c h o o l to c a tc h s tu d e n ts w i thw e a p o n s .
T e a c h e rA s s is ta n t
3 3 0 .0 7 7 0 .0 5 2 3 8 .5 5 7 4 2 .2 2 0 1 4 .8 6 4 .4 4 3 6 4 2 .5 4 5 4 4 4 .2 1 1 0 1 0 .7 2 6 2 .5
T e a c h e r 1 5 4 2 .9 1 8 5 1 .4 2 5 .7 2 1 2 2 6 .6 3 2 2 4 0 .4 1 8 0 2 2 .6 8 4 1 0 .5 2 0 6 3 3 9 .4 2 1 3 5 4 0 .8 7 5 3 1 4 .4 2 8 8 5 .5
T o ta l 1 8 4 0 .0 2 5 5 5 .6 2 4 .4 2 6 4 2 8 .3 3 7 9 4 0 .6 2 0 0 2 1 .4 9 0 9 .6 2 4 9 9 3 9 .9 2 5 8 9 4 1 .3 8 6 3 1 3 .8 3 1 4 5 .0
I b e l ie v e m y s c h o o l ’ sem e r g e n c y /c r is is p la n is a ne f f e c t iv e p la n .
T e a c h e rA s s is ta n t
6 5 4 .5 5 4 5 .5 8 3 4 8 .8 7 9 4 6 .5 7 4 .1 1 0 .6 6 9 9 5 5 .4 5 1 6 4 0 .9 3 6 2 .9 1 1 0 .9
T e a c h e r 3 0 6 3 .8 1 7 3 6 .2 3 3 2 3 3 .8 5 6 2 5 7 .2 7 6 7 .7 1 2 1 .2 3 0 3 4 4 8 .3 2 9 7 7 4 7 .4 2 2 7 3 .6 4 8 0 .8
T o ta l 3 6 6 2 .1 2 2 3 7 .9 4 1 5 3 6 .0 6 4 1 5 5 .6 8 3 7 .2 1 3 1 .1 3 7 3 3 4 9 .5 3 4 9 3 4 6 .3 2 6 3 3 .5 5 9 0 .8
A dm in is t r a to r s g iv e m e th e h e lp In e e d w h e n d e a l in g w i th u n w a n te ds tu d e n t b e h a v io r a n d d is c ip l in ep ro b lem s .
T e a c h e rA s s is ta n t
7 5 8 .3 4 3 3 .3 1 8 .3 7 1 4 1 .3 6 5 3 7 .8 2 0 1 1 .6 1 6 9 .3 5 5 6 4 4 .2 5 2 1 4 1 .4 1 1 4 9 .1 6 7 5 .3
T e a c h e r 2 7 5 4 .0 1 9 3 8 .0 3 6 .0 1 2 .0 2 8 7 2 7 .9 4 3 2 4 2 .1 1 8 5 1 8 .0 1 2 3 1 2 .0 2 3 9 8 3 7 .5 2 6 0 4 4 0 .7 8 6 5 1 3 .5 5 2 6 8 .2
T o ta l 3 4 5 4 .8 2 3 3 7 .1 4 6 .5 1 1 .6 3 5 8 2 9 .9 4 9 7 4 1 .5 2 0 5 1 7 .1 1 3 9 1 1 .6 2 9 5 4 3 8 .6 3 1 2 5 4 0 .8 9 7 9 1 2 .8 5 9 3 7 .8
(C o n t in u e d )
Cen ter for Research & Evaluation - Charlotte-M eck lenburg SchoolsReport produced on M arch 16 , 2010
2009-10 Teacher Survey Data 1 1
David Cox Road Elementary ResultsD istrict Response Rate = 74.1% /Learning Community Response Rate = 71.8% / School Response Rate = 90.0%
Subscale = Safety & Behavior 2
I t e m /T e a c h e r T y p e
S c h o o l L e a r n in g C o m m u n it y D is t r ic t
S t r o n g lyA g r e e A g r e e D is a g r e e
S t r o n g lyD is a g r e e
N o tS u r e
S t r o n g lyA g r e e A g r e e D is a g r e e
S t r o n g lyD is a g r e e
S t r o n g lyA g r e e A g r e e D is a g r e e
S t r o n g lyD is a g r e e
n % n % n % n % n % n % n % n % n % n % n % n % n %
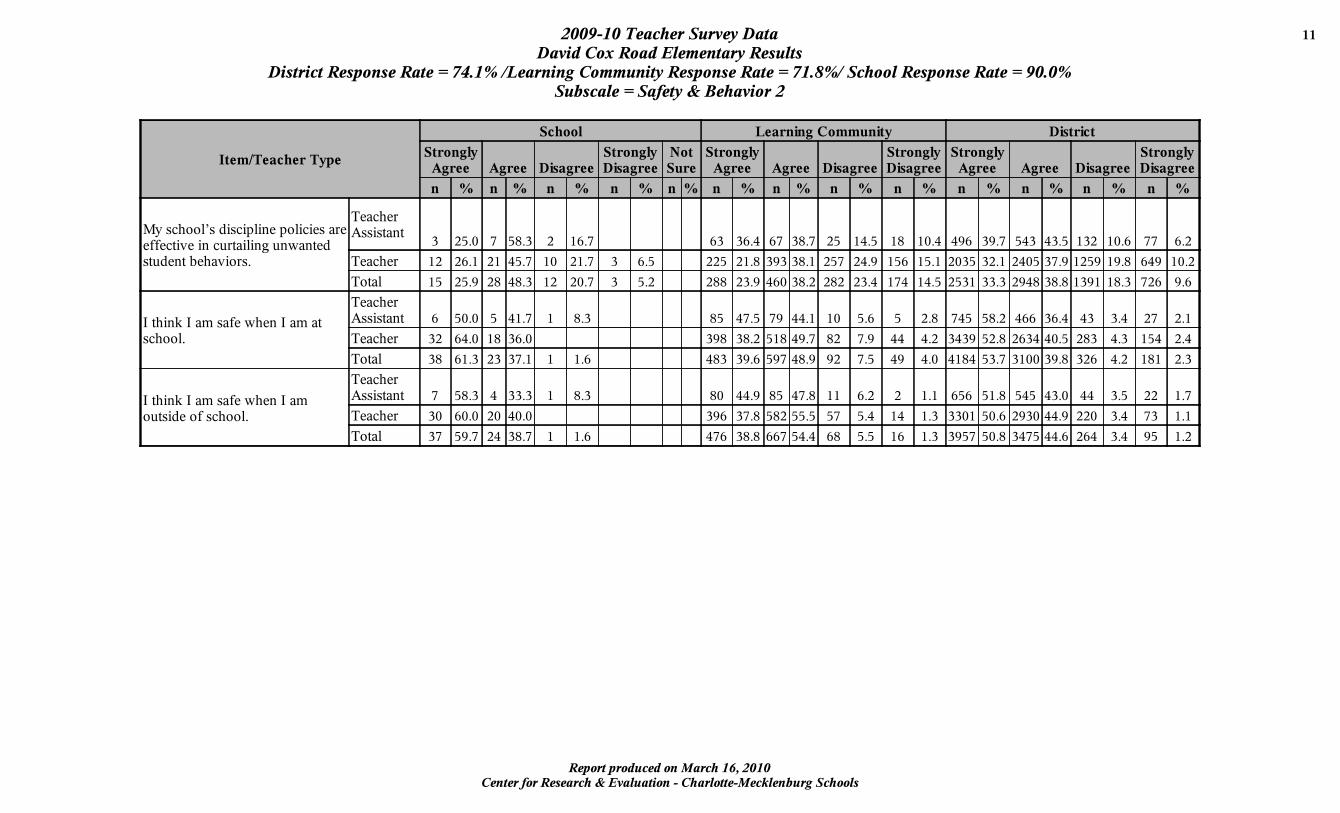
M y s c h o o l ’ s d is c ip l in e p o l ic ie s a r ee f f e c t iv e in c u r ta i l in g u n w a n te ds tu d e n t b e h a v io r s .
T e a c h e rA s s is ta n t
3 2 5 .0 7 5 8 .3 2 1 6 .7 6 3 3 6 .4 6 7 3 8 .7 2 5 1 4 .5 1 8 1 0 .4 4 9 6 3 9 .7 5 4 3 4 3 .5 1 3 2 1 0 .6 7 7 6 .2
T e a c h e r 1 2 2 6 .1 2 1 4 5 .7 1 0 2 1 .7 3 6 .5 2 2 5 2 1 .8 3 9 3 3 8 .1 2 5 7 2 4 .9 1 5 6 1 5 .1 2 0 3 5 3 2 .1 2 4 0 5 3 7 .9 1 2 5 9 1 9 .8 6 4 9 1 0 .2
T o ta l 1 5 2 5 .9 2 8 4 8 .3 1 2 2 0 .7 3 5 .2 2 8 8 2 3 .9 4 6 0 3 8 .2 2 8 2 2 3 .4 1 7 4 1 4 .5 2 5 3 1 3 3 .3 2 9 4 8 3 8 .8 1 3 9 1 1 8 .3 7 2 6 9 .6
I th in k I a m s a f e w h e n I am a ts c h o o l .
T e a c h e rA s s is ta n t 6 5 0 .0 5 4 1 .7 1 8 .3 8 5 4 7 .5 7 9 4 4 .1 1 0 5 .6 5 2 .8 7 4 5 5 8 .2 4 6 6 3 6 .4 4 3 3 .4 2 7 2 .1
T e a c h e r 3 2 6 4 .0 1 8 3 6 .0 3 9 8 3 8 .2 5 1 8 4 9 .7 8 2 7 .9 4 4 4 .2 3 4 3 9 5 2 .8 2 6 3 4 4 0 .5 2 8 3 4 .3 1 5 4 2 .4
T o ta l 3 8 6 1 .3 2 3 3 7 .1 1 1 .6 4 8 3 3 9 .6 5 9 7 4 8 .9 9 2 7 .5 4 9 4 .0 4 1 8 4 5 3 .7 3 1 0 0 3 9 .8 3 2 6 4 .2 1 8 1 2 .3
I th in k I a m s a f e w h e n I amo u ts id e o f s c h o o l .
T e a c h e rA s s is ta n t 7 5 8 .3 4 3 3 .3 1 8 .3 8 0 4 4 .9 8 5 4 7 .8 1 1 6 .2 2 1 .1 6 5 6 5 1 .8 5 4 5 4 3 .0 4 4 3 .5 2 2 1 .7
T e a c h e r 3 0 6 0 .0 2 0 4 0 .0 3 9 6 3 7 .8 5 8 2 5 5 .5 5 7 5 .4 1 4 1 .3 3 3 0 1 5 0 .6 2 9 3 0 4 4 .9 2 2 0 3 .4 7 3 1 .1
T o ta l 3 7 5 9 .7 2 4 3 8 .7 1 1 .6 4 7 6 3 8 .8 6 6 7 5 4 .4 6 8 5 .5 1 6 1 .3 3 9 5 7 5 0 .8 3 4 7 5 4 4 .6 2 6 4 3 .4 9 5 1 .2

Cen ter for Research & Evaluation - Charlotte-M eck lenburg SchoolsReport produced on M arch 16 , 2010
2009-10 Teacher Survey Data 1 2
David Cox Road Elementary ResultsD istrict Response Rate = 74.1% /Learning Community Response Rate = 71.8% / School Response Rate = 90.0%
Subscale = Professional Development - CMS
I t e m /T e a c h e r T y p e
S c h o o l L e a r n in g C o m m u n it y D is t r ic t
V e r yS a t is f ie d S a t is f ie d U n s a t is f ie d
V e r yU n s a t is f ie d
D o n 'tK n o w
V e r yS a t is f ie d S a t is f ie d U n s a t is f ie d
V e r yU n s a t is f ie d
V e r yS a t is f ie d S a t is f ie d U n s a t is f ie d
V e r yU n s a t is f ie d
n % n % n % n % n % n % n % n % n % n % n % n % n %
D if f e r e n t ia te d I n s t r u c t io n
T e a c h e rA s s is ta n t 4 3 6 .4 7 6 3 .6 3 4 2 3 .1 9 4 6 3 .9 1 8 1 2 .2 1 0 .7 3 3 2 2 9 .8 6 8 3 6 1 .3 8 5 7 .6 1 5 1 .3
T e a c h e r 8 1 7 .8 3 4 7 5 .6 3 6 .7 1 5 9 1 5 .9 6 5 1 6 5 .0 1 5 9 1 5 .9 3 3 3 .3 1 4 1 3 2 3 .0 3 6 1 9 5 8 .8 9 3 3 1 5 .2 1 8 8 3 .1
T o ta l 1 2 2 1 .4 4 1 7 3 .2 3 5 .4 1 9 3 1 6 .8 7 4 5 6 4 .8 1 7 7 1 5 .4 3 4 3 .0 1 7 4 5 2 4 .0 4 3 0 2 5 9 .2 1 0 1 8 1 4 .0 2 0 3 2 .8
E O G /E O C P r e p a r a t io n
T e a c h e rA s s is ta n t 2 2 0 .0 8 8 0 .0 3 4 2 5 .0 8 6 6 3 .2 1 6 1 1 .8 3 4 3 3 2 .0 6 3 8 5 9 .5 7 6 7 .1 1 6 1 .5
T e a c h e r 7 2 0 .0 2 3 6 5 .7 5 1 4 .3 1 2 9 1 4 .9 5 4 6 6 3 .0 1 5 1 1 7 .4 4 1 4 .7 1 1 6 9 2 2 .1 3 1 4 8 5 9 .6 7 9 3 1 5 .0 1 7 3 3 .3
T o ta l 9 2 0 .0 3 1 6 8 .9 5 1 1 .1 1 6 3 1 6 .3 6 3 2 6 3 .0 1 6 7 1 6 .7 4 1 4 .1 1 5 1 2 2 3 .8 3 7 8 6 5 9 .6 8 6 9 1 3 .7 1 8 9 3 .0
C u r r e n t R e s e a r c h /B e s t P r a c t ic e
T e a c h e rA s s is ta n t 3 3 3 .3 6 6 6 .7 3 0 2 2 .7 8 7 6 5 .9 1 2 9 .1 3 2 .3 2 8 9 2 8 .1 6 5 1 6 3 .4 6 9 6 .7 1 8 1 .8
T e a c h e r 1 1 2 3 .9 3 0 6 5 .2 5 1 0 .9 1 3 4 1 3 .9 6 2 4 6 4 .8 1 6 7 1 7 .3 3 8 3 .9 1 2 3 8 2 0 .8 3 6 5 7 6 1 .3 8 8 2 1 4 .8 1 8 4 3 .1
T o ta l 1 4 2 5 .5 3 6 6 5 .5 5 9 .1 1 6 4 1 5 .0 7 1 1 6 4 .9 1 7 9 1 6 .3 4 1 3 .7 1 5 2 7 2 1 .9 4 3 0 8 6 1 .6 9 5 1 1 3 .6 2 0 2 2 .9
T e c h n o lo g y T r a in in g
T e a c h e rA s s is ta n t 3 2 7 .3 7 6 3 .6 1 9 .1 3 0 2 0 .5 8 6 5 8 .9 2 5 1 7 .1 5 3 .4 2 9 3 2 6 .2 6 3 6 5 6 .8 1 6 0 1 4 .3 3 1 2 .8
T e a c h e r 5 1 1 .4 2 9 6 5 .9 9 2 0 .5 1 2 .3 1 2 9 1 3 .0 5 8 6 5 9 .0 2 2 1 2 2 .2 5 8 5 .8 1 1 4 2 1 8 .6 3 3 9 0 5 5 .3 1 2 7 5 2 0 .8 3 2 1 5 .2
T o ta l 8 1 4 .5 3 6 6 5 .5 1 0 1 8 .2 1 1 .8 1 5 9 1 3 .9 6 7 2 5 8 .9 2 4 6 2 1 .6 6 3 5 .5 1 4 3 5 1 9 .8 4 0 2 6 5 5 .5 1 4 3 5 1 9 .8 3 5 2 4 .9
E S L S tu d e n ts
T e a c h e rA s s is ta n t 1 9 .1 9 8 1 .8 1 9 .1 3 2 2 3 .0 9 2 6 6 .2 1 2 8 .6 3 2 .2 3 0 3 2 9 .8 6 1 8 6 0 .8 8 0 7 .9 1 6 1 .6
T e a c h e r 7 1 8 .4 2 5 6 5 .8 5 1 3 .2 1 2 .6 1 2 6 1 3 .7 5 5 1 5 9 .9 1 9 0 2 0 .7 5 3 5 .8 1 0 4 6 1 9 .5 3 1 0 6 5 8 .0 9 7 9 1 8 .3 2 2 7 4 .2
T o ta l 8 1 6 .3 3 4 6 9 .4 6 1 2 .2 1 2 .0 1 5 8 1 4 .9 6 4 3 6 0 .7 2 0 2 1 9 .1 5 6 5 .3 1 3 4 9 2 1 .2 3 7 2 4 5 8 .4 1 0 5 9 1 6 .6 2 4 3 3 .8
M o d e le d L e s s o n s f r o m E x p e r ts
T e a c h e rA s s is ta n t 2 1 8 .2 8 7 2 .7 1 9 .1 2 5 1 7 .7 9 0 6 3 .8 2 3 1 6 .3 3 2 .1 2 8 5 2 7 .0 6 3 4 6 0 .0 1 1 6 1 1 .0 2 1 2 .0
T e a c h e r 6 1 5 .4 2 7 6 9 .2 6 1 5 .4 9 1 9 .7 4 8 2 5 1 .3 2 7 7 2 9 .5 8 9 9 .5 8 7 9 1 5 .3 2 9 5 7 5 1 .4 1 4 8 8 2 5 .9 4 2 6 7 .4
T o ta l 8 1 6 .0 3 5 7 0 .0 7 1 4 .0 1 1 6 1 0 .7 5 7 2 5 3 .0 3 0 0 2 7 .8 9 2 8 .5 1 1 6 4 1 7 .1 3 5 9 1 5 2 .8 1 6 0 4 2 3 .6 4 4 7 6 .6
(C o n t in u e d )
Cen ter for Research & Evaluation - Charlotte-M eck lenburg SchoolsReport produced on M arch 16 , 2010
2009-10 Teacher Survey Data 1 3
David Cox Road Elementary ResultsD istrict Response Rate = 74.1% /Learning Community Response Rate = 71.8% / School Response Rate = 90.0%
Subscale = Professional Development - CMS
I t e m /T e a c h e r T y p e
S c h o o l L e a r n in g C o m m u n it y D is t r ic t
V e r yS a t is f ie d S a t is f ie d U n s a t is f ie d
V e r yU n s a t is f ie d
D o n 'tK n o w
V e r yS a t is f ie d S a t is f ie d U n s a t is f ie d
V e r yU n s a t is f ie d
V e r yS a t is f ie d S a t is f ie d U n s a t is f ie d
V e r yU n s a t is f ie d
n % n % n % n % n % n % n % n % n % n % n % n % n %
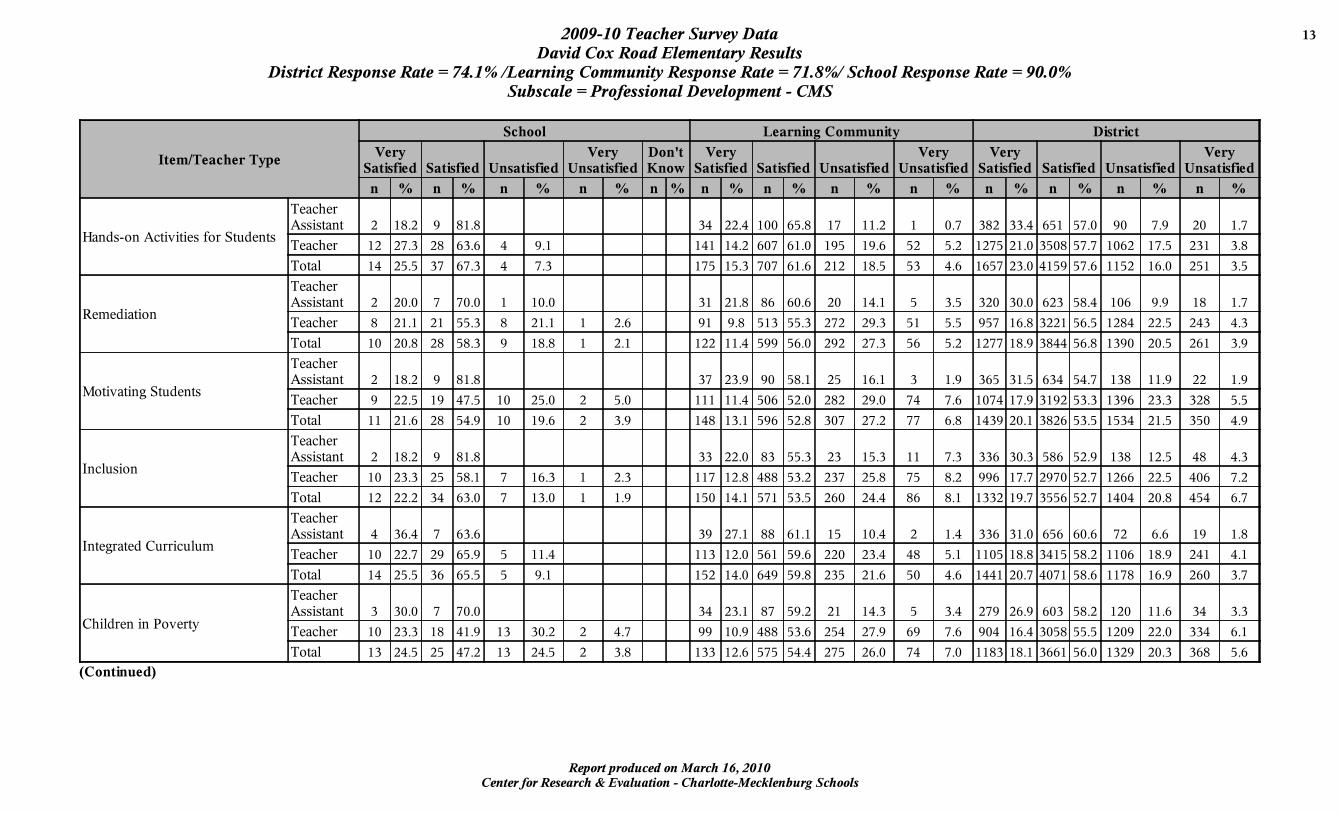
H a n d s -o n A c t iv i t ie s f o r S tu d e n ts
T e a c h e rA s s is ta n t 2 1 8 .2 9 8 1 .8 3 4 2 2 .4 1 0 0 6 5 .8 1 7 1 1 .2 1 0 .7 3 8 2 3 3 .4 6 5 1 5 7 .0 9 0 7 .9 2 0 1 .7
T e a c h e r 1 2 2 7 .3 2 8 6 3 .6 4 9 .1 1 4 1 1 4 .2 6 0 7 6 1 .0 1 9 5 1 9 .6 5 2 5 .2 1 2 7 5 2 1 .0 3 5 0 8 5 7 .7 1 0 6 2 1 7 .5 2 3 1 3 .8
T o ta l 1 4 2 5 .5 3 7 6 7 .3 4 7 .3 1 7 5 1 5 .3 7 0 7 6 1 .6 2 1 2 1 8 .5 5 3 4 .6 1 6 5 7 2 3 .0 4 1 5 9 5 7 .6 1 1 5 2 1 6 .0 2 5 1 3 .5
R em e d ia t io n
T e a c h e rA s s is ta n t 2 2 0 .0 7 7 0 .0 1 1 0 .0 3 1 2 1 .8 8 6 6 0 .6 2 0 1 4 .1 5 3 .5 3 2 0 3 0 .0 6 2 3 5 8 .4 1 0 6 9 .9 1 8 1 .7
T e a c h e r 8 2 1 .1 2 1 5 5 .3 8 2 1 .1 1 2 .6 9 1 9 .8 5 1 3 5 5 .3 2 7 2 2 9 .3 5 1 5 .5 9 5 7 1 6 .8 3 2 2 1 5 6 .5 1 2 8 4 2 2 .5 2 4 3 4 .3
T o ta l 1 0 2 0 .8 2 8 5 8 .3 9 1 8 .8 1 2 .1 1 2 2 1 1 .4 5 9 9 5 6 .0 2 9 2 2 7 .3 5 6 5 .2 1 2 7 7 1 8 .9 3 8 4 4 5 6 .8 1 3 9 0 2 0 .5 2 6 1 3 .9
M o tiv a t in g S tu d e n ts
T e a c h e rA s s is ta n t 2 1 8 .2 9 8 1 .8 3 7 2 3 .9 9 0 5 8 .1 2 5 1 6 .1 3 1 .9 3 6 5 3 1 .5 6 3 4 5 4 .7 1 3 8 1 1 .9 2 2 1 .9
T e a c h e r 9 2 2 .5 1 9 4 7 .5 1 0 2 5 .0 2 5 .0 1 1 1 1 1 .4 5 0 6 5 2 .0 2 8 2 2 9 .0 7 4 7 .6 1 0 7 4 1 7 .9 3 1 9 2 5 3 .3 1 3 9 6 2 3 .3 3 2 8 5 .5
T o ta l 1 1 2 1 .6 2 8 5 4 .9 1 0 1 9 .6 2 3 .9 1 4 8 1 3 .1 5 9 6 5 2 .8 3 0 7 2 7 .2 7 7 6 .8 1 4 3 9 2 0 .1 3 8 2 6 5 3 .5 1 5 3 4 2 1 .5 3 5 0 4 .9
I n c lu s io n
T e a c h e rA s s is ta n t 2 1 8 .2 9 8 1 .8 3 3 2 2 .0 8 3 5 5 .3 2 3 1 5 .3 1 1 7 .3 3 3 6 3 0 .3 5 8 6 5 2 .9 1 3 8 1 2 .5 4 8 4 .3
T e a c h e r 1 0 2 3 .3 2 5 5 8 .1 7 1 6 .3 1 2 .3 1 1 7 1 2 .8 4 8 8 5 3 .2 2 3 7 2 5 .8 7 5 8 .2 9 9 6 1 7 .7 2 9 7 0 5 2 .7 1 2 6 6 2 2 .5 4 0 6 7 .2
T o ta l 1 2 2 2 .2 3 4 6 3 .0 7 1 3 .0 1 1 .9 1 5 0 1 4 .1 5 7 1 5 3 .5 2 6 0 2 4 .4 8 6 8 .1 1 3 3 2 1 9 .7 3 5 5 6 5 2 .7 1 4 0 4 2 0 .8 4 5 4 6 .7
I n te g r a te d C u r r ic u lu m
T e a c h e rA s s is ta n t 4 3 6 .4 7 6 3 .6 3 9 2 7 .1 8 8 6 1 .1 1 5 1 0 .4 2 1 .4 3 3 6 3 1 .0 6 5 6 6 0 .6 7 2 6 .6 1 9 1 .8
T e a c h e r 1 0 2 2 .7 2 9 6 5 .9 5 1 1 .4 1 1 3 1 2 .0 5 6 1 5 9 .6 2 2 0 2 3 .4 4 8 5 .1 1 1 0 5 1 8 .8 3 4 1 5 5 8 .2 1 1 0 6 1 8 .9 2 4 1 4 .1
T o ta l 1 4 2 5 .5 3 6 6 5 .5 5 9 .1 1 5 2 1 4 .0 6 4 9 5 9 .8 2 3 5 2 1 .6 5 0 4 .6 1 4 4 1 2 0 .7 4 0 7 1 5 8 .6 1 1 7 8 1 6 .9 2 6 0 3 .7
C h i ld r e n in P o v e r ty
T e a c h e rA s s is ta n t 3 3 0 .0 7 7 0 .0 3 4 2 3 .1 8 7 5 9 .2 2 1 1 4 .3 5 3 .4 2 7 9 2 6 .9 6 0 3 5 8 .2 1 2 0 1 1 .6 3 4 3 .3
T e a c h e r 1 0 2 3 .3 1 8 4 1 .9 1 3 3 0 .2 2 4 .7 9 9 1 0 .9 4 8 8 5 3 .6 2 5 4 2 7 .9 6 9 7 .6 9 0 4 1 6 .4 3 0 5 8 5 5 .5 1 2 0 9 2 2 .0 3 3 4 6 .1
T o ta l 1 3 2 4 .5 2 5 4 7 .2 1 3 2 4 .5 2 3 .8 1 3 3 1 2 .6 5 7 5 5 4 .4 2 7 5 2 6 .0 7 4 7 .0 1 1 8 3 1 8 .1 3 6 6 1 5 6 .0 1 3 2 9 2 0 .3 3 6 8 5 .6
(C o n t in u e d )

Cen ter for Research & Evaluation - Charlotte-M eck lenburg SchoolsReport produced on M arch 16 , 2010
2009-10 Teacher Survey Data 1 4
David Cox Road Elementary ResultsD istrict Response Rate = 74.1% /Learning Community Response Rate = 71.8% / School Response Rate = 90.0%
Subscale = Professional Development - CMS
I t e m /T e a c h e r T y p e
S c h o o l L e a r n in g C o m m u n it y D is t r ic t
V e r yS a t is f ie d S a t is f ie d U n s a t is f ie d
V e r yU n s a t is f ie d
D o n 'tK n o w
V e r yS a t is f ie d S a t is f ie d U n s a t is f ie d
V e r yU n s a t is f ie d
V e r yS a t is f ie d S a t is f ie d U n s a t is f ie d
V e r yU n s a t is f ie d
n % n % n % n % n % n % n % n % n % n % n % n % n %
R e a d in g C o m p r e h e n s io n
T e a c h e rA s s is ta n t 4 3 6 .4 7 6 3 .6 3 3 2 2 .3 8 4 5 6 .8 3 0 2 0 .3 1 0 .7 3 4 3 3 0 .6 6 2 3 5 5 .5 1 3 4 1 1 .9 2 2 2 .0
T e a c h e r 1 1 2 6 .8 2 4 5 8 .5 6 1 4 .6 1 2 1 1 2 .6 6 0 0 6 2 .4 1 8 7 1 9 .4 5 4 5 .6 1 1 6 2 1 9 .8 3 5 0 2 5 9 .8 9 4 3 1 6 .1 2 5 3 4 .3
T o ta l 1 5 2 8 .8 3 1 5 9 .6 6 1 1 .5 1 5 4 1 3 .9 6 8 4 6 1 .6 2 1 7 1 9 .5 5 5 5 .0 1 5 0 5 2 1 .6 4 1 2 5 5 9 .1 1 0 7 7 1 5 .4 2 7 5 3 .9
U s in g ”M a n ip u la t iv e s ” f o rT e a c h in g M a th
T e a c h e rA s s is ta n t 5 4 5 .5 6 5 4 .5 4 6 3 0 .7 9 2 6 1 .3 1 2 8 .0 4 0 6 3 6 .4 6 3 1 5 6 .6 6 0 5 .4 1 8 1 .6
T e a c h e r 1 6 3 8 .1 2 3 5 4 .8 3 7 .1 1 7 8 2 1 .3 5 2 2 6 2 .5 1 0 3 1 2 .3 3 2 3 .8 1 3 6 1 2 7 .2 2 9 4 2 5 8 .8 5 4 9 1 1 .0 1 5 4 3 .1
T o ta l 2 1 3 9 .6 2 9 5 4 .7 3 5 .7 2 2 4 2 2 .7 6 1 4 6 2 .3 1 1 5 1 1 .7 3 2 3 .2 1 7 6 7 2 8 .9 3 5 7 3 5 8 .4 6 0 9 9 .9 1 7 2 2 .8
Cen ter for Research & Evaluation - Charlotte-M eck lenburg SchoolsReport produced on M arch 16 , 2010
2009-10 Teacher Survey Data 1 5
David Cox Road Elementary ResultsD istrict Response Rate = 74.1% /Learning Community Response Rate = 71.8% / School Response Rate = 90.0%
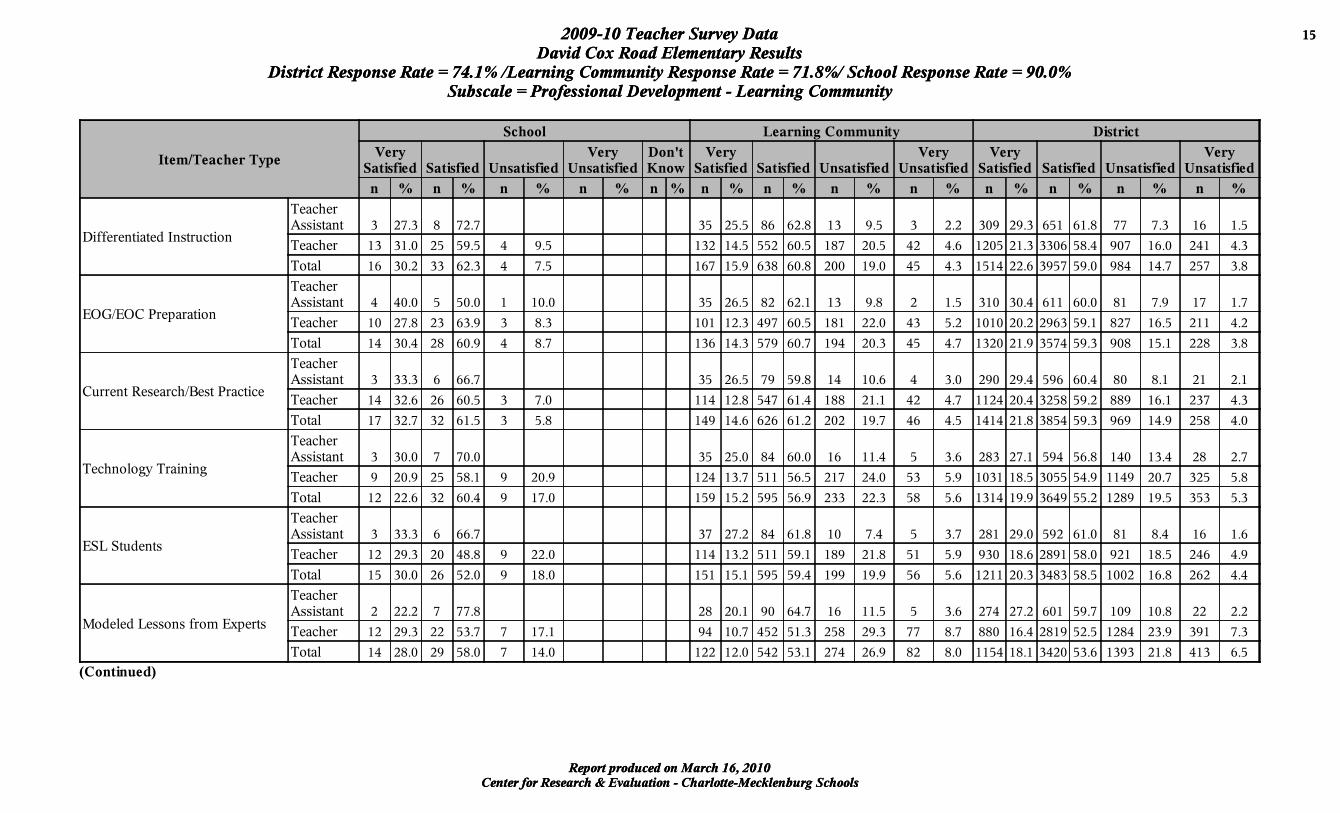
Subscale = Professional Development - Learning Community
Cen ter for Research & Evaluation - Charlotte-M eck lenburg SchoolsReport produced on M arch 16 , 2010
2009-10 Teacher Survey Data 1 5
David Cox Road Elementary ResultsD istrict Response Rate = 74.1% /Learning Community Response Rate = 71.8% / School Response Rate = 90.0%
Subscale = Professional Development - Learning Community
I t e m /T e a c h e r T y p e
S c h o o l L e a r n in g C o m m u n it y D is t r ic t
V e r yS a t is f ie d S a t is f ie d U n s a t is f ie d
V e r yU n s a t is f ie d
D o n 'tK n o w
V e r yS a t is f ie d S a t is f ie d U n s a t is f ie d
V e r yU n s a t is f ie d
V e r yS a t is f ie d S a t is f ie d U n s a t is f ie d
V e r yU n s a t is f ie d
n % n % n % n % n % n % n % n % n % n % n % n % n %
D if f e r e n t ia te d I n s t r u c t io n
T e a c h e rA s s is ta n t 3 2 7 .3 8 7 2 .7 3 5 2 5 .5 8 6 6 2 .8 1 3 9 .5 3 2 .2 3 0 9 2 9 .3 6 5 1 6 1 .8 7 7 7 .3 1 6 1 .5
T e a c h e r 1 3 3 1 .0 2 5 5 9 .5 4 9 .5 1 3 2 1 4 .5 5 5 2 6 0 .5 1 8 7 2 0 .5 4 2 4 .6 1 2 0 5 2 1 .3 3 3 0 6 5 8 .4 9 0 7 1 6 .0 2 4 1 4 .3
T o ta l 1 6 3 0 .2 3 3 6 2 .3 4 7 .5 1 6 7 1 5 .9 6 3 8 6 0 .8 2 0 0 1 9 .0 4 5 4 .3 1 5 1 4 2 2 .6 3 9 5 7 5 9 .0 9 8 4 1 4 .7 2 5 7 3 .8
E O G /E O C P r e p a r a t io n
T e a c h e rA s s is ta n t 4 4 0 .0 5 5 0 .0 1 1 0 .0 3 5 2 6 .5 8 2 6 2 .1 1 3 9 .8 2 1 .5 3 1 0 3 0 .4 6 1 1 6 0 .0 8 1 7 .9 1 7 1 .7
T e a c h e r 1 0 2 7 .8 2 3 6 3 .9 3 8 .3 1 0 1 1 2 .3 4 9 7 6 0 .5 1 8 1 2 2 .0 4 3 5 .2 1 0 1 0 2 0 .2 2 9 6 3 5 9 .1 8 2 7 1 6 .5 2 1 1 4 .2
T o ta l 1 4 3 0 .4 2 8 6 0 .9 4 8 .7 1 3 6 1 4 .3 5 7 9 6 0 .7 1 9 4 2 0 .3 4 5 4 .7 1 3 2 0 2 1 .9 3 5 7 4 5 9 .3 9 0 8 1 5 .1 2 2 8 3 .8
C u r r e n t R e s e a r c h /B e s t P r a c t ic e
T e a c h e rA s s is ta n t 3 3 3 .3 6 6 6 .7 3 5 2 6 .5 7 9 5 9 .8 1 4 1 0 .6 4 3 .0 2 9 0 2 9 .4 5 9 6 6 0 .4 8 0 8 .1 2 1 2 .1
T e a c h e r 1 4 3 2 .6 2 6 6 0 .5 3 7 .0 1 1 4 1 2 .8 5 4 7 6 1 .4 1 8 8 2 1 .1 4 2 4 .7 1 1 2 4 2 0 .4 3 2 5 8 5 9 .2 8 8 9 1 6 .1 2 3 7 4 .3
T o ta l 1 7 3 2 .7 3 2 6 1 .5 3 5 .8 1 4 9 1 4 .6 6 2 6 6 1 .2 2 0 2 1 9 .7 4 6 4 .5 1 4 1 4 2 1 .8 3 8 5 4 5 9 .3 9 6 9 1 4 .9 2 5 8 4 .0
T e c h n o lo g y T r a in in g
T e a c h e rA s s is ta n t 3 3 0 .0 7 7 0 .0 3 5 2 5 .0 8 4 6 0 .0 1 6 1 1 .4 5 3 .6 2 8 3 2 7 .1 5 9 4 5 6 .8 1 4 0 1 3 .4 2 8 2 .7
T e a c h e r 9 2 0 .9 2 5 5 8 .1 9 2 0 .9 1 2 4 1 3 .7 5 1 1 5 6 .5 2 1 7 2 4 .0 5 3 5 .9 1 0 3 1 1 8 .5 3 0 5 5 5 4 .9 1 1 4 9 2 0 .7 3 2 5 5 .8
T o ta l 1 2 2 2 .6 3 2 6 0 .4 9 1 7 .0 1 5 9 1 5 .2 5 9 5 5 6 .9 2 3 3 2 2 .3 5 8 5 .6 1 3 1 4 1 9 .9 3 6 4 9 5 5 .2 1 2 8 9 1 9 .5 3 5 3 5 .3
E S L S tu d e n ts
T e a c h e rA s s is ta n t 3 3 3 .3 6 6 6 .7 3 7 2 7 .2 8 4 6 1 .8 1 0 7 .4 5 3 .7 2 8 1 2 9 .0 5 9 2 6 1 .0 8 1 8 .4 1 6 1 .6
T e a c h e r 1 2 2 9 .3 2 0 4 8 .8 9 2 2 .0 1 1 4 1 3 .2 5 1 1 5 9 .1 1 8 9 2 1 .8 5 1 5 .9 9 3 0 1 8 .6 2 8 9 1 5 8 .0 9 2 1 1 8 .5 2 4 6 4 .9
T o ta l 1 5 3 0 .0 2 6 5 2 .0 9 1 8 .0 1 5 1 1 5 .1 5 9 5 5 9 .4 1 9 9 1 9 .9 5 6 5 .6 1 2 1 1 2 0 .3 3 4 8 3 5 8 .5 1 0 0 2 1 6 .8 2 6 2 4 .4
M o d e le d L e s s o n s f r o m E x p e r ts
T e a c h e rA s s is ta n t 2 2 2 .2 7 7 7 .8 2 8 2 0 .1 9 0 6 4 .7 1 6 1 1 .5 5 3 .6 2 7 4 2 7 .2 6 0 1 5 9 .7 1 0 9 1 0 .8 2 2 2 .2
T e a c h e r 1 2 2 9 .3 2 2 5 3 .7 7 1 7 .1 9 4 1 0 .7 4 5 2 5 1 .3 2 5 8 2 9 .3 7 7 8 .7 8 8 0 1 6 .4 2 8 1 9 5 2 .5 1 2 8 4 2 3 .9 3 9 1 7 .3
T o ta l 1 4 2 8 .0 2 9 5 8 .0 7 1 4 .0 1 2 2 1 2 .0 5 4 2 5 3 .1 2 7 4 2 6 .9 8 2 8 .0 1 1 5 4 1 8 .1 3 4 2 0 5 3 .6 1 3 9 3 2 1 .8 4 1 3 6 .5
(C o n t in u e d )
Cen ter for Research & Evaluation - Charlotte-M eck lenburg SchoolsReport produced on M arch 16 , 2010
2009-10 Teacher Survey Data 1 6
David Cox Road Elementary ResultsD istrict Response Rate = 74.1% /Learning Community Response Rate = 71.8% / School Response Rate = 90.0%
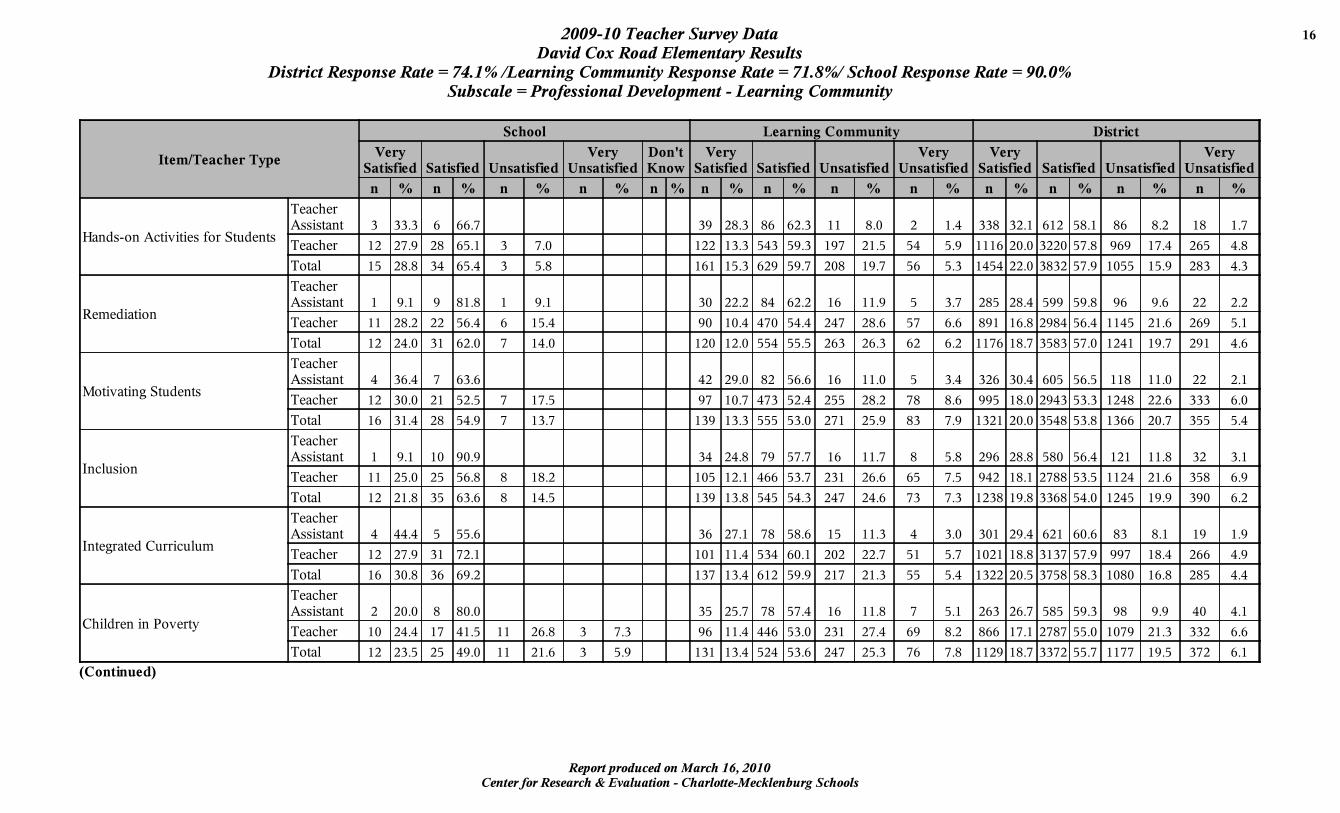
Subscale = Professional Development - Learning Community
I t e m /T e a c h e r T y p e
S c h o o l L e a r n in g C o m m u n it y D is t r ic t
V e r yS a t is f ie d S a t is f ie d U n s a t is f ie d
V e r yU n s a t is f ie d
D o n 'tK n o w
V e r yS a t is f ie d S a t is f ie d U n s a t is f ie d
V e r yU n s a t is f ie d
V e r yS a t is f ie d S a t is f ie d U n s a t is f ie d
V e r yU n s a t is f ie d
n % n % n % n % n % n % n % n % n % n % n % n % n %
H a n d s -o n A c t iv i t ie s f o r S tu d e n ts
T e a c h e rA s s is ta n t 3 3 3 .3 6 6 6 .7 3 9 2 8 .3 8 6 6 2 .3 1 1 8 .0 2 1 .4 3 3 8 3 2 .1 6 1 2 5 8 .1 8 6 8 .2 1 8 1 .7
T e a c h e r 1 2 2 7 .9 2 8 6 5 .1 3 7 .0 1 2 2 1 3 .3 5 4 3 5 9 .3 1 9 7 2 1 .5 5 4 5 .9 1 1 1 6 2 0 .0 3 2 2 0 5 7 .8 9 6 9 1 7 .4 2 6 5 4 .8
T o ta l 1 5 2 8 .8 3 4 6 5 .4 3 5 .8 1 6 1 1 5 .3 6 2 9 5 9 .7 2 0 8 1 9 .7 5 6 5 .3 1 4 5 4 2 2 .0 3 8 3 2 5 7 .9 1 0 5 5 1 5 .9 2 8 3 4 .3
R em e d ia t io n
T e a c h e rA s s is ta n t 1 9 .1 9 8 1 .8 1 9 .1 3 0 2 2 .2 8 4 6 2 .2 1 6 1 1 .9 5 3 .7 2 8 5 2 8 .4 5 9 9 5 9 .8 9 6 9 .6 2 2 2 .2
T e a c h e r 1 1 2 8 .2 2 2 5 6 .4 6 1 5 .4 9 0 1 0 .4 4 7 0 5 4 .4 2 4 7 2 8 .6 5 7 6 .6 8 9 1 1 6 .8 2 9 8 4 5 6 .4 1 1 4 5 2 1 .6 2 6 9 5 .1
T o ta l 1 2 2 4 .0 3 1 6 2 .0 7 1 4 .0 1 2 0 1 2 .0 5 5 4 5 5 .5 2 6 3 2 6 .3 6 2 6 .2 1 1 7 6 1 8 .7 3 5 8 3 5 7 .0 1 2 4 1 1 9 .7 2 9 1 4 .6
M o tiv a t in g S tu d e n ts
T e a c h e rA s s is ta n t 4 3 6 .4 7 6 3 .6 4 2 2 9 .0 8 2 5 6 .6 1 6 1 1 .0 5 3 .4 3 2 6 3 0 .4 6 0 5 5 6 .5 1 1 8 1 1 .0 2 2 2 .1
T e a c h e r 1 2 3 0 .0 2 1 5 2 .5 7 1 7 .5 9 7 1 0 .7 4 7 3 5 2 .4 2 5 5 2 8 .2 7 8 8 .6 9 9 5 1 8 .0 2 9 4 3 5 3 .3 1 2 4 8 2 2 .6 3 3 3 6 .0
T o ta l 1 6 3 1 .4 2 8 5 4 .9 7 1 3 .7 1 3 9 1 3 .3 5 5 5 5 3 .0 2 7 1 2 5 .9 8 3 7 .9 1 3 2 1 2 0 .0 3 5 4 8 5 3 .8 1 3 6 6 2 0 .7 3 5 5 5 .4
I n c lu s io n
T e a c h e rA s s is ta n t 1 9 .1 1 0 9 0 .9 3 4 2 4 .8 7 9 5 7 .7 1 6 1 1 .7 8 5 .8 2 9 6 2 8 .8 5 8 0 5 6 .4 1 2 1 1 1 .8 3 2 3 .1
T e a c h e r 1 1 2 5 .0 2 5 5 6 .8 8 1 8 .2 1 0 5 1 2 .1 4 6 6 5 3 .7 2 3 1 2 6 .6 6 5 7 .5 9 4 2 1 8 .1 2 7 8 8 5 3 .5 1 1 2 4 2 1 .6 3 5 8 6 .9
T o ta l 1 2 2 1 .8 3 5 6 3 .6 8 1 4 .5 1 3 9 1 3 .8 5 4 5 5 4 .3 2 4 7 2 4 .6 7 3 7 .3 1 2 3 8 1 9 .8 3 3 6 8 5 4 .0 1 2 4 5 1 9 .9 3 9 0 6 .2
I n te g r a te d C u r r ic u lu m
T e a c h e rA s s is ta n t 4 4 4 .4 5 5 5 .6 3 6 2 7 .1 7 8 5 8 .6 1 5 1 1 .3 4 3 .0 3 0 1 2 9 .4 6 2 1 6 0 .6 8 3 8 .1 1 9 1 .9
T e a c h e r 1 2 2 7 .9 3 1 7 2 .1 1 0 1 1 1 .4 5 3 4 6 0 .1 2 0 2 2 2 .7 5 1 5 .7 1 0 2 1 1 8 .8 3 1 3 7 5 7 .9 9 9 7 1 8 .4 2 6 6 4 .9
T o ta l 1 6 3 0 .8 3 6 6 9 .2 1 3 7 1 3 .4 6 1 2 5 9 .9 2 1 7 2 1 .3 5 5 5 .4 1 3 2 2 2 0 .5 3 7 5 8 5 8 .3 1 0 8 0 1 6 .8 2 8 5 4 .4
C h i ld r e n in P o v e r ty
T e a c h e rA s s is ta n t 2 2 0 .0 8 8 0 .0 3 5 2 5 .7 7 8 5 7 .4 1 6 1 1 .8 7 5 .1 2 6 3 2 6 .7 5 8 5 5 9 .3 9 8 9 .9 4 0 4 .1
T e a c h e r 1 0 2 4 .4 1 7 4 1 .5 1 1 2 6 .8 3 7 .3 9 6 1 1 .4 4 4 6 5 3 .0 2 3 1 2 7 .4 6 9 8 .2 8 6 6 1 7 .1 2 7 8 7 5 5 .0 1 0 7 9 2 1 .3 3 3 2 6 .6
T o ta l 1 2 2 3 .5 2 5 4 9 .0 1 1 2 1 .6 3 5 .9 1 3 1 1 3 .4 5 2 4 5 3 .6 2 4 7 2 5 .3 7 6 7 .8 1 1 2 9 1 8 .7 3 3 7 2 5 5 .7 1 1 7 7 1 9 .5 3 7 2 6 .1
(C o n t in u e d )
Cen ter for Research & Evaluation - Charlotte-M eck lenburg SchoolsReport produced on M arch 16 , 2010
2009-10 Teacher Survey Data 1 7
David Cox Road Elementary ResultsD istrict Response Rate = 74.1% /Learning Community Response Rate = 71.8% / School Response Rate = 90.0%
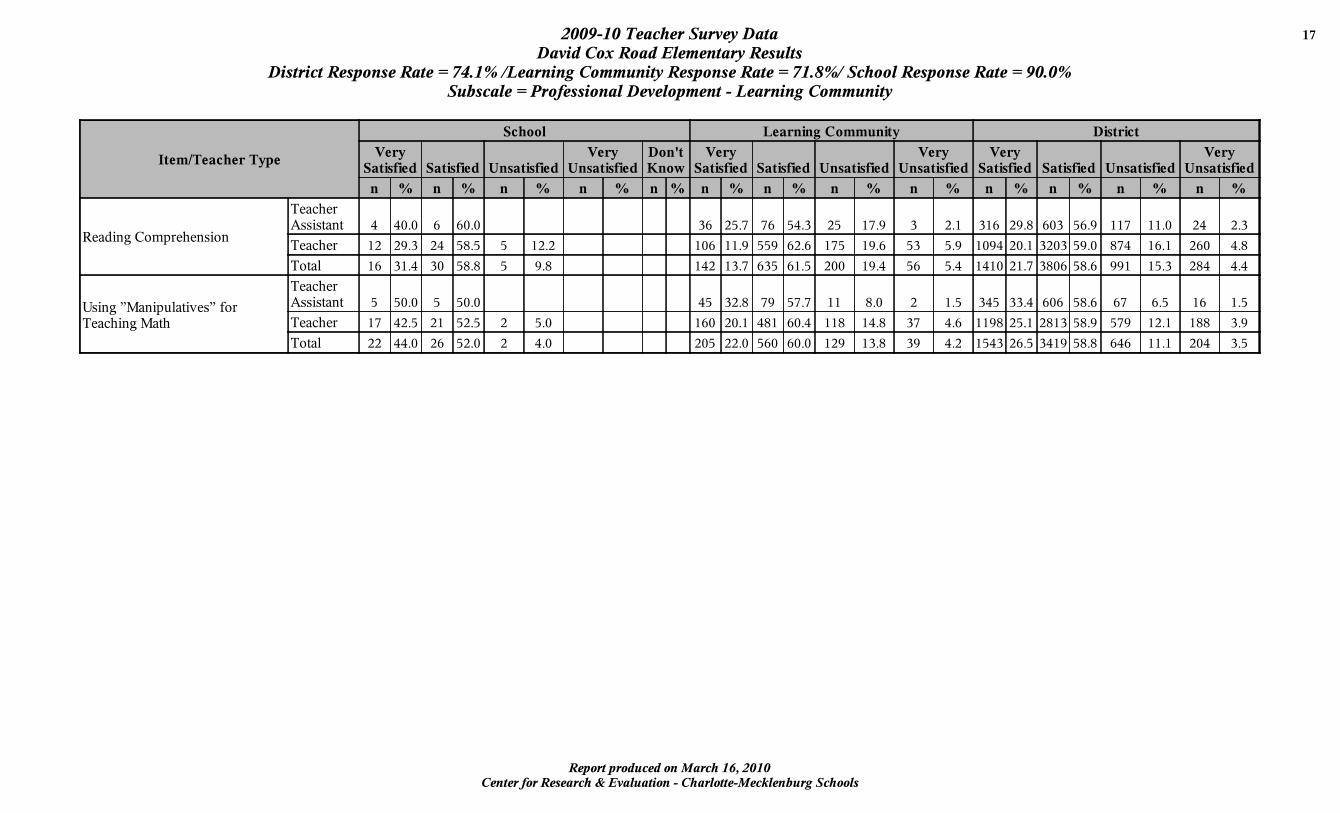
Subscale = Professional Development - Learning Community
I t e m /T e a c h e r T y p e
S c h o o l L e a r n in g C o m m u n it y D is t r ic t
V e r yS a t is f ie d S a t is f ie d U n s a t is f ie d
V e r yU n s a t is f ie d
D o n 'tK n o w
V e r yS a t is f ie d S a t is f ie d U n s a t is f ie d
V e r yU n s a t is f ie d
V e r yS a t is f ie d S a t is f ie d U n s a t is f ie d
V e r yU n s a t is f ie d
n % n % n % n % n % n % n % n % n % n % n % n % n %
R e a d in g C o m p r e h e n s io n
T e a c h e rA s s is ta n t 4 4 0 .0 6 6 0 .0 3 6 2 5 .7 7 6 5 4 .3 2 5 1 7 .9 3 2 .1 3 1 6 2 9 .8 6 0 3 5 6 .9 1 1 7 1 1 .0 2 4 2 .3
T e a c h e r 1 2 2 9 .3 2 4 5 8 .5 5 1 2 .2 1 0 6 1 1 .9 5 5 9 6 2 .6 1 7 5 1 9 .6 5 3 5 .9 1 0 9 4 2 0 .1 3 2 0 3 5 9 .0 8 7 4 1 6 .1 2 6 0 4 .8
T o ta l 1 6 3 1 .4 3 0 5 8 .8 5 9 .8 1 4 2 1 3 .7 6 3 5 6 1 .5 2 0 0 1 9 .4 5 6 5 .4 1 4 1 0 2 1 .7 3 8 0 6 5 8 .6 9 9 1 1 5 .3 2 8 4 4 .4
U s in g ”M a n ip u la t iv e s ” f o rT e a c h in g M a th
T e a c h e rA s s is ta n t 5 5 0 .0 5 5 0 .0 4 5 3 2 .8 7 9 5 7 .7 1 1 8 .0 2 1 .5 3 4 5 3 3 .4 6 0 6 5 8 .6 6 7 6 .5 1 6 1 .5
T e a c h e r 1 7 4 2 .5 2 1 5 2 .5 2 5 .0 1 6 0 2 0 .1 4 8 1 6 0 .4 1 1 8 1 4 .8 3 7 4 .6 1 1 9 8 2 5 .1 2 8 1 3 5 8 .9 5 7 9 1 2 .1 1 8 8 3 .9
T o ta l 2 2 4 4 .0 2 6 5 2 .0 2 4 .0 2 0 5 2 2 .0 5 6 0 6 0 .0 1 2 9 1 3 .8 3 9 4 .2 1 5 4 3 2 6 .5 3 4 1 9 5 8 .8 6 4 6 1 1 .1 2 0 4 3 .5
Cen ter for Research & Evaluation - Charlotte-M eck lenburg SchoolsReport produced on M arch 16 , 2010
2009-10 Teacher Survey Data 1 8
David Cox Road Elementary ResultsD istrict Response Rate = 74.1% /Learning Community Response Rate = 71.8% / School Response Rate = 90.0%
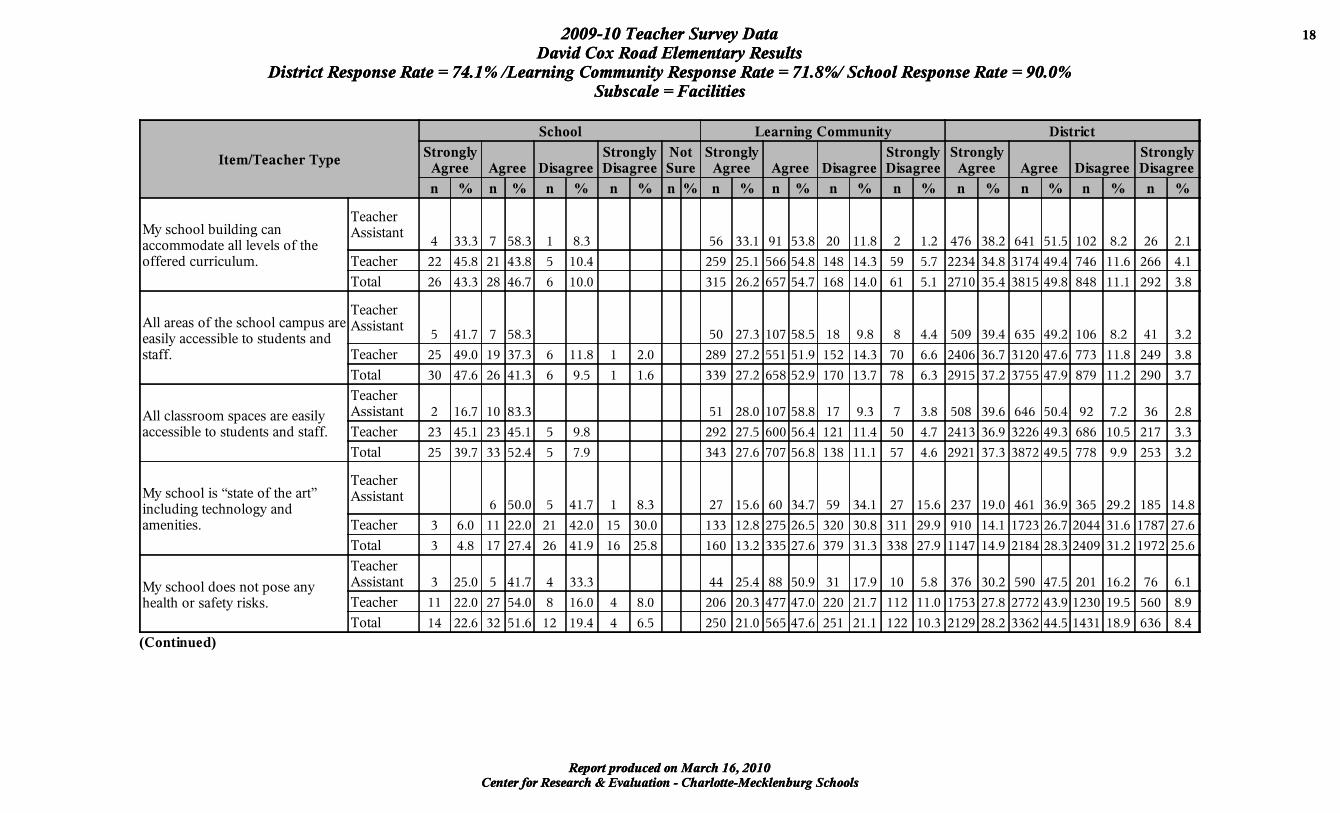
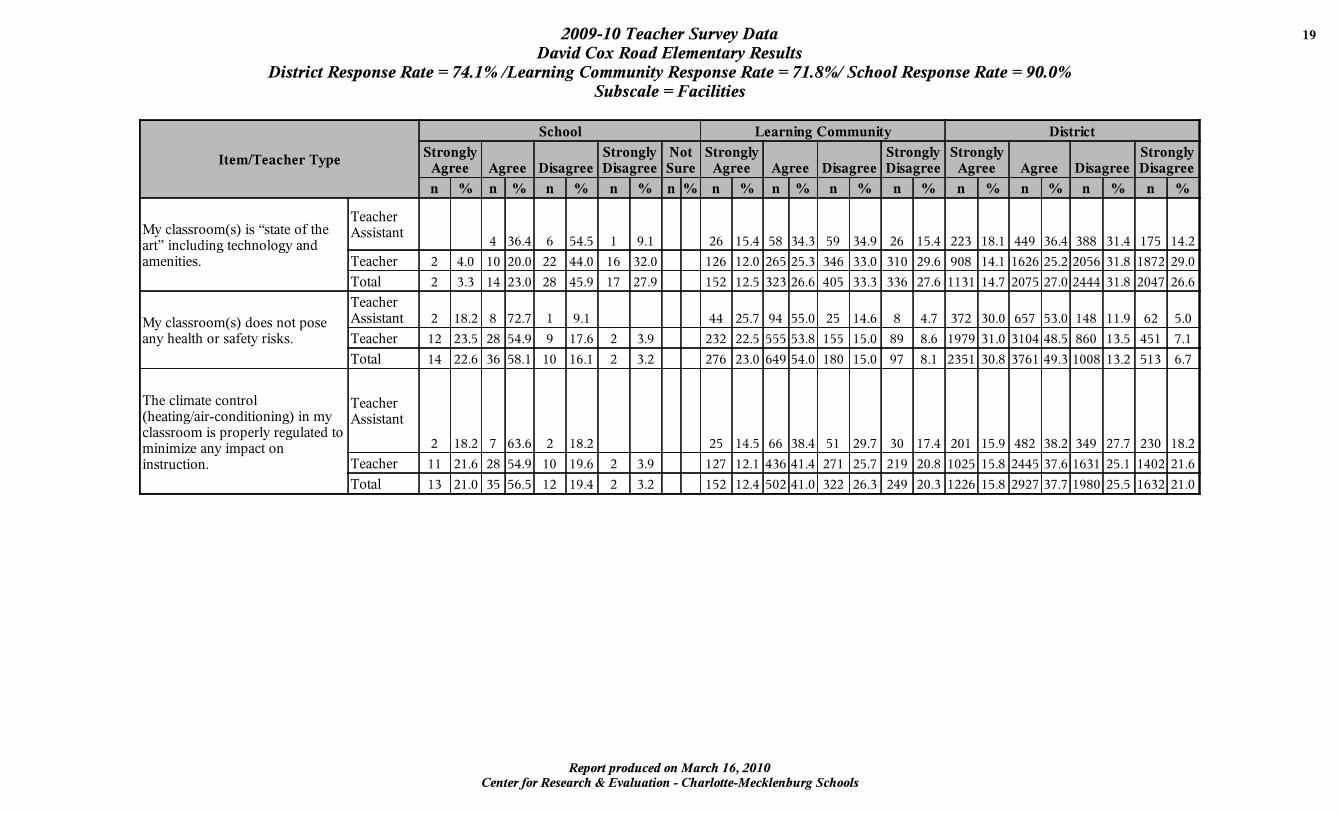
Subscale = Facilities
Cen ter for Research & Evaluation - Charlotte-M eck lenburg SchoolsReport produced on M arch 16 , 2010
2009-10 Teacher Survey Data 1 8
David Cox Road Elementary ResultsD istrict Response Rate = 74.1% /Learning Community Response Rate = 71.8% / School Response Rate = 90.0%
Subscale = Facilities
I t e m /T e a c h e r T y p e
S c h o o l L e a r n in g C o m m u n it y D is t r ic t
S t r o n g lyA g r e e A g r e e D is a g r e e
S t r o n g lyD is a g r e e
N o tS u r e
S t r o n g lyA g r e e A g r e e D is a g r e e
S t r o n g lyD is a g r e e
S t r o n g lyA g r e e A g r e e D is a g r e e
S t r o n g lyD is a g r e e
n % n % n % n % n % n % n % n % n % n % n % n % n %
M y s c h o o l b u i ld in g c a na c c o m m o d a te a l l le v e ls o f th eo f f e r e d c u r r ic u lu m .
T e a c h e rA s s is ta n t
4 3 3 .3 7 5 8 .3 1 8 .3 5 6 3 3 .1 9 1 5 3 .8 2 0 1 1 .8 2 1 .2 4 7 6 3 8 .2 6 4 1 5 1 .5 1 0 2 8 .2 2 6 2 .1
T e a c h e r 2 2 4 5 .8 2 1 4 3 .8 5 1 0 .4 2 5 9 2 5 .1 5 6 6 5 4 .8 1 4 8 1 4 .3 5 9 5 .7 2 2 3 4 3 4 .8 3 1 7 4 4 9 .4 7 4 6 1 1 .6 2 6 6 4 .1
T o ta l 2 6 4 3 .3 2 8 4 6 .7 6 1 0 .0 3 1 5 2 6 .2 6 5 7 5 4 .7 1 6 8 1 4 .0 6 1 5 .1 2 7 1 0 3 5 .4 3 8 1 5 4 9 .8 8 4 8 1 1 .1 2 9 2 3 .8
A ll a r e a s o f th e s c h o o l c am p u s a r ee a s i ly a c c e s s ib le to s tu d e n ts a n ds ta f f .
T e a c h e rA s s is ta n t
5 4 1 .7 7 5 8 .3 5 0 2 7 .3 1 0 7 5 8 .5 1 8 9 .8 8 4 .4 5 0 9 3 9 .4 6 3 5 4 9 .2 1 0 6 8 .2 4 1 3 .2
T e a c h e r 2 5 4 9 .0 1 9 3 7 .3 6 1 1 .8 1 2 .0 2 8 9 2 7 .2 5 5 1 5 1 .9 1 5 2 1 4 .3 7 0 6 .6 2 4 0 6 3 6 .7 3 1 2 0 4 7 .6 7 7 3 1 1 .8 2 4 9 3 .8
T o ta l 3 0 4 7 .6 2 6 4 1 .3 6 9 .5 1 1 .6 3 3 9 2 7 .2 6 5 8 5 2 .9 1 7 0 1 3 .7 7 8 6 .3 2 9 1 5 3 7 .2 3 7 5 5 4 7 .9 8 7 9 1 1 .2 2 9 0 3 .7
A ll c la s s r o o m s p a c e s a r e e a s i lya c c e s s ib le to s tu d e n ts a n d s ta f f .
T e a c h e rA s s is ta n t 2 1 6 .7 1 0 8 3 .3 5 1 2 8 .0 1 0 7 5 8 .8 1 7 9 .3 7 3 .8 5 0 8 3 9 .6 6 4 6 5 0 .4 9 2 7 .2 3 6 2 .8
T e a c h e r 2 3 4 5 .1 2 3 4 5 .1 5 9 .8 2 9 2 2 7 .5 6 0 0 5 6 .4 1 2 1 1 1 .4 5 0 4 .7 2 4 1 3 3 6 .9 3 2 2 6 4 9 .3 6 8 6 1 0 .5 2 1 7 3 .3
T o ta l 2 5 3 9 .7 3 3 5 2 .4 5 7 .9 3 4 3 2 7 .6 7 0 7 5 6 .8 1 3 8 1 1 .1 5 7 4 .6 2 9 2 1 3 7 .3 3 8 7 2 4 9 .5 7 7 8 9 .9 2 5 3 3 .2
M y s c h o o l i s “ s ta te o f th e a r t”in c lu d in g te c h n o lo g y a n dam e n i t ie s .
T e a c h e rA s s is ta n t
6 5 0 .0 5 4 1 .7 1 8 .3 2 7 1 5 .6 6 0 3 4 .7 5 9 3 4 .1 2 7 1 5 .6 2 3 7 1 9 .0 4 6 1 3 6 .9 3 6 5 2 9 .2 1 8 5 1 4 .8
T e a c h e r 3 6 .0 1 1 2 2 .0 2 1 4 2 .0 1 5 3 0 .0 1 3 3 1 2 .8 2 7 5 2 6 .5 3 2 0 3 0 .8 3 1 1 2 9 .9 9 1 0 1 4 .1 1 7 2 3 2 6 .7 2 0 4 4 3 1 .6 1 7 8 7 2 7 .6
T o ta l 3 4 .8 1 7 2 7 .4 2 6 4 1 .9 1 6 2 5 .8 1 6 0 1 3 .2 3 3 5 2 7 .6 3 7 9 3 1 .3 3 3 8 2 7 .9 1 1 4 7 1 4 .9 2 1 8 4 2 8 .3 2 4 0 9 3 1 .2 1 9 7 2 2 5 .6
M y s c h o o l d o e s n o t p o s e a n yh e a l th o r s a f e ty r i s k s .
T e a c h e rA s s is ta n t 3 2 5 .0 5 4 1 .7 4 3 3 .3 4 4 2 5 .4 8 8 5 0 .9 3 1 1 7 .9 1 0 5 .8 3 7 6 3 0 .2 5 9 0 4 7 .5 2 0 1 1 6 .2 7 6 6 .1
T e a c h e r 1 1 2 2 .0 2 7 5 4 .0 8 1 6 .0 4 8 .0 2 0 6 2 0 .3 4 7 7 4 7 .0 2 2 0 2 1 .7 1 1 2 1 1 .0 1 7 5 3 2 7 .8 2 7 7 2 4 3 .9 1 2 3 0 1 9 .5 5 6 0 8 .9
T o ta l 1 4 2 2 .6 3 2 5 1 .6 1 2 1 9 .4 4 6 .5 2 5 0 2 1 .0 5 6 5 4 7 .6 2 5 1 2 1 .1 1 2 2 1 0 .3 2 1 2 9 2 8 .2 3 3 6 2 4 4 .5 1 4 3 1 1 8 .9 6 3 6 8 .4
(C o n t in u e d )
Cen ter for Research & Evaluation - Charlotte-M eck lenburg SchoolsReport produced on M arch 16 , 2010
2009-10 Teacher Survey Data 1 9
David Cox Road Elementary ResultsD istrict Response Rate = 74.1% /Learning Community Response Rate = 71.8% / School Response Rate = 90.0%
Subscale = Facilities
I t e m /T e a c h e r T y p e
S c h o o l L e a r n in g C o m m u n it y D is t r ic t
S t r o n g lyA g r e e A g r e e D is a g r e e
S t r o n g lyD is a g r e e
N o tS u r e
S t r o n g lyA g r e e A g r e e D is a g r e e
S t r o n g lyD is a g r e e
S t r o n g lyA g r e e A g r e e D is a g r e e
S t r o n g lyD is a g r e e
n % n % n % n % n % n % n % n % n % n % n % n % n %
M y c la s s r o o m ( s ) i s “ s ta te o f th ea r t” in c lu d in g te c h n o lo g y a n dam e n i t ie s .
T e a c h e rA s s is ta n t
4 3 6 .4 6 5 4 .5 1 9 .1 2 6 1 5 .4 5 8 3 4 .3 5 9 3 4 .9 2 6 1 5 .4 2 2 3 1 8 .1 4 4 9 3 6 .4 3 8 8 3 1 .4 1 7 5 1 4 .2
T e a c h e r 2 4 .0 1 0 2 0 .0 2 2 4 4 .0 1 6 3 2 .0 1 2 6 1 2 .0 2 6 5 2 5 .3 3 4 6 3 3 .0 3 1 0 2 9 .6 9 0 8 1 4 .1 1 6 2 6 2 5 .2 2 0 5 6 3 1 .8 1 8 7 2 2 9 .0
T o ta l 2 3 .3 1 4 2 3 .0 2 8 4 5 .9 1 7 2 7 .9 1 5 2 1 2 .5 3 2 3 2 6 .6 4 0 5 3 3 .3 3 3 6 2 7 .6 1 1 3 1 1 4 .7 2 0 7 5 2 7 .0 2 4 4 4 3 1 .8 2 0 4 7 2 6 .6
M y c la s s r o o m ( s ) d o e s n o t p o s ea n y h e a l th o r s a f e ty r i s k s .
T e a c h e rA s s is ta n t 2 1 8 .2 8 7 2 .7 1 9 .1 4 4 2 5 .7 9 4 5 5 .0 2 5 1 4 .6 8 4 .7 3 7 2 3 0 .0 6 5 7 5 3 .0 1 4 8 1 1 .9 6 2 5 .0
T e a c h e r 1 2 2 3 .5 2 8 5 4 .9 9 1 7 .6 2 3 .9 2 3 2 2 2 .5 5 5 5 5 3 .8 1 5 5 1 5 .0 8 9 8 .6 1 9 7 9 3 1 .0 3 1 0 4 4 8 .5 8 6 0 1 3 .5 4 5 1 7 .1
T o ta l 1 4 2 2 .6 3 6 5 8 .1 1 0 1 6 .1 2 3 .2 2 7 6 2 3 .0 6 4 9 5 4 .0 1 8 0 1 5 .0 9 7 8 .1 2 3 5 1 3 0 .8 3 7 6 1 4 9 .3 1 0 0 8 1 3 .2 5 1 3 6 .7
T h e c l im a te c o n tr o l( h e a t in g /a i r - c o n d i t io n in g ) in m yc la s s r o o m is p r o p e r ly r e g u la te d tom in im iz e a n y im p a c t o nin s t r u c t io n .
T e a c h e rA s s is ta n t
2 1 8 .2 7 6 3 .6 2 1 8 .2 2 5 1 4 .5 6 6 3 8 .4 5 1 2 9 .7 3 0 1 7 .4 2 0 1 1 5 .9 4 8 2 3 8 .2 3 4 9 2 7 .7 2 3 0 1 8 .2
T e a c h e r 1 1 2 1 .6 2 8 5 4 .9 1 0 1 9 .6 2 3 .9 1 2 7 1 2 .1 4 3 6 4 1 .4 2 7 1 2 5 .7 2 1 9 2 0 .8 1 0 2 5 1 5 .8 2 4 4 5 3 7 .6 1 6 3 1 2 5 .1 1 4 0 2 2 1 .6
T o ta l 1 3 2 1 .0 3 5 5 6 .5 1 2 1 9 .4 2 3 .2 1 5 2 1 2 .4 5 0 2 4 1 .0 3 2 2 2 6 .3 2 4 9 2 0 .3 1 2 2 6 1 5 .8 2 9 2 7 3 7 .7 1 9 8 0 2 5 .5 1 6 3 2 2 1 .0
Cen ter for Research & Evaluation - Charlotte-M eck lenburg SchoolsReport produced on M arch 16 , 2010
2009-10 Teacher Survey Data 2 0
David Cox Road Elementary ResultsD istrict Response Rate = 74.1% /Learning Community Response Rate = 71.8% / School Response Rate = 90.0%
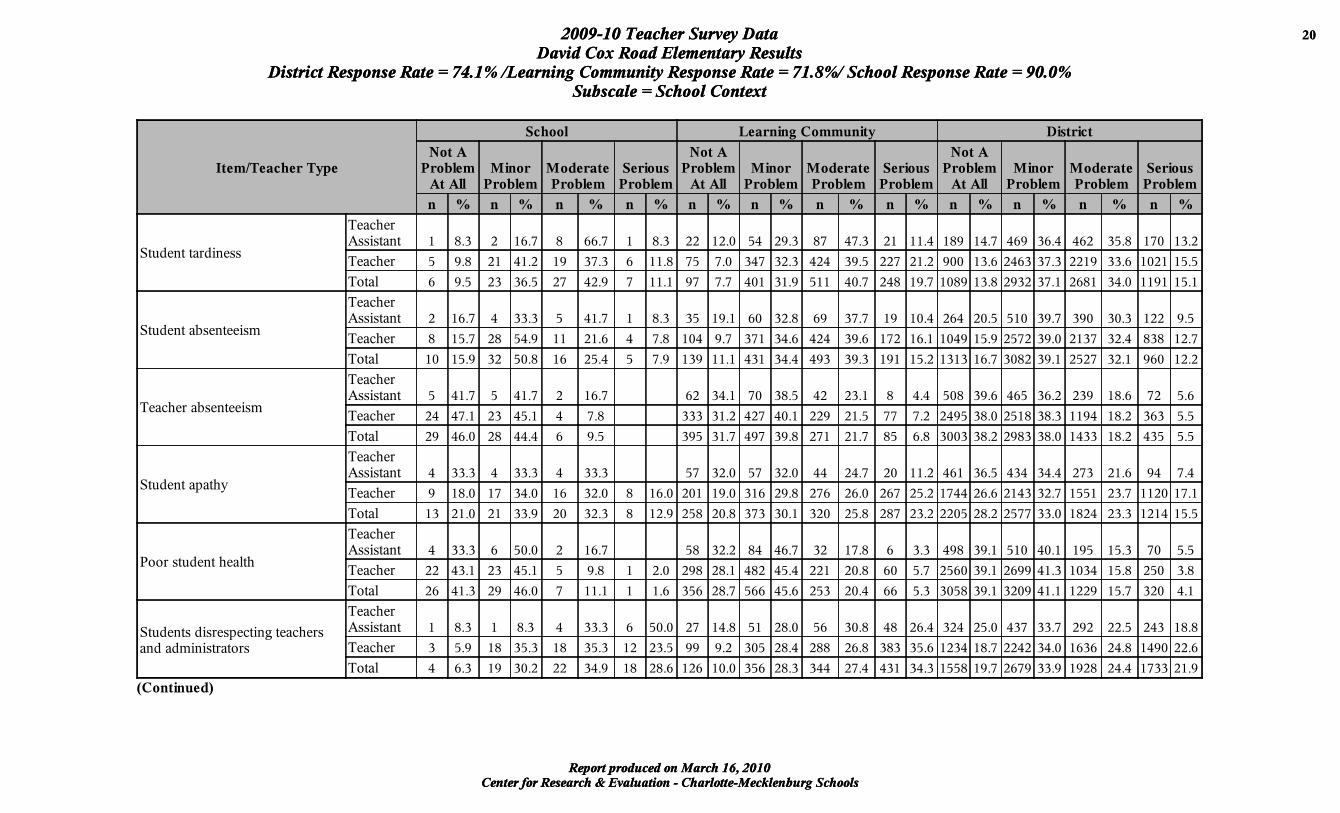
Subscale = School Context
Cen ter for Research & Evaluation - Charlotte-M eck lenburg SchoolsReport produced on M arch 16 , 2010
2009-10 Teacher Survey Data 2 0
David Cox Road Elementary ResultsD istrict Response Rate = 74.1% /Learning Community Response Rate = 71.8% / School Response Rate = 90.0%
Subscale = School Context
I t e m /T e a c h e r T y p e
S c h o o l L e a r n in g C o m m u n it y D is t r ic t
N o t AP r o b le mA t A ll
M in o rP r o b le m
M o d e r a t eP r o b le m
S e r io u sP r o b le m
N o t AP r o b le mA t A ll
M in o rP r o b le m
M o d e r a t eP r o b le m
S e r io u sP r o b le m
N o t AP r o b le mA t A ll
M in o rP r o b le m
M o d e r a t eP r o b le m
S e r io u sP r o b le m
n % n % n % n % n % n % n % n % n % n % n % n %
S tu d e n t ta r d in e s s
T e a c h e rA s s is ta n t 1 8 .3 2 1 6 .7 8 6 6 .7 1 8 .3 2 2 1 2 .0 5 4 2 9 .3 8 7 4 7 .3 2 1 1 1 .4 1 8 9 1 4 .7 4 6 9 3 6 .4 4 6 2 3 5 .8 1 7 0 1 3 .2
T e a c h e r 5 9 .8 2 1 4 1 .2 1 9 3 7 .3 6 1 1 .8 7 5 7 .0 3 4 7 3 2 .3 4 2 4 3 9 .5 2 2 7 2 1 .2 9 0 0 1 3 .6 2 4 6 3 3 7 .3 2 2 1 9 3 3 .6 1 0 2 1 1 5 .5
T o ta l 6 9 .5 2 3 3 6 .5 2 7 4 2 .9 7 1 1 .1 9 7 7 .7 4 0 1 3 1 .9 5 1 1 4 0 .7 2 4 8 1 9 .7 1 0 8 9 1 3 .8 2 9 3 2 3 7 .1 2 6 8 1 3 4 .0 1 1 9 1 1 5 .1
S tu d e n t a b s e n te e ism
T e a c h e rA s s is ta n t 2 1 6 .7 4 3 3 .3 5 4 1 .7 1 8 .3 3 5 1 9 .1 6 0 3 2 .8 6 9 3 7 .7 1 9 1 0 .4 2 6 4 2 0 .5 5 1 0 3 9 .7 3 9 0 3 0 .3 1 2 2 9 .5
T e a c h e r 8 1 5 .7 2 8 5 4 .9 1 1 2 1 .6 4 7 .8 1 0 4 9 .7 3 7 1 3 4 .6 4 2 4 3 9 .6 1 7 2 1 6 .1 1 0 4 9 1 5 .9 2 5 7 2 3 9 .0 2 1 3 7 3 2 .4 8 3 8 1 2 .7
T o ta l 1 0 1 5 .9 3 2 5 0 .8 1 6 2 5 .4 5 7 .9 1 3 9 1 1 .1 4 3 1 3 4 .4 4 9 3 3 9 .3 1 9 1 1 5 .2 1 3 1 3 1 6 .7 3 0 8 2 3 9 .1 2 5 2 7 3 2 .1 9 6 0 1 2 .2
T e a c h e r a b s e n te e ism
T e a c h e rA s s is ta n t 5 4 1 .7 5 4 1 .7 2 1 6 .7 6 2 3 4 .1 7 0 3 8 .5 4 2 2 3 .1 8 4 .4 5 0 8 3 9 .6 4 6 5 3 6 .2 2 3 9 1 8 .6 7 2 5 .6
T e a c h e r 2 4 4 7 .1 2 3 4 5 .1 4 7 .8 3 3 3 3 1 .2 4 2 7 4 0 .1 2 2 9 2 1 .5 7 7 7 .2 2 4 9 5 3 8 .0 2 5 1 8 3 8 .3 1 1 9 4 1 8 .2 3 6 3 5 .5
T o ta l 2 9 4 6 .0 2 8 4 4 .4 6 9 .5 3 9 5 3 1 .7 4 9 7 3 9 .8 2 7 1 2 1 .7 8 5 6 .8 3 0 0 3 3 8 .2 2 9 8 3 3 8 .0 1 4 3 3 1 8 .2 4 3 5 5 .5
S tu d e n t a p a th y
T e a c h e rA s s is ta n t 4 3 3 .3 4 3 3 .3 4 3 3 .3 5 7 3 2 .0 5 7 3 2 .0 4 4 2 4 .7 2 0 1 1 .2 4 6 1 3 6 .5 4 3 4 3 4 .4 2 7 3 2 1 .6 9 4 7 .4
T e a c h e r 9 1 8 .0 1 7 3 4 .0 1 6 3 2 .0 8 1 6 .0 2 0 1 1 9 .0 3 1 6 2 9 .8 2 7 6 2 6 .0 2 6 7 2 5 .2 1 7 4 4 2 6 .6 2 1 4 3 3 2 .7 1 5 5 1 2 3 .7 1 1 2 0 1 7 .1
T o ta l 1 3 2 1 .0 2 1 3 3 .9 2 0 3 2 .3 8 1 2 .9 2 5 8 2 0 .8 3 7 3 3 0 .1 3 2 0 2 5 .8 2 8 7 2 3 .2 2 2 0 5 2 8 .2 2 5 7 7 3 3 .0 1 8 2 4 2 3 .3 1 2 1 4 1 5 .5
P o o r s tu d e n t h e a l th
T e a c h e rA s s is ta n t 4 3 3 .3 6 5 0 .0 2 1 6 .7 5 8 3 2 .2 8 4 4 6 .7 3 2 1 7 .8 6 3 .3 4 9 8 3 9 .1 5 1 0 4 0 .1 1 9 5 1 5 .3 7 0 5 .5
T e a c h e r 2 2 4 3 .1 2 3 4 5 .1 5 9 .8 1 2 .0 2 9 8 2 8 .1 4 8 2 4 5 .4 2 2 1 2 0 .8 6 0 5 .7 2 5 6 0 3 9 .1 2 6 9 9 4 1 .3 1 0 3 4 1 5 .8 2 5 0 3 .8
T o ta l 2 6 4 1 .3 2 9 4 6 .0 7 1 1 .1 1 1 .6 3 5 6 2 8 .7 5 6 6 4 5 .6 2 5 3 2 0 .4 6 6 5 .3 3 0 5 8 3 9 .1 3 2 0 9 4 1 .1 1 2 2 9 1 5 .7 3 2 0 4 .1
S tu d e n ts d is r e s p e c t in g te a c h e r sa n d a d m in is t r a to r s
T e a c h e rA s s is ta n t 1 8 .3 1 8 .3 4 3 3 .3 6 5 0 .0 2 7 1 4 .8 5 1 2 8 .0 5 6 3 0 .8 4 8 2 6 .4 3 2 4 2 5 .0 4 3 7 3 3 .7 2 9 2 2 2 .5 2 4 3 1 8 .8
T e a c h e r 3 5 .9 1 8 3 5 .3 1 8 3 5 .3 1 2 2 3 .5 9 9 9 .2 3 0 5 2 8 .4 2 8 8 2 6 .8 3 8 3 3 5 .6 1 2 3 4 1 8 .7 2 2 4 2 3 4 .0 1 6 3 6 2 4 .8 1 4 9 0 2 2 .6
T o ta l 4 6 .3 1 9 3 0 .2 2 2 3 4 .9 1 8 2 8 .6 1 2 6 1 0 .0 3 5 6 2 8 .3 3 4 4 2 7 .4 4 3 1 3 4 .3 1 5 5 8 1 9 .7 2 6 7 9 3 3 .9 1 9 2 8 2 4 .4 1 7 3 3 2 1 .9
(C o n t in u e d )
Cen ter for Research & Evaluation - Charlotte-M eck lenburg SchoolsReport produced on M arch 16 , 2010
2009-10 Teacher Survey Data 2 1
David Cox Road Elementary ResultsD istrict Response Rate = 74.1% /Learning Community Response Rate = 71.8% / School Response Rate = 90.0%
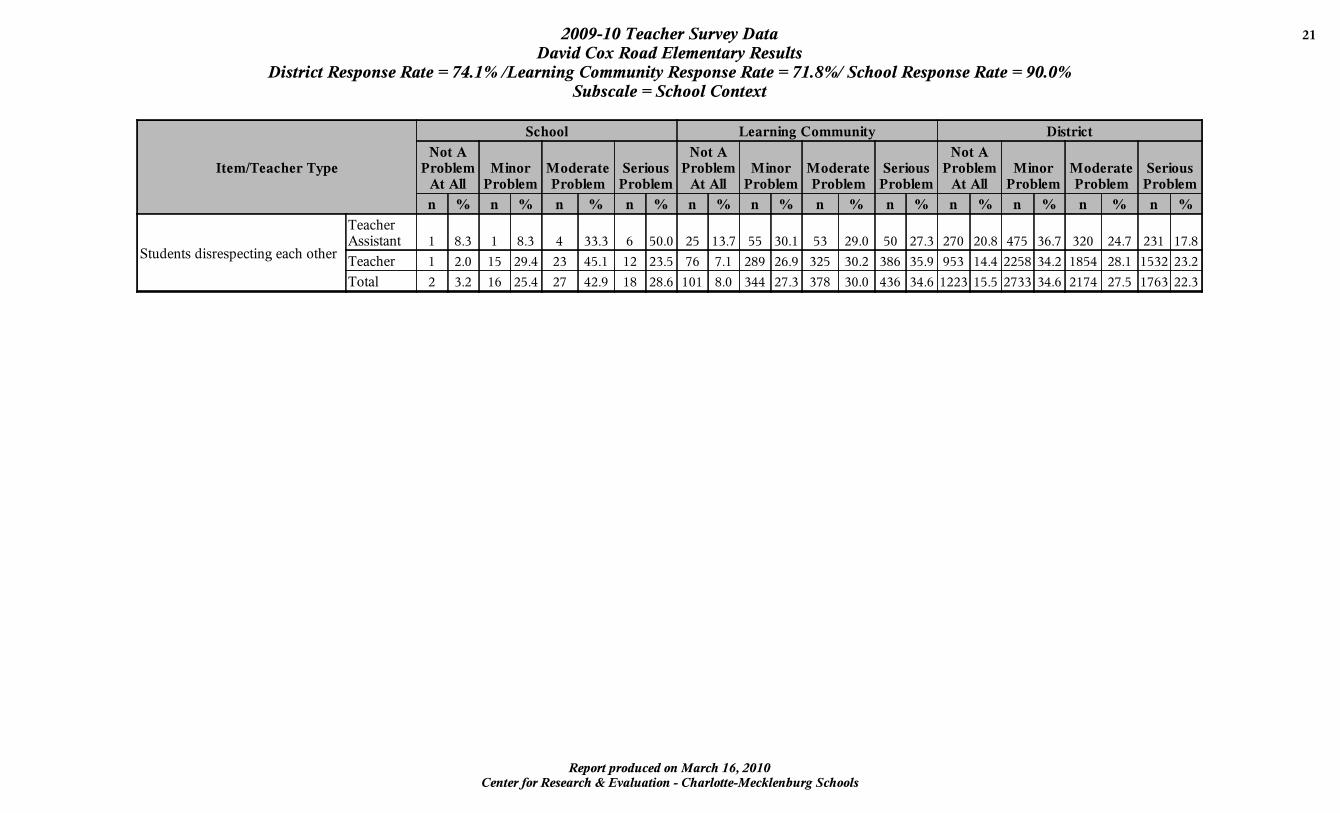
Subscale = School Context
I t e m /T e a c h e r T y p e
S c h o o l L e a r n in g C o m m u n it y D is t r ic t
N o t AP r o b le mA t A ll
M in o rP r o b le m
M o d e r a t eP r o b le m
S e r io u sP r o b le m
N o t AP r o b le mA t A ll
M in o rP r o b le m
M o d e r a t eP r o b le m
S e r io u sP r o b le m
N o t AP r o b le mA t A ll
M in o rP r o b le m
M o d e r a t eP r o b le m
S e r io u sP r o b le m
n % n % n % n % n % n % n % n % n % n % n % n %
S tu d e n ts d is r e s p e c t in g e a c h o th e r
T e a c h e rA s s is ta n t 1 8 .3 1 8 .3 4 3 3 .3 6 5 0 .0 2 5 1 3 .7 5 5 3 0 .1 5 3 2 9 .0 5 0 2 7 .3 2 7 0 2 0 .8 4 7 5 3 6 .7 3 2 0 2 4 .7 2 3 1 1 7 .8
T e a c h e r 1 2 .0 1 5 2 9 .4 2 3 4 5 .1 1 2 2 3 .5 7 6 7 .1 2 8 9 2 6 .9 3 2 5 3 0 .2 3 8 6 3 5 .9 9 5 3 1 4 .4 2 2 5 8 3 4 .2 1 8 5 4 2 8 .1 1 5 3 2 2 3 .2
T o ta l 2 3 .2 1 6 2 5 .4 2 7 4 2 .9 1 8 2 8 .6 1 0 1 8 .0 3 4 4 2 7 .3 3 7 8 3 0 .0 4 3 6 3 4 .6 1 2 2 3 1 5 .5 2 7 3 3 3 4 .6 2 1 7 4 2 7 .5 1 7 6 3 2 2 .3
Cen ter for Research & Evaluation - Charlotte-M eck lenburg SchoolsReport produced on M arch 16 , 2010
2009-10 Teacher Survey Data 2 2
David Cox Road Elementary ResultsD istrict Response Rate = 74.1% /Learning Community Response Rate = 71.8% / School Response Rate = 90.0%
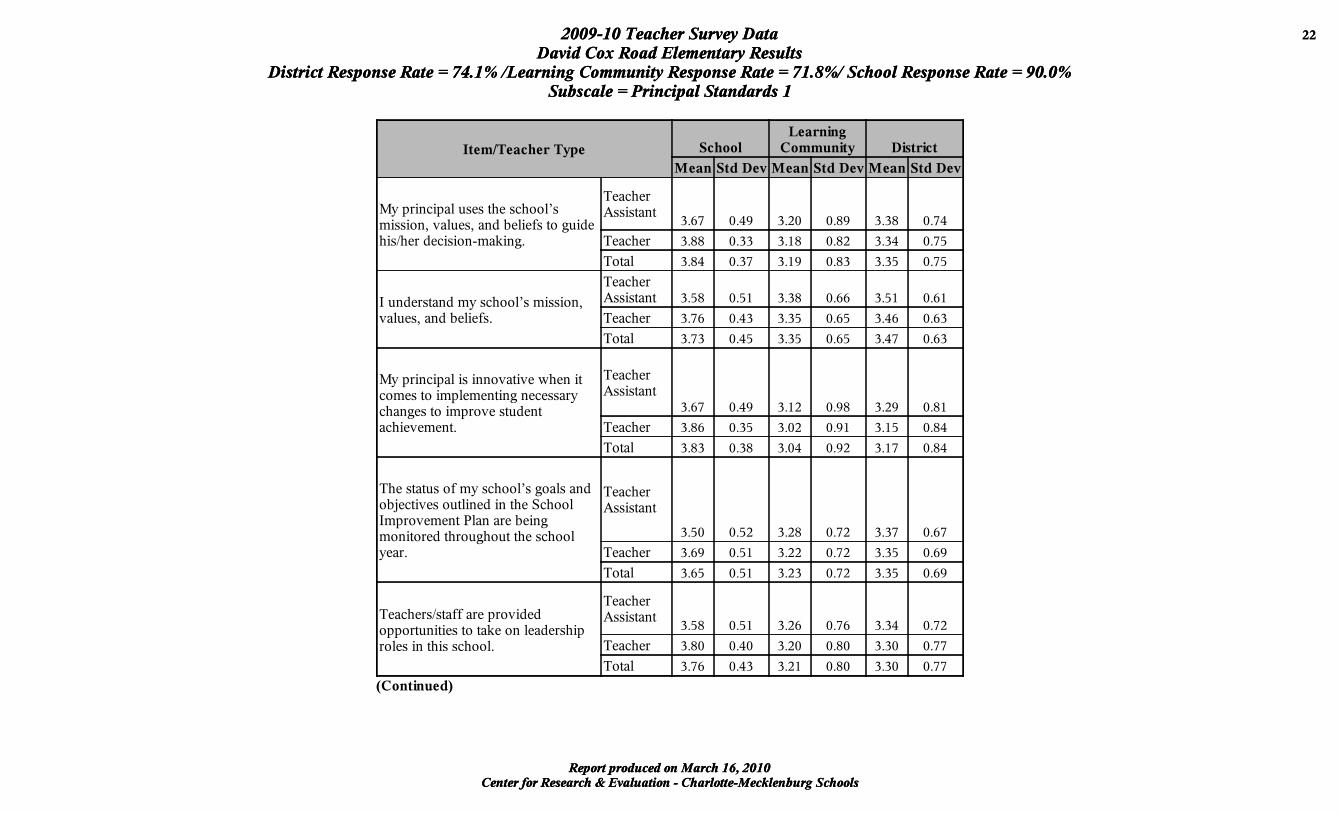
Subscale = Principal Standards 1
Cen ter for Research & Evaluation - Charlotte-M eck lenburg SchoolsReport produced on M arch 16 , 2010
2009-10 Teacher Survey Data 2 2
David Cox Road Elementary ResultsD istrict Response Rate = 74.1% /Learning Community Response Rate = 71.8% / School Response Rate = 90.0%
Subscale = Principal Standards 1
I t e m /T e a c h e r T y p e S c h o o lL e a r n in g
C om m u n it y D is t r ic t
M e a n S td D e v M e a n S td D e v M e a n S td D e v
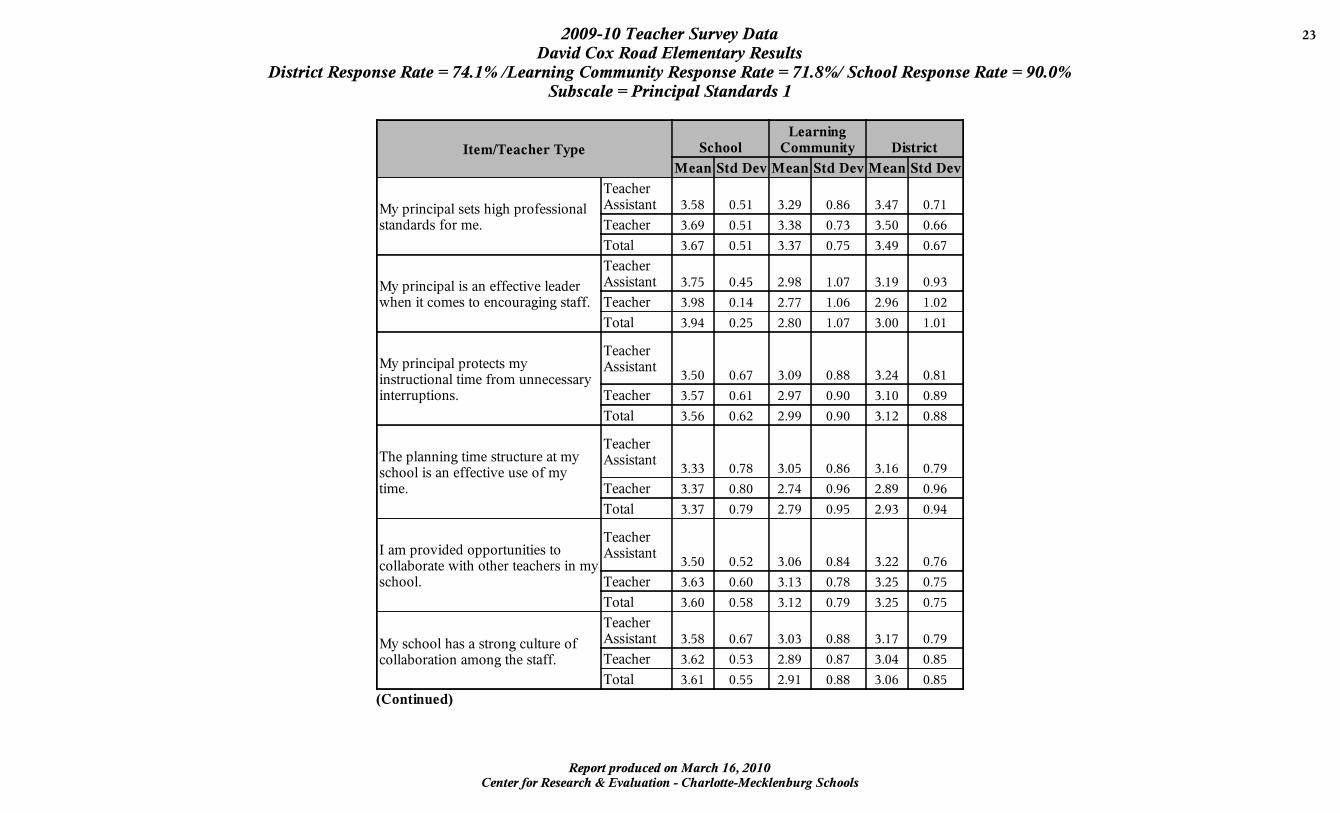
M y p r in c ip a l u s e s th e s c h o o l ’ sm is s io n , v a lu e s , a n d b e l ie f s to g u id eh is /h e r d e c is io n -m a k in g .
T e a c h e rA s s is ta n t
3 .6 7 0 .4 9 3 .2 0 0 .8 9 3 .3 8 0 .7 4
T e a c h e r 3 .8 8 0 .3 3 3 .1 8 0 .8 2 3 .3 4 0 .7 5
T o ta l 3 .8 4 0 .3 7 3 .1 9 0 .8 3 3 .3 5 0 .7 5
I u n d e r s ta n d m y s c h o o l ’ s m is s io n ,v a lu e s , a n d b e l ie f s .
T e a c h e rA s s is ta n t 3 .5 8 0 .5 1 3 .3 8 0 .6 6 3 .5 1 0 .6 1
T e a c h e r 3 .7 6 0 .4 3 3 .3 5 0 .6 5 3 .4 6 0 .6 3
T o ta l 3 .7 3 0 .4 5 3 .3 5 0 .6 5 3 .4 7 0 .6 3
M y p r in c ip a l i s in n o v a t iv e w h e n i tc o m e s to im p lem e n t in g n e c e s s a r yc h a n g e s to im p ro v e s tu d e n ta c h ie v em e n t .
T e a c h e rA s s is ta n t
3 .6 7 0 .4 9 3 .1 2 0 .9 8 3 .2 9 0 .8 1
T e a c h e r 3 .8 6 0 .3 5 3 .0 2 0 .9 1 3 .1 5 0 .8 4
T o ta l 3 .8 3 0 .3 8 3 .0 4 0 .9 2 3 .1 7 0 .8 4
T h e s ta tu s o f m y s c h o o l ’ s g o a ls a n do b je c t iv e s o u t l in e d in th e S c h o o lIm p ro v em e n t P la n a r e b e in gm o n i to r e d th r o u g h o u t th e s c h o o ly e a r .
T e a c h e rA s s is ta n t
3 .5 0 0 .5 2 3 .2 8 0 .7 2 3 .3 7 0 .6 7
T e a c h e r 3 .6 9 0 .5 1 3 .2 2 0 .7 2 3 .3 5 0 .6 9
T o ta l 3 .6 5 0 .5 1 3 .2 3 0 .7 2 3 .3 5 0 .6 9
T e a c h e r s /s ta f f a r e p r o v id e do p p o r tu n i t ie s to ta k e o n le a d e r s h ipr o le s in th is s c h o o l .
T e a c h e rA s s is ta n t
3 .5 8 0 .5 1 3 .2 6 0 .7 6 3 .3 4 0 .7 2
T e a c h e r 3 .8 0 0 .4 0 3 .2 0 0 .8 0 3 .3 0 0 .7 7
T o ta l 3 .7 6 0 .4 3 3 .2 1 0 .8 0 3 .3 0 0 .7 7
(C o n t in u e d )
Cen ter for Research & Evaluation - Charlotte-M eck lenburg SchoolsReport produced on M arch 16 , 2010
2009-10 Teacher Survey Data 2 3
David Cox Road Elementary ResultsD istrict Response Rate = 74.1% /Learning Community Response Rate = 71.8% / School Response Rate = 90.0%
Subscale = Principal Standards 1
I t e m /T e a c h e r T y p e S c h o o lL e a r n in g
C om m u n it y D is t r ic t
M e a n S td D e v M e a n S td D e v M e a n S td D e v
M y p r in c ip a l s e ts h ig h p r o f e s s io n a ls ta n d a rd s f o r m e .
T e a c h e rA s s is ta n t 3 .5 8 0 .5 1 3 .2 9 0 .8 6 3 .4 7 0 .7 1
T e a c h e r 3 .6 9 0 .5 1 3 .3 8 0 .7 3 3 .5 0 0 .6 6
T o ta l 3 .6 7 0 .5 1 3 .3 7 0 .7 5 3 .4 9 0 .6 7
M y p r in c ip a l i s a n e f f e c t iv e le a d e rw h e n i t c o m e s to e n c o u r a g in g s ta f f .
T e a c h e rA s s is ta n t 3 .7 5 0 .4 5 2 .9 8 1 .0 7 3 .1 9 0 .9 3
T e a c h e r 3 .9 8 0 .1 4 2 .7 7 1 .0 6 2 .9 6 1 .0 2
T o ta l 3 .9 4 0 .2 5 2 .8 0 1 .0 7 3 .0 0 1 .0 1
M y p r in c ip a l p r o te c ts m yin s t r u c t io n a l t im e f r o m u n n e c e s s a r yin te r r u p t io n s .
T e a c h e rA s s is ta n t
3 .5 0 0 .6 7 3 .0 9 0 .8 8 3 .2 4 0 .8 1
T e a c h e r 3 .5 7 0 .6 1 2 .9 7 0 .9 0 3 .1 0 0 .8 9
T o ta l 3 .5 6 0 .6 2 2 .9 9 0 .9 0 3 .1 2 0 .8 8
T h e p la n n in g t im e s t r u c tu r e a t m ys c h o o l i s a n e f f e c t iv e u s e o f m yt im e .
T e a c h e rA s s is ta n t
3 .3 3 0 .7 8 3 .0 5 0 .8 6 3 .1 6 0 .7 9
T e a c h e r 3 .3 7 0 .8 0 2 .7 4 0 .9 6 2 .8 9 0 .9 6
T o ta l 3 .3 7 0 .7 9 2 .7 9 0 .9 5 2 .9 3 0 .9 4
I a m p ro v id e d o p p o r tu n i t ie s toc o l la b o r a te w i th o th e r te a c h e r s in m ys c h o o l .
T e a c h e rA s s is ta n t
3 .5 0 0 .5 2 3 .0 6 0 .8 4 3 .2 2 0 .7 6
T e a c h e r 3 .6 3 0 .6 0 3 .1 3 0 .7 8 3 .2 5 0 .7 5
T o ta l 3 .6 0 0 .5 8 3 .1 2 0 .7 9 3 .2 5 0 .7 5
M y s c h o o l h a s a s t r o n g c u l tu r e o fc o l la b o r a t io n am o n g th e s ta f f .
T e a c h e rA s s is ta n t 3 .5 8 0 .6 7 3 .0 3 0 .8 8 3 .1 7 0 .7 9
T e a c h e r 3 .6 2 0 .5 3 2 .8 9 0 .8 7 3 .0 4 0 .8 5
T o ta l 3 .6 1 0 .5 5 2 .9 1 0 .8 8 3 .0 6 0 .8 5
(C o n t in u e d )
Cen ter for Research & Evaluation - Charlotte-M eck lenburg SchoolsReport produced on M arch 16 , 2010
2009-10 Teacher Survey Data 2 4
David Cox Road Elementary ResultsD istrict Response Rate = 74.1% /Learning Community Response Rate = 71.8% / School Response Rate = 90.0%
Subscale = Principal Standards 1
I t e m /T e a c h e r T y p e S c h o o lL e a r n in g
C om m u n it y D is t r ic t
M e a n S td D e v M e a n S td D e v M e a n S td D e v
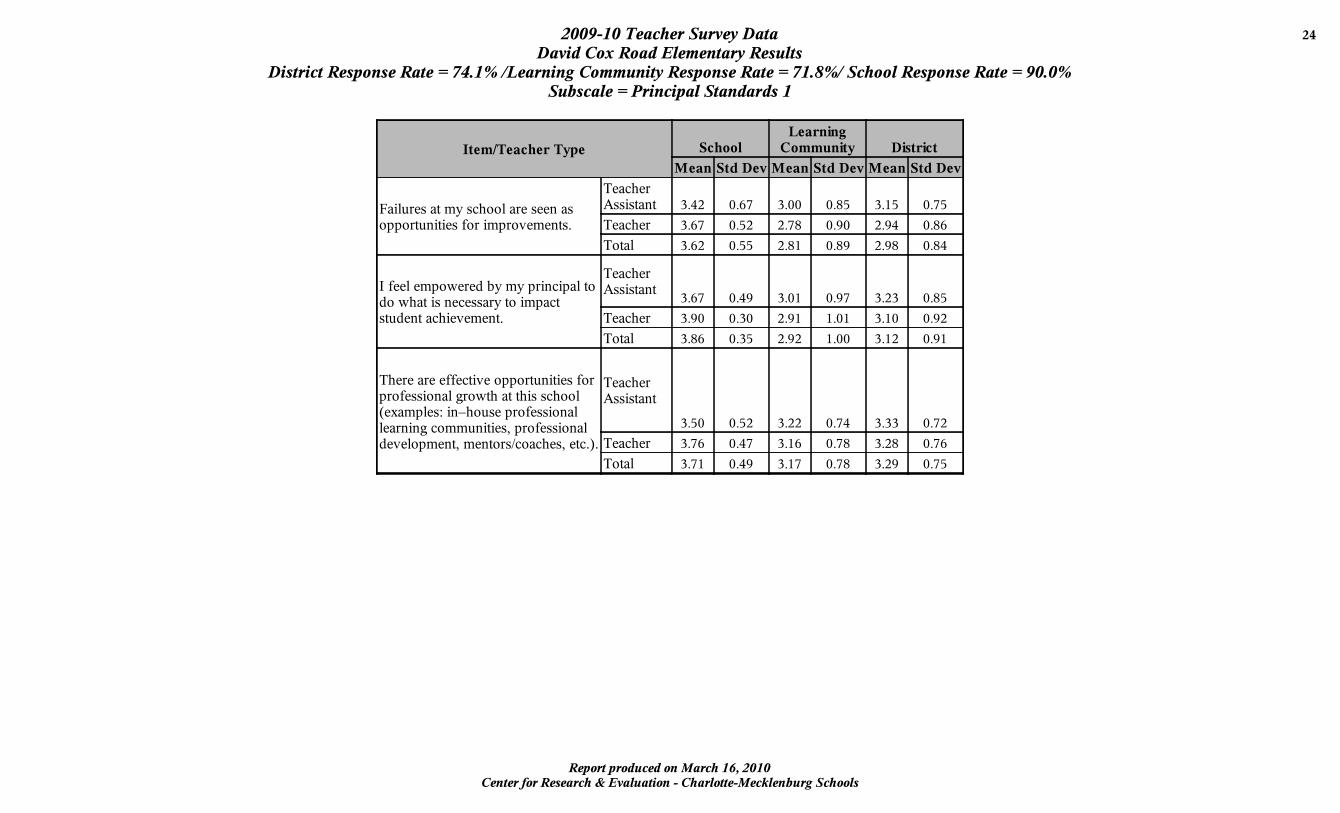
F a i lu r e s a t m y s c h o o l a r e s e e n a so p p o r tu n i t ie s f o r im p ro v em e n ts .
T e a c h e rA s s is ta n t 3 .4 2 0 .6 7 3 .0 0 0 .8 5 3 .1 5 0 .7 5
T e a c h e r 3 .6 7 0 .5 2 2 .7 8 0 .9 0 2 .9 4 0 .8 6
T o ta l 3 .6 2 0 .5 5 2 .8 1 0 .8 9 2 .9 8 0 .8 4
I f e e l e m p o w e r e d b y m y p r in c ip a l tod o w h a t i s n e c e s s a r y to im p a c ts tu d e n t a c h ie v em e n t .
T e a c h e rA s s is ta n t
3 .6 7 0 .4 9 3 .0 1 0 .9 7 3 .2 3 0 .8 5
T e a c h e r 3 .9 0 0 .3 0 2 .9 1 1 .0 1 3 .1 0 0 .9 2
T o ta l 3 .8 6 0 .3 5 2 .9 2 1 .0 0 3 .1 2 0 .9 1
T h e r e a r e e f f e c t iv e o p p o r tu n i t ie s f o rp ro f e s s io n a l g r o w th a t th is s c h o o l( e x am p le s : in – h o u s e p r o f e s s io n a lle a r n in g c o m m u n i t ie s , p r o f e s s io n a ld e v e lo p m e n t , m e n to r s /c o a c h e s , e tc . ) .
T e a c h e rA s s is ta n t
3 .5 0 0 .5 2 3 .2 2 0 .7 4 3 .3 3 0 .7 2
T e a c h e r 3 .7 6 0 .4 7 3 .1 6 0 .7 8 3 .2 8 0 .7 6
T o ta l 3 .7 1 0 .4 9 3 .1 7 0 .7 8 3 .2 9 0 .7 5
Cen ter for Research & Evaluation - Charlotte-M eck lenburg SchoolsReport produced on M arch 16 , 2010
2009-10 Teacher Survey Data 2 5
David Cox Road Elementary ResultsD istrict Response Rate = 74.1% /Learning Community Response Rate = 71.8% / School Response Rate = 90.0%
Subscale = Principal Standards 2
I t e m /T e a c h e r T y p e S c h o o lL e a r n in g
C om m u n it y D is t r ic t
M e a n S td D e v M e a n S td D e v M e a n S td D e v
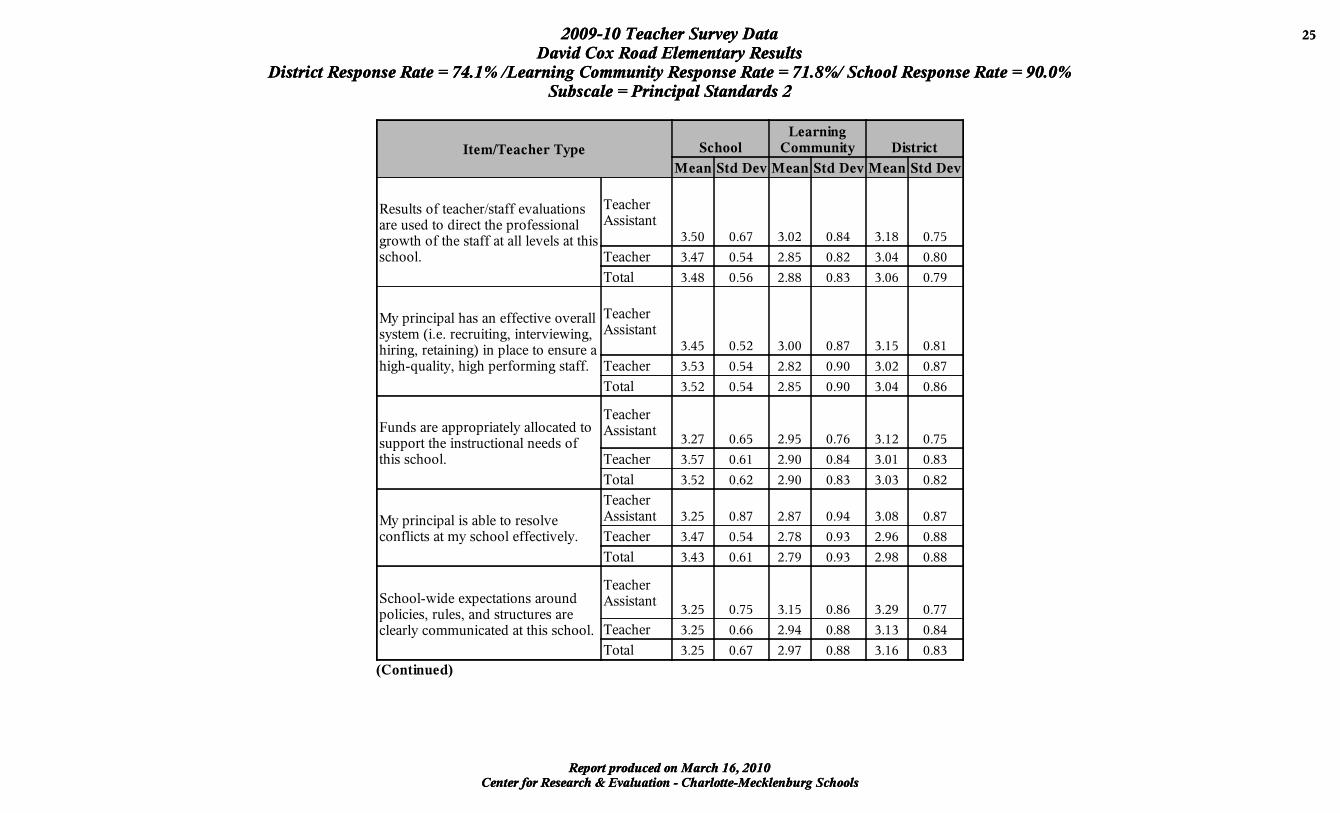
R e s u l ts o f te a c h e r /s ta f f e v a lu a t io n sa r e u s e d to d i r e c t th e p r o f e s s io n a lg r o w th o f th e s ta f f a t a l l le v e ls a t th iss c h o o l .
T e a c h e rA s s is ta n t
3 .5 0 0 .6 7 3 .0 2 0 .8 4 3 .1 8 0 .7 5
T e a c h e r 3 .4 7 0 .5 4 2 .8 5 0 .8 2 3 .0 4 0 .8 0
T o ta l 3 .4 8 0 .5 6 2 .8 8 0 .8 3 3 .0 6 0 .7 9
M y p r in c ip a l h a s a n e f f e c t iv e o v e r a l ls y s tem ( i . e . r e c r u i t in g , in te r v ie w in g ,h ir in g , r e ta in in g ) in p la c e to e n s u r e ah ig h -q u a l i ty , h ig h p e r f o rm in g s ta f f .
T e a c h e rA s s is ta n t
3 .4 5 0 .5 2 3 .0 0 0 .8 7 3 .1 5 0 .8 1
T e a c h e r 3 .5 3 0 .5 4 2 .8 2 0 .9 0 3 .0 2 0 .8 7
T o ta l 3 .5 2 0 .5 4 2 .8 5 0 .9 0 3 .0 4 0 .8 6
F u n d s a r e a p p ro p r ia te ly a l lo c a te d tos u p p o r t th e in s t r u c t io n a l n e e d s o fth is s c h o o l .
T e a c h e rA s s is ta n t
3 .2 7 0 .6 5 2 .9 5 0 .7 6 3 .1 2 0 .7 5
T e a c h e r 3 .5 7 0 .6 1 2 .9 0 0 .8 4 3 .0 1 0 .8 3
T o ta l 3 .5 2 0 .6 2 2 .9 0 0 .8 3 3 .0 3 0 .8 2
M y p r in c ip a l i s a b le to r e s o lv ec o n f l ic ts a t m y s c h o o l e f f e c t iv e ly .
T e a c h e rA s s is ta n t 3 .2 5 0 .8 7 2 .8 7 0 .9 4 3 .0 8 0 .8 7
T e a c h e r 3 .4 7 0 .5 4 2 .7 8 0 .9 3 2 .9 6 0 .8 8
T o ta l 3 .4 3 0 .6 1 2 .7 9 0 .9 3 2 .9 8 0 .8 8
S c h o o l-w id e e x p e c ta t io n s a r o u n dp o l ic ie s , r u le s , a n d s t r u c tu r e s a r ec le a r ly c o m m u n ic a te d a t th is s c h o o l .
T e a c h e rA s s is ta n t
3 .2 5 0 .7 5 3 .1 5 0 .8 6 3 .2 9 0 .7 7
T e a c h e r 3 .2 5 0 .6 6 2 .9 4 0 .8 8 3 .1 3 0 .8 4
T o ta l 3 .2 5 0 .6 7 2 .9 7 0 .8 8 3 .1 6 0 .8 3
(C o n t in u e d )
Cen ter for Research & Evaluation - Charlotte-M eck lenburg SchoolsReport produced on M arch 16 , 2010
2009-10 Teacher Survey Data 2 6
David Cox Road Elementary ResultsD istrict Response Rate = 74.1% /Learning Community Response Rate = 71.8% / School Response Rate = 90.0%
Subscale = Principal Standards 2
I t e m /T e a c h e r T y p e S c h o o lL e a r n in g
C om m u n it y D is t r ic t
M e a n S td D e v M e a n S td D e v M e a n S td D e v
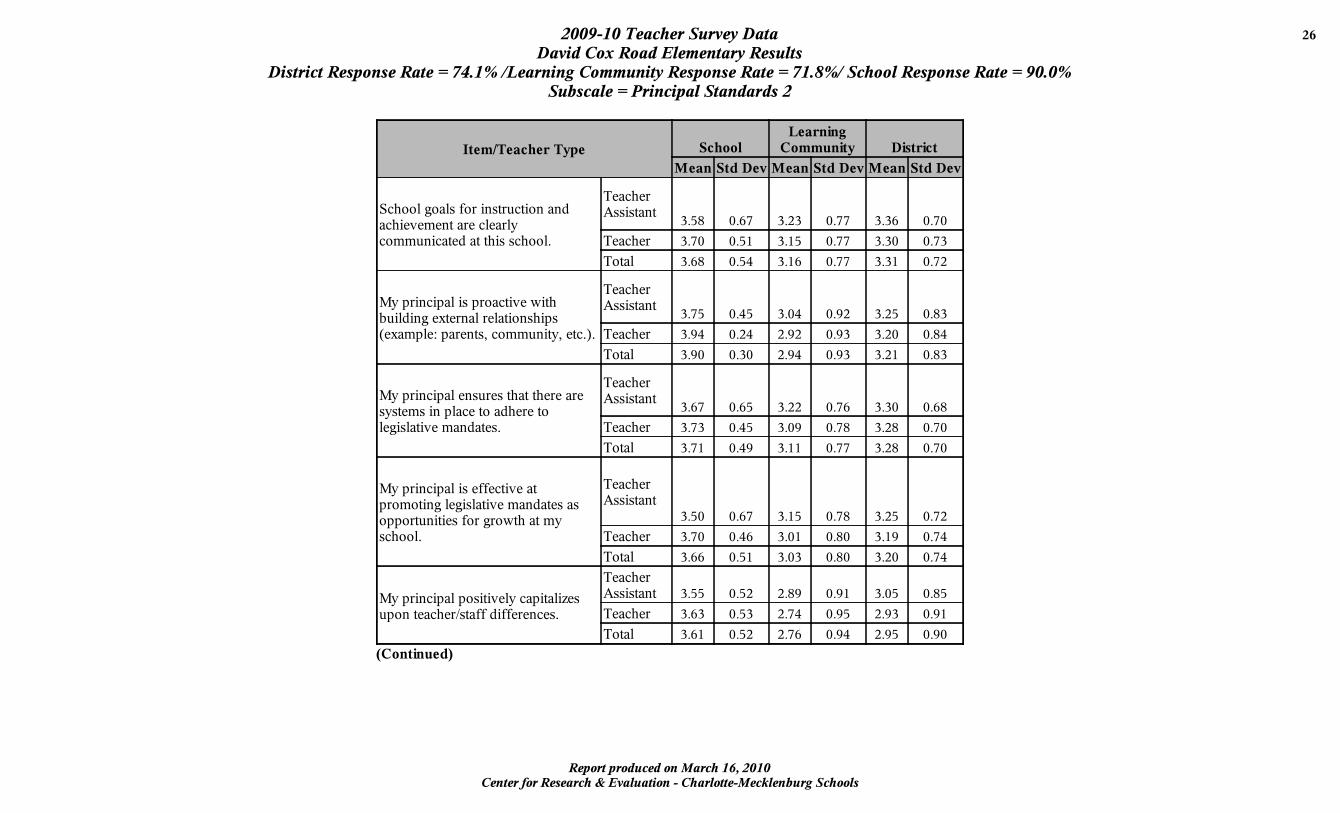
S c h o o l g o a ls f o r in s t r u c t io n a n da c h ie v em e n t a r e c le a r lyc o m m u n ic a te d a t th is s c h o o l .
T e a c h e rA s s is ta n t
3 .5 8 0 .6 7 3 .2 3 0 .7 7 3 .3 6 0 .7 0
T e a c h e r 3 .7 0 0 .5 1 3 .1 5 0 .7 7 3 .3 0 0 .7 3
T o ta l 3 .6 8 0 .5 4 3 .1 6 0 .7 7 3 .3 1 0 .7 2
M y p r in c ip a l i s p r o a c t iv e w i thb u i ld in g e x te r n a l r e la t io n s h ip s( e x am p le : p a r e n ts , c o m m u n i ty , e tc . ) .
T e a c h e rA s s is ta n t
3 .7 5 0 .4 5 3 .0 4 0 .9 2 3 .2 5 0 .8 3
T e a c h e r 3 .9 4 0 .2 4 2 .9 2 0 .9 3 3 .2 0 0 .8 4
T o ta l 3 .9 0 0 .3 0 2 .9 4 0 .9 3 3 .2 1 0 .8 3
M y p r in c ip a l e n s u r e s th a t th e r e a r es y s tem s in p la c e to a d h e r e tole g is la t iv e m a n d a te s .
T e a c h e rA s s is ta n t
3 .6 7 0 .6 5 3 .2 2 0 .7 6 3 .3 0 0 .6 8
T e a c h e r 3 .7 3 0 .4 5 3 .0 9 0 .7 8 3 .2 8 0 .7 0
T o ta l 3 .7 1 0 .4 9 3 .1 1 0 .7 7 3 .2 8 0 .7 0
M y p r in c ip a l i s e f f e c t iv e a tp r o m o t in g le g is la t iv e m a n d a te s a so p p o r tu n i t ie s f o r g r o w th a t m ys c h o o l .
T e a c h e rA s s is ta n t
3 .5 0 0 .6 7 3 .1 5 0 .7 8 3 .2 5 0 .7 2
T e a c h e r 3 .7 0 0 .4 6 3 .0 1 0 .8 0 3 .1 9 0 .7 4
T o ta l 3 .6 6 0 .5 1 3 .0 3 0 .8 0 3 .2 0 0 .7 4
M y p r in c ip a l p o s i t iv e ly c a p i ta l i z e su p o n te a c h e r /s ta f f d i f f e r e n c e s .
T e a c h e rA s s is ta n t 3 .5 5 0 .5 2 2 .8 9 0 .9 1 3 .0 5 0 .8 5
T e a c h e r 3 .6 3 0 .5 3 2 .7 4 0 .9 5 2 .9 3 0 .9 1
T o ta l 3 .6 1 0 .5 2 2 .7 6 0 .9 4 2 .9 5 0 .9 0
(C o n t in u e d )
Cen ter for Research & Evaluation - Charlotte-M eck lenburg SchoolsReport produced on M arch 16 , 2010
2009-10 Teacher Survey Data 2 7
David Cox Road Elementary ResultsD istrict Response Rate = 74.1% /Learning Community Response Rate = 71.8% / School Response Rate = 90.0%
Subscale = Principal Standards 2
I t e m /T e a c h e r T y p e S c h o o lL e a r n in g
C om m u n it y D is t r ic t
M e a n S td D e v M e a n S td D e v M e a n S td D e v
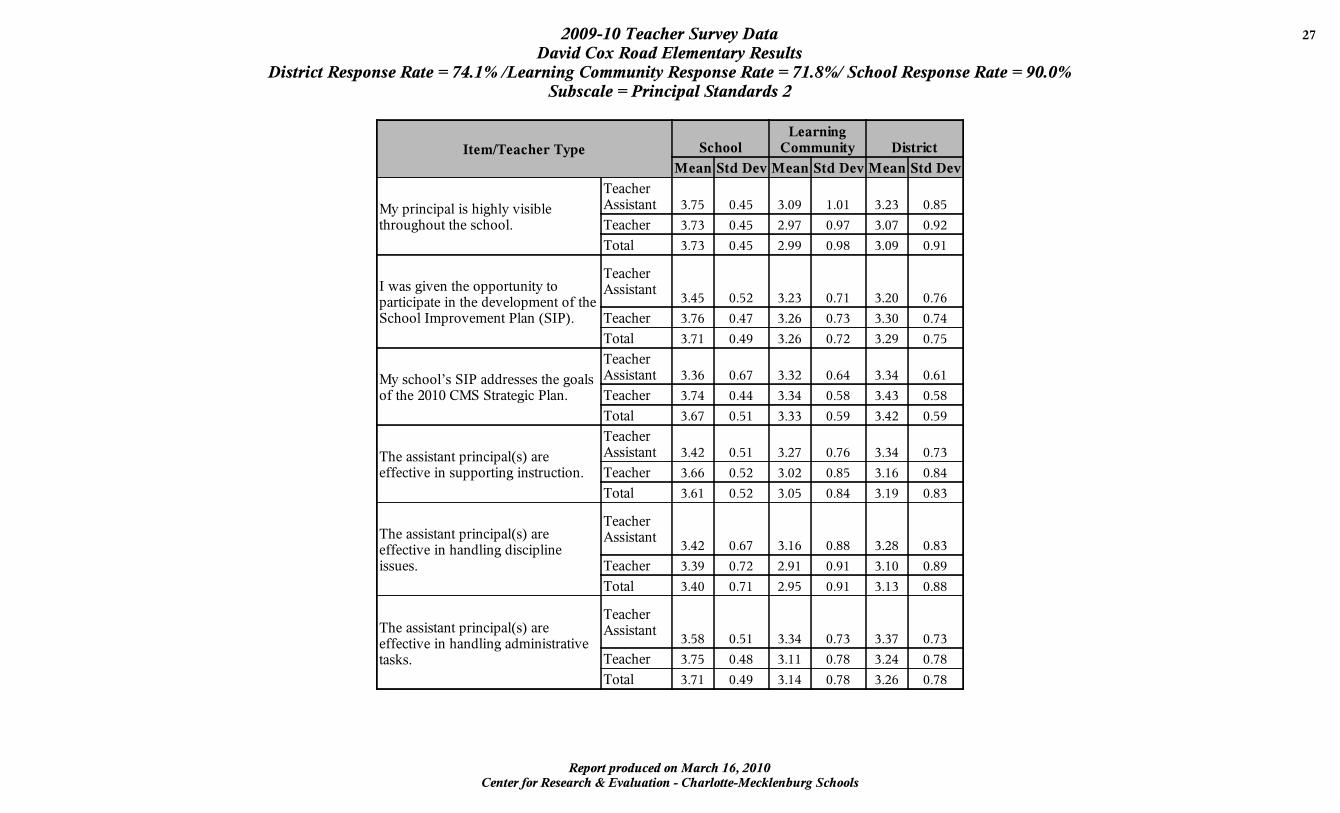
M y p r in c ip a l i s h ig h ly v is ib leth r o u g h o u t th e s c h o o l .
T e a c h e rA s s is ta n t 3 .7 5 0 .4 5 3 .0 9 1 .0 1 3 .2 3 0 .8 5
T e a c h e r 3 .7 3 0 .4 5 2 .9 7 0 .9 7 3 .0 7 0 .9 2
T o ta l 3 .7 3 0 .4 5 2 .9 9 0 .9 8 3 .0 9 0 .9 1
I w a s g iv e n th e o p p o r tu n i ty top a r t ic ip a te in th e d e v e lo p m e n t o f th eS c h o o l Im p ro v em e n t P la n ( S IP ) .
T e a c h e rA s s is ta n t
3 .4 5 0 .5 2 3 .2 3 0 .7 1 3 .2 0 0 .7 6
T e a c h e r 3 .7 6 0 .4 7 3 .2 6 0 .7 3 3 .3 0 0 .7 4
T o ta l 3 .7 1 0 .4 9 3 .2 6 0 .7 2 3 .2 9 0 .7 5
M y s c h o o l ’ s S IP a d d r e s s e s th e g o a lso f th e 2 0 1 0 C M S S tr a te g ic P la n .
T e a c h e rA s s is ta n t 3 .3 6 0 .6 7 3 .3 2 0 .6 4 3 .3 4 0 .6 1
T e a c h e r 3 .7 4 0 .4 4 3 .3 4 0 .5 8 3 .4 3 0 .5 8
T o ta l 3 .6 7 0 .5 1 3 .3 3 0 .5 9 3 .4 2 0 .5 9
T h e a s s is ta n t p r in c ip a l( s ) a r ee f f e c t iv e in s u p p o r t in g in s t r u c t io n .
T e a c h e rA s s is ta n t 3 .4 2 0 .5 1 3 .2 7 0 .7 6 3 .3 4 0 .7 3
T e a c h e r 3 .6 6 0 .5 2 3 .0 2 0 .8 5 3 .1 6 0 .8 4
T o ta l 3 .6 1 0 .5 2 3 .0 5 0 .8 4 3 .1 9 0 .8 3
T h e a s s is ta n t p r in c ip a l( s ) a r ee f f e c t iv e in h a n d l in g d is c ip l in eis s u e s .
T e a c h e rA s s is ta n t
3 .4 2 0 .6 7 3 .1 6 0 .8 8 3 .2 8 0 .8 3
T e a c h e r 3 .3 9 0 .7 2 2 .9 1 0 .9 1 3 .1 0 0 .8 9
T o ta l 3 .4 0 0 .7 1 2 .9 5 0 .9 1 3 .1 3 0 .8 8
T h e a s s is ta n t p r in c ip a l( s ) a r ee f f e c t iv e in h a n d l in g a d m in is t r a t iv eta s k s .
T e a c h e rA s s is ta n t
3 .5 8 0 .5 1 3 .3 4 0 .7 3 3 .3 7 0 .7 3
T e a c h e r 3 .7 5 0 .4 8 3 .1 1 0 .7 8 3 .2 4 0 .7 8
T o ta l 3 .7 1 0 .4 9 3 .1 4 0 .7 8 3 .2 6 0 .7 8
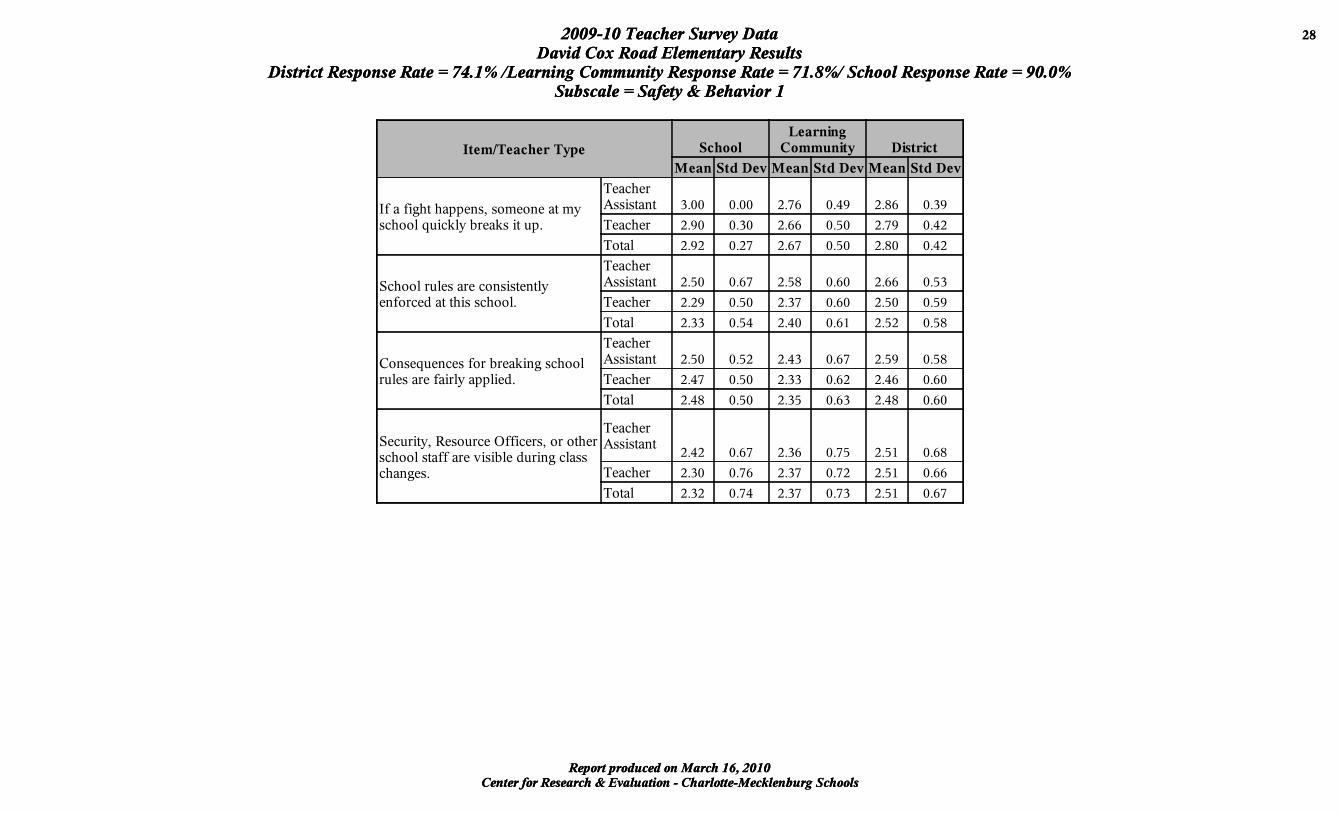
Cen ter for Research & Evaluation - Charlotte-M eck lenburg SchoolsReport produced on M arch 16 , 2010
2009-10 Teacher Survey Data 2 8
David Cox Road Elementary ResultsD istrict Response Rate = 74.1% /Learning Community Response Rate = 71.8% / School Response Rate = 90.0%
Subscale = Safety & Behavior 1
I t e m /T e a c h e r T y p e S c h o o lL e a r n in g
C om m u n it y D is t r ic t
M e a n S td D e v M e a n S td D e v M e a n S td D e v
I f a f ig h t h a p p e n s , s o m e o n e a t m ys c h o o l q u ic k ly b r e a k s i t u p .
T e a c h e rA s s is ta n t 3 .0 0 0 .0 0 2 .7 6 0 .4 9 2 .8 6 0 .3 9
T e a c h e r 2 .9 0 0 .3 0 2 .6 6 0 .5 0 2 .7 9 0 .4 2
T o ta l 2 .9 2 0 .2 7 2 .6 7 0 .5 0 2 .8 0 0 .4 2
S c h o o l r u le s a r e c o n s is te n t lye n fo r c e d a t th is s c h o o l .
T e a c h e rA s s is ta n t 2 .5 0 0 .6 7 2 .5 8 0 .6 0 2 .6 6 0 .5 3
T e a c h e r 2 .2 9 0 .5 0 2 .3 7 0 .6 0 2 .5 0 0 .5 9
T o ta l 2 .3 3 0 .5 4 2 .4 0 0 .6 1 2 .5 2 0 .5 8
C o n s e q u e n c e s f o r b r e a k in g s c h o o lr u le s a r e f a i r ly a p p l ie d .
T e a c h e rA s s is ta n t 2 .5 0 0 .5 2 2 .4 3 0 .6 7 2 .5 9 0 .5 8
T e a c h e r 2 .4 7 0 .5 0 2 .3 3 0 .6 2 2 .4 6 0 .6 0
T o ta l 2 .4 8 0 .5 0 2 .3 5 0 .6 3 2 .4 8 0 .6 0
S e c u r i ty , R e s o u r c e O f f ic e r s , o r o th e rs c h o o l s ta f f a r e v is ib le d u r in g c la s sc h a n g e s .
T e a c h e rA s s is ta n t
2 .4 2 0 .6 7 2 .3 6 0 .7 5 2 .5 1 0 .6 8
T e a c h e r 2 .3 0 0 .7 6 2 .3 7 0 .7 2 2 .5 1 0 .6 6
T o ta l 2 .3 2 0 .7 4 2 .3 7 0 .7 3 2 .5 1 0 .6 7
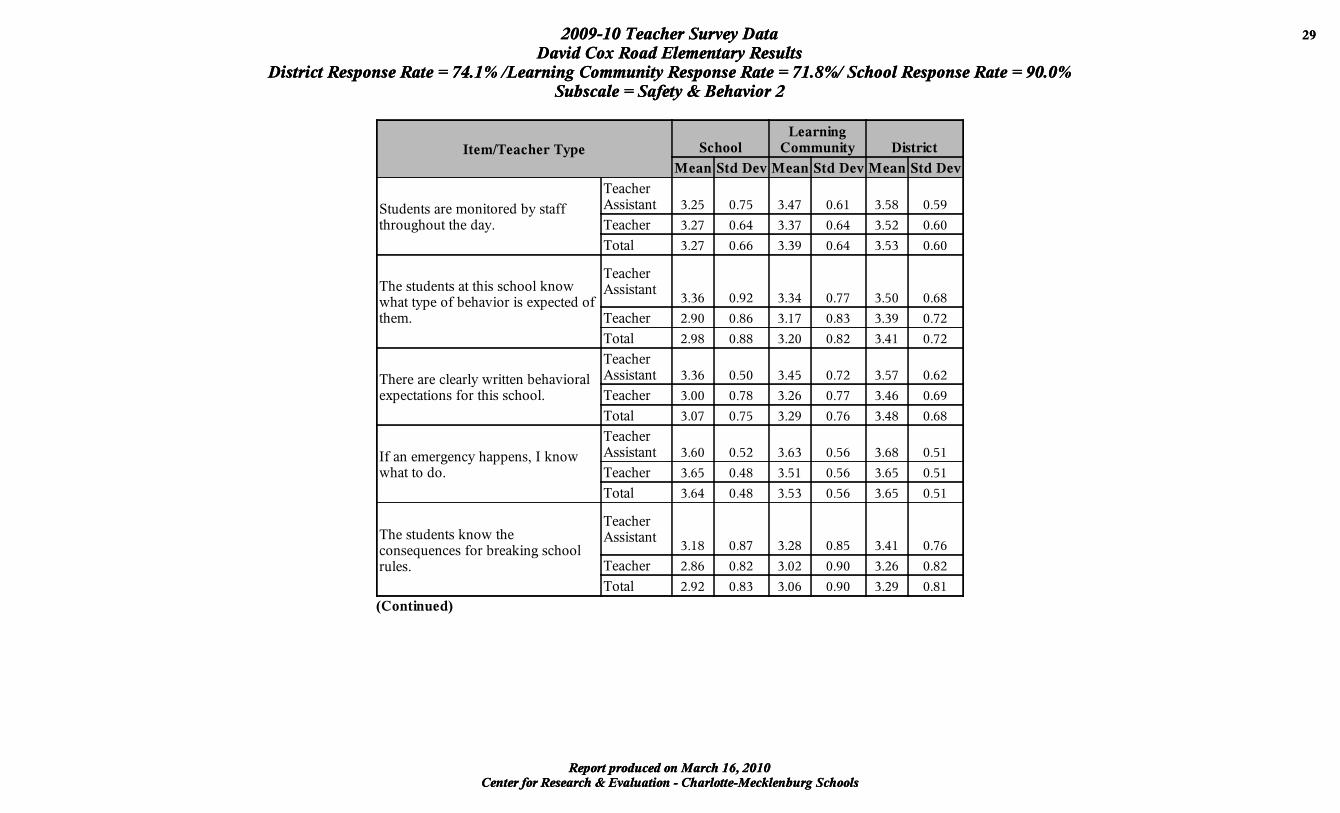
Cen ter for Research & Evaluation - Charlotte-M eck lenburg SchoolsReport produced on M arch 16 , 2010
2009-10 Teacher Survey Data 2 9
David Cox Road Elementary ResultsD istrict Response Rate = 74.1% /Learning Community Response Rate = 71.8% / School Response Rate = 90.0%
Subscale = Safety & Behavior 2
I t e m /T e a c h e r T y p e S c h o o lL e a r n in g
C om m u n it y D is t r ic t
M e a n S td D e v M e a n S td D e v M e a n S td D e v
S tu d e n ts a r e m o n i to r e d b y s ta f fth r o u g h o u t th e d a y .
T e a c h e rA s s is ta n t 3 .2 5 0 .7 5 3 .4 7 0 .6 1 3 .5 8 0 .5 9
T e a c h e r 3 .2 7 0 .6 4 3 .3 7 0 .6 4 3 .5 2 0 .6 0
T o ta l 3 .2 7 0 .6 6 3 .3 9 0 .6 4 3 .5 3 0 .6 0
T h e s tu d e n ts a t th is s c h o o l k n o ww h a t ty p e o f b e h a v io r i s e x p e c te d o fth em .
T e a c h e rA s s is ta n t
3 .3 6 0 .9 2 3 .3 4 0 .7 7 3 .5 0 0 .6 8
T e a c h e r 2 .9 0 0 .8 6 3 .1 7 0 .8 3 3 .3 9 0 .7 2
T o ta l 2 .9 8 0 .8 8 3 .2 0 0 .8 2 3 .4 1 0 .7 2
T h e r e a r e c le a r ly w r i t te n b e h a v io r a le x p e c ta t io n s f o r th is s c h o o l .
T e a c h e rA s s is ta n t 3 .3 6 0 .5 0 3 .4 5 0 .7 2 3 .5 7 0 .6 2
T e a c h e r 3 .0 0 0 .7 8 3 .2 6 0 .7 7 3 .4 6 0 .6 9
T o ta l 3 .0 7 0 .7 5 3 .2 9 0 .7 6 3 .4 8 0 .6 8
I f a n em e r g e n c y h a p p e n s , I k n o ww h a t to d o .
T e a c h e rA s s is ta n t 3 .6 0 0 .5 2 3 .6 3 0 .5 6 3 .6 8 0 .5 1
T e a c h e r 3 .6 5 0 .4 8 3 .5 1 0 .5 6 3 .6 5 0 .5 1
T o ta l 3 .6 4 0 .4 8 3 .5 3 0 .5 6 3 .6 5 0 .5 1
T h e s tu d e n ts k n o w th ec o n s e q u e n c e s f o r b r e a k in g s c h o o lr u le s .
T e a c h e rA s s is ta n t
3 .1 8 0 .8 7 3 .2 8 0 .8 5 3 .4 1 0 .7 6
T e a c h e r 2 .8 6 0 .8 2 3 .0 2 0 .9 0 3 .2 6 0 .8 2
T o ta l 2 .9 2 0 .8 3 3 .0 6 0 .9 0 3 .2 9 0 .8 1
(C o n t in u e d )
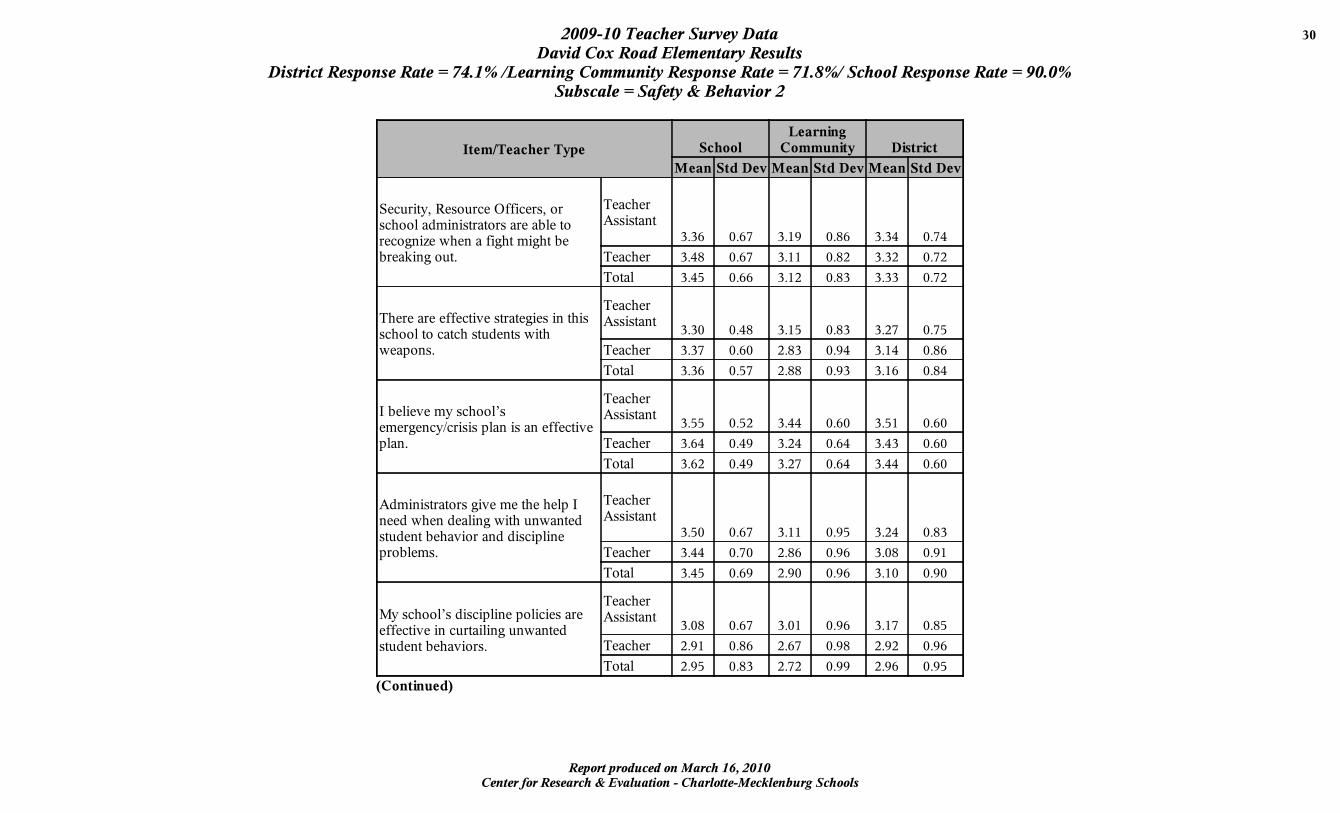
Cen ter for Research & Evaluation - Charlotte-M eck lenburg SchoolsReport produced on M arch 16 , 2010
2009-10 Teacher Survey Data 3 0
David Cox Road Elementary ResultsD istrict Response Rate = 74.1% /Learning Community Response Rate = 71.8% / School Response Rate = 90.0%
Subscale = Safety & Behavior 2
I t e m /T e a c h e r T y p e S c h o o lL e a r n in g
C om m u n it y D is t r ic t
M e a n S td D e v M e a n S td D e v M e a n S td D e v
S e c u r i ty , R e s o u r c e O f f ic e r s , o rs c h o o l a d m in is t r a to r s a r e a b le tor e c o g n iz e w h e n a f ig h t m ig h t b eb r e a k in g o u t .
T e a c h e rA s s is ta n t
3 .3 6 0 .6 7 3 .1 9 0 .8 6 3 .3 4 0 .7 4
T e a c h e r 3 .4 8 0 .6 7 3 .1 1 0 .8 2 3 .3 2 0 .7 2
T o ta l 3 .4 5 0 .6 6 3 .1 2 0 .8 3 3 .3 3 0 .7 2
T h e r e a r e e f f e c t iv e s t r a te g ie s in th iss c h o o l to c a tc h s tu d e n ts w i thw e a p o n s .
T e a c h e rA s s is ta n t
3 .3 0 0 .4 8 3 .1 5 0 .8 3 3 .2 7 0 .7 5
T e a c h e r 3 .3 7 0 .6 0 2 .8 3 0 .9 4 3 .1 4 0 .8 6
T o ta l 3 .3 6 0 .5 7 2 .8 8 0 .9 3 3 .1 6 0 .8 4
I b e l ie v e m y s c h o o l ’ sem e r g e n c y /c r is is p la n is a n e f f e c t iv ep la n .
T e a c h e rA s s is ta n t
3 .5 5 0 .5 2 3 .4 4 0 .6 0 3 .5 1 0 .6 0
T e a c h e r 3 .6 4 0 .4 9 3 .2 4 0 .6 4 3 .4 3 0 .6 0
T o ta l 3 .6 2 0 .4 9 3 .2 7 0 .6 4 3 .4 4 0 .6 0
A dm in is t r a to r s g iv e m e th e h e lp In e e d w h e n d e a l in g w i th u n w a n te ds tu d e n t b e h a v io r a n d d is c ip l in ep ro b lem s .
T e a c h e rA s s is ta n t
3 .5 0 0 .6 7 3 .1 1 0 .9 5 3 .2 4 0 .8 3
T e a c h e r 3 .4 4 0 .7 0 2 .8 6 0 .9 6 3 .0 8 0 .9 1
T o ta l 3 .4 5 0 .6 9 2 .9 0 0 .9 6 3 .1 0 0 .9 0
M y s c h o o l ’ s d is c ip l in e p o l ic ie s a r ee f f e c t iv e in c u r ta i l in g u n w a n te ds tu d e n t b e h a v io r s .
T e a c h e rA s s is ta n t
3 .0 8 0 .6 7 3 .0 1 0 .9 6 3 .1 7 0 .8 5
T e a c h e r 2 .9 1 0 .8 6 2 .6 7 0 .9 8 2 .9 2 0 .9 6
T o ta l 2 .9 5 0 .8 3 2 .7 2 0 .9 9 2 .9 6 0 .9 5
(C o n t in u e d )
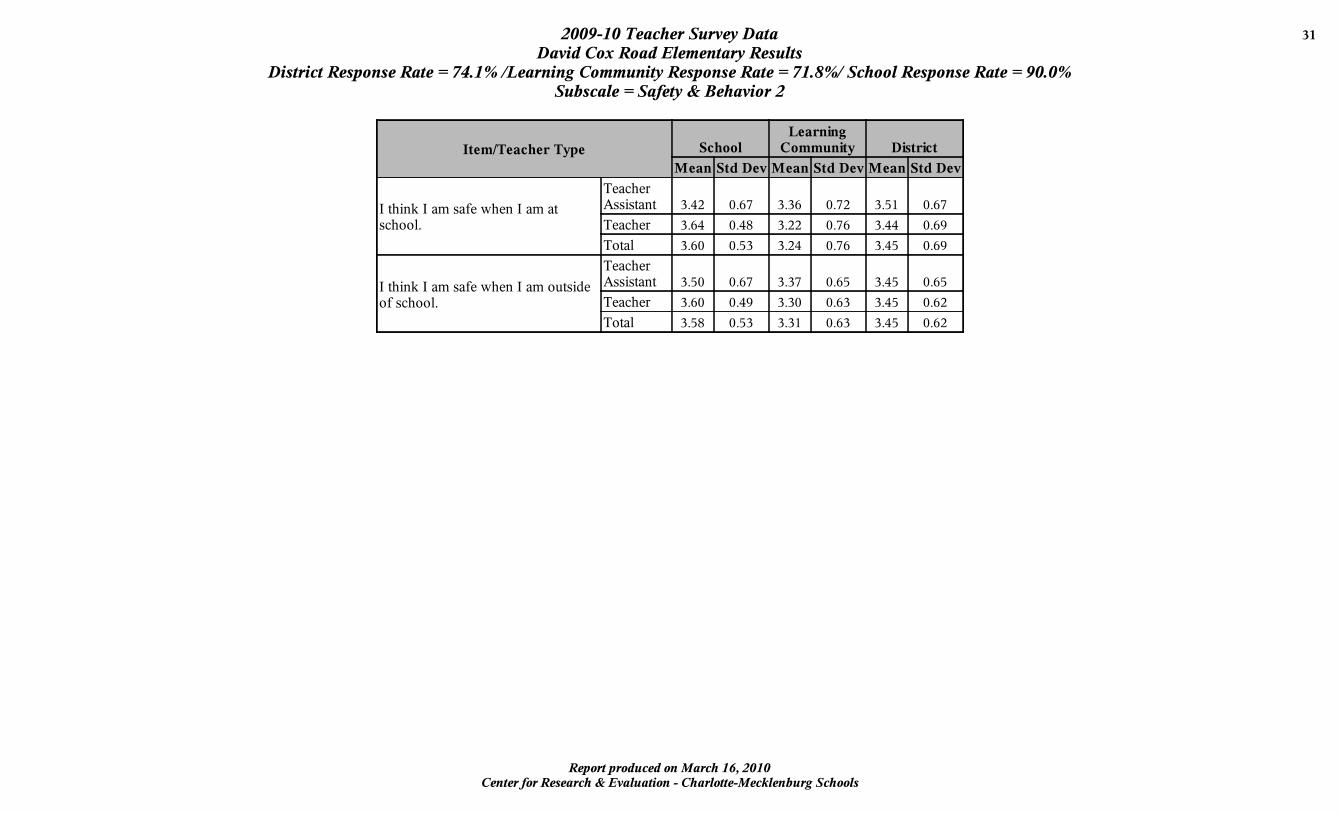
Cen ter for Research & Evaluation - Charlotte-M eck lenburg SchoolsReport produced on M arch 16 , 2010
2009-10 Teacher Survey Data 3 1
David Cox Road Elementary ResultsD istrict Response Rate = 74.1% /Learning Community Response Rate = 71.8% / School Response Rate = 90.0%
Subscale = Safety & Behavior 2
I t e m /T e a c h e r T y p e S c h o o lL e a r n in g
C om m u n it y D is t r ic t
M e a n S td D e v M e a n S td D e v M e a n S td D e v
I th in k I a m s a f e w h e n I am a ts c h o o l .
T e a c h e rA s s is ta n t 3 .4 2 0 .6 7 3 .3 6 0 .7 2 3 .5 1 0 .6 7
T e a c h e r 3 .6 4 0 .4 8 3 .2 2 0 .7 6 3 .4 4 0 .6 9
T o ta l 3 .6 0 0 .5 3 3 .2 4 0 .7 6 3 .4 5 0 .6 9
I th in k I a m s a f e w h e n I am o u ts id eo f s c h o o l .
T e a c h e rA s s is ta n t 3 .5 0 0 .6 7 3 .3 7 0 .6 5 3 .4 5 0 .6 5
T e a c h e r 3 .6 0 0 .4 9 3 .3 0 0 .6 3 3 .4 5 0 .6 2
T o ta l 3 .5 8 0 .5 3 3 .3 1 0 .6 3 3 .4 5 0 .6 2
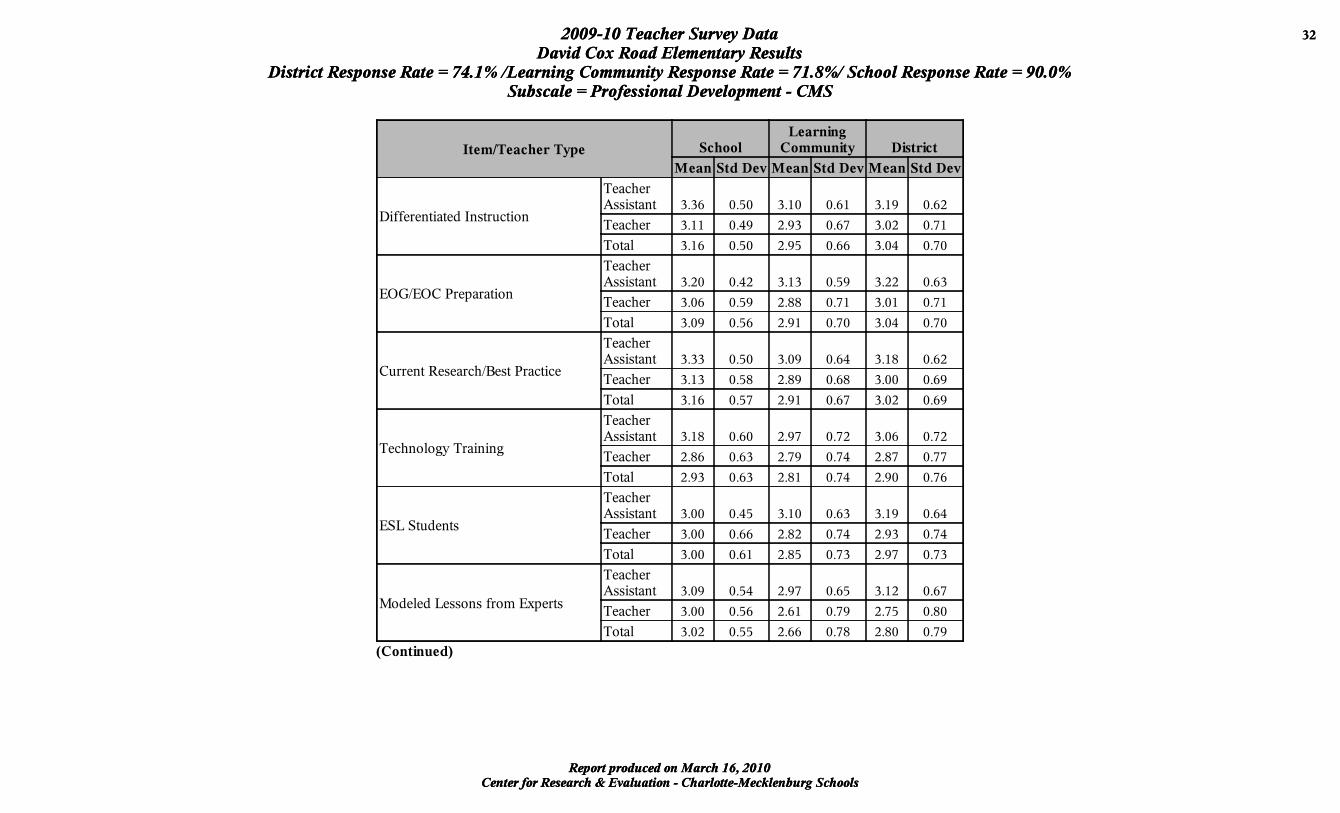
Cen ter for Research & Evaluation - Charlotte-M eck lenburg SchoolsReport produced on M arch 16 , 2010
2009-10 Teacher Survey Data 3 2
David Cox Road Elementary ResultsD istrict Response Rate = 74.1% /Learning Community Response Rate = 71.8% / School Response Rate = 90.0%
Subscale = Professional Development - CMS
I t e m /T e a c h e r T y p e S c h o o lL e a r n in g
C om m u n it y D is t r ic t
M e a n S td D e v M e a n S td D e v M e a n S td D e v
D if f e r e n t ia te d I n s t r u c t io n
T e a c h e rA s s is ta n t 3 .3 6 0 .5 0 3 .1 0 0 .6 1 3 .1 9 0 .6 2
T e a c h e r 3 .1 1 0 .4 9 2 .9 3 0 .6 7 3 .0 2 0 .7 1
T o ta l 3 .1 6 0 .5 0 2 .9 5 0 .6 6 3 .0 4 0 .7 0
E O G /E O C P r e p a r a t io n
T e a c h e rA s s is ta n t 3 .2 0 0 .4 2 3 .1 3 0 .5 9 3 .2 2 0 .6 3
T e a c h e r 3 .0 6 0 .5 9 2 .8 8 0 .7 1 3 .0 1 0 .7 1
T o ta l 3 .0 9 0 .5 6 2 .9 1 0 .7 0 3 .0 4 0 .7 0
C u r r e n t R e s e a r c h /B e s t P r a c t ic e
T e a c h e rA s s is ta n t 3 .3 3 0 .5 0 3 .0 9 0 .6 4 3 .1 8 0 .6 2
T e a c h e r 3 .1 3 0 .5 8 2 .8 9 0 .6 8 3 .0 0 0 .6 9
T o ta l 3 .1 6 0 .5 7 2 .9 1 0 .6 7 3 .0 2 0 .6 9
T e c h n o lo g y T r a in in g
T e a c h e rA s s is ta n t 3 .1 8 0 .6 0 2 .9 7 0 .7 2 3 .0 6 0 .7 2
T e a c h e r 2 .8 6 0 .6 3 2 .7 9 0 .7 4 2 .8 7 0 .7 7
T o ta l 2 .9 3 0 .6 3 2 .8 1 0 .7 4 2 .9 0 0 .7 6
E S L S tu d e n ts
T e a c h e rA s s is ta n t 3 .0 0 0 .4 5 3 .1 0 0 .6 3 3 .1 9 0 .6 4
T e a c h e r 3 .0 0 0 .6 6 2 .8 2 0 .7 4 2 .9 3 0 .7 4
T o ta l 3 .0 0 0 .6 1 2 .8 5 0 .7 3 2 .9 7 0 .7 3
M o d e le d L e s s o n s f r o m E x p e r ts
T e a c h e rA s s is ta n t 3 .0 9 0 .5 4 2 .9 7 0 .6 5 3 .1 2 0 .6 7
T e a c h e r 3 .0 0 0 .5 6 2 .6 1 0 .7 9 2 .7 5 0 .8 0
T o ta l 3 .0 2 0 .5 5 2 .6 6 0 .7 8 2 .8 0 0 .7 9
(C o n t in u e d )
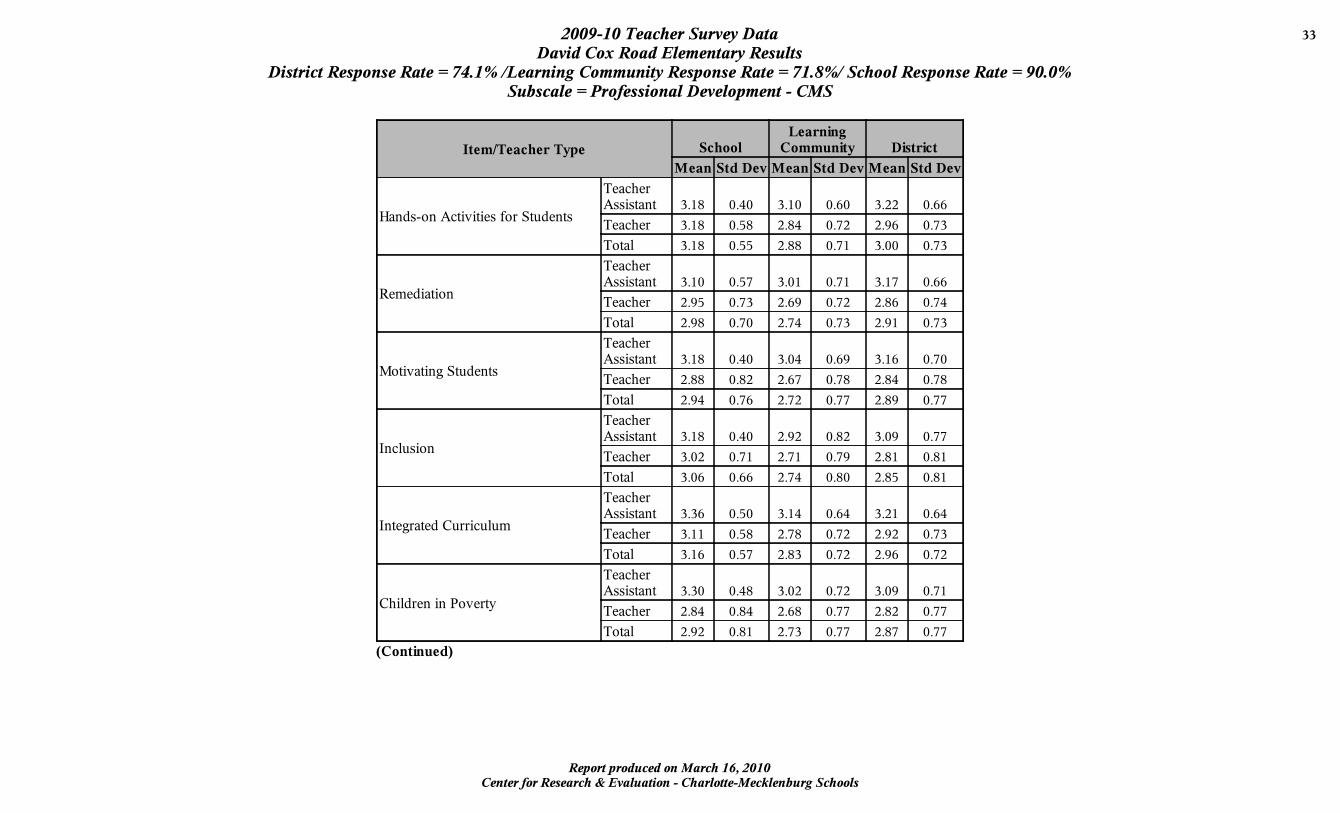
Cen ter for Research & Evaluation - Charlotte-M eck lenburg SchoolsReport produced on M arch 16 , 2010
2009-10 Teacher Survey Data 3 3
David Cox Road Elementary ResultsD istrict Response Rate = 74.1% /Learning Community Response Rate = 71.8% / School Response Rate = 90.0%
Subscale = Professional Development - CMS
I t e m /T e a c h e r T y p e S c h o o lL e a r n in g
C om m u n it y D is t r ic t
M e a n S td D e v M e a n S td D e v M e a n S td D e v
H a n d s -o n A c t iv i t ie s f o r S tu d e n ts
T e a c h e rA s s is ta n t 3 .1 8 0 .4 0 3 .1 0 0 .6 0 3 .2 2 0 .6 6
T e a c h e r 3 .1 8 0 .5 8 2 .8 4 0 .7 2 2 .9 6 0 .7 3
T o ta l 3 .1 8 0 .5 5 2 .8 8 0 .7 1 3 .0 0 0 .7 3
R em e d ia t io n
T e a c h e rA s s is ta n t 3 .1 0 0 .5 7 3 .0 1 0 .7 1 3 .1 7 0 .6 6
T e a c h e r 2 .9 5 0 .7 3 2 .6 9 0 .7 2 2 .8 6 0 .7 4
T o ta l 2 .9 8 0 .7 0 2 .7 4 0 .7 3 2 .9 1 0 .7 3
M o tiv a t in g S tu d e n ts
T e a c h e rA s s is ta n t 3 .1 8 0 .4 0 3 .0 4 0 .6 9 3 .1 6 0 .7 0
T e a c h e r 2 .8 8 0 .8 2 2 .6 7 0 .7 8 2 .8 4 0 .7 8
T o ta l 2 .9 4 0 .7 6 2 .7 2 0 .7 7 2 .8 9 0 .7 7
I n c lu s io n
T e a c h e rA s s is ta n t 3 .1 8 0 .4 0 2 .9 2 0 .8 2 3 .0 9 0 .7 7
T e a c h e r 3 .0 2 0 .7 1 2 .7 1 0 .7 9 2 .8 1 0 .8 1
T o ta l 3 .0 6 0 .6 6 2 .7 4 0 .8 0 2 .8 5 0 .8 1
I n te g r a te d C u r r ic u lu m
T e a c h e rA s s is ta n t 3 .3 6 0 .5 0 3 .1 4 0 .6 4 3 .2 1 0 .6 4
T e a c h e r 3 .1 1 0 .5 8 2 .7 8 0 .7 2 2 .9 2 0 .7 3
T o ta l 3 .1 6 0 .5 7 2 .8 3 0 .7 2 2 .9 6 0 .7 2
C h i ld r e n in P o v e r ty
T e a c h e rA s s is ta n t 3 .3 0 0 .4 8 3 .0 2 0 .7 2 3 .0 9 0 .7 1
T e a c h e r 2 .8 4 0 .8 4 2 .6 8 0 .7 7 2 .8 2 0 .7 7
T o ta l 2 .9 2 0 .8 1 2 .7 3 0 .7 7 2 .8 7 0 .7 7
(C o n t in u e d )
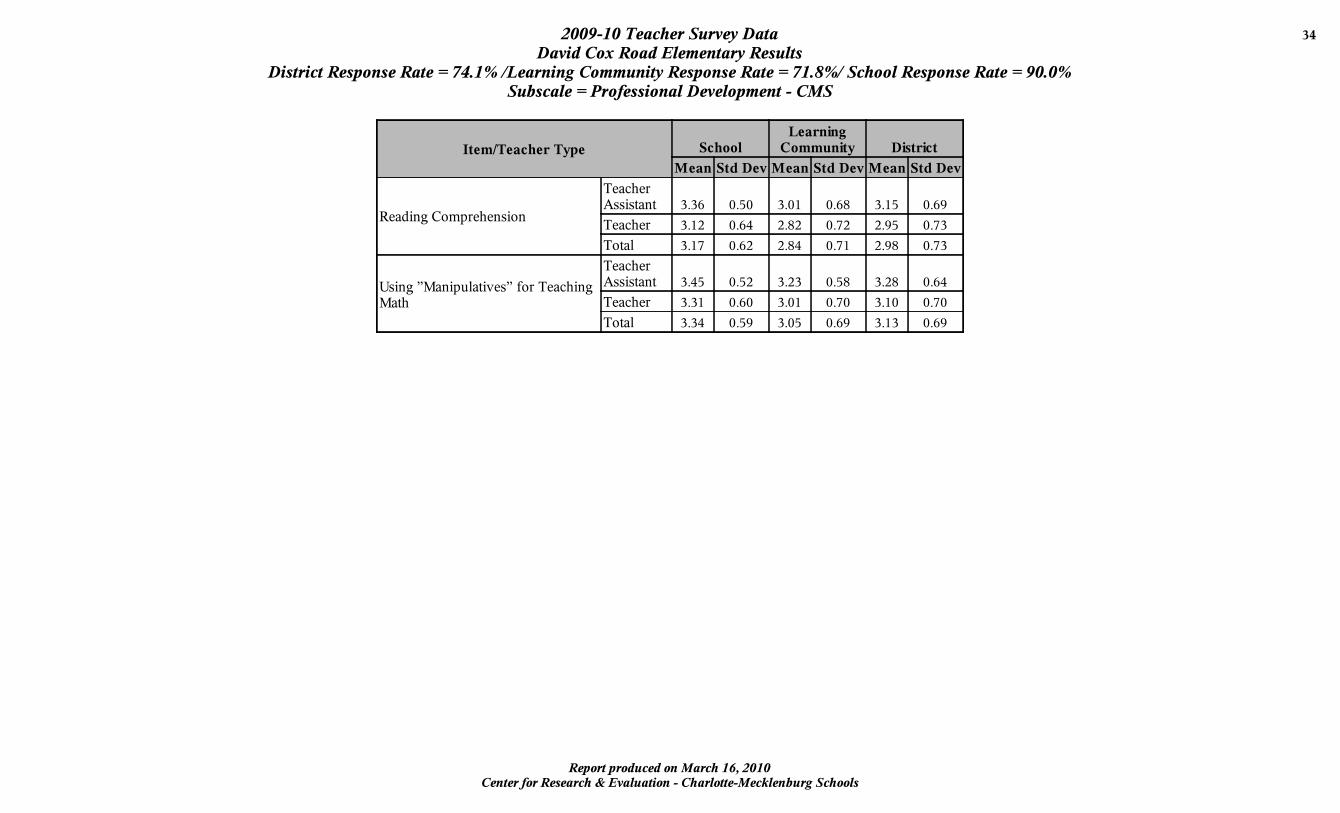
Cen ter for Research & Evaluation - Charlotte-M eck lenburg SchoolsReport produced on M arch 16 , 2010
2009-10 Teacher Survey Data 3 4
David Cox Road Elementary ResultsD istrict Response Rate = 74.1% /Learning Community Response Rate = 71.8% / School Response Rate = 90.0%
Subscale = Professional Development - CMS
I t e m /T e a c h e r T y p e S c h o o lL e a r n in g
C om m u n it y D is t r ic t
M e a n S td D e v M e a n S td D e v M e a n S td D e v
R e a d in g C o m p r e h e n s io n
T e a c h e rA s s is ta n t 3 .3 6 0 .5 0 3 .0 1 0 .6 8 3 .1 5 0 .6 9
T e a c h e r 3 .1 2 0 .6 4 2 .8 2 0 .7 2 2 .9 5 0 .7 3
T o ta l 3 .1 7 0 .6 2 2 .8 4 0 .7 1 2 .9 8 0 .7 3
U s in g ”M a n ip u la t iv e s ” f o r T e a c h in gM a th
T e a c h e rA s s is ta n t 3 .4 5 0 .5 2 3 .2 3 0 .5 8 3 .2 8 0 .6 4
T e a c h e r 3 .3 1 0 .6 0 3 .0 1 0 .7 0 3 .1 0 0 .7 0
T o ta l 3 .3 4 0 .5 9 3 .0 5 0 .6 9 3 .1 3 0 .6 9
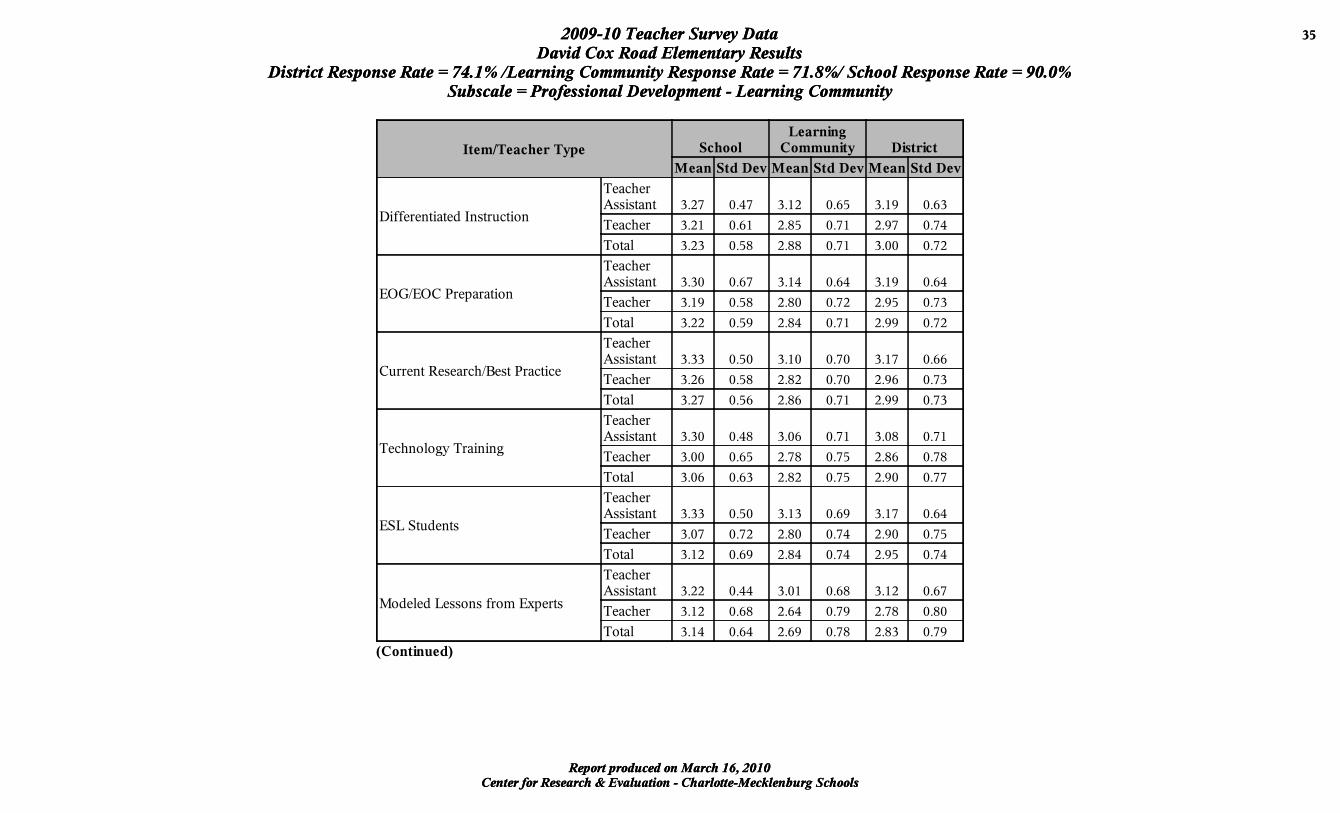
Cen ter for Research & Evaluation - Charlotte-M eck lenburg SchoolsReport produced on M arch 16 , 2010
2009-10 Teacher Survey Data 3 5
David Cox Road Elementary ResultsD istrict Response Rate = 74.1% /Learning Community Response Rate = 71.8% / School Response Rate = 90.0%
Subscale = Professional Development - Learning Community
I t e m /T e a c h e r T y p e S c h o o lL e a r n in g
C om m u n it y D is t r ic t
M e a n S td D e v M e a n S td D e v M e a n S td D e v
D if f e r e n t ia te d I n s t r u c t io n
T e a c h e rA s s is ta n t 3 .2 7 0 .4 7 3 .1 2 0 .6 5 3 .1 9 0 .6 3
T e a c h e r 3 .2 1 0 .6 1 2 .8 5 0 .7 1 2 .9 7 0 .7 4
T o ta l 3 .2 3 0 .5 8 2 .8 8 0 .7 1 3 .0 0 0 .7 2
E O G /E O C P r e p a r a t io n
T e a c h e rA s s is ta n t 3 .3 0 0 .6 7 3 .1 4 0 .6 4 3 .1 9 0 .6 4
T e a c h e r 3 .1 9 0 .5 8 2 .8 0 0 .7 2 2 .9 5 0 .7 3
T o ta l 3 .2 2 0 .5 9 2 .8 4 0 .7 1 2 .9 9 0 .7 2
C u r r e n t R e s e a r c h /B e s t P r a c t ic e
T e a c h e rA s s is ta n t 3 .3 3 0 .5 0 3 .1 0 0 .7 0 3 .1 7 0 .6 6
T e a c h e r 3 .2 6 0 .5 8 2 .8 2 0 .7 0 2 .9 6 0 .7 3
T o ta l 3 .2 7 0 .5 6 2 .8 6 0 .7 1 2 .9 9 0 .7 3
T e c h n o lo g y T r a in in g
T e a c h e rA s s is ta n t 3 .3 0 0 .4 8 3 .0 6 0 .7 1 3 .0 8 0 .7 1
T e a c h e r 3 .0 0 0 .6 5 2 .7 8 0 .7 5 2 .8 6 0 .7 8
T o ta l 3 .0 6 0 .6 3 2 .8 2 0 .7 5 2 .9 0 0 .7 7
E S L S tu d e n ts
T e a c h e rA s s is ta n t 3 .3 3 0 .5 0 3 .1 3 0 .6 9 3 .1 7 0 .6 4
T e a c h e r 3 .0 7 0 .7 2 2 .8 0 0 .7 4 2 .9 0 0 .7 5
T o ta l 3 .1 2 0 .6 9 2 .8 4 0 .7 4 2 .9 5 0 .7 4
M o d e le d L e s s o n s f r o m E x p e r ts
T e a c h e rA s s is ta n t 3 .2 2 0 .4 4 3 .0 1 0 .6 8 3 .1 2 0 .6 7
T e a c h e r 3 .1 2 0 .6 8 2 .6 4 0 .7 9 2 .7 8 0 .8 0
T o ta l 3 .1 4 0 .6 4 2 .6 9 0 .7 8 2 .8 3 0 .7 9
(C o n t in u e d )

Cen ter for Research & Evaluation - Charlotte-M eck lenburg SchoolsReport produced on M arch 16 , 2010
2009-10 Teacher Survey Data 3 6
David Cox Road Elementary ResultsD istrict Response Rate = 74.1% /Learning Community Response Rate = 71.8% / School Response Rate = 90.0%
Subscale = Professional Development - Learning Community
I t e m /T e a c h e r T y p e S c h o o lL e a r n in g
C om m u n it y D is t r ic t
M e a n S td D e v M e a n S td D e v M e a n S td D e v
H a n d s -o n A c t iv i t ie s f o r S tu d e n ts
T e a c h e rA s s is ta n t 3 .3 3 0 .5 0 3 .1 7 0 .6 3 3 .2 0 0 .6 5
T e a c h e r 3 .2 1 0 .5 6 2 .8 0 0 .7 4 2 .9 3 0 .7 5
T o ta l 3 .2 3 0 .5 5 2 .8 5 0 .7 4 2 .9 7 0 .7 4
R em e d ia t io n
T e a c h e rA s s is ta n t 3 .0 0 0 .4 5 3 .0 3 0 .7 0 3 .1 4 0 .6 7
T e a c h e r 3 .1 3 0 .6 6 2 .6 9 0 .7 5 2 .8 5 0 .7 5
T o ta l 3 .1 0 0 .6 1 2 .7 3 0 .7 5 2 .9 0 0 .7 5
M o tiv a t in g S tu d e n ts
T e a c h e rA s s is ta n t 3 .3 6 0 .5 0 3 .1 1 0 .7 3 3 .1 5 0 .6 9
T e a c h e r 3 .1 3 0 .6 9 2 .6 5 0 .7 8 2 .8 3 0 .7 9
T o ta l 3 .1 8 0 .6 5 2 .7 2 0 .7 9 2 .8 9 0 .7 8
I n c lu s io n
T e a c h e rA s s is ta n t 3 .0 9 0 .3 0 3 .0 1 0 .7 8 3 .1 1 0 .7 2
T e a c h e r 3 .0 7 0 .6 6 2 .7 0 0 .7 8 2 .8 3 0 .8 0
T o ta l 3 .0 7 0 .6 0 2 .7 5 0 .7 8 2 .8 7 0 .7 9
I n te g r a te d C u r r ic u lu m
T e a c h e rA s s is ta n t 3 .4 4 0 .5 3 3 .1 0 0 .7 1 3 .1 8 0 .6 5
T e a c h e r 3 .2 8 0 .4 5 2 .7 7 0 .7 2 2 .9 1 0 .7 5
T o ta l 3 .3 1 0 .4 7 2 .8 1 0 .7 3 2 .9 5 0 .7 4
C h i ld r e n in P o v e r ty
T e a c h e rA s s is ta n t 3 .2 0 0 .4 2 3 .0 4 0 .7 6 3 .0 9 0 .7 2
T e a c h e r 2 .8 3 0 .8 9 2 .6 8 0 .7 8 2 .8 3 0 .7 9
T o ta l 2 .9 0 0 .8 3 2 .7 3 0 .7 9 2 .8 7 0 .7 8
(C o n t in u e d )
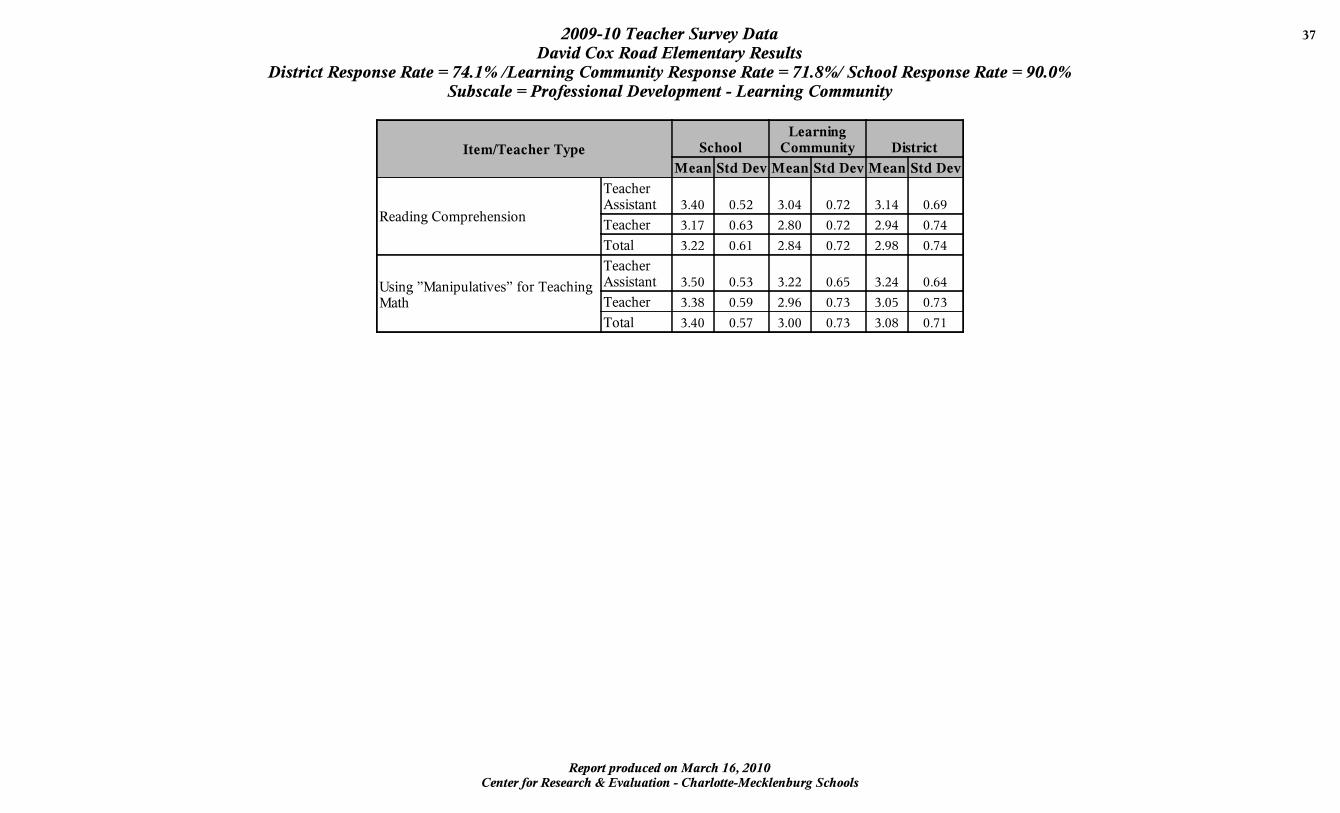
Cen ter for Research & Evaluation - Charlotte-M eck lenburg SchoolsReport produced on M arch 16 , 2010
2009-10 Teacher Survey Data 3 7
David Cox Road Elementary ResultsD istrict Response Rate = 74.1% /Learning Community Response Rate = 71.8% / School Response Rate = 90.0%
Subscale = Professional Development - Learning Community
I t e m /T e a c h e r T y p e S c h o o lL e a r n in g
C om m u n it y D is t r ic t
M e a n S td D e v M e a n S td D e v M e a n S td D e v
R e a d in g C o m p r e h e n s io n
T e a c h e rA s s is ta n t 3 .4 0 0 .5 2 3 .0 4 0 .7 2 3 .1 4 0 .6 9
T e a c h e r 3 .1 7 0 .6 3 2 .8 0 0 .7 2 2 .9 4 0 .7 4
T o ta l 3 .2 2 0 .6 1 2 .8 4 0 .7 2 2 .9 8 0 .7 4
U s in g ”M a n ip u la t iv e s ” f o r T e a c h in gM a th
T e a c h e rA s s is ta n t 3 .5 0 0 .5 3 3 .2 2 0 .6 5 3 .2 4 0 .6 4
T e a c h e r 3 .3 8 0 .5 9 2 .9 6 0 .7 3 3 .0 5 0 .7 3
T o ta l 3 .4 0 0 .5 7 3 .0 0 0 .7 3 3 .0 8 0 .7 1
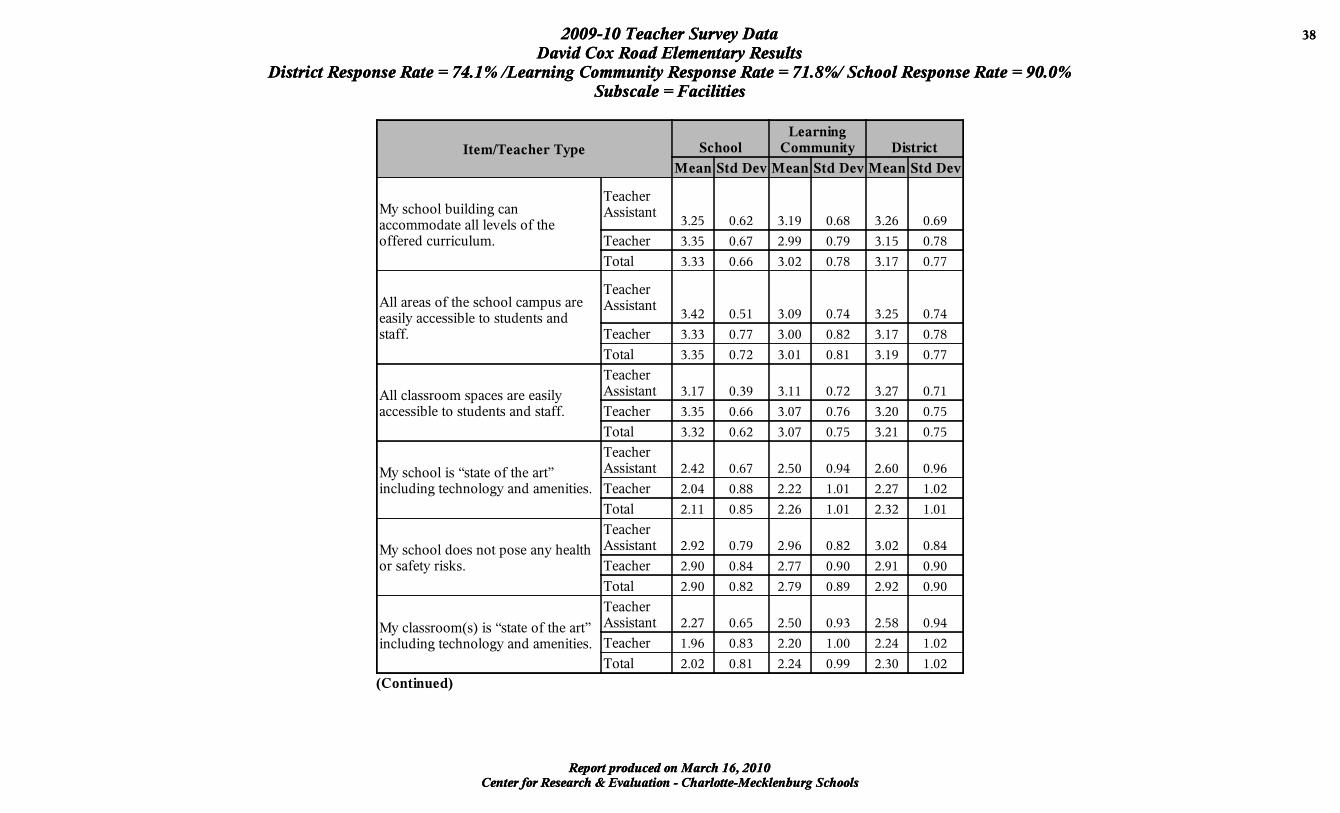
Cen ter for Research & Evaluation - Charlotte-M eck lenburg SchoolsReport produced on M arch 16 , 2010
2009-10 Teacher Survey Data 3 8
David Cox Road Elementary ResultsD istrict Response Rate = 74.1% /Learning Community Response Rate = 71.8% / School Response Rate = 90.0%
Subscale = Facilities
Cen ter for Research & Evaluation - Charlotte-M eck lenburg SchoolsReport produced on M arch 16 , 2010
2009-10 Teacher Survey Data 3 8
David Cox Road Elementary ResultsD istrict Response Rate = 74.1% /Learning Community Response Rate = 71.8% / School Response Rate = 90.0%
Subscale = Facilities
I t e m /T e a c h e r T y p e S c h o o lL e a r n in g
C om m u n it y D is t r ic t
M e a n S td D e v M e a n S td D e v M e a n S td D e v
M y s c h o o l b u i ld in g c a na c c o m m o d a te a l l le v e ls o f th eo f f e r e d c u r r ic u lu m .
T e a c h e rA s s is ta n t
3 .2 5 0 .6 2 3 .1 9 0 .6 8 3 .2 6 0 .6 9
T e a c h e r 3 .3 5 0 .6 7 2 .9 9 0 .7 9 3 .1 5 0 .7 8
T o ta l 3 .3 3 0 .6 6 3 .0 2 0 .7 8 3 .1 7 0 .7 7
A ll a r e a s o f th e s c h o o l c am p u s a r ee a s i ly a c c e s s ib le to s tu d e n ts a n ds ta f f .
T e a c h e rA s s is ta n t
3 .4 2 0 .5 1 3 .0 9 0 .7 4 3 .2 5 0 .7 4
T e a c h e r 3 .3 3 0 .7 7 3 .0 0 0 .8 2 3 .1 7 0 .7 8
T o ta l 3 .3 5 0 .7 2 3 .0 1 0 .8 1 3 .1 9 0 .7 7
A ll c la s s r o o m s p a c e s a r e e a s i lya c c e s s ib le to s tu d e n ts a n d s ta f f .
T e a c h e rA s s is ta n t 3 .1 7 0 .3 9 3 .1 1 0 .7 2 3 .2 7 0 .7 1
T e a c h e r 3 .3 5 0 .6 6 3 .0 7 0 .7 6 3 .2 0 0 .7 5
T o ta l 3 .3 2 0 .6 2 3 .0 7 0 .7 5 3 .2 1 0 .7 5
M y s c h o o l i s “ s ta te o f th e a r t”in c lu d in g te c h n o lo g y a n d am e n i t ie s .
T e a c h e rA s s is ta n t 2 .4 2 0 .6 7 2 .5 0 0 .9 4 2 .6 0 0 .9 6
T e a c h e r 2 .0 4 0 .8 8 2 .2 2 1 .0 1 2 .2 7 1 .0 2
T o ta l 2 .1 1 0 .8 5 2 .2 6 1 .0 1 2 .3 2 1 .0 1
M y s c h o o l d o e s n o t p o s e a n y h e a l tho r s a f e ty r i s k s .
T e a c h e rA s s is ta n t 2 .9 2 0 .7 9 2 .9 6 0 .8 2 3 .0 2 0 .8 4
T e a c h e r 2 .9 0 0 .8 4 2 .7 7 0 .9 0 2 .9 1 0 .9 0
T o ta l 2 .9 0 0 .8 2 2 .7 9 0 .8 9 2 .9 2 0 .9 0
M y c la s s r o o m ( s ) i s “ s ta te o f th e a r t”in c lu d in g te c h n o lo g y a n d am e n i t ie s .
T e a c h e rA s s is ta n t 2 .2 7 0 .6 5 2 .5 0 0 .9 3 2 .5 8 0 .9 4
T e a c h e r 1 .9 6 0 .8 3 2 .2 0 1 .0 0 2 .2 4 1 .0 2
T o ta l 2 .0 2 0 .8 1 2 .2 4 0 .9 9 2 .3 0 1 .0 2
(C o n t in u e d )
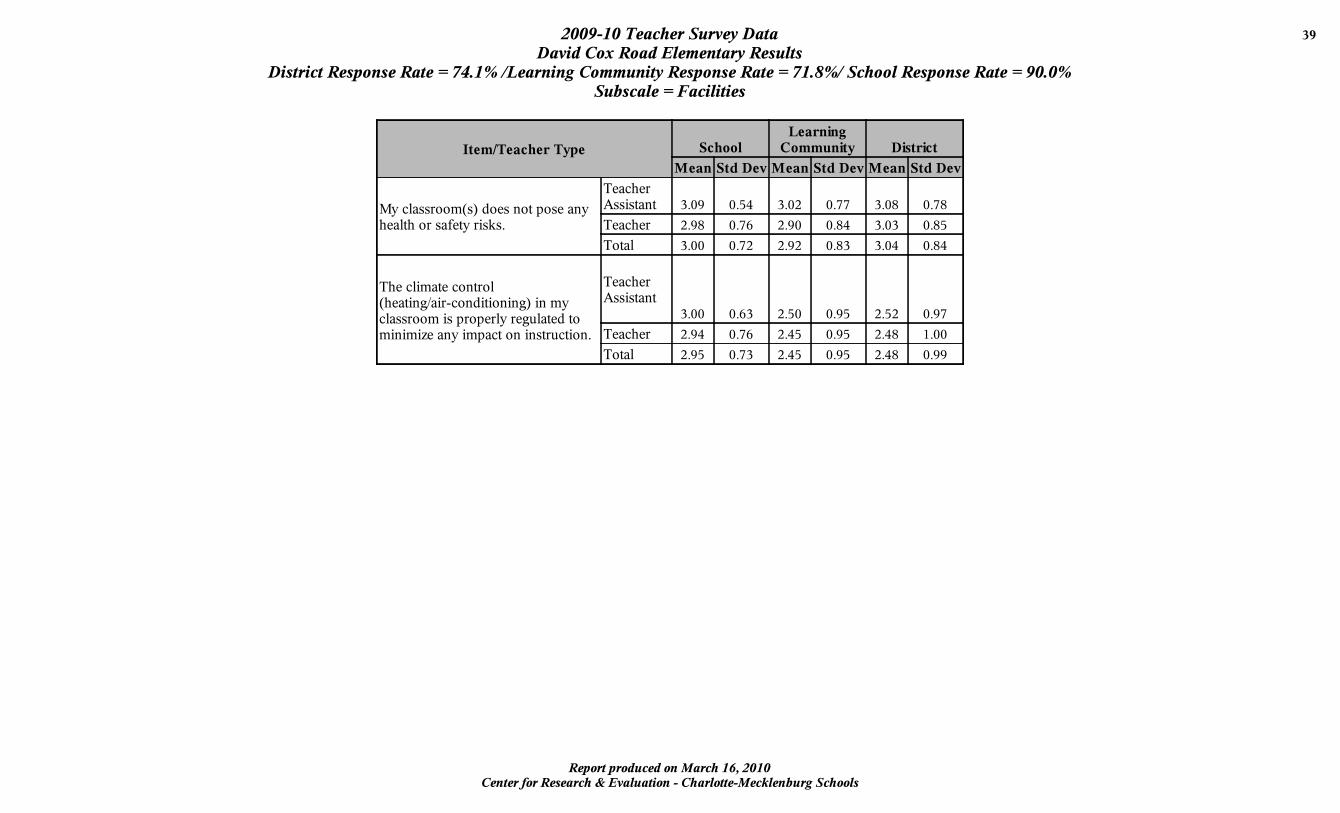
Cen ter for Research & Evaluation - Charlotte-M eck lenburg SchoolsReport produced on M arch 16 , 2010
2009-10 Teacher Survey Data 3 9
David Cox Road Elementary ResultsD istrict Response Rate = 74.1% /Learning Community Response Rate = 71.8% / School Response Rate = 90.0%
Subscale = Facilities
I t e m /T e a c h e r T y p e S c h o o lL e a r n in g
C om m u n it y D is t r ic t
M e a n S td D e v M e a n S td D e v M e a n S td D e v
M y c la s s r o o m ( s ) d o e s n o t p o s e a n yh e a l th o r s a f e ty r i s k s .
T e a c h e rA s s is ta n t 3 .0 9 0 .5 4 3 .0 2 0 .7 7 3 .0 8 0 .7 8
T e a c h e r 2 .9 8 0 .7 6 2 .9 0 0 .8 4 3 .0 3 0 .8 5
T o ta l 3 .0 0 0 .7 2 2 .9 2 0 .8 3 3 .0 4 0 .8 4
T h e c l im a te c o n tr o l( h e a t in g /a i r - c o n d i t io n in g ) in m yc la s s r o o m is p r o p e r ly r e g u la te d tom in im iz e a n y im p a c t o n in s t r u c t io n .
T e a c h e rA s s is ta n t
3 .0 0 0 .6 3 2 .5 0 0 .9 5 2 .5 2 0 .9 7
T e a c h e r 2 .9 4 0 .7 6 2 .4 5 0 .9 5 2 .4 8 1 .0 0
T o ta l 2 .9 5 0 .7 3 2 .4 5 0 .9 5 2 .4 8 0 .9 9
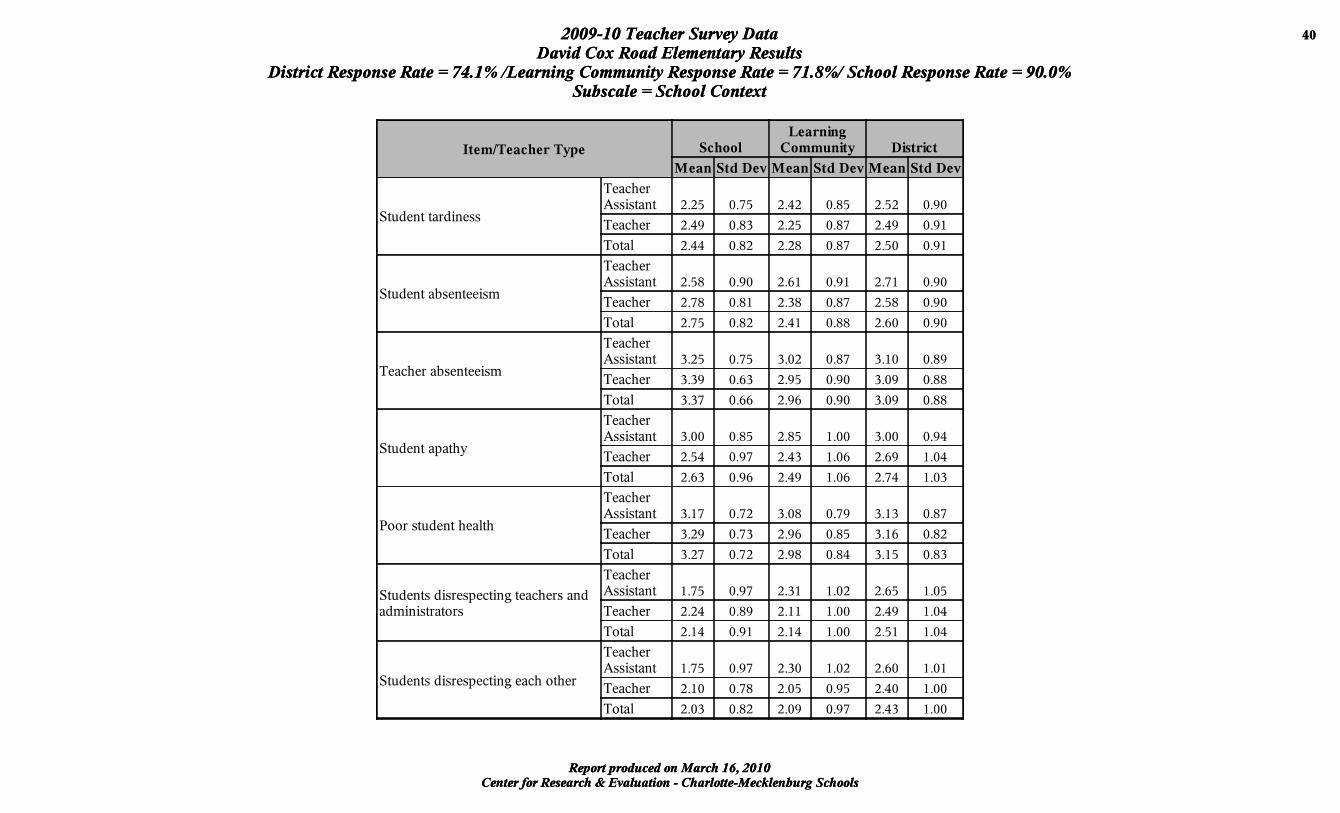
Cen ter for Research & Evaluation - Charlotte-M eck lenburg SchoolsReport produced on M arch 16 , 2010
2009-10 Teacher Survey Data 4 0
David Cox Road Elementary ResultsD istrict Response Rate = 74.1% /Learning Community Response Rate = 71.8% / School Response Rate = 90.0%
Subscale = School Context
Cen ter for Research & Evaluation - Charlotte-M eck lenburg SchoolsReport produced on M arch 16 , 2010
2009-10 Teacher Survey Data 4 0
David Cox Road Elementary ResultsD istrict Response Rate = 74.1% /Learning Community Response Rate = 71.8% / School Response Rate = 90.0%
Subscale = School Context
I t e m /T e a c h e r T y p e S c h o o lL e a r n in g
C om m u n it y D is t r ic t
M e a n S td D e v M e a n S td D e v M e a n S td D e v
S tu d e n t ta r d in e s s
T e a c h e rA s s is ta n t 2 .2 5 0 .7 5 2 .4 2 0 .8 5 2 .5 2 0 .9 0
T e a c h e r 2 .4 9 0 .8 3 2 .2 5 0 .8 7 2 .4 9 0 .9 1
T o ta l 2 .4 4 0 .8 2 2 .2 8 0 .8 7 2 .5 0 0 .9 1
S tu d e n t a b s e n te e ism
T e a c h e rA s s is ta n t 2 .5 8 0 .9 0 2 .6 1 0 .9 1 2 .7 1 0 .9 0
T e a c h e r 2 .7 8 0 .8 1 2 .3 8 0 .8 7 2 .5 8 0 .9 0
T o ta l 2 .7 5 0 .8 2 2 .4 1 0 .8 8 2 .6 0 0 .9 0
T e a c h e r a b s e n te e ism
T e a c h e rA s s is ta n t 3 .2 5 0 .7 5 3 .0 2 0 .8 7 3 .1 0 0 .8 9
T e a c h e r 3 .3 9 0 .6 3 2 .9 5 0 .9 0 3 .0 9 0 .8 8
T o ta l 3 .3 7 0 .6 6 2 .9 6 0 .9 0 3 .0 9 0 .8 8
S tu d e n t a p a th y
T e a c h e rA s s is ta n t 3 .0 0 0 .8 5 2 .8 5 1 .0 0 3 .0 0 0 .9 4
T e a c h e r 2 .5 4 0 .9 7 2 .4 3 1 .0 6 2 .6 9 1 .0 4
T o ta l 2 .6 3 0 .9 6 2 .4 9 1 .0 6 2 .7 4 1 .0 3
P o o r s tu d e n t h e a l th
T e a c h e rA s s is ta n t 3 .1 7 0 .7 2 3 .0 8 0 .7 9 3 .1 3 0 .8 7
T e a c h e r 3 .2 9 0 .7 3 2 .9 6 0 .8 5 3 .1 6 0 .8 2
T o ta l 3 .2 7 0 .7 2 2 .9 8 0 .8 4 3 .1 5 0 .8 3
S tu d e n ts d is r e s p e c t in g te a c h e r s a n da d m in is t r a to r s
T e a c h e rA s s is ta n t 1 .7 5 0 .9 7 2 .3 1 1 .0 2 2 .6 5 1 .0 5
T e a c h e r 2 .2 4 0 .8 9 2 .1 1 1 .0 0 2 .4 9 1 .0 4
T o ta l 2 .1 4 0 .9 1 2 .1 4 1 .0 0 2 .5 1 1 .0 4
S tu d e n ts d is r e s p e c t in g e a c h o th e r
T e a c h e rA s s is ta n t 1 .7 5 0 .9 7 2 .3 0 1 .0 2 2 .6 0 1 .0 1
T e a c h e r 2 .1 0 0 .7 8 2 .0 5 0 .9 5 2 .4 0 1 .0 0
T o ta l 2 .0 3 0 .8 2 2 .0 9 0 .9 7 2 .4 3 1 .0 0