37. statistics for mission - methodist€¦ · 37. statistics for mission contact name and details...
TRANSCRIPT

37. Statistics for Mission
Contact Name and Details
Alan Piggot, Research Officer (Statistics and Mapping) [email protected]
Resolution
37/1. The Conference receives the Report.
Summary of Content and Impact
Subject and Aims
The report presents the results of ongoing statistical survey of Methodist membership, attendance, community and outreach activity, over an extended timeframe covering the ten year period to 2013. From this, it lays out analysis and reporting priorities for the future.
Main Points
Data Collecting and Statistical Reporting
Methodist Church: Statistical Overview and Analysis 2003/2013
New Data Analysis and Reporting Priorities
An emerging Research Community
Background Context and Relevant Documents (with function)
SO 358; 644(8); 054 Statistics for Mission 2008 – 2010 (2011 Conference Agenda, pp 643 – 684).
Consultations
Statistics for Mission 2013 annual returns round, with input from circuit administrators, church members, Discipleship and Ministries Learning Network (DMLN) research groups, Archbishops’ Council Statistics Team; Fresh Expressions Team. Strategic Development: Methodist Council; Senior Leadership Group; Connexional Leaders’ Forum
Impact
Potentially high, as informing mission and ministry perspectives
1. Introduction 1.1 "The Methodist Church of Great Britain has always been one of the most numerate of the
Christian denominations in this country.”1 Regular collection of church statistics began in 1766 when membership numbers were reported. The mapping of Methodist church statistics goes back to Edwin Tindall’s Wesleyan Methodist Atlas (1878); while the first comparison of church statistics and national census statistics was undertaken in 1910. The late twentieth century saw significant advances in the comparative analysis of Methodist statistics – for example, through the work of the Methodist Sociological Group established in 1968.
1.2 Scepticism about the use and abuse of statistics is as long established as data collecting itself.
“Numerical values are insufficient where spiritual values are to be estimated”, wrote the Revd Henry Carter in 1911,2 aware that statistics cannot tell the whole story. Nevertheless, Methodists have generally recognised the usefulness of statistics to the Church’s mission and
1 Clive Field for British Religion in Numbers 25/09/10. http://www.brin.ac.uk/news/2010/methodist-statistics-
for-mission-report/ 2 Henry Carter The Church and the New Age (London 1911), p. 14.
ministry, while acknowledging its limitations. As the last statistical report to the Conference put it, statistics enable us to “find out something about what we are, who we are, where we are, how we have changed and are changing, and, to a certain extent, what we are doing.”3 On a practical level, statistics help to contextualise and evaluate both connexional and local projects, inform strategic decisions, and map the activity and reach of the Church.
1.3 At the present time, there is a case for more, rather than less, engagement with church
statistics. Headline figures reported by and through the media focus on a limited range of measures which feed into a generalised narrative of contraction and retreat. “It is a truth almost universally acknowledged that Christianity in Britain is in decline”, observes one commentator, before going on to add that “not all universally acknowledged truths are actually true.”4 For Methodists, focusing on falling membership numbers and the rising tally of church closures, simply aggregated across the Connexion, illustrates the point. In reality, the picture is far more nuanced than this: there are areas of growth as well as contraction; variation between Circuits, and even churches within the same Circuit, is significant; and ‘growth‘ itself can mean different things in different places. Fuller and further information is needed to grapple with some of this detail, and reconstruct a narrative that does justice to the facts on the ground.
1.4 In this context, Standing Order 358(2) directs the Connexional Team to “prepare every three
years a report on the annual membership returns for presentation to the Conference.” The Standing Order recognises the fundamental importance of membership to the Methodist tradition, but has been used to platform a range of additional statistical measures to build up a composite report on the Church. Attendance patterns, Community Roll numbers, baptism and confirmation figures, children’s and youth group activity and fresh expressions surveys have all featured in recent triennial reports to the Conference. As well as this, the reports have been used to inform the Conference of developments in the statistical collection process, and to set out priorities and plans for the future.
1.5 Building on these foundations, the present report therefore aims to:
update the Conference on developments in the statistical collection and reporting process since 2011;
provide a statistical overview and analysis of contemporary Methodism based on a range of recently collected data;
outline new data analysis and reporting priorities in the light of recent statistical evidence; and
locate these developments in the context of the emerging research community, both within Methodism and among ecumenical partners.
2. Data Collection and Statistical Reporting 2.1 The present system of data collection and statistical reporting is known as Statistics for
Mission and dates back to 2002, when annual returns from each church were first collated in a single electronic database. Since then, electronic data capture has been introduced for the collection process itself, through the use of a password-protected web-based pro forma. The range of data asked for, and the level of detail required, has in recent years been reviewed and revised to strike a balance between comprehensiveness and administrative effort. One significant development was the introduction, in 2012, of the “refresh” facility for reporting
3 Statistics for Mission 2008 – 10, para. 2.2. http://www.methodist.org.uk/downloads/stats-statsformission-
confreport2011-0511.pdf 4 David Goodhew Church Growth in Britain: 1980 to the Present (Farnham 2012), p. 3.

church-based groups and community activities: these no longer have to be entered afresh every year but are carried over from prior year entries to be updated or corrected as required.
2.2 That said, the amount of data asked for – and received – is considerable. Filling in a pro forma
for a church with a single church-based group requires 108 separate pieces of information to be entered, checked or verified: many more if a church has multiple groups or community activities. There are still almost 5,000 Local Churches to report. This has generated, since the inception of the present system, 188,905 separate data records (entries with strings of data attached). There are now over 20.4 million individual data items in the database. These, of course, relate only to Statistics for Mission.
2.3 Return rates and response times have progressively improved. In 2008, returns were received
from 85% of Local Churches; by 2010 this had risen to 96%; for the 2013 annual returns round, 99% was achieved. This was despite the window for data reporting being brought forward to close at the end of January following the close of the reporting year on 31 October. Thus nearly all returns were received within three months of the period to which they relate. This is a remarkable achievement and represents dedicated effort on the part of District Secretaries, Circuit Administrators and ministers and volunteer staff in Local Churches. They have been thanked personally and collectively by email, but it is worth reiterating appreciation of them here.
2.4 With such volumes of data being received so efficiently, the task now turns to making best use
of it. Methodism has traditionally been very good at collecting data, but it is another thing to analyse, collate and report it. The most significant development over the course of the past triennium has been the launch of the Methodist webmap. The standard version, now downloadable in app or tablet format, serves primarily as a Find a Church facility. This year (2014) it will be updated to show all places where Methodists actually meet for worship rather than just a primary location for each Local Church. The advanced version of the webmap links into ten-year membership and attendance statistics for each Local church, and to a range of contextual data such as local census and deprivation data. Locations and statistics for other Methodist institutions such as schools and care homes are also shown.
2.5 The Find a Church facility attracts around 21,200 site visits a year, compared with some 2.4
million for the Methodist website. The advanced webmap (which has now been updated with 2011 census figures) attracts around 7,000 site visits, some of considerable duration. These are respectable figures for a relatively new facility, but there is obviously potential to expand usage through better promotion, and attention will be given to this during the forthcoming review of the Statistics for Mission website.
2.6 Two other areas are also being addressed to improve the data reporting process:
Local Ecumenical Partnerships, where there is still confusion apportioning membership in churches with single congregations; and
Church closures and society cessations: most of the 1% non-returns in the 2013 data collection round relate to churches which may have closed or become a class of another Local Church.
Consultations are underway to resolve these issues for 2014.
2.7 In planning ongoing and future improvements, the Statistics for Mission team builds on what has now become a bedded-down system. The returns process is part of circuit life; there is two-way communication between the team and contacts at church, circuit and district level;

annual enhancements are incorporated into the data entry system; reporting is kept under review. It may rightly be said that Statistics for Mission has come of age.
2.8 During the past triennium, the ten-year mark was reached since the system first starting. This
allows the opportunity for the present report to look back not just over the triennium period 2010 /2013, but also over the past decade 2003 to 2013. The advantage of this additional perspective is that it puts year-to-year variations into context and helps determine whether they are blips or part of a broader underlying trend. A more accurate picture of the overall development can thus be reported. It is also more reliable to data-cleanse (filling in gaps and correcting anomalies) over an extended rather than a limited period. Considerable effort has been put into reviewing prior year entries for completeness and reasonableness so that a ten-year numerical survey of Methodism may be reported with confidence.
3. Overview and Analysis: Period to 2013 3.1 Methodist ’numbers‘ traditionally comprise three main measures. Each relate to a different
aspect of the Church and its work and it is important not to focus on a single measure to the exclusion of the others: they must be viewed in combination.
Membership 3.2 This is a ’people‘ measure, counting those who have made and sustained a formal
commitment to a particular Local Church. 3.3 As at 31 October 2013, the membership count across the Connexion stood at 208,738. This
compares with 232,734 in 2010 and 304,971 in 2003. 3.4 The annual reduction in membership numbers averaged 8,000 for the 2010 /2013 triennium,
compared with 10,040 for the 2007/ 2010 triennium and 9,550 for the 2004/ 2007 triennium. The overall pattern follows close to a 3.7% year on year reduction in numbers over the course of the decade.
TABLE 1: Methodist Membership – Movement over the Triennium and Decade
Figures in 000s Triennium Decade
Members in 2010 233 Members in 2003 305
Add New members received* 8 29
Transfers in* 11 44
Less Deaths* (18) (65)
Transfers out* (9) (36)
“Ceased to meet”* (12) (53)
213 224
Less Movement on LEPs (4) (15)
Members in 2013 209 Members in 2013 209
down 10.3% down 31.6%
*Excluding Single Congregation LEPs
Figure 1 shows how this plays out in the day-to-day story of the church.

FIGURE 1: Every day, on average
(These numbers could reasonably apply to yearly movement in a Circuit of some 500 members,
although there are, of course, no ’average‘ Circuits.)
3.4 The key dynamic is the ratio of deaths to new members, which has increased from around 2 to 1 at the beginning of the decade to around 2.5 to 1 in 2013. Confirmations and receptions into membership must rise if overall membership numbers are to be sustained. There were 2,496 recorded confirmations in 2013.
3.5 The “Ceased to Meet” category has been falling in recent years. In the 2004 /2007 triennium,
around 6,500 names were removed from the rolls each year, relating to members who had been lost track of, whose address was unknown, or who had stopped coming to church. By 2010 /2013, this figure had fallen to around 4,000. This may indicate that fewer former members are drifting away from church, but may also mean that rigorous pruning of the rolls during that earlier period has now worked its way through, leaving cleaner and more realistic membership records.
3.7 The surplus of transfers in over transfers out has long been a feature of the annual returns
and may relate to arrivals from overseas and/or members failing to be recorded when they move on from a Local Church.
Attendance 3.8 This is an ’event‘ measure, or to be more precise, a ’person-in-event‘ measure. A person who
attends a Sunday service and a service in the week scores twice on a weekly attendance measure. A congregation of 20 which meets every other week scores 10 on a weekly attendance measure.
-20 -15 -10 -5 0 5 10 15
16 Deaths 7 New Members BUT
8 Transfers out 10 Transfers in
11 "Ceased to Meet"
BUT
Over the triennium period 2010 to
2013. Single Congregation LEPs
excluded

3.9 Across the Connexion, weekly attendance in October 2013 was around 224,500. This
compares with around 244,000 in 2010 and 326,400 in 2003. 3.10 The annual reduction in attendance numbers averaged 6,510 for the 2010/2013 triennium,
compared with 10,570 for the 2007 /2010 triennium and 13,270 for the 2004 /2007 triennium. The overall pattern follows fairly close to a 3.7% year on year reduction in numbers over the course of the decade (same figures as for membership), but with proportionately more of the decline concentrated in the two earlier triennial periods, suggesting the situation may be slightly improving.
3.11 Attendance at Methodist services remains a predominantly Sunday phenomenon. During the
course of the 2010/13 triennium, 86% of all attendances were for Sunday services. This percentage is in fact slightly up on the figures for 2007/2010 (85%) and 2004/2007 (84%).
3.12 Proportions are age related:
89% of adult attendances are for Sunday services; compared with
77% of secondary school and college age attendances (13 through 19);
66% of primary school age attendances (5 through 12); and
75% of pre-school age attendances (0 through 4).
3.13 The figures for the school age groups will be affected by attendance at school assemblies, and may arguably be over-stated by not taking into account weekday assemblies at Methodist schools. There are 81 Methodist schools in Britain – 65 in the Maintained sector5 and 16 independent. In September 2013, they had a pupil roll of:
Maintained schools: 14,283
Independent schools: 10,214, totalling 24,497
3.14 These numbers represent a significant constituency, equal in size to 11.7% of Methodist membership (some older pupils will indeed be Methodist members), and generating attendances which supplement services taking place at, or from locally-based Methodist churches.
Community Roll 3.15 This is a ’people‘ measure, comprising named individuals “who are within the pastoral care of
the Local Church” (SO 054(7)). This obviously includes members, but also those who are not members yet have meaningful links with the church. It has sometimes been used as a proxy measure of the church’s wider reach.
3.16 As at 31 October 2013, numbers recorded on churches’ Community Rolls totalled 446,600.
This compares with 583,000 in 2010 and 861,600 in 2003. 3.17 If used as a measure of the church’s wider reach, the figures indicate that in 2013 Methodism
involved 0.7% of the population of Great Britain compared with around 1.0% in 2010 and 1.5% in 2003.6 The population of Great Britain is estimated to have risen 7.5% in the decade to 2013.
5 Of the 65 Maintained schools 23 are joint Methodist/Church of England primary schools.
6 Using ONS mid-year population estimates for 2003 and 2010 and population projections for 2013.
Population of Great Britain mid-2003: 57,932,000; mid-2013: 62,255,000

FIGURE 2: Total Community Roll numbers 2003 to 2013
3.18 Figure 2 accounts for the 48% contraction in the Community Roll over the course of the
decade and shows that, while some of it relates to the 32% drop in membership, the main cause has been the 60% drop in those who are non-members – the so-called ’pastoral others‘.
3.19 Unfortunately, without further research into how Community Rolls are compiled, it is by no
means clear who these people actually are. Their links with the Local Church may range from strong (eg young children of committed members) to purely nominal (eg former members who have “ceased to meet”). There is also a wide variation in the ratio of members to ’pastoral others‘ among individual churches. In 2013, 24% of churches failed to report any ’pastoral others‘; 39% had fewer ’pastoral others‘ than members; 21% had up to twice as many ’pastoral others‘ than members; 13% had between two to five as many ’pastoral others‘ than members; and 3% had between five and as many as 27 times as many ’pastoral others‘ than members.
3.20 If Community Roll figures are compared with movements in the numbers of baptisms,
weddings and funerals reported over the course of the decade (Figure 3), we find a larger percentage drop in the annual number of weddings (58.9%) but smaller percentage drops for baptisms (33.5%) and funerals (35.4%). Most of these drops occurred in the period 2003 to 2007. In the year to 31 October 2013, there were 2,751 Methodist weddings7, 10,043 baptisms and 21,057 funerals.
7 This figure was significantly down on the figures for 2010 (3,271), 2011 (3,302) and 2012 (3,149). It remains
to be seen whether it is a ’one-off’.
0
100
200
300
400
500
600
700
800
900
1000
2003 2004 2005 2006 2007 2008 2009 2010 2011 2012 2013
Tho
usa
nd
s
Community Roll
“Pastoral Others”
Members
Members include all members of single congregation LEPs

FIGURE 3: Weddings, Baptism and Funerals 2003 to 2013
3.21 It is therefore difficult to interpret what these downward trends indicate. Rather than suggesting Methodism to be losing touch with wider society, or failing to reach young children, the fall-off in Community Roll numbers could mean that churches are experiencing difficulty in maintaining their rolls, or have purged them of extraneous names. It should also be borne in mind that, however uncertain their present usage, the Community Rolls’ original purpose was pastoral rather than statistical.
New Methodist Statistics 3.22 Statistics for Mission has always included information on church groups and community
activities, but it was only in 2011 that a comprehensive listing of groups and activities began to be compiled. This followed pioneering work piloted by eight Districts to achieve the right balance between system friendliness and level of detail8.
3.23 The numbers of groups being reported has risen year on year, from 19,517 in 2011 to 24,258
in 2013. This may reflect the reporting system bedding down rather than, or as well as, a real increase in group activity. Most groups record the number of volunteers who regularly help to run and support them. 52% of these groups are served by three or fewer volunteers, but 12% have ten or more. A community centre or church cafe may have a rota of as many as 80 volunteers organised around separate activities or shifts.
8 Manchester & Stockport; Bedfordshire, Essex & Hertfordshire; Bolton & Rochdale; Cornwall; Cumbria;
Lancashire; Liverpool; Sheffield.
0
5
10
15
20
25
30
35
2003 2004 2005 2006 2007 2008 2009 2010 2011 2012 2013
Tho
usa
nd
s
Funerals
Weddings
Baptisms

3.24 Instead of being used simply to provide incidental illustrations of the variety of Methodist life, this kind of detailed information ought properly to be brought to account. Combining it with ’traditional‘ measures, which tend to focus on public worship and church congregations, would help build up a more rounded picture of Methodism – one which does not privilege ’congregation‘ against ’small group‘ and which recognises how both have contributed, and continue to contribute, to the ongoing life of the church. As the Secretary of the Conference has previously observed, “in terms of enabling better discipleship the sum of ‘congregation and cell’ is greater than the parts”, and “belonging to both is best, as early Methodists knew.”9
3.25 One way to combine statistical information on church groups with more traditional
standardised data is by adopting a ’standardised weekly attendance‘ measure. On the Statistics for Mission returns form, each individual group reports how regularly it meets and how many (on average) attend. This works for established prayer and fellowship meetings as it does for fresh expressions. A group of 10 meeting twice a week scores 20 on a weekly attendance measure; 5 if it meets every other week. As congregational attendances are reported in a similar way, a top-level view can be formed of how Methodist attendances are distributed among the main category types (Figure 4).
FIGURE 4: Standardised Weekly Attendances in year to 31 October 2013
3.26 These figures could be used to suggest that only a quarter of Methodism is about Sunday services, and that the great majority of the other three quarters is about groups and outreach activities. Care will be needed, as these figures are developed over the next few years, to ensure that group numbers are not over-reported; that variations in meeting-by-meeting
9 Martyn Atkins Discipleship... and the People called Methodists (Methodist Publishing House 2010), p. 28.
Atkins goes on to observe that “if a choice really had to be made between the two, the patterns of early Methodism would suggest that ‘small group’ precedes ‘congregation’ in terms of effective disciple-making.”
191,812
32,680
483,786
38,483
Sunday Servives
Weekday Services
Groups and Outreach
Fresh Expressions

attendances are taken into account; and that some consideration is given to the relative amounts of time and commitment involved in individual attendances.
Analysis by Activity 3.27 Table 2 shows how Methodist activity may be broken down, using the standardised weekly
attendance measure. “Activity” here refers to purposeful meeting in congregations or groups, so will not include the considerable amount of work carried out through one-on-one visits and pastoral encounters: thought will need to be given to how to incorporate this in an overall survey of Methodist presence and reach. There is also discussion to be had on how much of this reported activity may be properly regarded as ’church‘: does counting the clientele of a church café, for instance, score towards numbers of attendances at church-sponsored activities? The Statistics for Mission team is engaging with these issues jointly with the Chaplaincy Development team and the Fresh Expressions Connexional Missioner, who is part of the ecumenically focused Fresh Expressions team.
TABLE 2: Weekly Attendances reported in the year to 31 October 2013
Activity Weekly Attendances (standardised)
Number of Societies/ Groups
Average Weekly Attendances per Group
Average Years running
Percentage of Groups
Ordained Leadership
Meeting in Church Premises
Sunday Services 191,812 4,486 43
Café & Luncheon Groups 85,294 1,993 43 10 18% 90%
Prayer & Fellowship 71,061 7,278 10 17 20% 68%
Support Groups 66,084 1,303 51 7 35% 52%
Children & Youth 59,487 3,158 19 16 16% 87%
Parent & Toddler 44,483 1,672 27 13 29% 94%
Uniformed Organisations 41,781 1,938 22 31 4% 96%
Shops & Stalls 36,409 150 243 11 8% 64%
Weekday Services 32,680 1,400 23
Arts & Music 17,886 1,244 14 11 8% 90%
Discipleship & Learning 10,587 1,437 7 10 41% 51%
Wellbeing & Sport 10,068 540 19 8 4% 80%
Life Skills 4,253 127 33 5 13% 76%
Other unclassified 74,876 3,418 22 12 26% 70%
Total 746,761
3.28 The table gives an idea of how the three quarters of a million weekly Methodist attendances are distributed and effectively serves as a ’map‘ of contemporary Methodism. The variety of Methodist activity may be gauged by comparing, say, discipleship and learning groups with average weekly attendances of around seven with shops, stalls and charity events which may attract attendances in their hundreds. It also suggests there are both ’newer‘ (eg life skills courses, covering areas such as parenting and debt management, which have been running for an average of five years) and more ’established‘(eg uniformed organisations such as cubs and brownies, running on average for over thirty years) types of Methodist or Methodist-sponsored activity. It shows that, outside of church services, lay people lead in running groups or activities (although many discipleship and learning courses and support groups – especially those in schools and care homes – are run by deacons and presbyters). And it indicates that

the great majority of all types of Methodist or Methodist sponsored activity still take place in churches or church premises.
Analysis by Age 3.29 At church services, children’s and adults’ attendances are recorded separately and children’s
attendance broken down into 0 to 4 year olds; 5 to 12 year olds and 13 to 19 year olds. Adult attendances make up 85% of the total: this percentage has been rising steadily since 2003, when it was 76%.
3.30 Children’s attendances have fallen considerably – from 77,900 in 2003 to 32,700 in 2013, a
reduction of around 58%. This equates to an eight percent year-on-year fall over the course of the decade. The reduction over the course of the 2010/ 2013 triennium, around 13,100, accounts for just under three tenths of the overall loss. Figure 5 shows the breakdown for 2013.
FIGURE 5: Average Weekly Attendances at Church Services, October 2013
3.31 For group and outreach activities, the age breakdown may be very different. It is not possible
to report exact numbers, but broad-brush estimates may be calculated by using the attendee
age-bandings noted for each individual group and activity (Figure 6).
7,466
18,084
7,192
191,750
0 to 4
5 to 12
13 to 19
20 and over

FIGURE 6: Weekly Attendances at Groups and Outreach Activities, by Age Band (year to 31
October 2013)
3.32 Children and youth here account for around 45% of all attendances – three times the proportion reported for church services. Over 60s account for 28% of all attendances. That leaves slightly over a quarter of attendances accounted for by people of working age.
Analysis by Church 3.33 The Methodist Church is organised into societies, or Local Churches, of which there were
4,812 to report as at 31 October 2013. This compares with 5,112 in 201010 and 6,286 in 2003. Work is continuing to establish more accurately when individual societies closed or merged, but there is some evidence to suggest that the rate of closures – which averages around 150 a year over the course of the decade – may have slowed over the past triennium, with fewer than a hundred for the years ending in 2012 and 2013.
3.34 Across the Connexion there are a large number of small churches and a small number of large
churches. Table 3 uses Average Weekly Attendance as a measure of the “size” of a church and divides total attendance into five equal fifths – the top fifth accounted for by the largest churches and the bottom fifth by the smallest. 5% of churches by number – the largest churches – account for 20% of total attendance (10% of total attendance is accounted for by 83 churches (1.7% of the total number) alone). On the other hand, there are over 2,600 churches in the bottom fifth with attendances of 36 or under. Of this latter group, there are 954 churches with attendances of 21 or over, 964 with attendances of between 11 and 20 and 728 with attendances of ten or less.
10
This figures excludes 50 churches with no reported membership as at 31 October 2010.
56
110
67
41 25
31
46
54
51
40 0 to 4 (56)
5 to 12 (110)
13 to 19 (67)
20 to 29 (41)
30 to 39 (25)
40 to 49 (31)
50 to 59 (46)
60 to 69 (54)
70 to 79 (51)
80 and over (40)
Figures in 000s

TABLE 3: Local Churches grouped by Average Weekly Attendance, 2013
Smallest Average Largest
Top Fifth 222 churches (5% of total) “Programme” Size11
142 202 616
Second Fifth 397 churches (8% of total) “Pastoral” Size 92 113 142
Third Fifth 598 churches (12% of total) “Larger Family” Size 62 75 92
Fourth Fifth 949 churches (20% of total) “Smaller Family” Size 36 47 62
Fifth Fifth 2,646 churches (55% of total) “Fellowship” Size 012
17 36
3.35 The larger the church, the more likely it is to have grown numerically over the course of the
last three years. The converse is also true, with smallest churches being the least likely to have grown numerically. In the period 2010 to 2013:
68% of “Programme” size churches grew; 32% saw a reduction in attendance numbers;
52% of “Pastoral” size churches grew; 48% saw a reduction in attendance numbers;
51% of “Larger Family” size churches grew; 49% saw a reduction in attendance numbers;
47% of “Smaller Family” size churches grew; 53% saw a reduction in attendance numbers;
35% of “Fellowship” size churches grew; 65% saw a reduction in attendance numbers. 3.36 Across the Connexion as a whole, 2,037 out of 4,812 churches (42%) had seen increases in
weekly attendances, compared with 2,775 (58%) where numbers had declined. Analysis by Church Type 3.37 The Methodist Church usefully classifies Local Churches into six generic types, characterised
by the neighbourhood or community they serve (Table 4). TABLE 4: Local Churches grouped by characteristic type, 2013
Weekly Attendances Average per church
“City Centre” 109 churches (2% of total) 12,309 (5% of total) 113
“Inner City” 274 churches (6% of total) 14,680 (6% of total) 54
“Council Estate” 236 churches (5% of total) 10,200 (5% of total) 43
“Suburban” 1,135 churches (24% of total) 76,805 (34% of total) 68
“Small Town” 990 churches (20% of total) 64,069 (29% of total) 65
“Village Rural” 2,068 churches (43% of total) 46,429 (21% of total) 22
11
This and the other tags used here are loosely based on categories devised Arlin Rothauge to examine congregational development. See the discussion by Robert A. Gallagher Parish Size: Categories, Dynamics and Issues, 2002, 2006 12
Some congregations meet seasonally, so report no October attendance.

3.38 The three ’big‘ categories are “Suburban”, “Small Town” and “Village Rural”. 84% of Methodist weekly attendances are at one of those three types of church. In terms of attendance figures, the characteristic size of “Suburban” and “Small Town” churches is that of a “Larger Family” congregation. “Inner City” and “Council Estate” churches tend to the “Smaller Family” size, while “City Centre” churches may be “Pastoral” size or larger.13 “Village Rural” churches are characteristically “Fellowship” size, and 602 out of 2,068 have reported weekly attendances of 10 or under.
3.39 All the category types have seen total attendance numbers reduce over the course of the last
three years, but while “Council Estate” attendance has seen a 16% reduction, numbers have fallen by only 4% in “Small Town” churches. Over the course of the decade, however, it is in “City Centre” churches where attendance has fallen the least, as shown in Table 5.
TABLE 5: Change in Average Weekly Attendance 2003 to 2013, by Church Type
Overall Percentage Change Equivalent Year-on-Year
Percentage Change
“City Centre” -21.4% -2.4%
“Inner City” -37.8% -4.6%
“Council Estate” -38.4% -4.7%
“Suburban” -32.1% -3.8%
“Small Town” -27.8% -3.2%
“Village Rural” -32.5% -3.9%
Analysis by District 3.40 There are currently 31 Districts covering Great Britain and the Islands. While varying greatly in
size and population, and not corresponding with regional administrative boundaries, the Districts allow for a degree of analysis by area, complementing the analyses made by size and type of Local Church.
3.41 Summary details are shown at Appendix 1, which gives a District-by-District breakdown of (a)
membership and Community Roll numbers; (b) weekly attendances at church services; (c) standardised weekly attendances for groups and outreach activities; and (d) numbers of baptisms, weddings and funerals. Where the analysis reports the position for a single year (2013), some caution should be applied: the year may not be typical, or there may be figures which have slipped over from the previous year, or need to be re-assigned to the next year.
3.42 The figures give an indication of the variety of Methodist life and of the contrasting stories of
Methodism within the Connexion as a whole. By way of illustration, the ratio of deaths to new members in one District may be over four times what it is in another: there is similar variation in the ratio of Methodist full members to “pastoral others”. In terms of groups and activities, there are some Districts where outreach and fellowship would appear to be focused in
13
27 of the 222 reported “Programme” size churches, with weekly attendances of 142 or above, are found in City Centres, although the majority are in fact Suburban (88) or Small Town (80).
particular areas. There are six Districts where over 25% of standardised weekly attendance is accounted for either by cafés or lunch clubs, or by charity shops and stalls. In another District, support groups for schools, asylum seekers, refugees, homeless people and other people in need account for over a quarter of attendances.
3.43 The figures for weekly attendances at church services also present a contrasting picture.
There are four Districts where attendance has reportedly grown from 2010 to 2013. There are a further fifteen which, while reporting a fall in attendance, show that the rate of fall slowed down during the course of the triennium compared with the decade as a whole, five where it appeared to accelerate, and seven where it stayed roughly the same.
3.44 These variations will conceal even more significant differences between Circuits and individual
churches, even within the same District. 4. New Data Analysis and Reporting Priorities
4.1 Building on the baseline collection and reporting methods now established, it is important to
take these forward so that they become – as the words suggest that they should be – truly Statistics for Mission. That is: that they help the Methodist Church to understand the effectiveness of its ministry; feed into connexional programmes, projects, decisions and policy recommendations; and lend context to the work involved in evangelism and nurturing disciples.
4.2 A fundamental part of how to do this lies in getting the statistics to talk to each other, just as
Methodists effectively talk to each other in churches, Circuits, and across the Connexion. New information is thereby generated; new perspectives gleaned; questions and challenges raised; and local experience put into context. The process helps determine whether insights remain at the level of anecdote or can be supported by evidence.
Within Statistics for Mission 4.3 From the data already collected through the Statistics for Mission process, there are
opportunities for this to take place. For example: by exploring the relationship between attendance figures at Methodist services and numbers of Methodist members. At an aggregate level, this relationship appears close. Across the Connexion as a whole, weekly attendance and membership numbers are of a broadly similar order, are distributed in similar patterns, and move in the same direction. This could suggest that – perhaps more than any other mainstream denomination – Methodism is about members-who-attend on the one hand, and attending to its members on the other.14
4.4 Closer analysis suggests, however, that at local level the relationship may not be entirely
straightforward. In terms of movement, while a majority of Local Churches report membership and attendance moving in the same direction – either up or down – there are a significant number where either attendance is growing while membership is falling, or vice versa. Table 6 shows the position for the triennial period 2010 to 2013.
14
In theory, of course, members and attenders could be entirely different sets of people. Statistically, however, the correlation between these populations is high, even at local level. Plotting October membership against October attendance for each Local Church for the triennial period 2010 to 2013 gives an R-squared value of 0.676, rising to 0.792 if attendance is confined to Sunday.

TABLE 6: Local Churches: Movements in Membership Numbers and Average Weekly Attendance
2010 to 2013
Attendance Up Membership Down
1,227 Churches 29% of total*
Attendance Up Membership Up
593 churches 14% of total*
Attendance Down Membership Down
1,985 Churches 47% of total*
Attendance Down Membership Up
448 churches 10% of total*
Out of 4,253 Local Churches, excluding those closing in the period 2010 to 2013 or where membership figures were unchanged
4.5 The point of this analysis is not to brand churches into categories but to stimulate questions
locally as to why a particular church lies in the category which it does. For churches with falling membership but rising attendance, is it that people are coming from outside – perhaps for short periods or on an occasional basis – but not committing themselves to formal membership? For churches with rising membership but falling attendance, is it that existing members are not coming to church as regularly as they used to? Following through these questions stimulates engagement with churches’ mission and ministry activity at the local level, and encourages experiences to be shared and priorities to be reviewed within and between Circuits. It also goes to the heart of emerging connexional research on the challenging issue of ’church growth‘, which will be informed by, as well as bring together, experiences locally.
More widely within the Connexion 4.6 Connections can also be made between data collected through the Statistics for Mission
process and data held elsewhere by the Connexional Team. Over the course of the past few years, the Team has been looking to consolidate its data holdings by means of a relational database (“The Connexional Database”) which can potentially bring together ’traditional‘ church statistics with a range of other measures not previously reported in this context. Information on the number, status and stationing of presbyters and deacons, and on local preachers and worship leaders (“Minister Statistics”), is the most obvious data category which could usefully expand and supplement what is known about congregations, church groups and membership. The Connexional Database also holds extensive information on church property, including the status and location of churches. Potentially it could be linked to records of data from churches’ financial returns.
4.7 Figure 7 shows how high level data on a range of different measures may be brought together
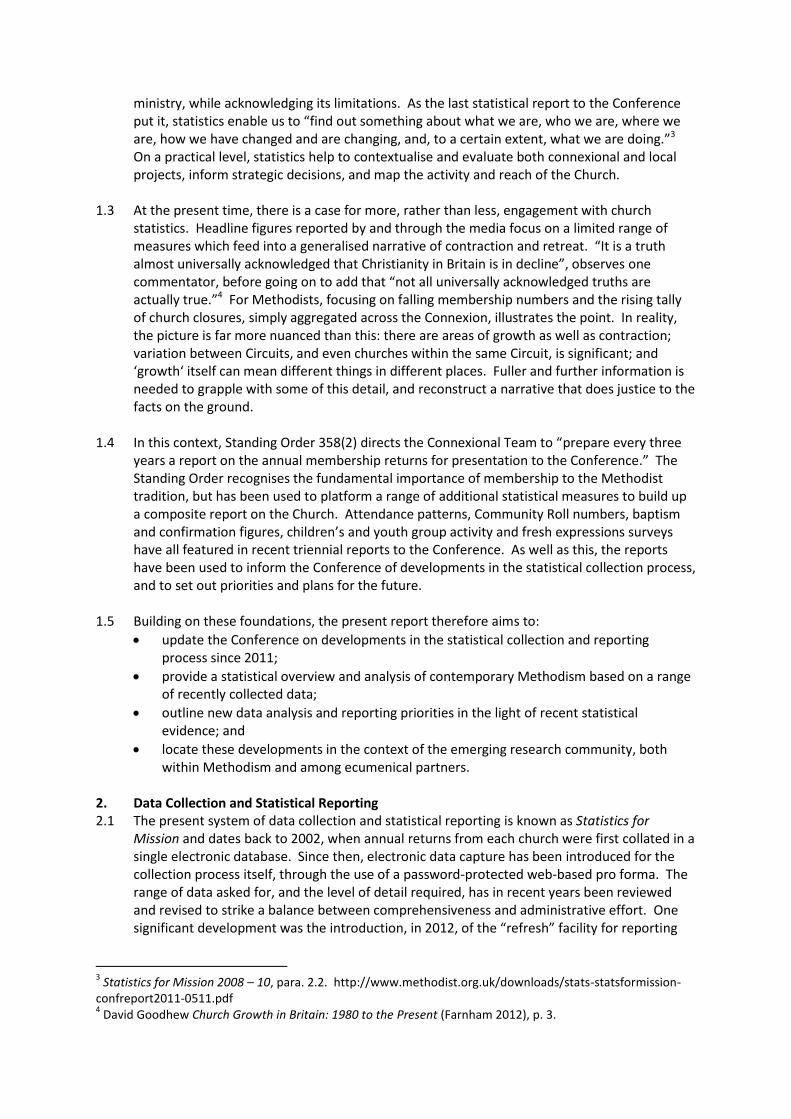
to give additional perspective to Methodism’s story over the past ten years. The movements in membership numbers and attendances at church services could suggest a ’headline‘ decline
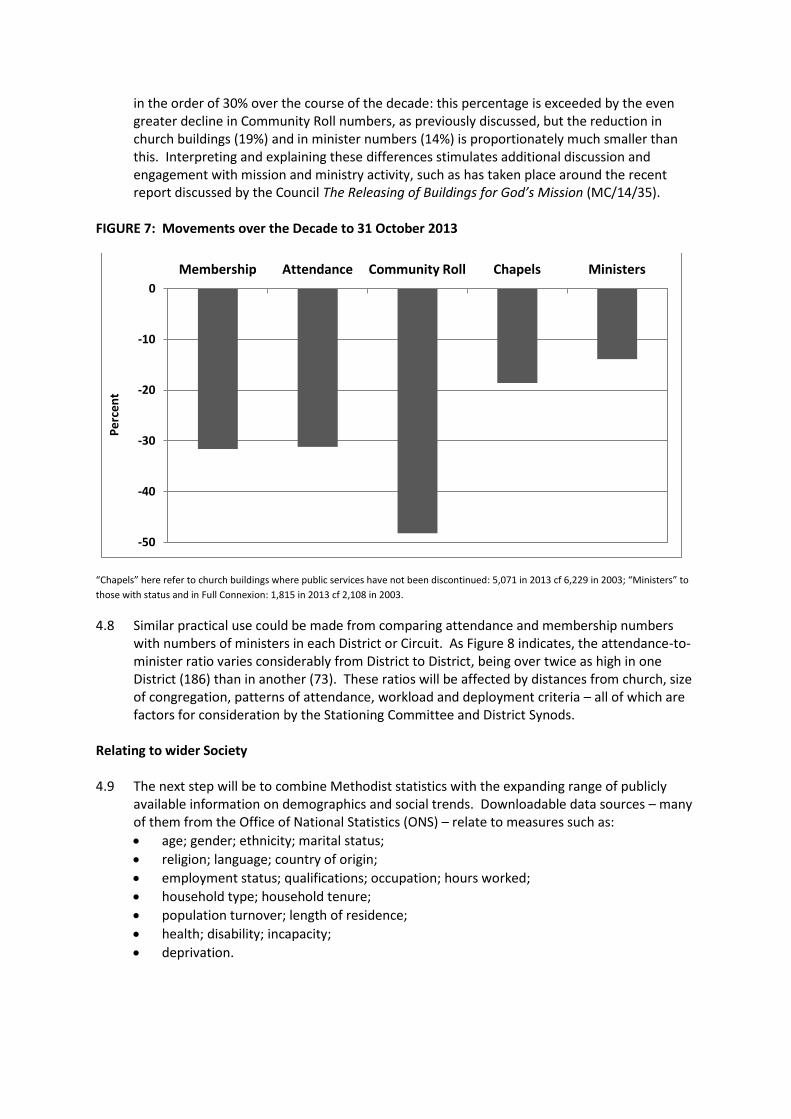
in the order of 30% over the course of the decade: this percentage is exceeded by the even greater decline in Community Roll numbers, as previously discussed, but the reduction in church buildings (19%) and in minister numbers (14%) is proportionately much smaller than this. Interpreting and explaining these differences stimulates additional discussion and engagement with mission and ministry activity, such as has taken place around the recent report discussed by the Council The Releasing of Buildings for God’s Mission (MC/14/35).
FIGURE 7: Movements over the Decade to 31 October 2013
“Chapels” here refer to church buildings where public services have not been discontinued: 5,071 in 2013 cf 6,229 in 2003; “Ministers” to
those with status and in Full Connexion: 1,815 in 2013 cf 2,108 in 2003.
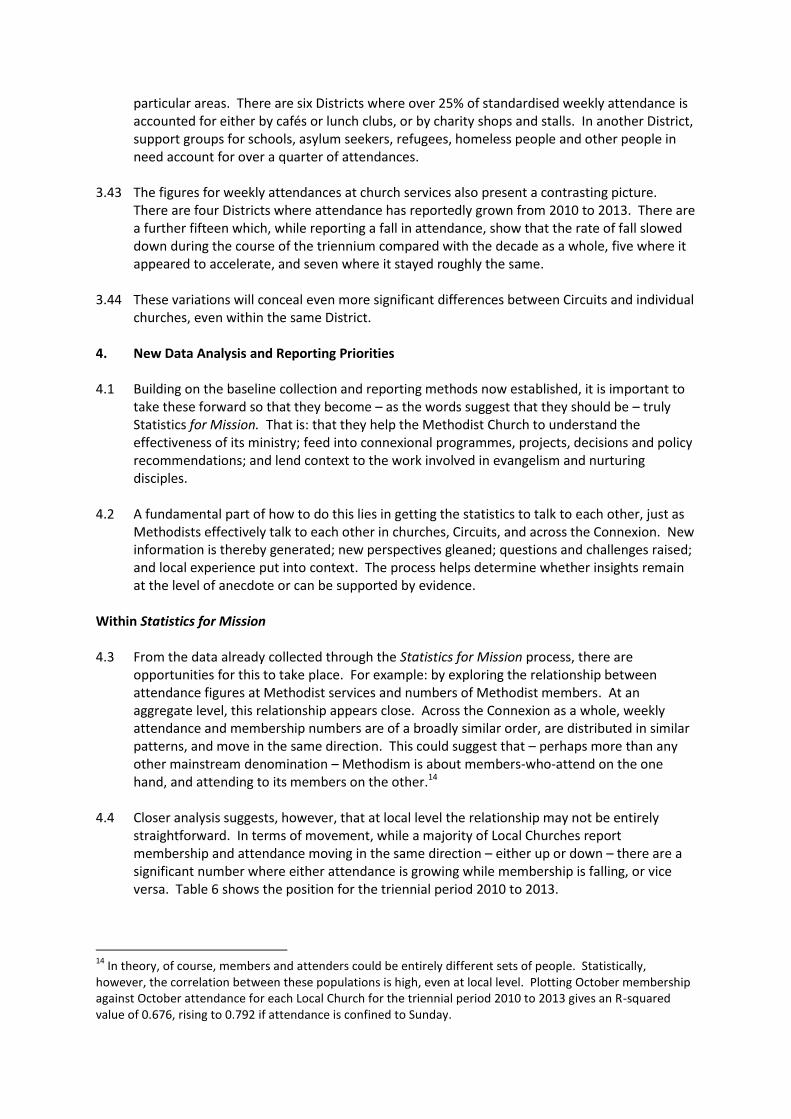
4.8 Similar practical use could be made from comparing attendance and membership numbers with numbers of ministers in each District or Circuit. As Figure 8 indicates, the attendance-to-minister ratio varies considerably from District to District, being over twice as high in one District (186) than in another (73). These ratios will be affected by distances from church, size of congregation, patterns of attendance, workload and deployment criteria – all of which are factors for consideration by the Stationing Committee and District Synods.
Relating to wider Society 4.9 The next step will be to combine Methodist statistics with the expanding range of publicly
available information on demographics and social trends. Downloadable data sources – many of them from the Office of National Statistics (ONS) – relate to measures such as:
age; gender; ethnicity; marital status;
religion; language; country of origin;
employment status; qualifications; occupation; hours worked;
household type; household tenure;
population turnover; length of residence;
health; disability; incapacity;
deprivation.
-50
-40
-30
-20
-10
0
Membership Attendance Community Roll Chapels Ministers
Pe
rce
nt
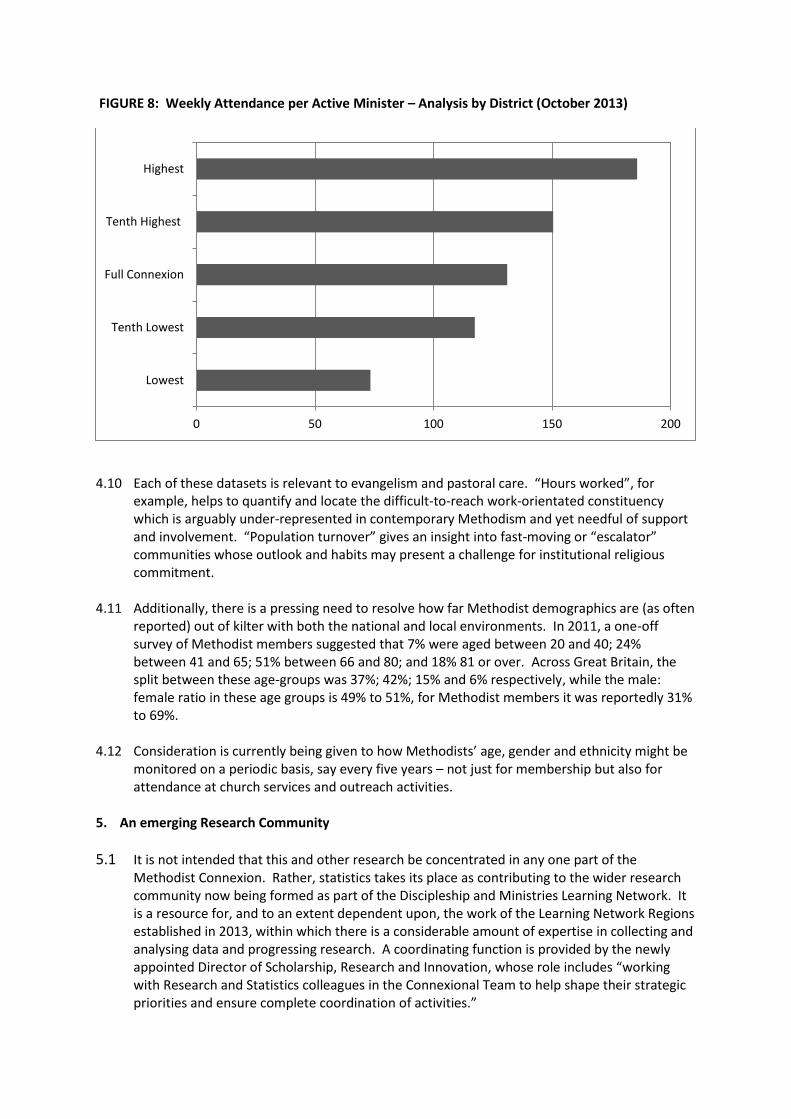
FIGURE 8: Weekly Attendance per Active Minister – Analysis by District (October 2013)
4.10 Each of these datasets is relevant to evangelism and pastoral care. “Hours worked”, for
example, helps to quantify and locate the difficult-to-reach work-orientated constituency which is arguably under-represented in contemporary Methodism and yet needful of support and involvement. “Population turnover” gives an insight into fast-moving or “escalator” communities whose outlook and habits may present a challenge for institutional religious commitment.
4.11 Additionally, there is a pressing need to resolve how far Methodist demographics are (as often
reported) out of kilter with both the national and local environments. In 2011, a one-off survey of Methodist members suggested that 7% were aged between 20 and 40; 24% between 41 and 65; 51% between 66 and 80; and 18% 81 or over. Across Great Britain, the split between these age-groups was 37%; 42%; 15% and 6% respectively, while the male: female ratio in these age groups is 49% to 51%, for Methodist members it was reportedly 31% to 69%.
4.12 Consideration is currently being given to how Methodists’ age, gender and ethnicity might be
monitored on a periodic basis, say every five years – not just for membership but also for attendance at church services and outreach activities.
5. An emerging Research Community
5.1 It is not intended that this and other research be concentrated in any one part of the Methodist Connexion. Rather, statistics takes its place as contributing to the wider research community now being formed as part of the Discipleship and Ministries Learning Network. It is a resource for, and to an extent dependent upon, the work of the Learning Network Regions established in 2013, within which there is a considerable amount of expertise in collecting and analysing data and progressing research. A coordinating function is provided by the newly appointed Director of Scholarship, Research and Innovation, whose role includes “working with Research and Statistics colleagues in the Connexional Team to help shape their strategic priorities and ensure complete coordination of activities.”
0 50 100 150 200
Lowest
Tenth Lowest
Full Connexion
Tenth Highest
Highest

5.2 Within this framework, the Statistics for Mission Team aims to:
continue to maintain and develop a connexional level ’map‘ of the Methodist Church, as a strategic resource for the Connexion as a whole and to provide context for local initiatives and policy decisions;
disseminate the data holdings, collected primarily through the annual returns process, as a readily accessible research resource for Local Churches, Circuits, Districts and Learning Network Regions, online and via the Methodist webmap. Work is in hand to upload cleaned annual returns figures for the period 2002 /2013 onto the Methodist website;
contribute statistical or mapping perspective to projects and research initiatives at both connexional, regional and local level: for instance in collating Methodist data with ONS Neighbourhood Statistics relating to particular areas or locations;
involve the Methodist Church in the expanding ecumenical statistical community, building on close collaboration with the Church of England’s Research and Statistics Department in analysing and reporting Statistics for Mission data.
5.3 The overarching aim is a Methodist statistics geared to serve the Church, linked to a
Methodist geography (and, potentially, to a revived Methodist sociology) that reflects the facts on the ground. The connexional nature of Methodism lends itself to the achievement of these aims in what is necessarily a collaborative process linking up older and newer elements of Methodism, as well as the whole range of people collecting, reporting, researching, analysing, using and, of course, generating Methodist data.
***RESOLUTION 37/1. The Conference received the Report.

Appendix 1: District Summary Tables
A. Membership and Community Roll
District As at 31/10/13 Year to 31/10/13 Deaths per New Member
As at 31/10/13 Pastoral Others per Member
Members New Members Deaths Pastoral Others
1 Synod Cymru 1,379 12 33 2.8 317 0.2
2 Wales Synod 7,401 83 263 3.2 7,294 1.0
5 Birmingham 8,478 104 234 2.3 10,053 1.2
6 Bolton and Rochdale 5,311 65 154 2.4 6,424 1.2
7 Bristol 7,711 69 239 3.5 7,348 1.0
9 Cumbria 3,424 18 111 6.2 3,279 1.0
10 Channel Isles 1,211 11 26 2.4 1,746 1.4
11 Chester & Stoke-on-Trent 7,847 94 215 2.3 7,712 1.0
12 Cornwall 6,192 93 209 2.2 4,652 0.8
13 Darlington 5,760 31 205 6.6 6,377 1.1
14 East Anglia 6,921 103 225 2.2 6,907 1.0
15 Isle of Man 969 23 34 1.5 735 0.8
16 Leeds 6,328 78 179 2.3 8,430 1.3
17 Lincoln & Grimsby 5,249 61 184 3.0 5,184 1.0
18 Liverpool 5,343 49 186 3.8 5,570 1.0
19 Manchester & Stockport 7,986 62 253 4.1 9,945 1.2
20 Newcastle upon Tyne 7,805 72 257 3.6 6,958 0.9
21 Lancashire 7,370 76 189 2.5 6,318 0.9
22 Nottingham & Derby 8,781 133 256 1.9 12,980 1.5
23 Northampton 10,538 142 312 2.2 9,115 0.9
24 Plymouth & Exeter 7,996 99 196 2.0 6,914 0.9
25 Sheffield 7,115 86 227 2.6 8,901 1.3
26 Southampton 8,770 99 273 2.8 10,087 1.2
27 West Yorkshire 6,339 51 213 4.2 5,191 0.8

28 Wolverhampton & Shrewsbury 8,463 74 284 3.8 7,337 0.9
29 York & Hull 8,512 76 265 3.5 9,518 1.1
31 Scotland 2,208 * 83
1,804 0.8
32 Shetland 217 * *
259 1.2
34 Bedfordshire, Essex & Hertfordshire 8,095 87 256 2.9 10,635 1.3
35 London 18,453 435 334 0.8 13,705 0.7
36 South East 10,566 101 278 2.8 12,199 1.2
Connexion 208,738 2,496 6,181 2.5 213,894 1.0
* Low numbers not reported for confidentiality reasons

B. Average Weekly Attendance 2013 (Church Services)
District Weekly Year-on-year change Breakdown by Age Percentage
Attendance 2010 to 13 2003 to 13 20 and over 13 to 19 5 to 12 0 to 4 20 and over
1 Synod Cymru 830 -1.6% -5.8% 760 10 40 20 92%
2 Wales Synod 7,400 -4.8% -4.7% 6,490 170 500 230 88%
5 Birmingham 8,740 -0.4% -3.6% 7,440 280 760 250 85%
6 Bolton and Rochdale 5,370 -5.0% -2.9% 4,320 170 580 290 80%
7 Bristol 9,750 -3.4% -4.3% 8,320 270 840 320 85%
9 Cumbria 3,390 -4.6% -3.3% 3,020 90 210 70 89%
10 Channel Isles 1,260 -2.8% -5.0% 1,010 50 140 60 80%
11 Chester & Stoke-on-Trent 8,490 -1.1% -3.6% 7,360 270 580 290 87%
12 Cornwall 6,810 0.1% -2.9% 6,110 150 410 140 90%
13 Darlington 5,650 -2.8% -4.4% 4,930 110 450 160 87%
14 East Anglia 8,520 -1.7% -3.5% 7,610 240 470 200 89%
15 Isle of Man 1,120 2.3% -0.1% 930 50 100 50 83%
16 Leeds 6,160 -2.2% -3.8% 5,160 180 620 210 84%
17 Lincoln & Grimsby 5,370 -1.9% -4.7% 4,880 100 300 100 91%
18 Liverpool 6,220 3.4% -3.8% 4,890 190 850 290 79%
19 Manchester & Stockport 7,310 -5.2% -4.5% 6,380 170 520 240 87%
20 Newcastle upon Tyne 8,810 -2.5% -2.8% 7,470 280 740 310 85%
21 Lancashire 7,390 -3.5% -3.6% 5,990 270 840 290 81%
22 Nottingham & Derby 9,780 -1.1% -3.5% 8,290 290 860 340 85%
23 Northampton 11,750 -3.6% -3.4% 10,300 330 740 380 88%
24 Plymouth & Exeter 8,940 -2.0% -2.9% 7,870 350 450 270 88%
25 Sheffield 8,530 -5.9% -4.2% 7,190 270 710 360 84%
26 Southampton 10,580 -2.6% -3.5% 9,320 280 650 330 88%
27 West Yorkshire 6,400 -4.4% -4.3% 5,470 130 480 320 85%
28 Wolverhampton & Shrewsbury 9,840 -3.4% -3.8% 8,490 290 770 290 86%
29 York & Hull 9,370 0.0% -3.7% 7,920 310 960 180 85%

31 Scotland 1,760 -10.3% -5.2% 1,600 40 80 40 91%
32 Shetland 290 3.1% -2.1% 220 10 60 10 76%
34 Bedfordshire, Essex & Hertfordshire 10,150 -0.8% -3.5% 8,140 640 1,010 370 80%
35 London 16,640 -3.8% -3.2% 13,690 870 1,440 650 82%
36 South East 11,850 -4.4% -3.5% 10,210 340 910 400 86%
Connexion 224,490 -2.7% -3.7% 191,750 7,190 18,080 7,470 85% Note: Age-breakdown figures in some rows may not sum to total because of rounding

C. Standardised Weekly Attendances 2013 (Groups and Outreach Activities)
Pra
yer
&
Fello
wsh
ip
Dis
cip
lesh
ip &
Le
arn
ing
Life
Ski
lls
Sup
po
rt G
rou
ps
Par
en
t &
To
dd
ler
Ch
ildre
n &
Yo
uth
Un
ifo
rme
d
Org
anis
atio
ns
We
llbe
ing
& S
po
rt
Art
s &
Mu
sic
Caf
e &
Lu
nch
eo
n
Gro
up
s
Sho
ps
& S
talls
Oth
er
un
clas
sifi
ed
Tota
l
1 Synod Cymru 0 0 0 0 0 10 0 0 0 0 0 10 20
2 Wales Synod 2,190 390 140 1,860 1,160 1,450 900 120 580 6,570 70 2,090 17,510
5 Birmingham 2,640 440 20 2,600 2,160 2,030 2,760 590 760 2,090 110 5,920 22,120
6 Bolton and Rochdale 2,400 250 80 6,840 1,090 2,230 1,450 730 970 2,390 7,770 950 27,160
7 Bristol 3,190 860 100 2,380 1,960 4,540 980 140 370 8,000 460 3,500 26,480
9 Cumbria 1,030 90 100 220 680 900 550 110 240 380 40 750 5,100
10 Channel Isles 170 30 0 90 310 170 350 10 50 330 0 40 1,570
11 Chester & Stoke-on-Trent 2,170 690 10 1,520 1,630 2,420 760 100 860 2,490 60 1,280 14,000
12 Cornwall 2,190 180 20 1,850 810 1,620 120 660 740 1,810 1,000 4,120 15,120
13 Darlington 1,660 130 20 610 860 1,540 660 110 340 990 0 1,100 8,020
14 East Anglia 2,260 470 20 1,180 1,170 1,730 700 300 490 2,740 460 2,040 13,560
15 Isle of Man 340 0 0 30 150 360 30 0 20 30 0 200 1,170
16 Leeds 1,880 270 0 940 1,120 1,250 2,120 210 510 2,700 150 1,230 12,400
17 Lincoln & Grimsby 1,810 70 10 590 490 950 790 80 100 650 30 740 6,300
18 Liverpool 1,880 380 150 3,870 1,310 2,420 1,270 500 720 3,270 5,070 1,920 22,740
19 Manchester & Stockport 4,840 490 360 5,120 3,690 3,320 2,610 1,890 1,720 5,950 1,050 940 31,980
20 Newcastle upon Tyne 2,790 300 860 780 1,170 1,690 1,630 470 1,100 2,710 30 1,310 14,830
21 Lancashire 2,400 580 60 2,510 910 1,400 1,330 190 770 2,640 470 2,000 15,260
22 Nottingham & Derby 2,890 580 20 1,430 2,030 2,550 1,630 140 890 3,280 5,020 4,260 24,720
23 Northampton 3,550 330 30 4,700 2,060 2,570 1,960 430 750 3,190 10,030 4,120 33,740
24 Plymouth & Exeter 2,120 470 50 1,480 2,020 2,010 740 210 410 3,820 290 3,810 17,450

25 Sheffield 2,730 230 70 2,300 1,210 2,710 1,660 430 860 4,700 1,540 1,600 20,030
26 Southampton 3,250 460 10 3,680 2,380 3,940 1,280 370 1,250 3,370 400 7,590 27,980
27 West Yorkshire 2,110 390 100 1,720 1,020 2,440 1,660 230 340 3,560 1,050 1,710 16,310
28 Wolverhampton & Shrewsbury 3,080 100 110 890 1,290 1,320 2,080 320 390 1,580 110 2,840 14,120
29 York & Hull 2,540 310 420 1,170 1,220 1,710 1,850 150 400 8,280 10 2,000 20,050
31 Scotland 390 60 10 440 90 500 450 20 40 480 0 340 2,830
32 Shetland 50 10 0 0 20 50 0 0 10 120 0 10 270
34 Bedfordshire, Essex & Hertfordshire 3,760 430 1,230 5,450 3,160 2,850 2,820 350 670 2,770 290 3,320 27,110
35 London 5,070 580 210 7,830 3,840 4,170 4,080 800 740 2,120 900 8,110 38,440
36 South East 3,690 1,000 60 1,990 3,470 2,600 2,560 420 780 2,290 0 5,010 23,870
Connexion 71,060 10,590 4,250 66,080 44,480 59,490 41,780 10,070 17,890 85,290 36,410 74,880 522,270
Note: Activity-breakdown figures in some rows may not sum to total because of rounding

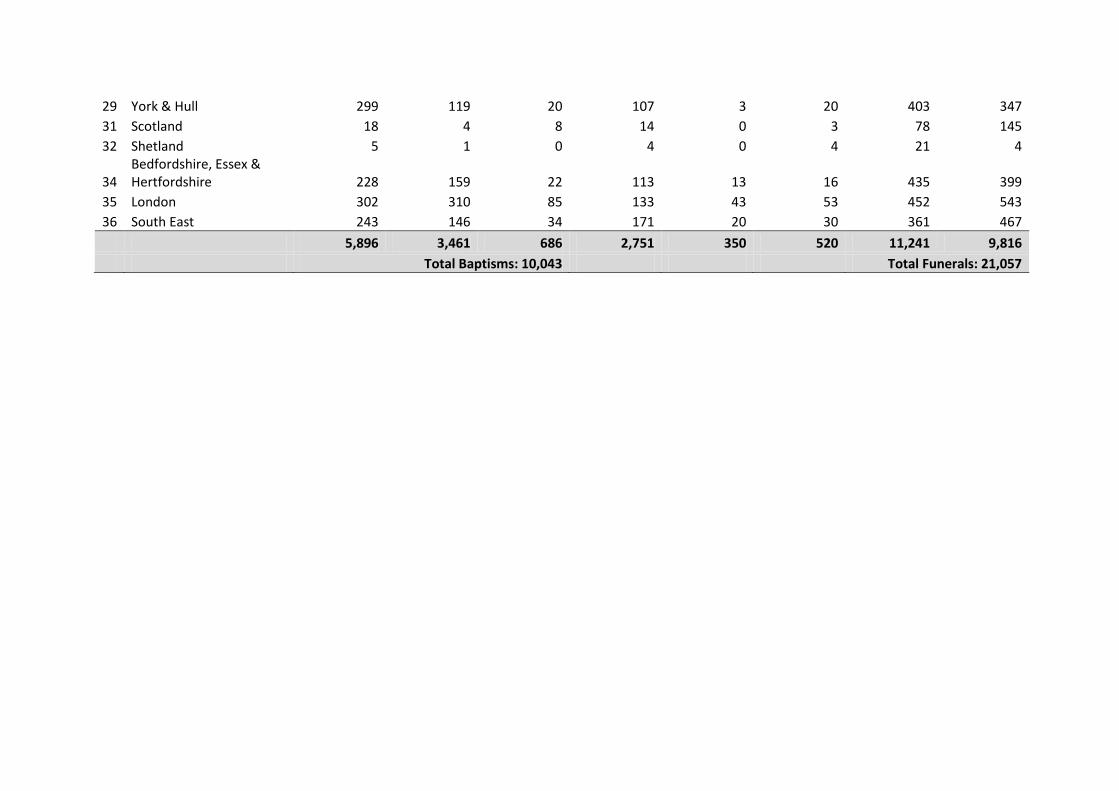
D. Baptisms, Weddings and Funerals: Year to 31 October 2013
Baptisms Marriage Celebrations Funerals
Infant 1 to 12 13 or older Weddings Blessings Thanksgivings In Church Elsewhere
1 Synod Cymru 14 9 0 29 0 0 69 13
2 Wales Synod 154 134 17 104 4 7 515 611
5 Birmingham 222 139 18 93 21 8 350 375
6 Bolton and Rochdale 133 83 16 41 8 21 225 190
7 Bristol 184 130 27 106 11 13 444 338
9 Cumbria 81 32 1 26 4 5 182 109
10 Channel Isles 9 11 2 15 2 4 63 75
11 Chester & Stoke-on-Trent 266 142 28 102 15 22 594 406
12 Cornwall 170 53 11 91 9 14 439 174
13 Darlington 307 318 11 88 9 2 514 466
14 East Anglia 219 136 26 159 16 24 435 409
15 Isle of Man 28 9 1 12 0 0 50 102
16 Leeds 160 103 18 57 12 10 346 254
17 Lincoln & Grimsby 157 54 18 72 8 5 309 253
18 Liverpool 208 116 20 81 17 6 355 271
19 Manchester & Stockport 241 84 10 64 7 12 425 298
20 Newcastle upon Tyne 464 221 32 165 7 39 559 478
21 Lancashire 148 70 19 78 15 20 314 299
22 Nottingham & Derby 204 115 48 105 13 8 538 393
23 Northampton 291 177 62 210 25 60 606 454
24 Plymouth & Exeter 155 89 29 85 9 13 365 278
25 Sheffield 300 170 48 112 22 26 471 394
26 Southampton 181 81 21 117 19 41 396 388
27 West Yorkshire 176 67 10 87 7 14 363 286
28 Wolverhampton & Shrewsbury 329 179 24 110 11 20 564 597
29 York & Hull 299 119 20 107 3 20 403 347
31 Scotland 18 4 8 14 0 3 78 145
32 Shetland 5 1 0 4 0 4 21 4
34 Bedfordshire, Essex & Hertfordshire 228 159 22 113 13 16 435 399
35 London 302 310 85 133 43 53 452 543
36 South East 243 146 34 171 20 30 361 467
5,896 3,461 686 2,751 350 520 11,241 9,816
Total Baptisms: 10,043 Total Funerals: 21,057

Appendix 2: Local Ecumenical Partnerships (LEPs)
For the 2013 annual returns round, 508 out of 4,812 Methodist churches (10.6%) were reportedly in
Local Ecumenical Partnerships. 58 were where Methodist churches had entered into Churches in
Covenanted Partnerships and 450 were Single Congregation LEPs.
Where a Single Congregation LEP has been formally constituted, invitation to membership of the
Methodist Church is often extended to all who are duly recognised as members of the other partner
churches. However, many churches report Methodist membership as comprising those who were
Methodists before the church entered into ecumenical partnership, or transferred to the church as
Methodists from another congregation.
Recognising that invitation to membership is in many instances extended by all participating
denominations in an ecumenical partnership, some or all members of an LEP may be accounted as
belonging to these denominations jointly rather than only to any single one.
Statistics for Mission reports Methodist membership on the basis of each individual church’s return,
without attempting to apportion total membership between respective denominations. On this
basis, the 9,211 Methodists in single congregation LEPs constitute 4.4% of total Methodist
membership. Attendance figures are reported in total. Average weekly attendance of 30,910
constitutes 13.8% of that across Methodist churches. Table 7 refers.

TABLE 7: Membership and Attendance in Single Congregation Local Ecumenical Partnerships (2013)
Number of Churches
Membership Average Weekly Attendance Methodist Baptist CofE URC Other Joint
82 - - - - - 6,781 6,303
64 3,435 - - 1,691 - - 4,219
63 2,078 - - 858 - 2,122 4,240
63 815 - 2,812 - - - 3,159
39 472 - 1,606 - - 1,189 3,878
12 369 - - 225 120 - 730
10 152 - 279 - 172 - 546
10 142 94 462 19 180 - 1,456
9 192 42 237 - 121 - 505
8 218 - - - 179 - 341
8 192 - 181 41 - 275 721
7 142 - 235 111 - - 370
6 101 - - - - 510 452
5 41 43 - - 188 - 196
4 154 89 - - - - 237
4 106 75 - 108 - - 273
4 74 41 - 55 - 99 254
4 67 74 119 60 - - 329
4 41 - 96 18 43 265 489
3 52 10 169 - 12 81 347
3 51 32 209 24 - 66 333
3 41 19 200 9 34 30 269
3 22 23 17 - - 117 191
2 70 30 - - - 81 173
2 41 - - 53 53 12 155
2 33 - - - 15 19 54
2 19 24 134 - - - 127
2 13 - 29 - 4 55 114
23* 78 18 120 167 30 169 454
450 9,211 614 6,905 3,439 1,151 11,871 30,912
Total Single Congregation LEP Membership: 33,191
*In combinations other than those listed above