367,000 ha forest burned impact of the 2015 fire crisis … · forest hp/hpt/hpk and 14% on...
TRANSCRIPT
1
2.6 million ha burned area in 2015
2.6 million ha burned area in 2015
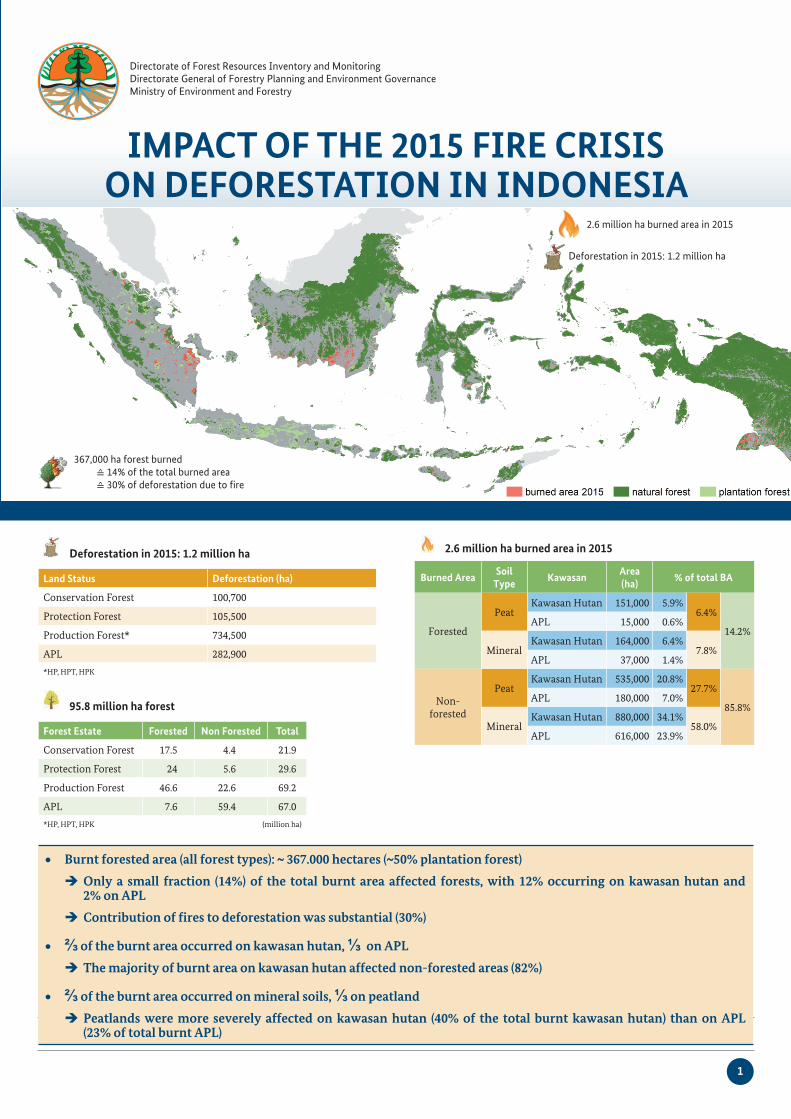
Deforestation in 2015: 1.2 million ha
367,000 ha forest burned ≙ 14% of the total burned area ≙ 30% of deforestation due to fire
deforestasi di tahun 2015: 1,2 juta ha
2,6 juta ha areal terbakar di tahun 2015 367,000 ha areal berhutan terbakar ≙ 14% dari total areal terbakar ≙ 30% dari deforestasi akibat kebakaran
367,000 ha forest burned ≙ 14% of the total burned area ≙ 30% of deforestation due to fire
2.6 million ha burned area in 2015
Deforestation in 2015: 1.2 million ha
367,000 ha forest burned ≙ 14% of the total burned area ≙ 30% of deforestation due to fire
deforestasi di tahun 2015: 1,2 juta ha
2,6 juta ha areal terbakar di tahun 2015 367,000 ha areal berhutan terbakar ≙ 14% dari total areal terbakar ≙ 30% dari deforestasi akibat kebakaran
Deforestation in 2015: 1.2 million ha
2.6 million ha burned area in 2015
Burned AreaSoil
TypeKawasan
Area (ha)
% of total BA
Forested
PeatKawasan Hutan 151,000 5.9%
6.4%
14.2%APL 15,000 0.6%
MineralKawasan Hutan 164,000 6.4%
7.8%APL 37,000 1.4%
Non-forested
PeatKawasan Hutan 535,000 20.8%
27.7%
85.8%APL 180,000 7.0%
MineralKawasan Hutan 880,000 34.1%
58.0%APL 616,000 23.9%
Deforestation in 2015: 1.2 million ha
Land Status Deforestation (ha)
Conservation Forest 100,700
Protection Forest 105,500
Production Forest* 734,500
APL 282,900
*HP, HPT, HPK
95.8 million ha forest
Forest Estate Forested Non Forested Total
Conservation Forest 17.5 4.4 21.9
Protection Forest 24 5.6 29.6
Production Forest 46.6 22.6 69.2
APL 7.6 59.4 67.0
*HP, HPT, HPK (million ha)
• Burnt forested area (all forest types): ~ 367.000 hectares (~50% plantation forest)
Only a small fraction (14%) of the total burnt area affected forests, with 12% occurring on kawasan hutan and 2% on APL
Contribution of fires to deforestation was substantial (30%)
• ⅔ of the burnt area occurred on kawasan hutan, ⅓ on APL
The majority of burnt area on kawasan hutan affected non-forested areas (82%)
• ⅔ of the burnt area occurred on mineral soils, ⅓ on peatland
Peatlands were more severely affected on kawasan hutan (40% of the total burnt kawasan hutan) than on APL (23% of total burnt APL)
IMPACT OF THE 2015 FIRE CRISIS ON DEFORESTATION IN INDONESIA
Directorate of Forest Resources Inventory and MonitoringDirectorate General of Forestry Planning and Environment GovernanceMinistry of Environment and Forestry

2
Impact of The 2015 Fire Crisis on Deforestation in Indonesia
Impact of Fires on ForestsThe large fire events in 2015 raged on almost 2.6 million hectares of land throughout Indonesia. 86% of the burnt area affected non-forested land and only 14% forested land (natural and plantation forests). 32% of the burnt non-forested areas affected peatland, while for burnt forested areas the proportion of affected peat soil amounts to 45%. Overall, 34% of the burnt area occurred on peatland. Thus, even though the overall impact of the fires on the carbon-rich land cover type of forest is rather low (14%), they still caused high carbon emissions due to burning of peat as shown in a publication by DGCC (“Understanding Estimation of Emission from Land and Forest Fires in Indonesia 2015”).
The overall impact of 14% of the 2015 fires on forested land affected natural forests and plantation forests equally (7% each). While on most islands natural forests were more affected, in Java and Sumatra mainly plantation forests were burnt (43% of burnt area on forested areas with 10% natural forests and 33% plantation forests, and 22% with 6% natural forests and 16% plantation forests respectively) (see Figure 1).
Figure 1: Impact of fires on forests per island
92% of all burnt area occurred in only 10 provinces, with 4 of them being located in Sumatra (39% of the total burnt area), 4 in Kalimantan (36%), 1 in Papua (14%) and 1 in Bali Nusatenggara (3%). The proportion of burnt forested areas (all forest types), however, of the total burnt area is in 8 out of those 10 provinces less than
20%, and also amounts in the remaining two provinces (East Kalimantan and South Sumatra) to only 21 and 26% respectively.
Out of the 10 provinces with the highest proportion of burnt forests of the total burnt area, 7 have actually only a small extent of total burnt area (< 10,000 ha), namely Yogyakarta (22 ha burnt area, 100% forest), Sumatra Utara (5,900 ha, 58% forest), Jawa Barat (2,800 ha, 51% forest), Jawa Tengah (2,100 ha, 50% forest), Jawa Timur (8,100 ha, 39%), Sumatra Barat (3,900 ha, 37% forest), and Aceh (900 ha, 33% forest).
Provinces in Sumatra and Java experienced forest fires largely in plantation forests - South Sumatra, for example, shows a particularly wide difference between natural and plantation forests where only 10% of the total burnt forest in the province affected natural forests – while on the other islands predomininantly natural forests have burnt.
These figures suggest that even though generally forests were not the core area of the 2015 fire events, there were provinces which failed to prevent and/or control fires particularly on forested land. This seems to be particularly the case for plantation forests in Java: if only natural forests are considered the proportions of burnt forest drop considerably for Yogyakarta (no natural forest burnt), Jawa Tengah (3% of the total burnt area natural forest), Jawa Barat (11%) and Jawa Timur (11%).
Contribution of Fires to DeforestationThe total gross deforestation rate in the period 2014-2015 amounts to roughly 1.2 million hectares (about 62% natural forests and 38% plantation forests). 77% of the total deforestation occurred on Kawasan Hutan. The 10 provinces with the highest deforestation rates amount together to 86% of the total gross deforestation. 4 of these 10 provinces are located in Sumatra (46%), 4 in Kalimantan (33%), 1 in Papua (6%) and 1 in Sulawesi (2%).
30% of the total deforestation can be attributed to fires (roughly 367,000 ha; with 50% plantation forests) of which 86% (315,000 ha) occurred on Kawasan Hutan. Varations among provinces, though, are again high and range from 1% contribution of fires to deforestation (NTB) to 73% (Jambi). Sumatra Selatan is the province with the largest burnt area (640,000 ha) as well as with the highest deforestation rate (336,000 ha) of which 49%

3
Impact of The 2015 Fire Crisis on Deforestation in Indonesia
(164,000 ha) were fire related, followed by Kalimatan Tengah with the second largest burnt area of 577,000 ha and second highest deforestation rate of 189,000 ha of which 56,000 ha (30%) were fire-related (see Figure 2).
Figure 2: 10 provinces with the highest deforestation rate in 2014-15 and respective contribtion of fires
There are several provinces which have a low deforestation rate (< 10,000 ha) but with a high proportion of fire-related deforestation (> 20%), namely Maluku (4,900 ha deforested, 67% fire-related), Yogyakarta (52 ha, 42% fire-related), Jawa Timur (7,700 ha, 41% fire-related), Bali (78 ha, 29% fire-related), Sulawesi Tenggara (7,100 ha, 26% fire-related), Jawa Barat (6,000 ha, 24% fire-related), and Jawa Tengah (5,200 ha, 21% fire-related).
Remarkably, 45% of all fire-related deforestation in Indonesia in 2014-15 occurred in just one province, i.e. Sumatra Selatan (164,200 ha), followed by Kalimantan Tengah (15% or 56,200 ha) and Riau (8% or 29,500 ha).
A total of 38% (460,000 ha) of the deforestation occurred on peatland, of which 36% was caused by fires (166,000 ha) which is about 45% of the total burnt forest. 151,000 (91%) out of these 166,000 ha of burnt forested peatland were located on Kawasan Hutan (77% on production forest HP/HPT/HPK and 14% on conservation and protection forest HK/HL). Figure 3 illustrates the spatial overlaps between deforested and burnt areas.
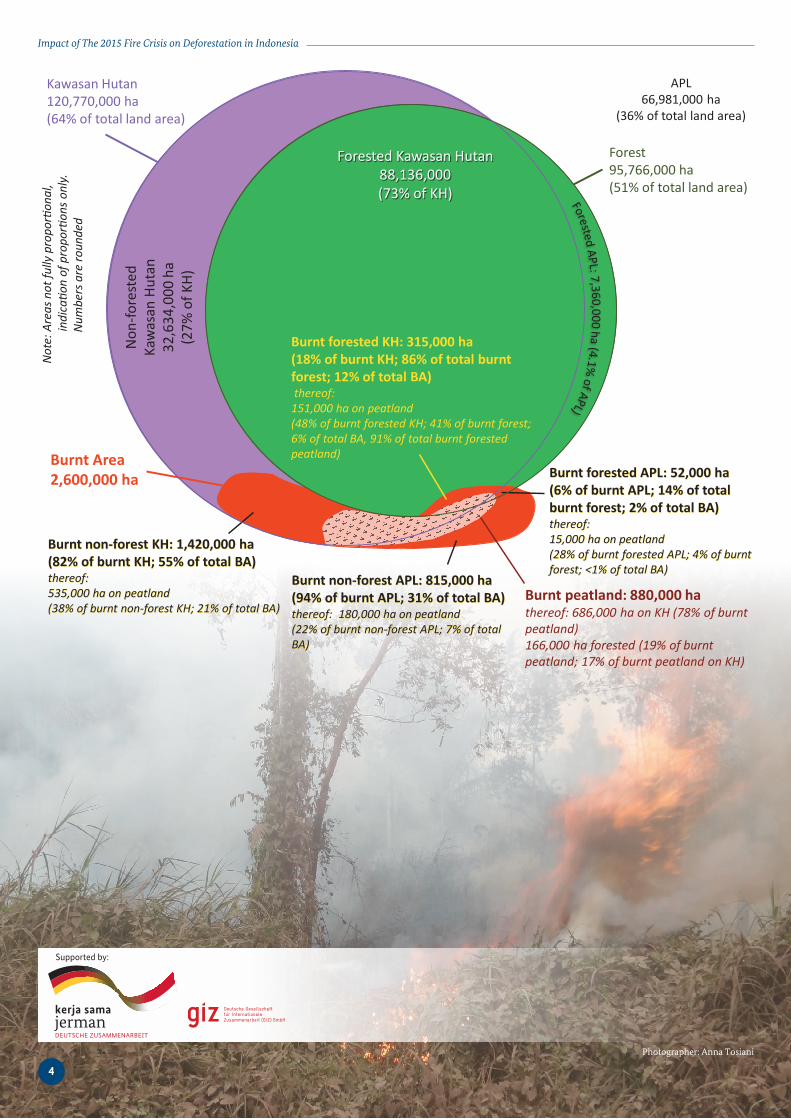
Fire Impact on Kawasan Hutan and PeatlandsOverall, fires occurred more often on Kawasan Hutan than on APL (67% and 33% respectively) and more often on mineral soils than on peatland (66% and 34% respectively). 78% of the total burned peat area occurred on kawasan hutan (with 52% on production forest HP/HPT/HPK and 26% on protection and conservation forest HL/HK) but the majority of it was not forested prior to the fire occurrence (81%). Only 17% of the burned peatland on kawasan hutan affected forests, i.e. only 9% of the total burned kawasan hutan occurred on forested peatland. Figure 4 gives an overview of the spatial overlaps of Kawasan Hutan, forest cover, burnt area and peatland.
DisclaimerThe burnt areas derived from Landsat data have only been partially validated in the field and is thus be afflicted with unquantified uncertainty. Besides, it cannot be ruled out that areas here labeled as ‘deforested due to fire’ may in fact have been already deforested prior to the fire event and the identified burning has happened on an already clear-cut area.
Deforestation 2014-15 1,210,000 ha
burnt area 2015 2,600,000 ha
bu
rnt
fore
st
36
7,0
00
ha
forested land (~51% of land area)
other land cover (~49%)
of total burnt area: 14% | 86%
of total deforestation: 70% | 30%
deforestation on peatland: 460,000 ha (38% of total deforestation)
peatland
peatland
burnt forest on peatland: 166,000 ha (45% of burnt forests)
burnt non-forested peatland: 715,000 ha (32% of total burnt area)
Note: Areas not fully proportional, indication of proportions only. Numbers are rounded
Figure 3: Deforestation and burnt area 2015
DataThe Directorate of Forest Resources Inventory and Monitoring (IPSDH) of the Ministry of Environment and Forestry (KLHK) provides annual updates of Indonesia’s land cover as well as on burnt areas. These official data sets were used to spatially analyse the impact of the 2015 fire crisis on Indonesian forests, forest land and peatland.
Photographer: Anna Tosiani
4
Impact of The 2015 Fire Crisis on Deforestation in Indonesia
Supported by:
APL 66,981,000 ha
(36% of total land area)
Kawasan Hutan 120,770,000 ha (64% of total land area)
Forest 95,766,000 ha (51% of total land area)
Forested Kawasan Hutan 88,136,000 (73% of KH)
Non
-fore
sted
Ka
was
an H
utan
32
,634
,000
ha
(27%
of K
H)
Burnt Area 2,600,000 ha
Burnt non-forest KH: 1,420,000 ha (82% of burnt KH; 55% of total BA) thereof: 535,000 ha on peatland (38% of burnt non-forest KH; 21% of total BA)
Burnt non-forest APL: 815,000 ha (94% of burnt APL; 31% of total BA) thereof: 180,000 ha on peatland (22% of burnt non-forest APL; 7% of total BA)
Burnt forested KH: 315,000 ha (18% of burnt KH; 86% of total burnt forest; 12% of total BA) thereof: 151,000 ha on peatland (48% of burnt forested KH; 41% of burnt forest; 6% of total BA, 91% of total burnt forested peatland)
Burnt forested APL: 52,000 ha (6% of burnt APL; 14% of total burnt forest; 2% of total BA) thereof: 15,000 ha on peatland (28% of burnt forested APL; 4% of burnt forest; <1% of total BA)
Not
e: A
reas
not
fully
pro
porti
onal
,
ind
icati
on o
f pro
porti
ons o
nly.
Num
bers
are
roun
ded
Burnt peatland: 880,000 ha thereof: 686,000 ha on KH (78% of burnt peatland) 166,000 ha forested (19% of burnt peatland; 17% of burnt peatland on KH)