36 blast - dominos.gcs-web.com
TRANSCRIPT

36 Blast Domino’s Investor Day • January 14, 2016 • Orlando, FL

Investor Day 2016 “36 Blast” 2
Legal Stuff
This presentation and our accompanying comments include “forward-looking statements.”
These statements may relate to future events or our future financial performance and are subject to known and unknown risks,
uncertainties and other factors that may cause our actual results, levels of activity, performance or achievements to differ
materially from those expressed or implied by these forward-looking statements. This presentation and our accompanying
comments do not purport to identify the risks inherent in an investment in Domino’s Pizza and factors that could cause actual
results to differ materially from those expressed or implied in the forward-looking statements. These risks include but are not
limited to those risk factors identified in Domino’s Pizza, Inc.’s Annual Report on Form 10-K for the fiscal year ended
December 28, 2014, as well as other SEC reports filed by Domino’s Pizza, Inc. from time to time. Although we believe that the
expectations reflected in the forward-looking statements are based upon reasonable estimates and assumptions, we cannot
guarantee future results, levels of activity, performance or achievements. We caution you not to place undue reliance on
forward-looking statements, which reflect our estimates and assumptions and speak only as of the date of this presentation
and you should not rely on such statements as representing the views of the Company as of any subsequent date. We
undertake no obligation to update the forward-looking statements to reflect subsequent events or circumstances. In light of the
above, you are urged to review the disclosures contained in the Domino’s Pizza, Inc. SEC reports, including the risk factors
contained therein.
This presentation contains trade names, trademarks and service marks of other companies. We do not intend our use or
display of other parties’ trade names, trademarks and service marks to imply a relationship with, or endorsement or
sponsorship of, these other parties.

Investor Day 2016 “36 Blast” 3
• Patrick Doyle, CEO
• Ritch Allison, President, Domino’s International
• Russell Weiner, President, Domino’s USA
• Jeff Lawrence, CFO
Today’s Line Up

Patrick Doyle CEO

Investor Day 2016 “36 Blast” 5
1. What has driven Domino’s success to date?
2. Can the success continue?
3. Can the success drive shareholder value?
Three Questions Asked a Year Ago…

Investor Day 2016 “36 Blast” 6
Not a thing.
Our steady strategy continues to deliver.
What’s Changed?
Investor Day 2016 “36 Blast” 7
• Relentless focus on permanent improvements
• Big, bold ideas
Steady Strategy

Investor Day 2016 “36 Blast” 8
Not always newsworthy, but builds brand strength for the long term
• Constant improvement of the customer experience - In-store execution
- Technology investments, access to the brand
- Better food
- Consistent value pricing
- Improved store image
• Better today; will be better two years from now - “Work-in-progress brand”
Relentless Focus on Improvement

Investor Day 2016 “36 Blast” 9
• Better operations every day
- No time wasted on “product of the month”
• More profitable franchisees, increased store growth
• Attracting capital and operators to the brand
- South Africa, France and Germany conversions
Relentless Focus on Improvement

Investor Day 2016 “36 Blast” 10
Generate broad attention to the brand all across the globe
Big, Bold Ideas
• Produce breakthrough advertising and communication
• Breed a culture that embraces
bold thinking
- Attract the best talent

Investor Day 2016 “36 Blast” 11
• Innovation beyond the menu
- Unique digital platforms
• Voice ordering
• Tweet-to-order
• Ford SYNC
• Smart TV and smartwatches
Big, Bold Ideas

Investor Day 2016 “36 Blast” 12
• DXP Delivery Vehicle
- Nearly one billion media impressions
• Going Bold Globally
- Pizza Mogul and GPS Driver Tracker in Australia
- Opened in the birthplace of pizza!
Big, Bold Ideas

Investor Day 2016 “36 Blast” 13
Italy Video
Investor Day 2016 “36 Blast” 14
36 Blast

Investor Day 2016 “36 Blast” 15
36 Blast

Ritch Allison President, Domino’s International

Investor Day 2016 “36 Blast” 17
BEST
INTERNATIONAL
MODEL IN QSR
KEY INITIATIVES
FOR 2016
SIGNIFICANT
GROWTH
OPPORTUNITY
- Master Franchise Model
- 2015 Highlights
- Robust Growth
- Diversified Portfolio
- Attractive Market
- Runway for Growth
- Key Conversions
- Technology and Global Online
Ordering (GOLO)
- Pizza Theater Reimage
Executive Summary

Investor Day 2016 “36 Blast” 18
BEST
INTERNATIONAL
MODEL IN QSR
- Master Franchise Model
- 2015 Highlights
- Robust Growth
KEY INITIATIVES
FOR 2016
SIGNIFICANT
GROWTH
OPPORTUNITY
- Diversified Portfolio
- Attractive Market
- Runway for Growth
- Key Conversions
- Technology and Global Online
Ordering (GOLO)
- Pizza Theater Reimage
Executive Summary
Investor Day 2016 “36 Blast” 19
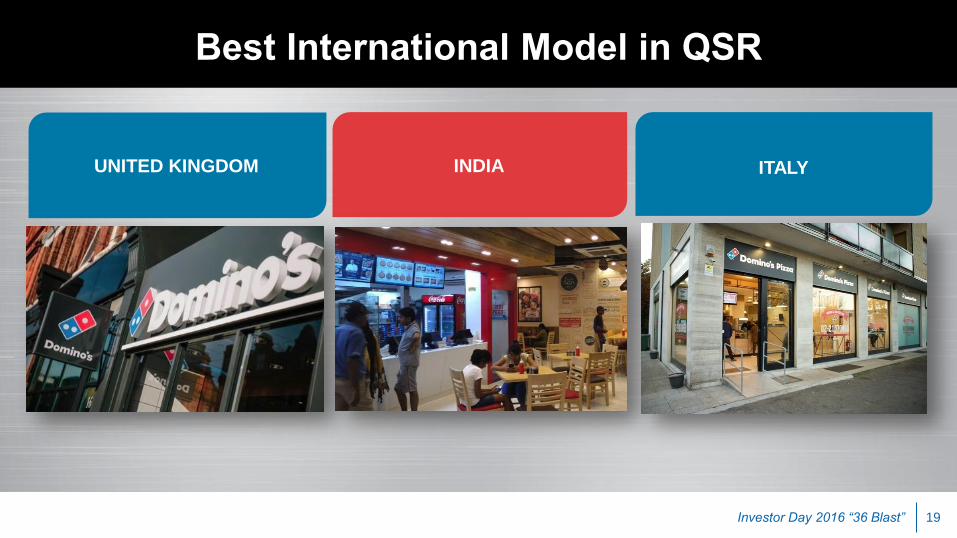
Best International Model in QSR
UNITED KINGDOM INDIA ITALY

Investor Day 2016 “36 Blast” 20
2015 Highlights
Q1
Q2
Q3
Q4
- Georgia
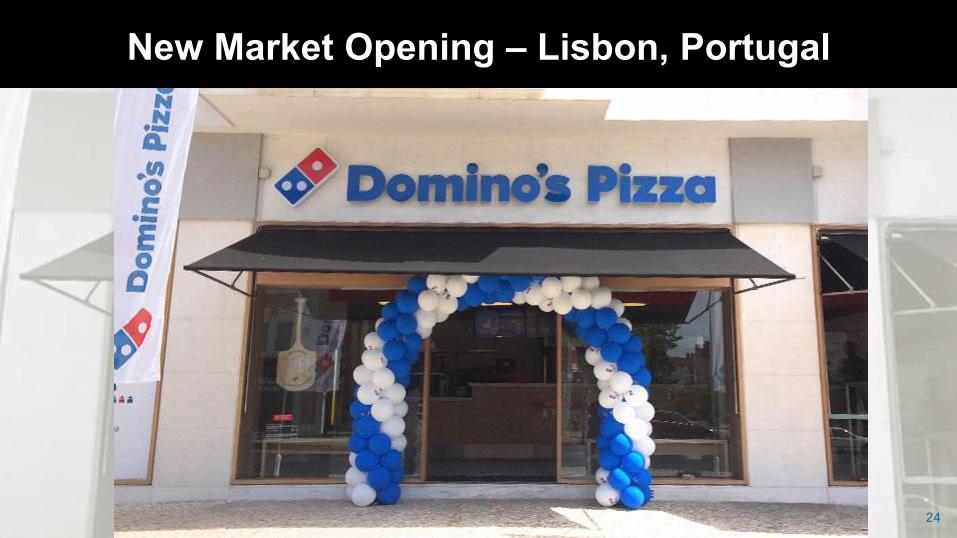
- Portugal
- Domino’s: 12,000th store
- Domino’s: 7,000th international store
- India: 900th store
- Italy
- Belarus
- Azerbaijan
- Cambodia
Best International Model in QSR

21
New Market Opening – Baku, Azerbaijan
21

22
New Market Opening – Phnom Penh, Cambodia
22

23
New Market Opening – Tbilisi, Georgia
24
New Market Opening – Lisbon, Portugal
24

25
New Market Opening – Milan, Italy
25

26 26
New Market Opening – Minsk, Belarus
26

Investor Day 2016 “36 Blast” 27
Best International Model in QSR
$2,531
$2,952
$3,519
$3,861
$4,252
$4,800
$0
$500
$1,000
$1,500
$2,000
$2,500
$3,000
$3,500
$4,000
$4,500
$5,000
2009 2010 2011 2012 2013 2014
Five-Year Sales CAGR of 13.7%
Retail Sales (millions) Q3 2015 TTM Retail Sales
$4.9B

Investor Day 2016 “36 Blast” 28
4,072 4,422
4,835
5,327
5,900
6,562 7,007
346 350
413
492
573
662
742
0
100
200
300
400
500
600
700
800
900
0
1,000
2,000
3,000
4,000
5,000
6,000
7,000
8,000
2009 2010 2011 2012 2013 2014 Q3 2015
Store Count
Net Growth
Pace of Store Count Growth Has Accelerated
CAGR 2009 –
Q3 2015
10.0%
Best International Model in QSR

Investor Day 2016 “36 Blast” 29
74 113
137 183 181
201 175
257
454
519
632 605
350
413
492
573
662
742
0
100
200
300
400
500
600
700
800
2010 2011 2012 2013 2014 Q3'15 TTM
Papa John's
Pizza Hut
Domino's
Store Growth Exceeds Top Two Competitors
*From public filings – Pizza Hut includes China casual dining, excludes licensees
Best International Model in QSR

Investor Day 2016 “36 Blast” 30
SIGNIFICANT
GROWTH
OPPORTUNITY
- Diversified Portfolio
- Attractive Market
- Runway for Growth
BEST
INTERNATIONAL
MODEL IN QSR
KEY INITIATIVES
FOR 2016
- Master Franchise Model
- 2015 Highlights
- Robust Growth
- Key Conversions
- Technology and Global Online
Ordering (GOLO)
- Pizza Theater Reimage

Investor Day 2016 “36 Blast” 31 Developed and emerging markets as defined by the World Bank
Two-Year Net Store Growth Through Q3 2015
Developed
Emerging
64%
+879 Stores
36%
+501 Stores
Significant Growth Opportunity Growing Store Base in Developed and Emerging Markets

Investor Day 2016 “36 Blast” 32
• International market for total pizza expected to grow at 3-4% CAGR
- From $97 billion to ~$117 billion by 2020
• International DelCo market is forecasted to grow at 4-5% CAGR
- From $31 billion to ~$40 billion by 2020
International Pizza Market
Almost $100B and Growing
Sources: Third-party research, NPD Crest, Domino’s consultants and franchisee input
Significant Growth Opportunity
Investor Day 2016 “36 Blast” 33
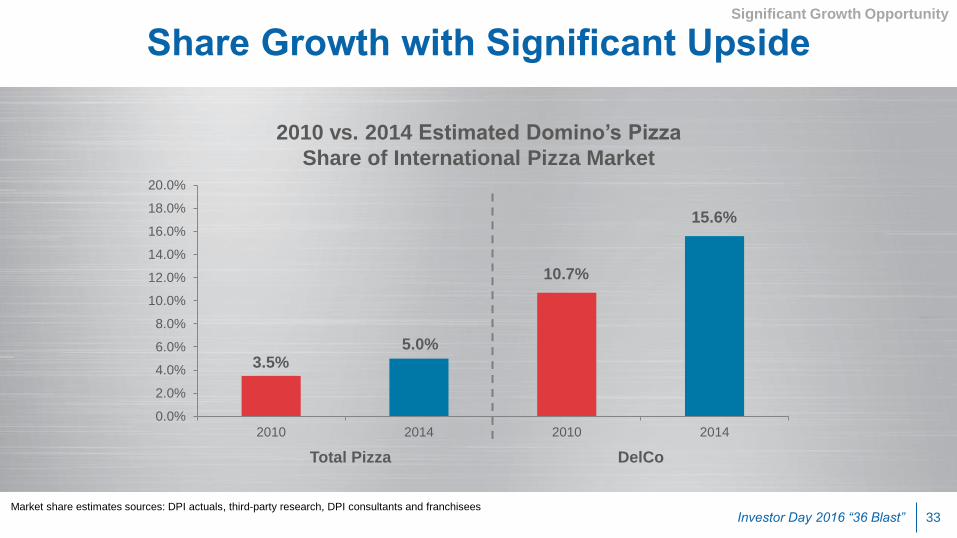
Share Growth with Significant Upside
2010 vs. 2014 Estimated Domino’s Pizza
Share of International Pizza Market
Market share estimates sources: DPI actuals, third-party research, DPI consultants and franchisees
3.5% 5.0%
10.7%
15.6%
0.0%
2.0%
4.0%
6.0%
8.0%
10.0%
12.0%
14.0%
16.0%
18.0%
20.0%
2010 2014 2010 2014
Significant Growth Opportunity
Total Pizza DelCo

Investor Day 2016 “36 Blast” 34
Runway for Growth in Our Largest Markets
Delivery market position and potential store count based on Company and master franchisee estimates.
*Mexico and Spain store count as of October 28, 2015 (Q3’15). Australia/New Zealand, Japan, Netherlands, and France store count as of June 28, 2015.
India store count as of June 30, 2015 (Q2’16). United Kingdom store count as of June 28, 2015. All other countries based on DPZ’s Q3 2015 reported store count.
#1 or #2 Pizza Delivery Market Position in Top 15 Markets
Potential for Additional 4,300 Stores in Top 15 Markets Alone
Developed Markets Emerging Markets
Top
Markets
Last Disclosed
Store Count*
Potential
Store
Count
India 950 1,800
Mexico 610 700
Turkey 457 700
Saudi Arabia 154 250
Malaysia 142 350
Brazil 129 500
TOTAL 2,442
4,300
Top
Markets
Last Disclosed
Store Count*
Potential
Store
Count
United Kingdom /
Ireland 881 1,200
Australia / New
Zealand 653 900
South Korea 415 500
Japan 384 850
Canada 384 650
France 250 1,000
Netherlands 170 300
Spain 153 350
Taiwan 130 150
TOTAL 3,420
5,900
Significant Growth Opportunity

Investor Day 2016 “36 Blast” 35
Opportunity to Grow in Many Untapped or Underpenetrated Markets

Investor Day 2016 “36 Blast” 36
KEY INITIATIVES
FOR 2016
BEST
INTERNATIONAL
MODEL IN QSR
SIGNIFICANT
GROWTH
OPPORTUNITY
- Master Franchise Model
- 2015 Highlights
- Robust Growth
- Diversified Portfolio
- Attractive Market
- Runway for Growth
- Key Conversions
- Technology and Global Online
Ordering (GOLO)
- Pizza Theater Reimage

Investor Day 2016 “36 Blast” 37
Driving Successful Conversions
SOUTH AFRICA FRANCE GERMANY
Converted 50+ Scooters Pizza
stores as of Q3’15
Conversion of Pizza Sprint
stores to begin in 2016
Conversion of Joey’s Pizza
stores to begin in 2016
Key Initiatives for 2016

Investor Day 2016 “36 Blast” 38
• Nearly 45% average for online ordering sales
across all international markets
• Nine markets have digital sales over 50%
• Opportunities
- Many large markets working to increase their
online ordering percentages
- Some markets still do not have online ordering
- Others that have online still do not have mobile
capability
Technology Expanding Globally Key Initiatives for 2016
As of Q3 2015

Investor Day 2016 “36 Blast” 39
Continue International POS Deployment
2011
59%
11%
30%
Q3 2015
36%
21%
43%
Domino's PulseInstalled
AgreementsSigned
Other
% of International Stores
Key Initiatives for 2016
Investor Day 2016 “36 Blast” 40
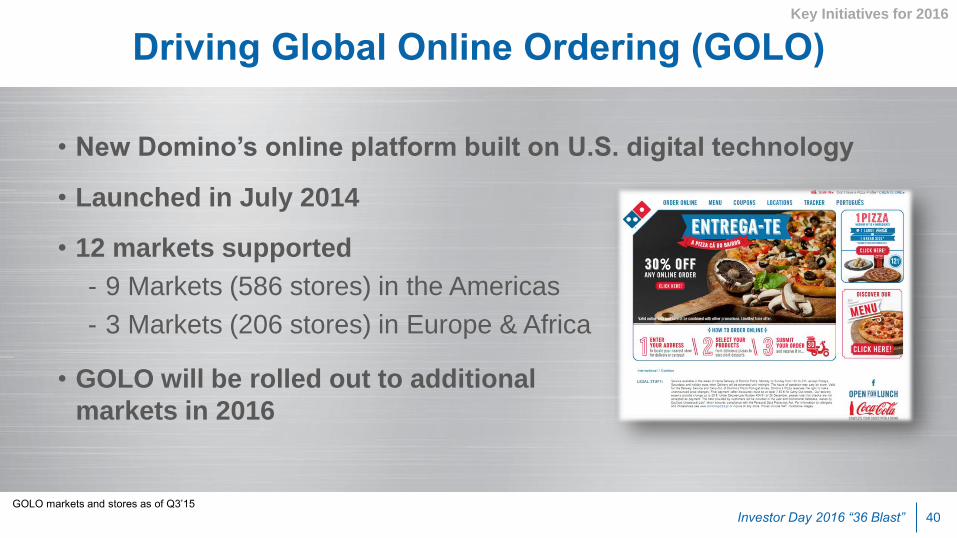
• New Domino’s online platform built on U.S. digital technology
• Launched in July 2014
• 12 markets supported
- 9 Markets (586 stores) in the Americas
- 3 Markets (206 stores) in Europe & Africa
• GOLO will be rolled out to additional
markets in 2016
Driving Global Online Ordering (GOLO)
GOLO markets and stores as of Q3’15
Key Initiatives for 2016

Investor Day 2016 “36 Blast” 41
Pizza Theater Transformation
• As of Q3 2015
- Approximately 3,300 international
stores in new image
• Plans for 2016
- Reimage approximately 800 more
existing stores in new image
• Substantially complete by end of 2017
Key Initiatives for 2016

Investor Day 2016 “36 Blast” 42
Australia Reimage Stores Reimaging Across the Globe

Investor Day 2016 “36 Blast” 43
South Korea Reimage Stores Reimaging Across the Globe

Investor Day 2016 “36 Blast” 44
Mexico Reimage Stores Reimaging Across the Globe

Investor Day 2016 “36 Blast” 45
Canada Relocation Stores Reimaging Across the Globe

Investor Day 2016 “36 Blast” 46
BEST
INTERNATIONAL
MODEL IN QSR
KEY INITIATIVES
FOR 2016
SIGNIFICANT
GROWTH
OPPORTUNITY
- Master Franchise Model
- 2015 Highlights
- Robust Growth
- Diversified Portfolio
- Attractive Market
- Runway for Growth
- Key Conversions
- Technology and Global Online
Ordering (GOLO)
- Pizza Theater Reimage
Conclusion
Russell Weiner President, Domino’s USA

Investor Day 2016 “36 Blast” 48
Executive Summary
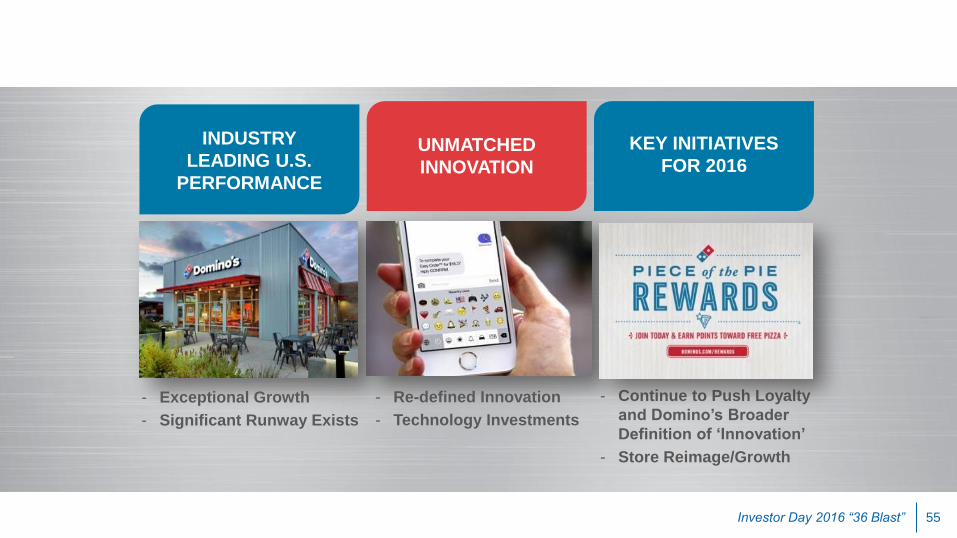
INDUSTRY
LEADING U.S.
PERFORMANCE
KEY INITIATIVES
FOR 2016 UNMATCHED
INNOVATION
- Re-defined Innovation
- Technology Investments
- Exceptional Growth
- Significant Runway Exists
- Continue to Push Loyalty
and Domino’s Broader
Definition of ‘Innovation’
- Store Reimage/Growth

Investor Day 2016 “36 Blast” 49
Executive Summary
INDUSTRY
LEADING U.S.
PERFORMANCE
- Exceptional Growth
- Significant Runway Exists
KEY INITIATIVES
FOR 2016 UNMATCHED
INNOVATION
- Re-defined Innovation
- Technology Investments
- Continue to Push Loyalty
and Domino’s Broader
Definition of ‘Innovation’
- Store Reimage/Growth
Investor Day 2016 “36 Blast” 50
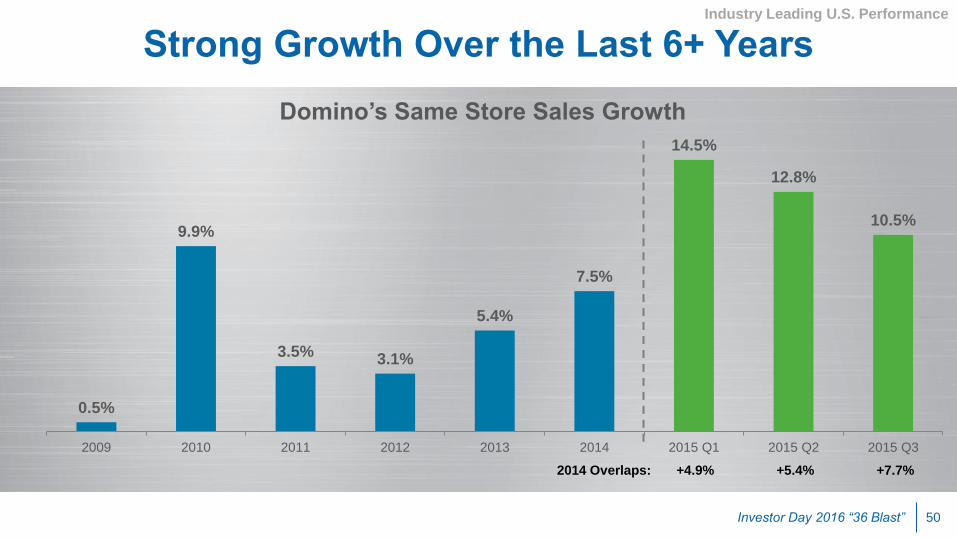
Strong Growth Over the Last 6+ Years
Domino’s Same Store Sales Growth
0.5%
9.9%
3.5% 3.1%
5.4%
7.5%
14.5%
12.8%
10.5%
2009 2010 2011 2012 2013 2014 2015 Q1 2015 Q2 2015 Q3
2014 Overlaps: +4.9% +5.4% +7.7%
Industry Leading U.S. Performance

Investor Day 2016 “36 Blast” 51
Clear Pizza Leader in Sales Growth
Source: The NPD Group/CREST®, Years Ending Sept. 2008 and 2015
Independents = QSR Pizza Independents, 1-2 units
44%
17%
-7% -3%
Pizza
Independents Small Pizza
Chains
QSR Pizza – 2015 vs. 2008
(Total Dollars Sales Growth)
Three Major
Competitive Pizza
Chains
Industry Leading U.S. Performance

Investor Day 2016 “36 Blast” 52
10.2% 13.5%
6.6% 7.9%
16.2%
14.8%
0%
2%
4%
6%
8%
10%
12%
14%
16%
18%
JFM'08 OND'08 JAS'09 AMJ'10 JFM'11 OND'11 JAS'12 AMJ'13 JFM'14 OND'14 JAS'15
Quarterly QSR Pizza Dollar Share
Sales Growth Has Translated to Significant Share Gains
Source: The NPD Group/CREST®, through quarter end Sept. 2015
Industry Leading U.S. Performance

Investor Day 2016 “36 Blast” 53
Source: Technomic Top 10 Public QSR Companies
Comparable Calendar Quarters (SBUX)
Results: Company Filings & Bloomberg Terminal
Domino's Sales Growth Leads More Than Just the Pizza Industry
0.0%
1.0%
2.0%
3.0%
4.0%
5.0%
6.0%
7.0%
8.0%
SBUX DPZ PNRA DNKN TBELL MCD WEN BK PHUT KFC
Top 10 QSR Brands Average Same Store Sales 2010 - Q3 2015
Industry Leading U.S. Performance
Investor Day 2016 “36 Blast” 54
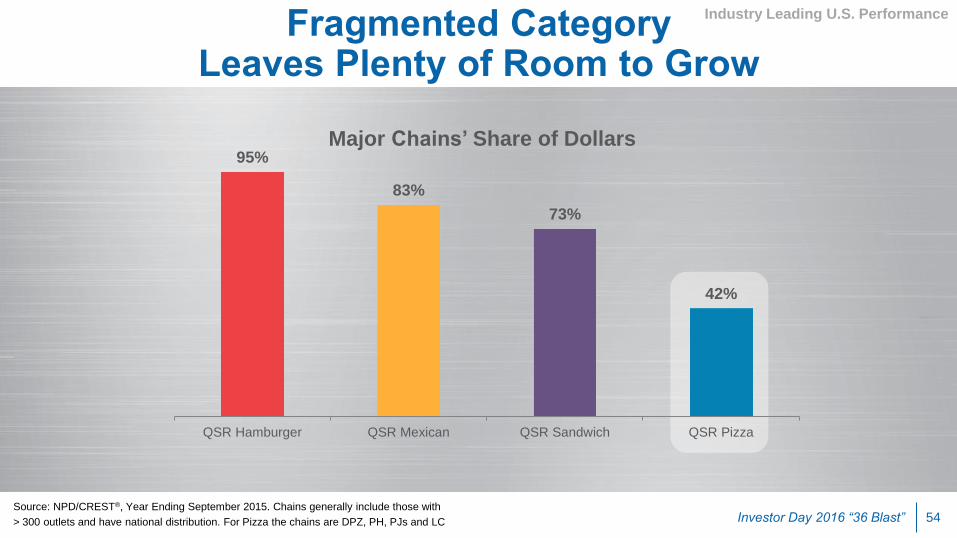
95%
83%
73%
42%
QSR Hamburger QSR Mexican QSR Sandwich QSR Pizza
Major Chains’ Share of Dollars
Source: NPD/CREST®, Year Ending September 2015. Chains generally include those with
> 300 outlets and have national distribution. For Pizza the chains are DPZ, PH, PJs and LC
Fragmented Category Leaves Plenty of Room to Grow
Industry Leading U.S. Performance
Investor Day 2016 “36 Blast” 55
UNMATCHED
INNOVATION
- Re-defined Innovation
- Technology Investments
INDUSTRY
LEADING U.S.
PERFORMANCE
KEY INITIATIVES
FOR 2016
- Exceptional Growth
- Significant Runway Exists
- Continue to Push Loyalty
and Domino’s Broader
Definition of ‘Innovation’
- Store Reimage/Growth

Investor Day 2016 “36 Blast” 56
All of This Growth Without Significant Product Introductions
2013
No new
products
2014
Specialty
Chicken
2015
Marbled Cookie
Brownie
Only Two New Products Launched in the Last Three Years
Unmatched Innovation

Investor Day 2016 “36 Blast” 57
Technology Innovation Has Been Our News
Profiles &
Easy Order™
2013 2014 2015
“DOM” Voice
Ordering
Responsive
Platform
(mobile web)
AnyWare™
Platforms
Piece of the
Pie Rewards™
Windows 8
Platform iPad®
Platform
Unmatched Innovation

Investor Day 2016 “36 Blast” 58
AnyWare Commercial

Investor Day 2016 “36 Blast” 59
33%
49%
10%
8%
Share of Online Dollars - QSR Pizza
Domino's
Major Competitive Pizza Chains
Small Pizza Chains
Pizza Independents
Source: NPD/CREST®, Year Ending September 2015.
Helping to Push Domino's Share of Online Dollars to One Third of the Industry
Unmatched Innovation

Investor Day 2016 “36 Blast” 60
Our Technology Push Is More than Just Consumer Facing
• More than 50% of sales come via
digital channels
• More than 50% of those from
mobile devices
Domino’s is thinking and acting like an
e-commerce company.
It has permeated our culture.
(Data Driven, Pretotype, Prototype, Learn,
Improve Speed to Market)
Unmatched Innovation
50%+

Investor Day 2016 “36 Blast” 61
Consistent Investment in Ordering Platforms Paying Off
Source: http://arc.applause.com/2015/08/11/state-of-us-retail-apps/
Unmatched Innovation

Investor Day 2016 “36 Blast” 62
Applause Retail App Quality Index - Restaurants Unmatched Innovation
Source: Applause Analytics, August 2015

Investor Day 2016 “36 Blast” 63
Applause Retail App Quality Index - Restaurants Unmatched Innovation
Source: Applause Analytics, August 2015
Investor Day 2016 “36 Blast” 64
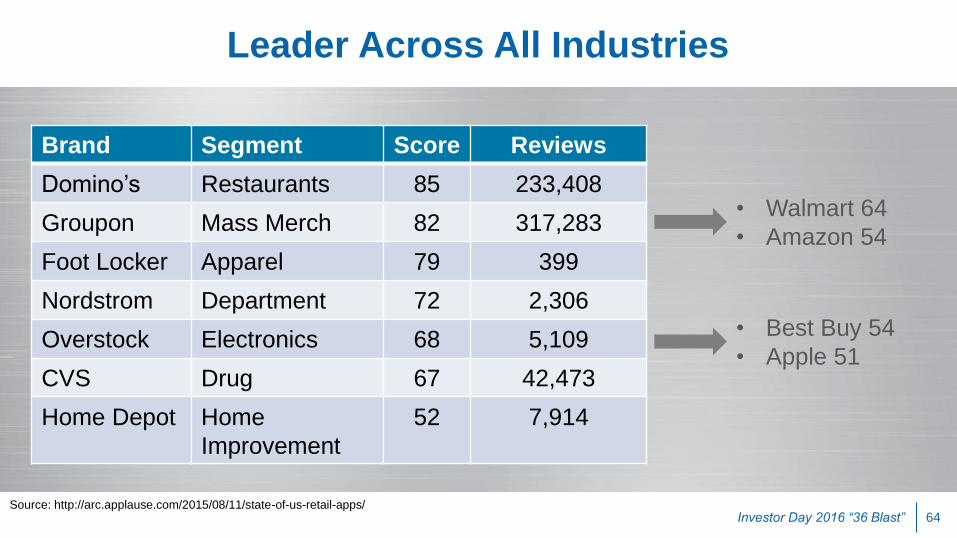
Brand Segment Score Reviews
Domino’s Restaurants 85 233,408
Groupon Mass Merch 82 317,283
Foot Locker Apparel 79 399
Nordstrom Department 72 2,306
Overstock Electronics 68 5,109
CVS Drug 67 42,473
Home Depot Home
Improvement
52 7,914
• Best Buy 54
• Apple 51
• Walmart 64
• Amazon 54
Source: http://arc.applause.com/2015/08/11/state-of-us-retail-apps/
Leader Across All Industries

Investor Day 2016 “36 Blast” 65
• Pizza Theater retail design
• New logo/name
We Have Innovated at Retail Unmatched Innovation

Investor Day 2016 “36 Blast” 66
And We Even Built a Car
Introducing the Domino’s DXP™
Unmatched Innovation
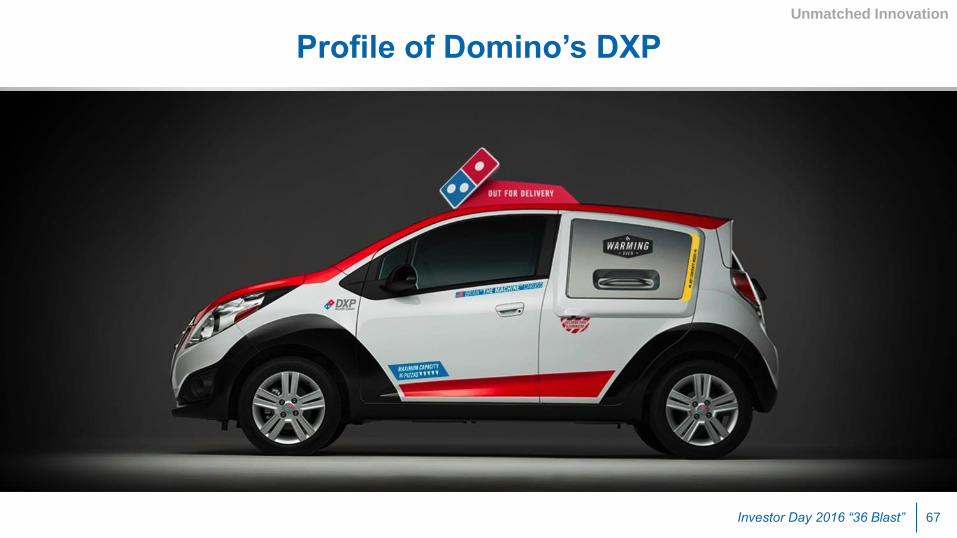
Investor Day 2016 “36 Blast” 67
Profile of Domino’s DXP
Unmatched Innovation

68
Sneak Peek

Investor Day 2016 “36 Blast” 69
Sneak Peak – DXP Commercial

Investor Day 2016 “36 Blast” 70
KEY INITIATIVES
FOR 2016
INDUSTRY
LEADING U.S.
PERFORMANCE
UNMATCHED
INNOVATION
- Re-defined Innovation
- Technology Investments
- Exceptional Growth
- Significant Runway Exists
- Continue to Push Loyalty
and Domino’s Broader
Definition of ‘Innovation’
- Store Reimage/Growth

Investor Day 2016 “36 Blast” 71
Loyalty Program Structure:
• 10 points per online order over $10
• 60 points = free medium 2-topping pizza
• Launched on digital only
Grow New Loyalty Program Key Initiatives for 2016

Investor Day 2016 “36 Blast” 72
Reimaging at a Good Pace
• 2015:
- 50%+ of domestic stores are in new image
• 2016:
- ~75% of our system will be reimaged, including substantially all company-owned stores
• Substantially complete by end of 2017
We Are More Than Halfway Complete with Our Reimages...
Key Initiatives for 2016
Investor Day 2016 “36 Blast” 73
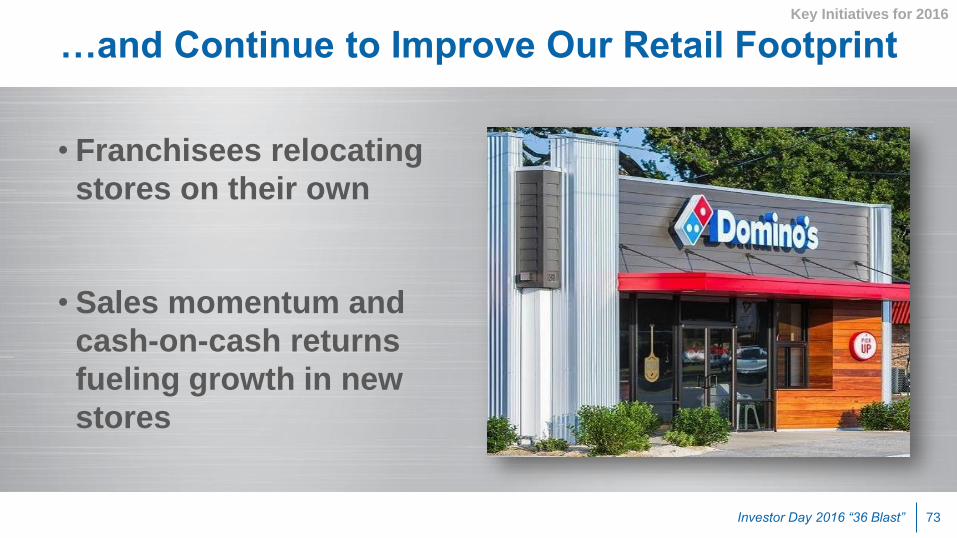
• Franchisees relocating
stores on their own
• Sales momentum and
cash-on-cash returns
fueling growth in new
stores
…and Continue to Improve Our Retail Footprint Key Initiatives for 2016

Investor Day 2016 “36 Blast” 74
124
143
82
54 48 53
150
117
30
(3)
(22)
21
58
81
96
(40)
(20)
0
20
40
60
80
100
120
140
160
2011 2012 2013 2014 Rolling 4 quartersending Q3 2015
Papa John's
Pizza Hut
Domino's
Best Store Growth in the Pizza Industry
Key Initiatives for 2016
Source: Applause Analytics, August 2015
Net New Store Growth

Investor Day 2016 “36 Blast” 75
Conclusion
INDUSTRY
LEADING U.S.
PERFORMANCE
KEY INITIATIVES
FOR 2016 UNMATCHED
INNOVATION
- Re-defined Innovation
- Technology Investments
- Exceptional Growth
- Significant Runway Exists
- Continue to Push Loyalty
and Domino’s Broader
Definition of ‘Innovation’
- Store Reimage/Growth

Jeff Lawrence CFO

Investor Day 2016 “36 Blast” 77
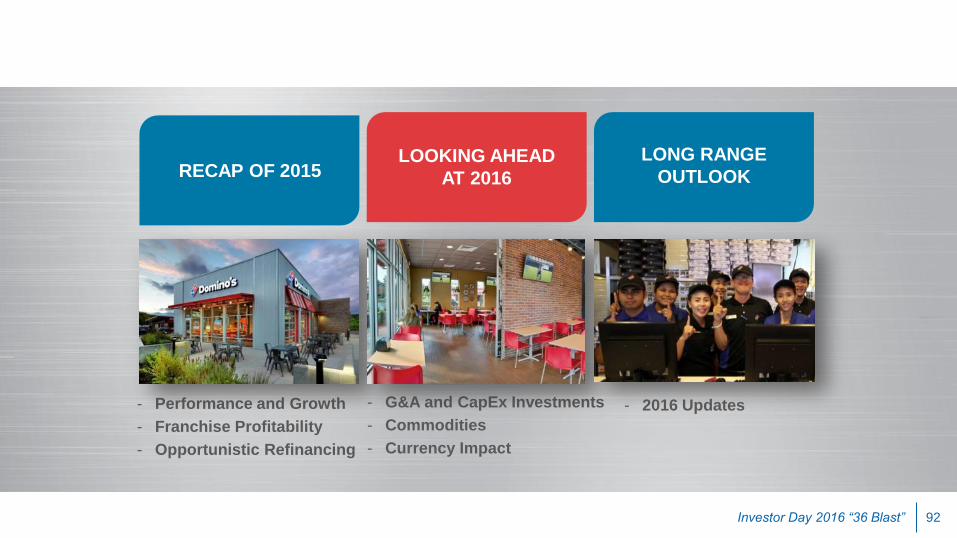
RECAP OF 2015 LONG RANGE
OUTLOOK LOOKING AHEAD
AT 2016
- Performance and Growth
- Franchise Profitability
- Opportunistic Refinancing
- G&A and CapEx Investments
- Commodities
- Currency Impact
Executive Summary
- 2016 Updates

Investor Day 2016 “36 Blast” 78
RECAP OF 2015
- Performance and Growth
- Franchise Profitability
- Opportunistic Refinancing
LONG RANGE
OUTLOOK LOOKING AHEAD
AT 2016
- G&A and CapEx Investments
- Commodities
- Currency Impact
- 2016 Updates
Executive Summary

Investor Day 2016 “36 Blast” 79
One More Reminder: 2015 was a 53-Week Year Recap of 2015

Investor Day 2016 “36 Blast” 80
2.2%
6.7% 6.8%
4.5% 2.8%
0.0%
4.0% 2.6%
1.3% 1.8%
4.9%
-4.1%
-1.7%
-4.9%
0.5%
9.9%
3.5% 3.1%
5.4%
7.5%
12.6%
1995 1996 1997 1998 1999 2000 2001 2002 2003 2004 2005 2006 2007 2008 2009 2010 2011 2012 2013 2014 Q3 2015
US Same Store Sales
1995 - Q3 2015
Global Momentum Same Store Sales Track Record
International sales exclude the impact of foreign currency exchange rate changes
Avg:
+2.8%
Avg:
+5.5%
16 out of 20 years of positive sales
21 consecutive years of positive sales
Recap of 2015
3.8%
5.2%
11.1%
3.4% 3.6% 3.7%
6.4%
4.1% 4.0%
5.9% 6.1%
4.0%
6.7% 6.2%
4.3%
6.9% 6.8%
5.2% 6.2%
6.9% 7.4%
1995 1996 1997 1998 1999 2000 2001 2002 2003 2004 2005 2006 2007 2008 2009 2010 2011 2012 2013 2014 Q3 2015YTD
International Same Store Sales 1995 - Q3 2015
YTD

Investor Day 2016 “36 Blast” 81
8,999 9,351
9,742
10,255
10,886
11,629
12,119
2009 2010 2011 2012 2013 2014 Q3 2015
Accelerated Global Store Growth Recap of 2015
Q3 2015 TTM Net
Growth = 838

Investor Day 2016 “36 Blast” 82
More Than Doubled EPS Since 2010
$1.35
$1.69
$2.02
$2.45
$2.90
$0.00
$0.50
$1.00
$1.50
$2.00
$2.50
$3.00
2010 2011 2012 2013 2014
Certain diluted EPS amounts are adjusted for items affecting comparability.
Items adjusting reported EPS are detailed in the respective Earnings Release on Form 8-K.
Recap of 2015

Investor Day 2016 “36 Blast” 83
Strong Track Record for Our Shareholders
Source: Bloomberg
Total Shareholder Return = (Priceend – Pricebegin + Dividends) / Pricebegin
Recap of 2015
0%
20%
40%
60%
80%
100%
120%
2010 2011 2012 2013 2014 2015
Total Shareholder Return
DPZ SPX S&P 500 REST

Investor Day 2016 “36 Blast” 84
Franchise Profitability: Another Record-Setting Year Recap of 2015
Note: Average of self-reported domestic franchise information. 2015 is a preliminary estimate.
Average U.S. Franchise EBITDA per Store ($000s)
0
25
50
75
100
125
2009 2010 2011 2012 2013 2014 2015 Est
Investor Day 2016 “36 Blast” 85
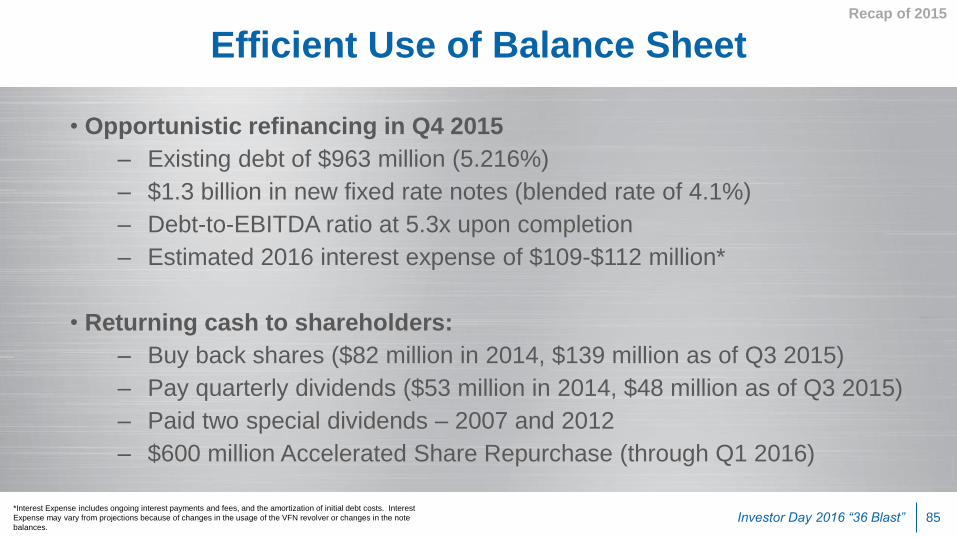
Efficient Use of Balance Sheet
• Opportunistic refinancing in Q4 2015
– Existing debt of $963 million (5.216%)
– $1.3 billion in new fixed rate notes (blended rate of 4.1%)
– Debt-to-EBITDA ratio at 5.3x upon completion
– Estimated 2016 interest expense of $109-$112 million*
• Returning cash to shareholders:
– Buy back shares ($82 million in 2014, $139 million as of Q3 2015)
– Pay quarterly dividends ($53 million in 2014, $48 million as of Q3 2015)
– Paid two special dividends – 2007 and 2012
– $600 million Accelerated Share Repurchase (through Q1 2016)
Recap of 2015
*Interest Expense includes ongoing interest payments and fees, and the amortization of initial debt costs. Interest
Expense may vary from projections because of changes in the usage of the VFN revolver or changes in the note
balances.
Investor Day 2016 “36 Blast” 86
LOOKING AHEAD
AT 2016
- G&A and CapEx Investments
- Commodities
- Currency Impact
RECAP OF 2015 LONG RANGE
OUTLOOK
- Performance and Growth
- Franchise Profitability
- Opportunistic Refinancing
- 2016 Updates

Investor Day 2016 “36 Blast” 87
Investments Continue to Drive the Business
Projected 2016 G&A Range of $290-$295 million
- Includes technology (including depreciation), international,
marketing and people investments
- Flexes with performance and sales-based activities
Projected 2016 CapEx of ~$60 million
- The paradigm has shifted: Technology a priority
- Company store reimage winding down
- Supply Chain investments as we grow
Looking Ahead at 2016

Investor Day 2016 “36 Blast” 88
• Food basket outlook is currently favorable
• Project flat to +2% vs. 2015
U.S. Commodities Outlook Looking Ahead at 2016

Investor Day 2016 “36 Blast” 89
$3.1 $3.4
-$4.0 -$4.3 -$3.4
-$13.5 -$16.0
-$14.0
-$12.0
-$10.0
-$8.0
-$6.0
-$4.0
-$2.0
$0.0
$2.0
$4.0
$6.0
2010 2011 2012 2013 2014 2015 Q3 YTD
FX Impact on Royalty Income (YOY millions)
FX Headwinds Have Negatively Impacted Results Since 2011
Looking Ahead at 2016

Investor Day 2016 “36 Blast” 90
• Currently projecting ~$8-12 million negative impact in 2016
• Diversified portfolio of more than 55 currencies
Foreign Currency Outlook Looking Ahead at 2016
Investor Day 2016 “36 Blast” 91
• A 1% strengthening of the dollar against our basket of
currencies has roughly a 2-cent negative impact on EPS
• A 10% move in the price of cheese has roughly a 1.5-cent
impact on EPS
Impact of Currency & Cheese Looking Ahead at 2016
Investor Day 2016 “36 Blast” 92
RECAP OF 2015 LOOKING AHEAD
AT 2016
- Performance and Growth
- Franchise Profitability
- Opportunistic Refinancing
- G&A and CapEx Investments
- Commodities
- Currency Impact
LONG RANGE
OUTLOOK
- 2016 Updates

Investor Day 2016 “36 Blast” 93 Outlook does not constitute specific earnings guidance.
Domino’s does not provide quarterly or annual earnings estimates.
Global
Net Units Domestic
Same Store Sales
International
Same Store Sales
Global
Retail Sales
+5% to +7%
+2% to +5% From prior +2% to +4%
+3% to +6%
+7% to +11%
Long Range Outlook
Long Range Outlook Summary

94
Back to Patrick!

Investor Day 2016 “36 Blast” 95
36 Blast: Why Is It Working?
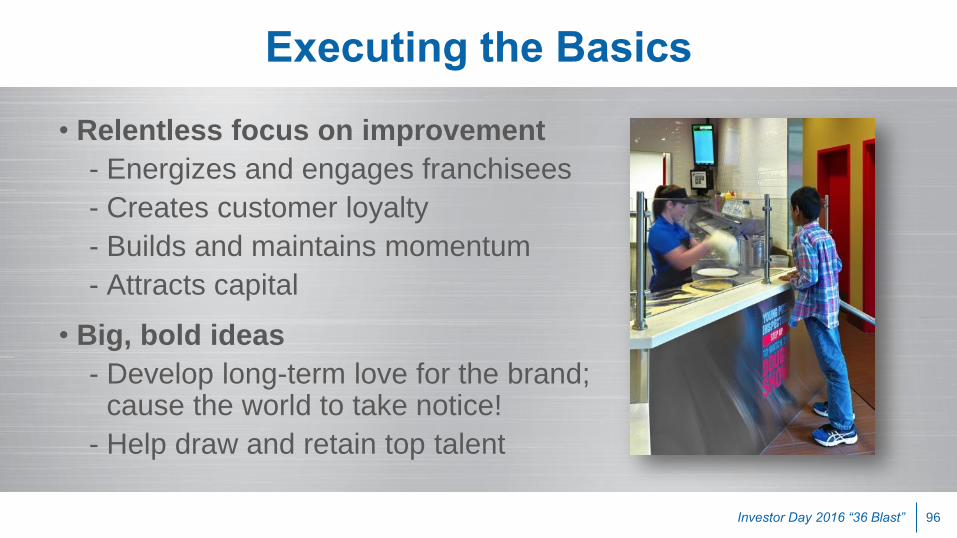
Investor Day 2016 “36 Blast” 96
• Relentless focus on improvement
- Energizes and engages franchisees
- Creates customer loyalty
- Builds and maintains momentum
- Attracts capital
• Big, bold ideas
- Develop long-term love for the brand; cause the world to take notice!
- Help draw and retain top talent
Executing the Basics
Investor Day 2016 “36 Blast” 97
Q&A with Patrick, Ritch, Russell and Jeff