34th annual j.p. morgan healthcare...
TRANSCRIPT

The world leader in serving scienceProprietary & Confidential
Marc N. CasperPresident and Chief Executive Officer
January 10, 2017
35th Annual J.P. Morgan Healthcare Conference
2
Safe Harbor / Non-GAAP MeasuresVarious remarks that we may make in the following presentation about the company’s future expectations, plans and prospects
constitute forward-looking statements for purposes of the safe harbor provisions under The Private Securities Litigation Reform Act of
1995. Actual results may differ materially from those indicated by these forward-looking statements as a result of various important
factors, including those discussed in our Form 10-Q for the quarter ended October 1, 2016, under the caption “Risk Factors,” which is on
file with the Securities and Exchange Commission and available in the “Investors” section of our website under the heading “SEC
Filings.” Important factors that could cause actual results to differ materially from those indicated by forward-looking statements include
risks and uncertainties relating to: the need to develop new products and adapt to significant technological change; implementation of
strategies for improving internal growth; general economic conditions and related uncertainties; dependence on customers' capital
spending policies and government funding policies; the effect of exchange rate fluctuations on international operations; the effect of
healthcare reform legislation; use and protection of intellectual property; the effect of changes in governmental regulations; and the effect
of laws and regulations governing government contracts, as well as the possibility that expected benefits related to recent or pending
acquisitions may not materialize as expected. While we may elect to update forward-looking statements at some point in the future, we
specifically disclaim any obligation to do so, even if estimates change, therefore, you should not rely on these forward-looking
statements as representing our views as of any date subsequent to today.
During this presentation, we will be referring to certain financial measures not prepared in accordance with generally accepted
accounting principles, or GAAP, including adjusted EPS and adjusted operating margin. The non-GAAP financial measures of Thermo
Fisher’s results of operations and cash flows included in this presentation are not meant to be considered superior to or a substitute for
Thermo Fisher’s results of operations prepared in accordance with GAAP. Definitions of these non-GAAP financial measures and, for
historical periods, a reconciliation of the non-GAAP financial measures to the most directly comparable GAAP measures is available
under the heading “GAAP/Non-GAAP Reconciliation & Financial Package” in the “Investors” section of our website,
www.thermofisher.com.

3
We Are The World Leader in Serving Science
Unmatched Depth• Leading innovative technologies
• Deep applications expertise
• Premier laboratory productivity partner
• >50,000 employees in 50 countries
• $18 billion in annual revenue
• Unparalleled commercial reach
Global Scale
Our Mission: To enable our customers to make the world healthier, cleaner and safer

4
Attractive Customer, Product & Geographic Mix
End Markets Products Geographies
62%Consumables
24% Europe
24%
Instruments Equipment &
Software
Services14%
53%North America19%
Asia-Pacific
ROW4%
25%
Academic & Government
19%
Industrial & Applied
Diagnostics& Healthcare
25% 31%
Pharma& Biotech
Balanced and diversecustomer base
Growing presence in emerging markets
Strong recurring revenue mix
Note: Percentage estimates based on unaudited LTM combined revenues of Thermo Fisher Scientific through Q3 2016
5
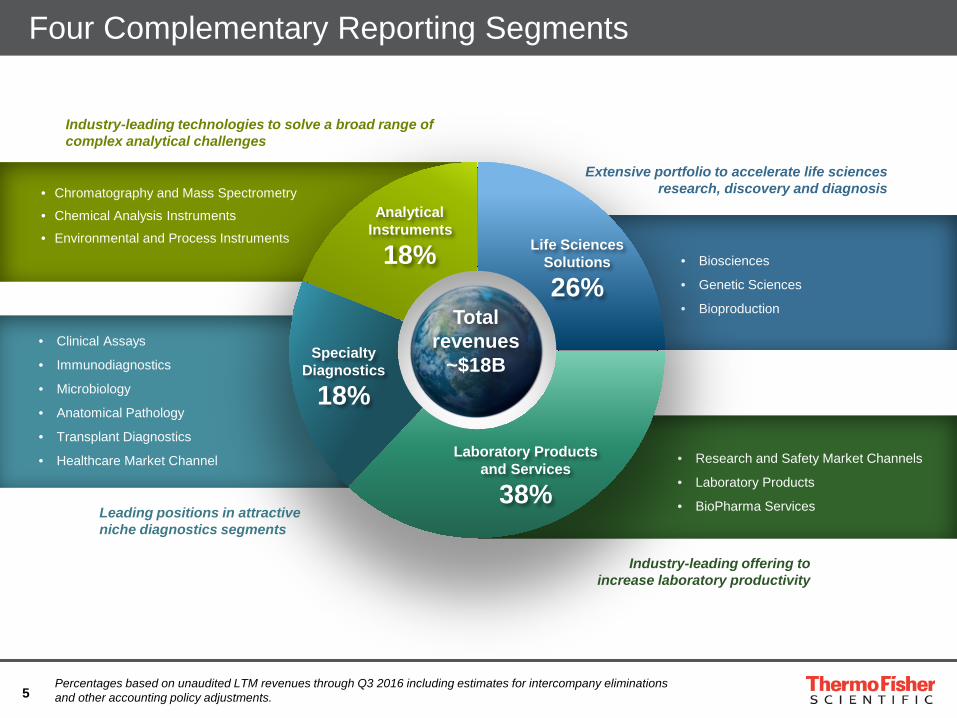
Four Complementary Reporting Segments
Percentages based on unaudited LTM revenues through Q3 2016 including estimates for intercompany eliminations and other accounting policy adjustments.
• Clinical Assays
• Immunodiagnostics
• Microbiology
• Anatomical Pathology
• Transplant Diagnostics
• Healthcare Market Channel
• Biosciences
• Genetic Sciences
• Bioproduction
• Chromatography and Mass Spectrometry
• Chemical Analysis Instruments
• Environmental and Process Instruments
• Research and Safety Market Channels
• Laboratory Products
• BioPharma Services
Life SciencesSolutions
26%
SpecialtyDiagnostics
18%
AnalyticalInstruments
18%
Laboratory Products and Services
38%
Total revenues
~$18B
Leading positions in attractive niche diagnostics segments
Extensive portfolio to accelerate life sciences research, discovery and diagnosis
Industry-leading technologies to solve a broad range of complex analytical challenges
Industry-leading offering to increase laboratory productivity

6
Complementary Segments Fundamental to Our Growth Strategy
• High-impact innovation• Largest R&D spend in our industry
>$800M*• Life science tools into the clinic• Laboratory technologies for
applied markets• R&D centers of excellence (COE)
and ability to leverage cross-business technologies and programs
• Unique customer value proposition• Ultimate channel partner• Leading e-Business presence• Extensive corporate accounts program• Comprehensive services offering
• Scale in emerging markets • Customer reach and superior customer
experience• Manufacturing COEs in low-cost regions
Life SciencesSolutions
SpecialtyDiagnostics
AnalyticalInstruments
Laboratory Products and Services
Customer
* R&D spend presented on a pro-forma basis including FEI

7
$100B Market
Our OpportunityCapital Deployed2010 – Q3 2016
Dividends
M&A81%
Buybacks16%
3%
$32BDeployed Notable M&A
• 2011 – Dionex, Phadia
• 2012 – One Lambda
• 2014 – Life Technologies
• 2016 – Affymetrix, FEI
Share Buybacks • $5.1B deployed to
repurchase 78M shares
Dividend• Dividend payer
since 2012
Continuing our disciplined approach to capital deployment
100s of smaller
companies
Thermo Fisher Scientificplus top 2competitors
Strong Track Record of Effectively Deploying Our Capital
Market Growing 3 - 5%

8
Continuing Our Impressive Track Record
Delivering on our commitment to create shareholder value
$1.87$2.55
$3.02 $2.92$3.43
$4.16$4.94
$5.42
$6.96$7.39
$7.98
Q3’ 16 TTM201420132012201120102009200820072006
Adjusted EPS Performance
2015

9
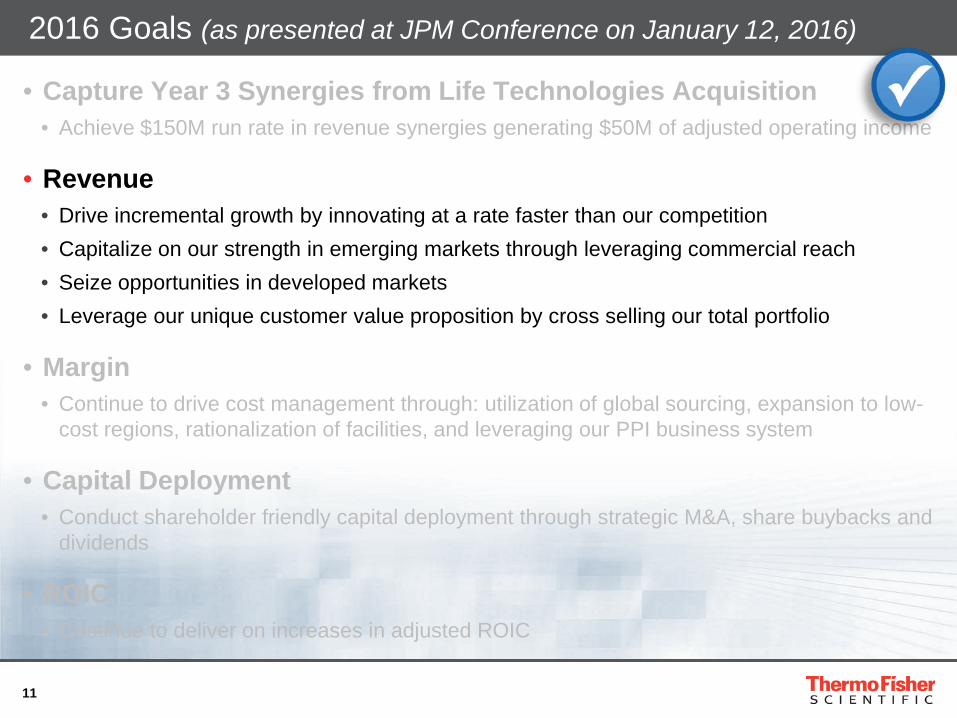
2016 Goals (as presented at JPM Conference on January 12, 2016)
• Capture Year 3 Synergies from Life Technologies Acquisition• Achieve $150M run rate in revenue synergies generating $50M of adjusted operating income
• Revenue• Drive incremental growth by innovating at a rate faster than our competition• Capitalize on our strength in emerging markets through leveraging commercial reach• Seize opportunities in developed markets• Leverage our unique customer value proposition by cross selling our total portfolio
• Margin• Continue to drive cost management through: utilization of global sourcing, expansion
to low-cost regions, rationalization of facilities, and leveraging our PPI business system
• Capital Deployment• Conduct shareholder friendly capital deployment through strategic M&A, share buybacks
and dividends
• ROIC• Continue to deliver on increases in adjusted ROIC

10
Life Technologies Acquisition: Unrivaled Leader in Life Sciences
Accelerated growthand driving share gain
• Achieved year 3 synergy targets –realized full run rate of >$300M of cost synergies and $150M of revenue synergies
• Aggressively redeployed investments to fuel growth opportunities
• Leveraging strengths of combined businesses to position Thermo Fisher Scientific for an even brighter future• Commercial reach
• Extensive corporate accounts program• Ultimate channel partner• Scale in emerging markets and APAC
• Benefiting from scalable infrastructure, e-business and supply-chain operations
Organic Growth
2%
4%
5%
6.5%
2013 2014 2015 2016*
NOTE: 2014 organic growth percentage is on a pro forma basis, as if Life Technologies was owned for the entire year.* 2016 organic growth is YTD through Q3’16 on a days adjusted basis
Life Sciences Solutions Segment
11
2016 Goals (as presented at JPM Conference on January 12, 2016)
• Capture Year 3 Synergies from Life Technologies Acquisition• Achieve $150M run rate in revenue synergies generating $50M of adjusted operating income
• Revenue• Drive incremental growth by innovating at a rate faster than our competition• Capitalize on our strength in emerging markets through leveraging commercial reach• Seize opportunities in developed markets• Leverage our unique customer value proposition by cross selling our total portfolio
• Margin• Continue to drive cost management through: utilization of global sourcing, expansion to low-
cost regions, rationalization of facilities, and leveraging our PPI business system
• Capital Deployment• Conduct shareholder friendly capital deployment through strategic M&A, share buybacks and
dividends
• ROIC• Continue to deliver on increases in adjusted ROIC

12
Largest R&D Spend in Life Sciences Industry
Life Sciences Solutions
• Launched several new Oncomine assays (e.g., Cell Free Lung DNA assay and BRCA Research Assay)
• Ion AmpliSeq Transcriptome Human Gene Expression Kit
Analytical Instruments
• Q Exactive BioPharma mass spectrometer
• Integrion high-pressure ion chromatography (HPIC)
• Launched a suite of software and Cloud-based solutions for research and applied markets
Laboratory Products
• TSX Series high-performance refrigerators and freezers
• Large capacity blood banking centrifuges
Specialty Diagnostics
• Extended claims of BRAHMS PCT sepsis in the U.S.
• FDA clearance of DRI Hydrocodone assay
• Launched LabLink xL 2.0 software
Option B>$800M* Invested in 2016 to Deliver High-impact Products
* R&D spend presented on a pro-forma basis including FEI
13
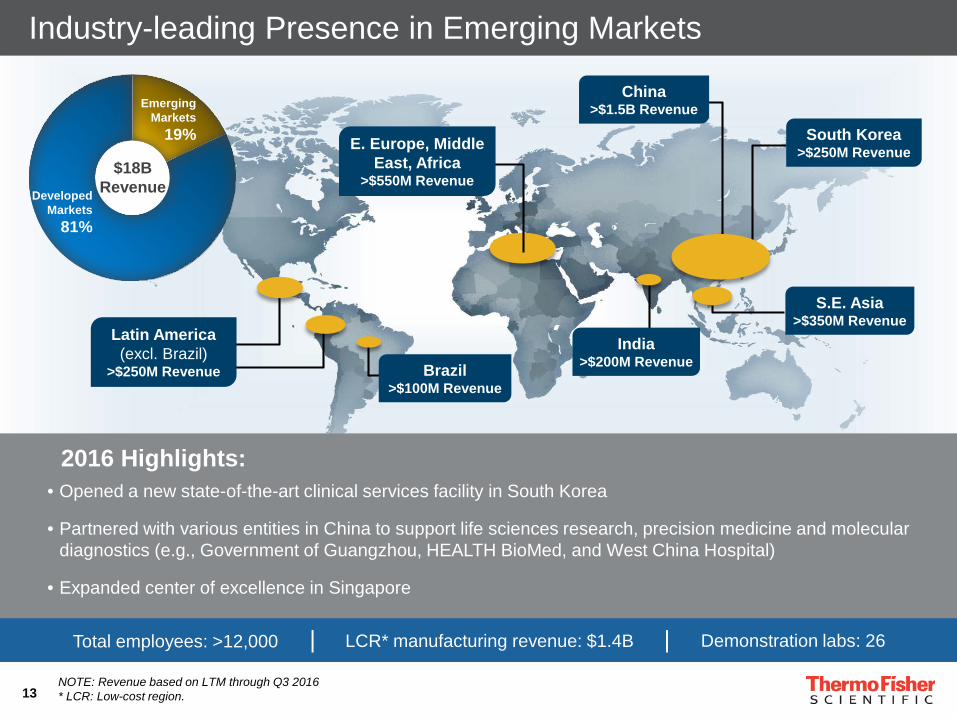
Developed Markets
81%
Emerging Markets
19%
$18BRevenue
China>$1.5B Revenue
South Korea>$250M Revenue
India>$200M RevenueBrazil
>$100M Revenue
E. Europe, Middle East, Africa
>$550M Revenue
Latin America(excl. Brazil)
>$250M Revenue
S.E. Asia>$350M Revenue
2016 Highlights:• Opened a new state-of-the-art clinical services facility in South Korea
• Partnered with various entities in China to support life sciences research, precision medicine and molecular diagnostics (e.g., Government of Guangzhou, HEALTH BioMed, and West China Hospital)
• Expanded center of excellence in Singapore
Industry-leading Presence in Emerging Markets
NOTE: Revenue based on LTM through Q3 2016* LCR: Low-cost region.
Demonstration labs: 26Total employees: >12,000 LCR* manufacturing revenue: $1.4B| |

14
Accelerate research
Support regulatory
compliance
Utilize strategic
outsourcingOptimize
supply chain
Enable technical
innovation
Improve production efficiency
Improve diagnostics
Solve complex analytical
challenges
Increase lab
productivity
Partner on R&D projects
• Unique customer value proposition• Ultimate channel partner
• Comprehensive services offering
• Leading e-Business presence
• Extensive corporate accounts program
Commercial Capabilities are Unmatched in Our Industry
Customer

15
2016 Goals (as presented at JPM Conference on January 12, 2016)
• Capture Year 3 Synergies from Life Technologies Acquisition• Achieve $150M run rate in revenue synergies generating $50M of adjusted operating income
• Revenue• Drive incremental growth by innovating at a rate faster than our competition• Capitalize on our strength in emerging markets through leveraging commercial reach• Seize opportunities in developed markets• Leverage our unique customer value proposition by cross selling our total portfolio
• Margin• Continue to drive cost management through: utilization of global sourcing, expansion to low-
cost regions, rationalization of facilities, and leveraging our PPI business system
• Capital Deployment• Conduct shareholder friendly capital deployment through strategic M&A, share buybacks and
dividends
• ROIC• Continue to deliver on increases in adjusted ROIC

16
17.5%
22.5%
PPI Business System Fuels Growth and Profitability
Operational discipline is our foundation for strong earnings growth
Practical Process Improvement (PPI) = Continuous improvement every day
• 5S• Lean• Kaizen• Stand-up meetings• KPI boards
Strategic PPI deploymentfor long-term benefit
• Global sourcing
• Footprint optimization
• Low-cost region manufacturing
• Shared services
• Proven M&A playbook
Our Opportunity
Adjusted Operating Margin %
2010 Q3’16 YTD
Quality
Productivity
CustomerAllegiance
Consistently deliver world-class products and services
Exceed expectations to maximize customer success
Improve operating andprocess efficiencyto strengthen our
competitiveadvantage
17
2016 Goals (as presented at JPM Conference on January 12, 2016)
• Capture Year 3 Synergies from Life Technologies Acquisition• Achieve $150M run rate in revenue synergies generating $50M of adjusted operating income
• Revenue• Drive incremental growth by innovating at a rate faster than our competition• Capitalize on our strength in emerging markets through leveraging commercial reach• Seize opportunities in developed markets• Leverage our unique customer value proposition by cross selling our total portfolio
• Margin• Continue to drive cost management through: utilization of global sourcing, expansion to low-
cost regions, rationalization of facilities, and leveraging our PPI business system
• Capital Deployment• Conduct shareholder friendly capital deployment through strategic M&A, share buybacks and
dividends
• ROIC• Continue to deliver on increases in adjusted ROIC

18
2016 Capital Deployment Summary
• $1.25B in Share Buybacks• Includes $250M of share repurchases in December 2016
• ~$240M in Dividends
• ~$5.5B in M&A• $4.2B for FEI• $1.3B for Affymetrix, MTI-GlobalStem, INEL Inc., and divestiture of glassware JV

19
Acquisition Completed September 19, 2016
Company Background• Leader in high performance electron microscopy (EM)
Benefits of Transaction• EM complements our mass spectrometry leadership to accelerate advancements in structural biology
• Combined technology portfolio creates new opportunities in attractive material sciences market
• Thermo Fisher’s unmatched global reach opens new opportunities for FEI
• Expect to generate $80M of synergies ($55M from cost and $25M from revenue; Year 1 adj. EPS accretion of $0.30)
TTM Revenue of ~$1B
North America
35%
Europe
24%
41%
APAC & ROW
Services &Software
29%
InstrumentSystems
71%
Acquisition of FEI: New Opportunities in Analytical Instrumentation

20
2016 Goals (as presented at JPM Conference on January 12, 2016)
• Capture Year 3 Synergies from Life Technologies Acquisition• Achieve $150M run rate in revenue synergies generating $50M of adjusted operating income
• Revenue• Drive incremental growth by innovating at a rate faster than our competition• Capitalize on our strength in emerging markets through leveraging commercial reach• Seize opportunities in developed markets• Leverage our unique customer value proposition by cross selling our total portfolio
• Margin• Continue to drive cost management through: utilization of global sourcing, expansion to low-
cost regions, rationalization of facilities, and leveraging our PPI business system
• Capital Deployment• Conduct shareholder friendly capital deployment through strategic M&A, share buybacks and
dividends
• ROIC• Continue to deliver on increases in adjusted ROIC

21
Improving Adjusted ROIC
*Life Technologies acquisition fully in ROIC calculation by end of Q1’2015
Note: Adjusted return on invested capital is annual adjusted net income excluding net interest expense, net of tax benefit therefrom, divided by trailing five quarters average invested capital.
10.1% Life Technologies Acquisition Investment*
2013 Q1 2015
2015 Q3 2016
8.9%
9.5%9.8%

22
2016 Goals (as presented at JPM Conference on January 12, 2016)
• Capture Year 3 Synergies from Life Technologies Acquisition• Achieve $150M run rate in revenue synergies generating $50M of adjusted operating income
• Revenue• Drive incremental growth by innovating at a rate faster than our competition• Capitalize on our strength in emerging markets through leveraging commercial reach• Seize opportunities in developed markets• Leverage our unique customer value proposition by cross selling our total portfolio
• Margin• Continue to drive cost management through: utilization of global sourcing, expansion to low-cost regions,
rationalization of facilities, and leveraging our PPI business system
• Capital Deployment• Conduct shareholder friendly capital deployment through strategic M&A, share buybacks and dividends
• ROIC• Continue to deliver on increases in adjusted ROIC
Successfully achieved key business goals & delivered solid returns

23
2017 Goals
• Capture Synergies from Affymetrix and FEI Acquisitions
• Revenue• Continue to launch high-impact new products• Leverage our unique customer value proposition by cross selling our total portfolio• Capture further share gain opportunities in emerging markets by continuing to leverage our commercial
reach• Leverage our expansive commercial capabilities to capture the most significant opportunities within our key
end-markets
• Margin• Drive cost management initiatives through global sourcing programs, low-cost region expansion, footprint
optimization, and our PPI business system • Take actions to reduce the adverse impact of FX and higher interest rates on variable rate debt
• Capital Deployment• Continue shareholder friendly capital deployment through strategic M&A, share buybacks, dividends, and
debt repayment
• ROIC• Keep momentum on driving returns from our acquisitions and other investments