334 national security and veterans affairs - census.gov · 334 national security and veterans...
TRANSCRIPT

Source: Statistical Abstract of the United States: 1893 Edition.
334 National Security and Veterans Affairs
U.S. Census Bureau, Statistical Abstract of the United States: 2006

Section 10
National Security and Veterans Affairs
This section displays data for nationalsecurity (national defense and homelandsecurity) and benefits for veterans. Dataare presented on national defense and itshuman and financial costs; active andreserve military personnel; and federallysponsored programs and benefits for vet-erans, and funding, budget and selectedagencies for homeland security. The prin-cipal sources of these data are the annualSelected Manpower Statistics and theAtlas/Data Abstract for the United Statesand Selected Areas issued by the Office ofthe Secretary of Defense; Annual Reportof Secretary of Veterans Affairs, Depart-ment of Veterans Affairs, Budget in Brief,Department of Homeland Security; andThe Budget of the United States Govern-ment, Office of Management and Budget.For more data on expenditures and per-sonnel, see Section 30.
Department of Defense (DOD)—TheDepartment of Defense is responsible forproviding the military forces of the UnitedStates. It includes the Office of the Secre-tary of Defense, the Joint Chiefs of Staff,the Army, the Navy, the Air Force, and thedefense agencies. The President serves asCommander-in-Chief of the Armed Forces;from him, the authority flows to the Sec-retary of Defense and through the JointChiefs of Staff to the commanders of uni-fied and specified commands (e.g., U.S.Strategic Command).
Reserve components—The ReserveComponents of the Armed Forces consistof the Army National Guard of the UnitedStates, Army Reserve, Naval Reserve,Marine Corps Reserve, Air National Guard,Air Force Reserve, and Coast GuardReserve. They provide trained personneland units available for active duty in theArmed Forces during times of war ornational emergency, and at such othertimes as national security may require.The National Guard has dual federal-stateresponsibilities and uses jointly providedequipment, facilities, and budget support.The President is empowered to mobilizethe National Guard and to use such of the
Armed Forces as he considers necessaryto enforce federal authority in any state.There is in each Armed Force a ReadyReserve, a Standby Reserve, and a RetiredReserve. The Ready Reserve includes theSelected Reserve, which provides trainedand ready units and individuals to aug-ment the active forces during times ofwar or national emergency, or at othertimes when required; and the IndividualReady Reserves, which is a manpowerpool, that can be called to active duty dur-ing times of war or national emergencyand would normally be used as individualfillers for active, guard and reserve units,and as a source of combat replacements.Most of the Ready Reserve serves in anactive status. The Standby Reserve cannotbe called to active duty, other than fortraining, unless authorized by Congressunder ‘‘full mobilization,’’ and a determi-nation is made that there are not enoughqualified members in the Ready Reservein the required categories who are readilyavailable. The Retired Reserve representsa lower potential for involuntary mobiliza-tion.
Department of Veterans Affairs(VA)—The Department of Veterans Affairsadministers laws authorizing benefits foreligible former and present members ofthe Armed Forces and for the beneficia-ries of deceased members. Veterans ben-efits available under various acts of Con-gress include compensation for service-connected disability or death; vocationalrehabilitation, education, and training;home loan insurance; life insurance;health care; special housing and automo-biles or other conveyances for certain dis-abled veterans; burial and plot allow-ances; and educational assistance tofamilies of deceased or totally disabledveterans, servicemen missing in action, orprisoners of war. Since these benefits arelegislated by Congress, the dates theywere enacted and the dates they apply toveterans may be different from the actualdates the conflicts occurred.
National Security and Veterans Affairs 335
U.S. Census Bureau, Statistical Abstract of the United States: 2006

VA estimates of veterans cover all personsdischarged from active U.S. military serv-ice under conditions other than dishonor-able.
Homeland Security—In an effort toincrease homeland security following theSeptember 11, 2001, terrorist attacks onthe United States, President George W.Bush issued the National Strategy forHomeland Security in July 2002 andsigned legislation creating the Depart-ment of Homeland Security (DHS) inNovember 2002.
The National Strategy sets forth a plan toimprove homeland security through 43initiatives that fall within six critical mis-sion areas. These mission areas are intelli-gence and warning, border and transpor-tation security, domestic counter-terrorism, protection of critical infrastruc-ture, defense against catastrophic terror-ism, and emergency preparedness andresponse. The first three mission areasfocus primarily on preventing terroristattacks; the next two on reducing ournation’s vulnerabilities; and the final oneon minimizing the damage and recoveryfrom attacks that do occur.
The funding and activities of homelandsecurity are not only carried out by DHS,but also by other federal agencies, state,and local entities. In addition to DHS,there are 32 other federal agencies thatcomprise federal homeland security fund-ing. DHS, along with four otheragencies—Department of Defense (DOD),Energy (DOE), Health and Human Services(HHS), and Justice (DOJ)—account for over90 percent of federal spending for home-land security.
Department of Homeland Security(DHS)—The mission of DHS is to lead aunified effort to secure the United States.This effort is to prevent and deter terror-ist attacks and to protect against andrespond to threats and hazards to thenation. This effort is to ensure safe andsecure borders, to welcome lawful immi-grants and visitors, and to promote thefree flow of commerce.
The creation of the Department of Home-land Security, which began operations inMarch 2003, represents a fusion of 22federal agencies (legacy agencies) to coor-dinate and centralize the leadership of
many homeland security activities under asingle department. Twenty of these agen-cies are housed in one of the four majordirectorates of DHS. These four director-ates are: Border and Transportation Secu-rity, Emergency Preparedness andResponse, Science and Technology, andInformation Analysis and Infrastruce. TheSecret Service and Coast Guard remainintact and report directly to the Secretary.Immigration and Naturalization Services(INS) adjudications and benefits programsreport directly to the Deputy Secretary asthe U.S. Citizenship and Immigration Ser-vices (USCIS).
The Customs and Border Protection (CBP)is responsible for managing, securing,and controlling U.S. borders. This includescarrying out traditional border-relatedresponsibilities, such as stemming thetide of illegal drugs and illegal aliens;securing and facilitating legitimate globaltrade and travel; and protecting the foodsupply and agriculture industry frompests and disease. CBP is composed ofthe Border Patrol and Inspections (bothmoved from INS) along with Customs(absorbed from the Department of Trea-sury) and Animal and Plant Health Inspec-tions Services (absorbed from the Depart-ment of Agriculture).
Immigration and Customs Enforcement(ICE) is the largest investigation arm ofDHS. ICE’s mission is to prevent acts ofterrorism by targeting the people, money,and materials that support terrorist andcriminal activities. Selected responsibili-ties include the enforcement of immigra-tion customs laws within the U.S., theprotection of specified federal buildings,and air and marine enforcement. ICE iscomposed of five law enforcement divi-sions: Investigations, Intelligence, FederalAir Marshal Service, Federal ProtectiveService, and Apprehension, Detention,and Removal.
The Transportation Security Administra-tion (TSA) was created as part of the Avia-tion and Transportation Security Act onNovember 19, 2001. TSA was originallypart of the Department of Transportation,but was moved to Department of Home-land Security. TSA’s mission is to providesecurity to our nation’s transportation sys-tems with a primary focus on aviationsecurity.
336 National Security and Veterans Affairs
U.S. Census Bureau, Statistical Abstract of the United States: 2006

Figure 10.2Living Veterans by Age: 2004
55–59 years old3,572
50–54 years old2,172
35–39 years old1,332
40–44 years old1,732
45–49 years old1,906
Under 35 years old2,007
Source: Figure 10.2 prepared by U.S. Census Bureau. For data, see Table 510.
Total = 24,793
60-64 years old2,553
65 years old and over9,520
(In thousands)
Figure 10.1Department of Defense Manpower: 2004
Navy373
Army500
1Includes National Guard, Reserve, and retired regular personnel on extended or continuous active duty. Excludes Coast Guard.
Source: Figure 10.1 prepared by U.S. Census Bureau. For data, see Table 501.
Total1 = 1,427
Marines178
Air Force377
(In thousands)
National Security and Veterans Affairs 337
U.S. Census Bureau, Statistical Abstract of the United States: 2006
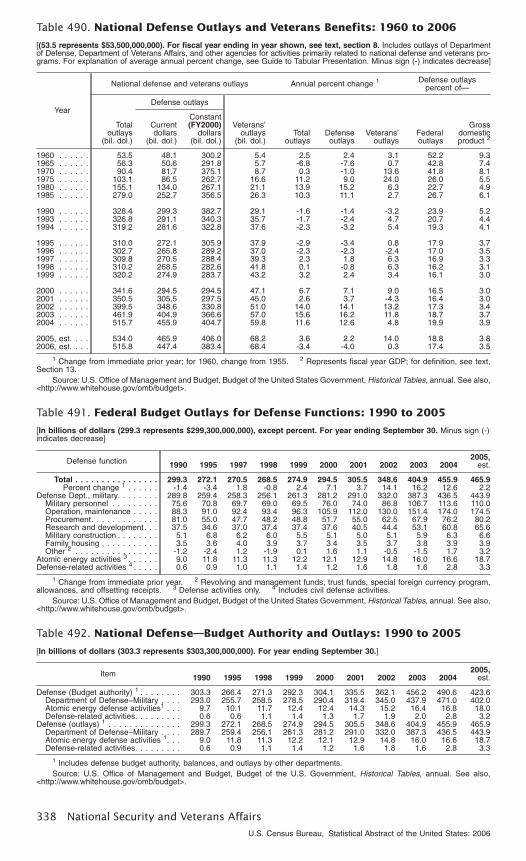
Table 490. National Defense Outlays and Veterans Benefits: 1960 to 2006
[(53.5 represents $53,500,000,000). For fiscal year ending in year shown, see text, section 8. Includes outlays of Departmentof Defense, Department of Veterans Affairs, and other agencies for activities primarily related to national defense and veterans pro-grams. For explanation of average annual percent change, see Guide to Tabular Presentation. Minus sign (-) indicates decrease]
Year
National defense and veterans outlays Annual percent change 1 Defense outlayspercent of—
Totaloutlays
(bil. dol.)
Defense outlays
Veterans’outlays
(bil. dol.)Total
outlaysDefenseoutlays
Veterans’outlays
Federaloutlays
Grossdomesticproduct 2
Currentdollars
(bil. dol.)
Constant(FY2000)
dollars(bil. dol.)
1960 . . . . . . 53.5 48.1 300.2 5.4 2.5 2.4 3.1 52.2 9.31965 . . . . . . 56.3 50.6 291.8 5.7 -6.8 -7.6 0.7 42.8 7.41970 . . . . . . 90.4 81.7 375.1 8.7 0.3 -1.0 13.6 41.8 8.11975 . . . . . . 103.1 86.5 262.7 16.6 11.2 9.0 24.0 26.0 5.51980 . . . . . . 155.1 134.0 267.1 21.1 13.9 15.2 6.3 22.7 4.91985 . . . . . . 279.0 252.7 356.5 26.3 10.3 11.1 2.7 26.7 6.1
1990 . . . . . . 328.4 299.3 382.7 29.1 -1.6 -1.4 -3.2 23.9 5.21993 . . . . . . 326.8 291.1 340.3 35.7 -1.7 -2.4 4.7 20.7 4.41994 . . . . . . 319.2 281.6 322.8 37.6 -2.3 -3.2 5.4 19.3 4.1
1995 . . . . . . 310.0 272.1 305.9 37.9 -2.9 -3.4 0.8 17.9 3.71996 . . . . . . 302.7 265.8 289.2 37.0 -2.3 -2.3 -2.4 17.0 3.51997 . . . . . . 309.8 270.5 288.4 39.3 2.3 1.8 6.3 16.9 3.31998 . . . . . . 310.2 268.5 282.6 41.8 0.1 -0.8 6.3 16.2 3.11999 . . . . . . 320.2 274.9 283.7 43.2 3.2 2.4 3.4 16.1 3.0
2000 . . . . . . 341.6 294.5 294.5 47.1 6.7 7.1 9.0 16.5 3.02001 . . . . . . 350.5 305.5 297.5 45.0 2.6 3.7 -4.3 16.4 3.02002 . . . . . . 399.5 348.6 330.8 51.0 14.0 14.1 13.2 17.3 3.42003 . . . . . . 461.9 404.9 366.6 57.0 15.6 16.2 11.8 18.7 3.72004 . . . . . . 515.7 455.9 404.7 59.8 11.6 12.6 4.8 19.9 3.9
2005, est. . . . 534.0 465.9 406.0 68.2 3.6 2.2 14.0 18.8 3.82006, est. . . . 515.8 447.4 383.4 68.4 -3.4 -4.0 0.3 17.4 3.5
1 Change from immediate prior year; for 1960, change from 1955. 2 Represents fiscal year GDP; for definition, see text,Section 13.
Source: U.S. Office of Management and Budget, Budget of the United States Government, Historical Tables, annual. See also,<http://www.whitehouse.gov/omb/budget>.
Table 491. Federal Budget Outlays for Defense Functions: 1990 to 2005
[In billions of dollars (299.3 represents $299,300,000,000), except percent. For year ending September 30. Minus sign (-)indicates decrease]
Defense function 1990 1995 1997 1998 1999 2000 2001 2002 2003 20042005,
est.
Total . . . . . . . . . . . . . . . . 299.3 272.1 270.5 268.5 274.9 294.5 305.5 348.6 404.9 455.9 465.9Percent change 1 . . . . . . -1.4 -3.4 1.8 -0.8 2.4 7.1 3.7 14.1 16.2 12.6 2.2
Defense Dept., military. . . . . . . . 289.8 259.4 258.3 256.1 261.3 281.2 291.0 332.0 387.3 436.5 443.9Military personnel . . . . . . . . . 75.6 70.8 69.7 69.0 69.5 76.0 74.0 86.8 106.7 113.6 110.0Operation, maintenance . . . . . 88.3 91.0 92.4 93.4 96.3 105.9 112.0 130.0 151.4 174.0 174.5Procurement. . . . . . . . . . . . . 81.0 55.0 47.7 48.2 48.8 51.7 55.0 62.5 67.9 76.2 80.2Research and development . . . 37.5 34.6 37.0 37.4 37.4 37.6 40.5 44.4 53.1 60.8 65.6Military construction . . . . . . . . 5.1 6.8 6.2 6.0 5.5 5.1 5.0 5.1 5.9 6.3 6.6Family housing . . . . . . . . . . . 3.5 3.6 4.0 3.9 3.7 3.4 3.5 3.7 3.8 3.9 3.9Other 2 . . . . . . . . . . . . . . . . -1.2 -2.4 1.2 -1.9 0.1 1.6 1.1 -0.5 -1.5 1.7 3.2
Atomic energy activities 3 . . . . . . 9.0 11.8 11.3 11.3 12.2 12.1 12.9 14.8 16.0 16.6 18.7Defense-related activities 4 . . . . . 0.6 0.9 1.0 1.1 1.4 1.2 1.6 1.8 1.6 2.8 3.3
1 Change from immediate prior year. 2 Revolving and management funds, trust funds, special foreign currency program,allowances, and offsetting receipts. 3 Defense activities only. 4 Includes civil defense activities.
Source: U.S. Office of Management and Budget, Budget of the United States Government, Historical Tables, annual. See also,<http://www.whitehouse.gov/omb/budget>.
Table 492. National Defense—Budget Authority and Outlays: 1990 to 2005
[In billions of dollars (303.3 represents $303,300,000,000). For year ending September 30.]
Item 1990 1995 1998 1999 2000 2001 2002 2003 20042005,
est.
Defense (Budget authority) 1 . . . . . . . . 303.3 266.4 271.3 292.3 304.1 335.5 362.1 456.2 490.6 423.6Department of Defense−Military . . . . 293.0 255.7 258.5 278.5 290.4 319.4 345.0 437.9 471.0 402.0Atomic energy defense activities1 . . . 9.7 10.1 11.7 12.4 12.4 14.3 15.2 16.4 16.8 18.0Defense-related activities. . . . . . . . . 0.6 0.6 1.1 1.4 1.3 1.7 1.9 2.0 2.8 3.2
Defense (outlays) 1 . . . . . . . . . . . . . . 299.3 272.1 268.5 274.9 294.5 305.5 348.6 404.9 455.9 465.9Department of Defense−Military . . . . 289.7 259.4 256.1 261.3 281.2 291.0 332.0 387.3 436.5 443.9Atomic energy defense activities 1. . . 9.0 11.8 11.3 12.2 12.1 12.9 14.8 16.0 16.6 18.7Defense-related activities. . . . . . . . . 0.6 0.9 1.1 1.4 1.2 1.6 1.8 1.6 2.8 3.3
1 Includes defense budget authority, balances, and outlays by other departments.Source: U.S. Office of Management and Budget, Budget of the U.S. Government, Historical Tables, annual. See also,
<http://www.whitehouse.gov/omb/budget>.
338 National Security and Veterans Affairs
U.S. Census Bureau, Statistical Abstract of the United States: 2006

Table 493. Military Prime Contract Awards to All Businesses by Program:1990 to 2004
[In billions of dollars (144.7 represents $144,700,000,000). Net values for year ending September 30. Includes all new primecontracts; debit or credit changes in contracts are also included. Actions cover official awards, amendments, or other changes inprime contracts to obtain military supplies, services, or construction. Excludes term contracts and contracts which do not obligatea firm total dollar amount or fixed quantity, but includes job orders, task orders, and delivery orders against such contracts]
DOD procurement program 1990 1995 1998 1999 2000 2001 2002 2003 2004
Total . . . . . . . . . . . . . . . . . . . . . . . . 144.7 131.4 128.8 135.2 143.0 154.1 180.6 219.5 241.0Intragovernmental 1 . . . . . . . . . . . . . . . . . 10.0 12.3 9.9 11.6 14.8 13.4 17.0 19.5 19.8For work outside the U.S. . . . . . . . . . . . . . 7.1 5.6 5.6 7.4 7.5 7.1 9.3 16.2 25.5Educ. and nonprofit institutions . . . . . . . . . . 3.5 3.3 3.5 3.9 4.3 4.5 5.5 6.2 6.4With business firms for work in the U.S. 2 . . . 123.8 110.0 109.7 112.2 116.4 129.2 148.8 177.7 189.3Major hard goods . . . . . . . . . . . . . . . . . . 79.1 56.0 56.0 57.5 59.8 67.9 76.1 90.6 99.0Aircraft . . . . . . . . . . . . . . . . . . . . . . . . 24.0 18.8 20.8 23.3 28.8 30.5 30.6 41.1 40.4Electronics and communication equip. . . . 18.5 12.3 10.7 10.7 9.5 10.9 13.0 14.9 18.5Missiles and space systems . . . . . . . . . . 17.1 10.6 9.9 9.5 8.2 8.2 11.2 13.3 14.6Ships . . . . . . . . . . . . . . . . . . . . . . . . . 10.3 9.1 8.6 7.8 8.3 12.0 11.4 10.2 12.3Tanks, ammo. and weapons . . . . . . . . . . 9.2 5.3 6.0 6.2 5.0 6.3 9.8 11.0 13.3
Services . . . . . . . . . . . . . . . . . . . . . . . . 14.6 18.6 21.2 23.7 24.0 25.9 33.2 43.1 45.4
1 Covers only purchases from other Federal agencies and reimbursable purchases on behalf of foreign governments.2 Includes Department of Defense. Includes other business not shown separately. Contracts awarded for work in U.S. possessions,and other areas subject to complete sovereignty of United States; contracts in a classified location; and any intragovernmentalcontracts entered into overseas.
Source: U.S. Department of Defense, Directorate for Information Operations and Reports, Prime Contract Awards,semiannual. See also <http://www.dior.whs.mil>.
Table 494. U.S. Military Sales and Assistance to Foreign Governments:1995 to 2003
[In millions of dollars (8,080 represents $8,080,000,000). For year ending September 30. Department of Defense (DoD) salesdeliveries cover deliveries against sales orders authorized under Arms Export Control Act, as well as earlier and applicablelegislation. For details regarding individual programs, see source]
Item 1995 1996 1997 1998 1999 2000 2001 2002 2003
Military sales agreements . . . . . . 8,080 9,070 8,234 8,379 11,158 10,952 12,788 12,236 12,700Military construction salesagreements . . . . . . . . . . . . . . . 24 135 29 474 301 283 124 72 221
Military sales deliveries 1 . . . . . . . 12,100 11,710 15,671 13,183 16,879 10,533 12,054 10,385 9,706Military sales financing . . . . . . . . 3,712 3,836 3,530 3,420 3,370 4,333 3,535 4,040 5,956Military assistance programs 2 . . . 117 355 91 95 268 86 41 46 257Military assistance programdelivery 3 . . . . . . . . . . . . . . . . 14 31 113 91 13 10 15 26 175
IMET program/deliveries 4 . . . . . . 26 39 43 50 50 50 58 70 79
1 Includes military construction sales deliveries. 2 Also includes Military Assistance Service Funded (MASF) program data,Section 506(a) drawdown authority, and MAP Merger Funds. 3 Includes Military Assistance Service Funded (MASF) programdata and Section 506(a) drawdown authority. 4 International Military Education & Training. Includes Military Assistance ServiceFunded and emergency drawdowns.
Source: U.S. Department of Defense, Defense Security Cooperation Agency, DSCA Data and Statistics. See also<http://www.dsca.osd.mil/datastats.htm>.
Table 495. U.S. Military Sales Deliveries by Selected Country: 1995 to 2003[In millions of dollars (12,100 represents $12,100,000,000). For year ending September 30. Represents Department ofDefense military sales]
Country 1995 1996 1997 1998 1999 2000 2001 2002 2003
Total 1. . . . . . . . . . . . . . . . 12,100 11,710 15,671 13,183 16,879 10,533 12,055 10,385 9,706Australia . . . . . . . . . . . . . . . . . . 303 223 196 207 269 330 245 156 200Bahrain . . . . . . . . . . . . . . . . . . 40 39 61 62 48 54 343 83 97Belgium . . . . . . . . . . . . . . . . . . 8 157 107 194 250 58 170 68 72Canada . . . . . . . . . . . . . . . . . . 127 154 83 111 96 84 110 85 164China. . . . . . . . . . . . . . . . . . . . 1,332 829 2,370 1,423 2,505 785 1,166 1,418 637Denmark. . . . . . . . . . . . . . . . . . 54 91 48 159 157 46 112 23 14Egypt . . . . . . . . . . . . . . . . . . . . 1,479 1,083 897 551 448 805 862 1,950 1,032France . . . . . . . . . . . . . . . . . . . 65 52 57 35 248 217 142 207 169Germany . . . . . . . . . . . . . . . . . 261 404 208 191 278 136 390 222 245Greece. . . . . . . . . . . . . . . . . . . 220 210 691 397 463 315 448 454 1,329Israel . . . . . . . . . . . . . . . . . . . . 327 386 456 1,195 1,214 562 741 650 829Italy . . . . . . . . . . . . . . . . . . . . . 54 77 51 43 106 41 97 103 188Japan . . . . . . . . . . . . . . . . . . . 693 753 488 409 442 477 494 476 411Jordan . . . . . . . . . . . . . . . . . . . 47 16 42 47 49 53 80 57 70Korea, South . . . . . . . . . . . . . . . 442 340 478 836 588 1,401 735 545 513Kuwait . . . . . . . . . . . . . . . . . . . 479 745 1,212 323 318 348 565 131 144Netherlands . . . . . . . . . . . . . . . 153 391 168 344 321 161 413 242 227Norway. . . . . . . . . . . . . . . . . . . 25 135 98 119 220 64 192 88 123Portugal . . . . . . . . . . . . . . . . . . 88 19 70 21 12 20 42 28 116Saudi Arabia . . . . . . . . . . . . . . . 3,567 2,835 4,639 3,800 4,686 2,047 1,943 1,314 1,133Singapore . . . . . . . . . . . . . . . . . 59 80 133 232 549 131 244 422 169Spain . . . . . . . . . . . . . . . . . . . . 193 411 216 133 324 141 267 178 160Thailand . . . . . . . . . . . . . . . . . . 356 269 151 144 133 114 119 169 132Turkey . . . . . . . . . . . . . . . . . . . 368 481 1,153 532 856 217 466 280 498United Arab Emirates . . . . . . . . . 345 112 93 26 95 70 24 92 90United Kingdom . . . . . . . . . . . . . 419 401 432 430 366 347 525 386 364
1 Includes countries not shown.Source: U.S. Department of Defense, Defense Security Cooperation Agency, DSCA Data and Statistics. See also
<http://www.dsca.osd.mil/datastats.htm>.
National Security and Veterans Affairs 339
U.S. Census Bureau, Statistical Abstract of the United States: 2006
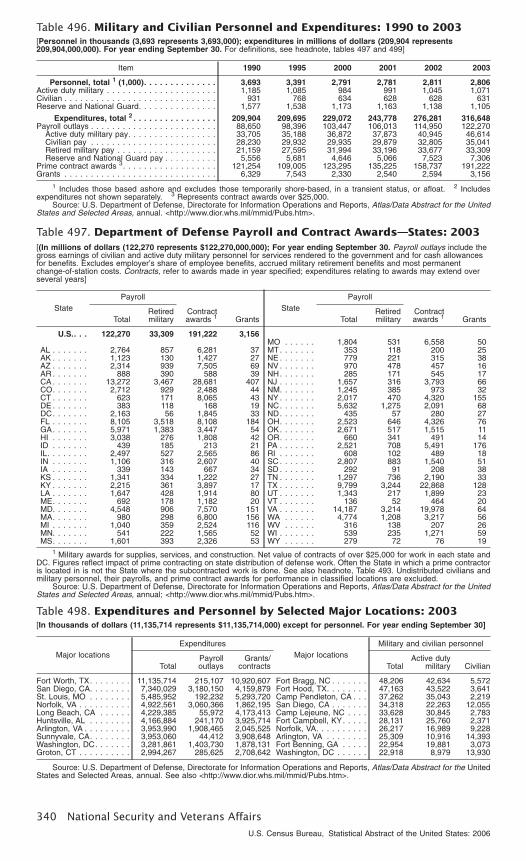
Table 496. Military and Civilian Personnel and Expenditures: 1990 to 2003[Personnel in thousands (3,693 represents 3,693,000); expenditures in millions of dollars (209,904 represents209,904,000,000). For year ending September 30. For definitions, see headnote, tables 497 and 499]
Item 1990 1995 2000 2001 2002 2003
Personnel, total 1 (1,000). . . . . . . . . . . . . . 3,693 3,391 2,791 2,781 2,811 2,806Active duty military . . . . . . . . . . . . . . . . . . . . . 1,185 1,085 984 991 1,045 1,071Civilian . . . . . . . . . . . . . . . . . . . . . . . . . . . . . 931 768 634 628 628 631Reserve and National Guard. . . . . . . . . . . . . . . 1,577 1,538 1,173 1,163 1,138 1,105
Expenditures, total 2 . . . . . . . . . . . . . . . . 209,904 209,695 229,072 243,778 276,281 316,648Payroll outlays . . . . . . . . . . . . . . . . . . . . . . . . 88,650 98,396 103,447 106,013 114,950 122,270
Active duty military pay. . . . . . . . . . . . . . . . . 33,705 35,188 36,872 37,873 40,945 46,614Civilian pay . . . . . . . . . . . . . . . . . . . . . . . . 28,230 29,932 29,935 29,879 32,805 35,041Retired military pay . . . . . . . . . . . . . . . . . . . 21,159 27,595 31,994 33,196 33,677 33,309Reserve and National Guard pay . . . . . . . . . . 5,556 5,681 4,646 5,066 7,523 7,306
Prime contract awards 3. . . . . . . . . . . . . . . . . . 121,254 109,005 123,295 135,225 158,737 191,222Grants . . . . . . . . . . . . . . . . . . . . . . . . . . . . . 6,329 7,543 2,330 2,540 2,594 3,156
1 Includes those based ashore and excludes those temporarily shore-based, in a transient status, or afloat. 2 Includesexpenditures not shown separately. 3 Represents contract awards over $25,000.
Source: U.S. Department of Defense, Directorate for Information Operations and Reports, Atlas/Data Abstract for the UnitedStates and Selected Areas, annual. <http://www.dior.whs.mil/mmid/Pubs.htm>.
Table 497. Department of Defense Payroll and Contract Awards—States: 2003[(In millions of dollars (122,270 represents $122,270,000,000); For year ending September 30. Payroll outlays include thegross earnings of civilian and active duty military personnel for services rendered to the government and for cash allowancesfor benefits. Excludes employer’s share of employee benefits, accrued military retirement benefits and most permanentchange-of-station costs. Contracts, refer to awards made in year specified; expenditures relating to awards may extend overseveral years]
StatePayroll
Contractawards 1 GrantsTotal
Retiredmilitary
U.S.. . . 122,270 33,309 191,222 3,156
AL . . . . . . . 2,764 857 6,281 37AK . . . . . . . 1,123 130 1,427 27AZ . . . . . . . 2,314 939 7,505 69AR . . . . . . . 888 390 588 39CA . . . . . . . 13,272 3,467 28,681 407CO. . . . . . . 2,712 929 2,488 44CT . . . . . . . 623 171 8,065 43DE . . . . . . . 383 118 168 19DC. . . . . . . 2,163 56 1,845 33FL . . . . . . . 8,105 3,518 8,108 184GA. . . . . . . 5,971 1,383 3,447 54HI . . . . . . . 3,038 276 1,808 42ID . . . . . . . 439 185 213 21IL. . . . . . . . 2,497 527 2,565 86IN . . . . . . . 1,106 316 2,607 40IA . . . . . . . 339 143 667 34KS . . . . . . . 1,341 334 1,222 27KY . . . . . . . 2,215 361 3,897 17LA . . . . . . . 1,647 428 1,914 80ME. . . . . . . 692 178 1,182 20MD. . . . . . . 4,548 906 7,570 151MA. . . . . . . 980 298 6,800 156MI . . . . . . . 1,040 359 2,524 116MN. . . . . . . 541 222 1,565 52MS. . . . . . . 1,601 393 2,326 53
StatePayroll
Contractawards 1 GrantsTotal
Retiredmilitary
MO . . . . . . 1,804 531 6,558 50MT. . . . . . . 353 118 200 25NE . . . . . . . 779 221 315 38NV . . . . . . . 970 478 457 16NH. . . . . . . 285 171 545 17NJ . . . . . . . 1,657 316 3,793 66NM. . . . . . . 1,245 385 973 32NY . . . . . . . 2,017 470 4,320 155NC. . . . . . . 5,632 1,275 2,091 68ND. . . . . . . 435 57 280 27OH. . . . . . . 2,523 646 4,326 76OK. . . . . . . 2,671 517 1,515 11OR. . . . . . . 660 341 491 14PA . . . . . . . 2,521 708 5,491 176RI . . . . . . . 608 102 489 18SC . . . . . . . 2,807 883 1,540 51SD . . . . . . . 292 91 208 38TN . . . . . . . 1,297 736 2,190 33TX . . . . . . . 9,799 3,244 22,868 128UT . . . . . . . 1,343 217 1,899 23VT . . . . . . . 136 52 464 20VA . . . . . . . 14,187 3,214 19,978 64WA . . . . . . 4,774 1,208 3,217 56WV . . . . . . 316 138 207 26WI . . . . . . . 539 235 1,271 59WY . . . . . . 279 72 76 19
1 Military awards for supplies, services, and construction. Net value of contracts of over $25,000 for work in each state andDC. Figures reflect impact of prime contracting on state distribution of defense work. Often the State in which a prime contractoris located in is not the State where the subcontracted work is done. See also headnote, Table 493. Undistributed civilians andmilitary personnel, their payrolls, and prime contract awards for performance in classified locations are excluded.
Source: U.S. Department of Defense, Directorate for Information Operations and Reports, Atlas/Data Abstract for the UnitedStates and Selected Areas, annual; <http://www.dior.whs.mil/mmid/Pubs.htm>.
Table 498. Expenditures and Personnel by Selected Major Locations: 2003[In thousands of dollars (11,135,714 represents $11,135,714,000) except for personnel. For year ending September 30]
Major locationsExpenditures
Major locationsMilitary and civilian personnel
TotalPayrolloutlays
Grants/contracts Total
Active dutymilitary Civilian
Fort Worth, TX. . . . . . . . 11,135,714 215,107 10,920,607 Fort Bragg, NC . . . . . . . 48,206 42,634 5,572San Diego, CA. . . . . . . . 7,340,029 3,180,150 4,159,879 Fort Hood, TX. . . . . . . . 47,163 43,522 3,641St. Louis, MO . . . . . . . . 5,485,952 192,232 5,293,720 Camp Pendleton, CA . . . 37,262 35,043 2,219Norfolk, VA . . . . . . . . . . 4,922,561 3,060,366 1,862,195 San Diego, CA . . . . . . . 34,318 22,263 12,055Long Beach, CA . . . . . . 4,229,385 55,972 4,173,413 Camp Lejeune, NC . . . . 33,628 30,845 2,783Huntsville, AL . . . . . . . . 4,166,884 241,170 3,925,714 Fort Campbell, KY. . . . . 28,131 25,760 2,371Arlington, VA . . . . . . . . . 3,953,990 1,908,465 2,045,525 Norfolk, VA. . . . . . . . . . 26,217 16,989 9,228Sunnyvale, CA. . . . . . . . 3,953,060 44,412 3,908,648 Arlington, VA . . . . . . . . 25,309 10,916 14,393Washington, DC. . . . . . . 3,281,861 1,403,730 1,878,131 Fort Benning, GA . . . . . 22,954 19,881 3,073Groton, CT . . . . . . . . . . 2,994,267 285,625 2,708,642 Washington, DC . . . . . . 22,918 8,979 13,930
Source: U.S. Department of Defense, Directorate for Information Operations and Reports, Atlas/Data Abstract for the UnitedStates and Selected Areas, annual. See also <http://www.dior.whs.mil/mmid/Pubs.htm>.
340 National Security and Veterans Affairs
U.S. Census Bureau, Statistical Abstract of the United States: 2006

Table 499. Military and Civilian Personnel in Installations: 2003
[As of September 30. Civilian employees include United States citizens and foreign national direct- hire civilians subject to Officeof Management and Budget (OMB) ceiling controls and civilian personnel involved in civil functions in the United States. Excludesindirect-hire civilians and those direct-hire civilians not subject to OMB ceiling controls. Military personnel include active duty per-sonnel based ashore, excludes personnel temporarily shore-based in a transient status, or afloat]
State
Active military personnel Reserveand
NationalGuard,
total
Civilian personnel
Total 1 Army
Navy/MarineCorps Air Force Total 1 Army
Navy/MarineCorps Air Force
United States. . . . . 1,070,511 394,550 364,990 310,971 1,104,669 630,567 216,642 177,008 153,107
Alabama . . . . . . . . . . 10,815 6,018 740 4,057 28,615 20,672 16,791 41 2,408Alaska . . . . . . . . . . . 16,282 6,327 117 9,838 5,638 4,549 2,433 16 1,746Arizona . . . . . . . . . . . 24,156 5,524 6,248 12,384 17,800 8,618 3,801 441 3,350Arkansas. . . . . . . . . . 5,283 365 133 4,785 15,961 3,937 2,916 6 891California. . . . . . . . . . 130,473 8,145 101,670 20,658 90,800 57,631 7,139 32,745 10,213
Colorado . . . . . . . . . . 31,386 16,471 931 13,984 20,004 10,122 2,645 41 5,077Connecticut . . . . . . . . 4,215 47 4,136 32 9,618 2,534 501 1,110 262Delaware. . . . . . . . . . 3,898 2 40 3,856 6,087 1,477 255 - 1,152District of Columbia . . . 11,942 4,754 3,980 3,208 8,958 15,483 4,530 9,731 934Florida . . . . . . . . . . . 55,820 3,485 26,510 25,825 50,304 27,369 3,223 12,481 8,789Georgia . . . . . . . . . . 68,016 52,424 4,945 10,647 38,088 30,588 10,701 3,993 13,653
Hawaii . . . . . . . . . . . 34,203 15,985 13,542 4,676 11,398 16,602 4,304 9,293 1,961Idaho . . . . . . . . . . . . 4,353 41 89 4,223 6,796 1,451 655 46 692Illinois . . . . . . . . . . . . 28,068 655 21,600 5,813 35,735 12,782 6,430 1,705 3,180Indiana . . . . . . . . . . . 1,104 526 457 121 24,244 9,032 1,812 3,285 1,070Iowa. . . . . . . . . . . . . 425 255 126 44 15,508 1,569 1,015 5 503
Kansas . . . . . . . . . . . 16,547 13,264 163 3,120 14,962 5,925 4,456 1 1,098Kentucky. . . . . . . . . . 35,177 34,586 377 214 16,576 8,423 6,821 198 250Louisiana . . . . . . . . . 17,827 9,545 2,095 6,187 26,252 6,979 3,606 1,240 1,735Maine . . . . . . . . . . . . 2,764 245 2,484 35 6,812 6,267 339 5,250 273Maryland. . . . . . . . . . 30,649 7,138 15,640 7,871 24,598 31,913 12,253 15,395 2,238
Massachusetts . . . . . . 2,476 242 557 1,677 20,794 6,702 2,413 263 2,896Michigan . . . . . . . . . . 1,372 442 791 139 24,895 7,945 5,008 24 1,169Minnesota . . . . . . . . . 763 273 402 88 22,287 2,622 1,557 18 830Mississippi. . . . . . . . . 14,620 395 5,463 8,762 20,404 9,346 3,652 2,519 2,867Missouri . . . . . . . . . . 15,685 9,358 2,227 4,100 26,935 9,131 5,837 256 1,204
Montana . . . . . . . . . . 3,713 25 17 3,671 5,813 1,217 481 - 684Nebraska . . . . . . . . . 7,449 121 563 6,765 8,797 3,713 1,415 16 1,908Nevada. . . . . . . . . . . 9,081 114 1,098 7,869 6,544 2,075 341 311 1,234New Hampshire . . . . . 347 11 276 60 5,114 1,061 567 46 285New Jersey . . . . . . . . 6,818 1,129 824 4,865 22,003 13,776 9,301 2,092 1,546
New Mexico. . . . . . . . 11,731 248 191 11,292 7,779 6,808 2,982 38 3,320New York . . . . . . . . . 21,450 17,715 3,297 438 45,047 11,149 6,891 156 2,556North Carolina . . . . . . 96,560 42,701 43,840 10,019 31,253 16,742 6,160 7,329 1,276North Dakota . . . . . . . 7,740 21 28 7,691 5,470 1,747 527 2 1,126Ohio. . . . . . . . . . . . . 7,069 463 618 5,988 38,987 21,865 1,344 70 12,322
Oklahoma . . . . . . . . . 23,508 12,801 1,461 9,246 19,768 21,961 4,547 84 15,942Oregon . . . . . . . . . . . 808 220 511 77 14,072 3,185 2,270 21 866Pennsylvania . . . . . . . 3,423 1,121 2,037 265 48,013 24,777 8,269 7,711 1,544Rhode Island . . . . . . . 2,605 82 2,444 79 5,963 4,483 302 3,863 231South Carolina . . . . . . 37,184 10,429 16,873 9,882 23,131 9,522 2,897 3,617 1,787
South Dakota. . . . . . . 3,608 63 6 3,539 5,763 1,216 514 1 653Tennessee. . . . . . . . . 2,648 327 2,084 237 25,343 5,338 2,619 1,000 975Texas . . . . . . . . . . . . 114,196 63,861 7,657 42,678 76,523 38,018 18,205 1,536 14,389Utah. . . . . . . . . . . . . 5,613 304 206 5,103 13,639 14,608 2,343 24 11,422Vermont . . . . . . . . . . 53 11 28 14 4,657 590 316 1 238
Virginia . . . . . . . . . . . 92,683 25,708 53,010 13,965 37,597 77,825 19,931 34,348 4,334Washington . . . . . . . . 39,387 20,071 11,946 7,370 27,633 23,397 5,869 14,543 1,917West Virginia . . . . . . . 561 206 311 44 10,682 1,834 1,286 86 439Wisconsin . . . . . . . . . 564 280 200 84 21,623 2,957 1,960 10 892Wyoming. . . . . . . . . . 3,393 6 1 3,386 3,386 1,034 212 - 780
- Represents zero. 1 Includes Other Defense Activities (ODA) not shown separately.
Source: U.S. Department of Defense, Directorate for Information Operations and Reports, Selected Manpower Statistics,annual; <http://www.dior.whs.mil/mmid/Pubs.htm>.
Table 500. Military Personnel on Active Duty by Location: 1980 to 2004
[In thousands (2,051 represents 2,051,000). As of September 30]
Location 1980 1985 1990 1995 1999 2000 2001 2002 2003 2004
Total . . . . . . . . . . . . . . 2,051 2,151 2,046 1,518 1,386 1,384 1,385 1,412 1,434 1,427
Shore-based 1 . . . . . . . . . . . 1,840 1,920 1,794 1,351 1,241 1,237 1,244 1,262 1,287 1,291Afloat 2. . . . . . . . . . . . . . . . 211 231 252 167 145 147 141 150 148 136United States 3 . . . . . . . . . . 1,562 1,636 1,437 1,280 1,133 1,127 1,130 1,181 1,182 1,139Foreign countries . . . . . . . . . 489 515 609 238 253 258 255 230 253 288
1 Includes Navy personnel temporarily on shore. 2 Includes Marine Corps. 3 Includes Puerto Rico and Island areas.
Source: U.S. Department of Defense, Directorate for Information Operations and Reports, Selected Manpower Statistics,annual; <http://www.dior.whs.mil/mmid/Pubs.htm>.
National Security and Veterans Affairs 341
U.S. Census Bureau, Statistical Abstract of the United States: 2006

Table 501. Department of Defense Personnel: 1950 to 2004
[In thousands (1,459 represents 1,459,000.) As of end of fiscal year, see text, Section 8. Includes National Guard, Reserve, and retired regular personnel on extended or continuous active duty. Excludes CoastGuard. Other officer candidates are included under enlisted personnel]
Year
Total 1, 2
Army Navy 2 Marine Corps Air Force
Total 1
Male Female
Total 1
Male Female
Total 1
Male Female
Total 1
Male Female
Officers Enlisted Officers Enlisted Officers Enlisted Officers Enlisted Officers Enlisted Officers Enlisted Officers Enlisted Officers Enlisted
1950 . . . . . 1,459 593 69 512 4.4 6.6 381 43 330 2.4 2.7 74 7 66 - 0.5 411 55 350 1.5 3.81955 . . . . . 2,935 1,109 117 978 5.2 7.7 661 72 577 2.9 5.7 205 18 185 0.1 2.1 960 134 815 3.1 8.31960 . . . . . 2,475 873 97 762 4.3 8.3 617 67 540 2.7 5.4 171 16 153 0.1 1.5 815 126 677 3.7 5.71965 . . . . . 2,654 969 108 846 3.8 8.5 670 75 583 2.6 5.3 190 17 172 0.1 1.4 825 128 685 4.1 4.71970 . . . . . 3,065 1,323 162 1,142 5.2 11.5 691 78 600 2.9 5.8 260 25 233 0.3 2.1 791 125 648 4.7 9.0
1975 . . . . . 2,128 784 98 640 4.6 37.7 535 62 449 3.7 17.5 196 19 174 0.3 2.8 613 100 478 5.0 25.21976 . . . . . 2,082 779 94 634 4.8 43.8 525 60 439 3.5 19.3 192 19 171 0.4 3.1 585 95 452 5.0 29.21977 . . . . . 2,075 782 92 634 5.7 46.1 530 59 443 3.8 19.5 192 19 169 0.4 3.5 571 91 435 5.4 34.61978 . . . . . 2,062 772 92 619 6.3 50.5 530 59 442 4.0 21.3 191 18 167 0.4 4.7 570 89 429 6.0 41.11979 . . . . . 2,027 759 90 602 6.9 55.2 523 58 432 4.4 25.0 185 18 161 0.5 5.5 560 89 413 7.3 46.4
1980 . . . . . 2,051 777 91 612 7.6 61.7 527 58 430 4.9 30.1 189 18 164 0.5 6.2 558 90 404 8.5 51.91981 . . . . . 2,083 781 94 610 8.3 65.3 540 60 435 5.3 34.6 191 17 165 0.5 7.1 570 90 413 9.1 54.41982 . . . . . 2,109 780 94 609 9.0 64.1 553 61 444 5.7 37.3 192 18 165 0.6 7.9 583 92 421 9.9 54.51983 . . . . . 2,123 780 97 602 9.5 66.5 558 62 444 6.3 40.8 194 19 166 0.6 8.3 592 94 428 10.6 55.31984 . . . . . 2,138 780 98 601 10.2 67.1 565 62 448 6.6 42.6 196 19 167 0.6 8.6 597 95 430 11.2 55.9
1985 . . . . . 2,151 781 99 599 10.8 68.4 571 64 449 6.9 45.7 198 19 169 0.7 9.0 602 96 431 11.9 58.11986 . . . . . 2,169 781 99 597 11.3 69.7 581 65 457 7.3 47.2 200 19 170 0.6 9.2 608 97 434 12.4 61.21987 . . . . . 2,174 781 96 596 11.6 71.6 587 65 462 7.2 47.7 200 19 170 0.6 9.1 607 94 432 12.6 63.21988 . . . . . 2,138 772 95 588 11.8 72.0 593 65 466 7.3 49.7 197 19 168 0.7 9.0 576 92 405 12.9 61.51989 . . . . . 2,130 770 95 584 12.2 74.3 593 65 464 7.5 52.1 197 19 168 0.7 9.0 571 91 399 13.4 63.7
1990 . . . . . 2,044 732 92 553 12.4 71.2 579 64 451 7.8 52.1 197 19 168 0.7 8.7 535 87 370 13.3 60.81991 . . . . . 1,986 711 91 535 12.5 67.8 570 63 444 8.0 51.4 194 19 166 0.7 8.3 510 84 350 13.3 59.11992 . . . . . 1,807 610 83 449 11.7 61.7 542 61 417 8.3 51.0 185 18 157 0.6 7.9 470 77 320 12.7 56.11993 . . . . . 1,705 572 77 420 11.1 60.2 510 58 390 8.3 49.3 178 17 153 0.6 7.2 444 72 302 12.3 54.51994 . . . . . 1,610 541 74 394 10.9 59.0 469 54 355 8.0 47.9 174 17 149 0.6 7.0 426 69 287 12.3 54.0
1995 . . . . . 1,518 509 72 365 10.8 57.3 435 51 324 7.9 47.9 175 17 150 0.7 7.4 400 66 266 12.1 52.11996 . . . . . 1,472 491 70 347 10.6 59.0 417 50 308 7.8 46.9 175 17 149 0.8 7.8 389 64 256 12.0 52.81997 . . . . . 1,439 492 69 346 10.4 62.4 396 48 290 7.8 44.8 174 17 148 0.8 8.5 377 62 246 12.0 53.81998 . . . . . 1,407 484 68 340 10.4 61.4 382 47 280 7.8 42.9 173 17 146 0.9 8.9 368 60 237 12.0 54.21999 . . . . . 1,386 479 67 337 10.5 61.5 373 46 271 7.7 43.9 173 17 145 0.9 9.3 361 58 232 11.8 54.6
2000 . . . . . 1,384 482 66 339 10.8 62.9 373 46 272 7.8 43.8 173 17 146 0.9 9.5 356 57 227 11.8 55.02001 . . . . . 1,385 481 65 337 11.0 63.4 378 46 273 8.0 46.6 173 17 145 1.0 9.6 354 57 224 12.0 55.62002 . . . . . 1,414 487 66 341 11.5 63.2 385 47 279 8.2 47.3 174 17 146 1.0 9.5 368 59 233 12.9 58.62003 . . . . . 1,434 499 68 352 12.0 63.5 382 47 276 8.2 47.3 178 18 149 1.1 9.6 375 61 237 13.5 60.02004 . . . . . 1,427 500 69 358 12.3 61.0 373 46 273 8.1 46.1 178 18 149 1.1 9.7 377 61 242 13.6 60.2
- Rounds to zero. 1 Includes cadets, midshipmen and other not shown separately. 2 Beginning 1980, excludes Navy Reserve personnel on active duty for Training and Administration of Reserves (TARS).
Source: U.S. Department of Defense, Selected Manpower Statistics, annual. See also <http://www.dior.whs.mil/mmid/pubs.htm>.
34
2N
ational
Security
and
Veteran
sA
ffairs
U.S
.C
ensusB
ureau,S
tatisticalAbstract
ofthe
United
States:
2006
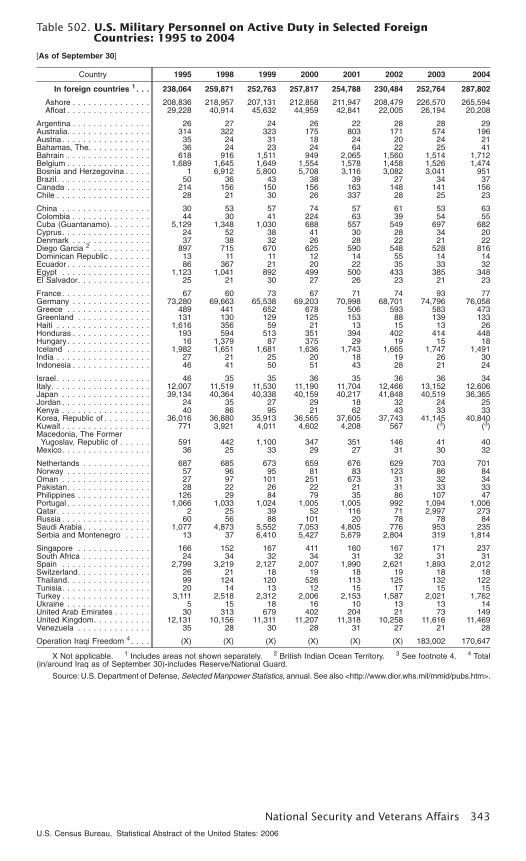
Table 502. U.S. Military Personnel on Active Duty in Selected ForeignCountries: 1995 to 2004
[As of September 30]
Country 1995 1998 1999 2000 2001 2002 2003 2004
In foreign countries 1 . . . 238,064 259,871 252,763 257,817 254,788 230,484 252,764 287,802
Ashore . . . . . . . . . . . . . . . 208,836 218,957 207,131 212,858 211,947 208,479 226,570 265,594Afloat . . . . . . . . . . . . . . . . 29,228 40,914 45,632 44,959 42,841 22,005 26,194 20,208
Argentina . . . . . . . . . . . . . . . 26 27 24 26 22 28 28 29Australia. . . . . . . . . . . . . . . . 314 322 323 175 803 171 574 196Austria . . . . . . . . . . . . . . . . . 35 24 31 18 24 20 24 21Bahamas, The. . . . . . . . . . . . 36 24 23 24 64 22 25 41Bahrain . . . . . . . . . . . . . . . . 618 916 1,511 949 2,065 1,560 1,514 1,712Belgium . . . . . . . . . . . . . . . . 1,689 1,645 1,649 1,554 1,578 1,458 1,526 1,474Bosnia and Herzegovina . . . . . 1 6,912 5,800 5,708 3,116 3,082 3,041 951Brazil. . . . . . . . . . . . . . . . . . 50 36 43 38 39 27 34 37Canada . . . . . . . . . . . . . . . . 214 156 150 156 163 148 141 156Chile . . . . . . . . . . . . . . . . . . 28 21 30 26 337 28 25 23
China . . . . . . . . . . . . . . . . . 30 53 57 74 57 61 53 63Colombia . . . . . . . . . . . . . . . 44 30 41 224 63 39 54 55Cuba (Guantanamo). . . . . . . . 5,129 1,348 1,030 688 557 549 697 682Cyprus. . . . . . . . . . . . . . . . . 24 52 38 41 30 28 34 20Denmark . . . . . . . . . . . . . . . 37 38 32 26 28 22 21 22Diego Garcia 2 . . . . . . . . . . . 897 715 670 625 590 548 528 816Dominican Republic . . . . . . . . 13 11 11 12 14 55 14 14Ecuador . . . . . . . . . . . . . . . . 86 367 21 20 22 35 33 32Egypt . . . . . . . . . . . . . . . . . 1,123 1,041 892 499 500 433 385 348El Salvador. . . . . . . . . . . . . . 25 21 30 27 26 23 21 23
France. . . . . . . . . . . . . . . . . 67 60 73 67 71 74 93 77Germany . . . . . . . . . . . . . . . 73,280 69,663 65,538 69,203 70,998 68,701 74,796 76,058Greece . . . . . . . . . . . . . . . . 489 441 652 678 506 593 583 473Greenland . . . . . . . . . . . . . . 131 130 129 125 153 88 139 133Haiti . . . . . . . . . . . . . . . . . . 1,616 356 59 21 13 15 13 26Honduras . . . . . . . . . . . . . . . 193 594 513 351 394 402 414 448Hungary. . . . . . . . . . . . . . . . 16 1,379 87 375 29 19 15 18Iceland . . . . . . . . . . . . . . . . 1,982 1,651 1,681 1,636 1,743 1,665 1,747 1,491India . . . . . . . . . . . . . . . . . . 27 21 25 20 18 19 26 30Indonesia . . . . . . . . . . . . . . . 46 41 50 51 43 28 21 24
Israel . . . . . . . . . . . . . . . . . . 46 35 35 36 35 36 36 34Italy. . . . . . . . . . . . . . . . . . . 12,007 11,519 11,530 11,190 11,704 12,466 13,152 12,606Japan . . . . . . . . . . . . . . . . . 39,134 40,364 40,338 40,159 40,217 41,848 40,519 36,365Jordan . . . . . . . . . . . . . . . . . 24 35 27 29 18 32 24 25Kenya . . . . . . . . . . . . . . . . . 40 86 95 21 62 43 33 33Korea, Republic of . . . . . . . . . 36,016 36,880 35,913 36,565 37,605 37,743 41,145 40,840Kuwait . . . . . . . . . . . . . . . . . 771 3,921 4,011 4,602 4,208 567 (3) (3)Macedonia, The FormerYugoslav, Republic of . . . . . . 591 442 1,100 347 351 146 41 40
Mexico. . . . . . . . . . . . . . . . . 36 25 33 29 27 31 30 32
Netherlands . . . . . . . . . . . . . 687 685 673 659 676 629 703 701Norway . . . . . . . . . . . . . . . . 57 96 95 81 83 123 86 84Oman . . . . . . . . . . . . . . . . . 27 97 101 251 673 31 32 34Pakistan. . . . . . . . . . . . . . . . 28 22 26 22 21 31 33 33Philippines . . . . . . . . . . . . . . 126 29 84 79 35 86 107 47Portugal . . . . . . . . . . . . . . . . 1,066 1,033 1,024 1,005 1,005 992 1,094 1,006Qatar. . . . . . . . . . . . . . . . . . 2 25 39 52 116 71 2,997 273Russia . . . . . . . . . . . . . . . . . 60 56 88 101 20 78 78 84Saudi Arabia . . . . . . . . . . . . . 1,077 4,873 5,552 7,053 4,805 776 953 235Serbia and Montenegro . . . . . 13 37 6,410 5,427 5,679 2,804 319 1,814
Singapore . . . . . . . . . . . . . . 166 152 167 411 160 167 171 237South Africa . . . . . . . . . . . . . 24 34 32 34 31 32 31 31Spain . . . . . . . . . . . . . . . . . 2,799 3,219 2,127 2,007 1,990 2,621 1,893 2,012Switzerland. . . . . . . . . . . . . . 26 21 18 19 18 19 18 18Thailand. . . . . . . . . . . . . . . . 99 124 120 526 113 125 132 122Tunisia. . . . . . . . . . . . . . . . . 20 14 13 12 15 17 15 15Turkey . . . . . . . . . . . . . . . . . 3,111 2,518 2,312 2,006 2,153 1,587 2,021 1,762Ukraine . . . . . . . . . . . . . . . . 5 15 18 16 10 13 13 14United Arab Emirates . . . . . . . 30 313 679 402 204 21 73 149United Kingdom. . . . . . . . . . . 12,131 10,156 11,311 11,207 11,318 10,258 11,616 11,469Venezuela . . . . . . . . . . . . . . 35 28 30 28 31 27 21 28
Operation Iraqi Freedom 4 . . . . (X) (X) (X) (X) (X) (X) 183,002 170,647
X Not applicable. 1 Includes areas not shown separately. 2 British Indian Ocean Territory. 3 See footnote 4. 4 Total(in/around Iraq as of September 30)-includes Reserve/National Guard.
Source: U.S. Department of Defense, Selected Manpower Statistics, annual. See also <http://www.dior.whs.mil/mmid/pubs.htm>.
National Security and Veterans Affairs 343
U.S. Census Bureau, Statistical Abstract of the United States: 2006

Table 503. U.S. Active Duty Military Deaths by Manner of Death: 1980 to 2004
[As of end of Dec. 31. Table reflects addition of calendar years 2003-2004 data and updates to death figures throughout.
Manner of death 1980-2004 1980 1990 1995 1997 1998 1999 2000 2001 2002 2003 2004
Deaths, total . . . . . . 38,503 2,392 1,507 1,040 817 827 796 758 891 999 1,410 1,887
Accident . . . . . . . . . . . . 21,757 1,556 880 538 433 445 436 398 437 547 560 565Hostile action. . . . . . . . . 1,331 - - - - - - - 3 18 344 737Homicide . . . . . . . . . . . 1,995 174 74 67 42 26 37 34 49 51 41 40Illness . . . . . . . . . . . . . 6,956 419 277 174 170 168 150 138 185 190 232 252Pending . . . . . . . . . . . . 210 - - - - 10 13 - 1 6 17 163Self-inflicted . . . . . . . . . 5,353 231 232 250 159 161 145 151 140 160 197 126Terrorist attack. . . . . . . . 426 1 1 7 - 3 - 17 55 - - -Undetermined . . . . . . . . 475 11 43 4 13 14 15 20 21 27 19 4
- Represents zero.
Source: U.S. Department of Defense, Directorate for Information Operations and Reports, Statistical Information AnalysisDivision, Personnel; <http://www.dior.whs.mil/mmid/casualty/castop.htm> (released 8 July 2005).
Table 504. Armed Forces Personnel—Summary of Major Conflicts
[For Revolutionary War, number of personnel serving not known, but estimates range from 184,000 to 250,000; for War of 1812,286,730 served; for Mexican War, 78,718 served. Dates of the major conflicts may differ from those specified in various lawsproviding benefits for veterans]
Item Unit Civil War 1WorldWar I
WorldWar II
Koreanconflict
Vietnamconflict
PersianGulf War
Personnel serving 2. . . . . . . . . . . . . 1,000 . . . . 2,213 4,735 316,113 45,720 58,744 2,233Average duration of service . . . . . . . Months . . . 20 12 33 19 23 (NA)Service abroad: Personnel serving. . . Percent . . . (NA) 53 73 656 (NA) (NA)Average duration 7 . . . . . . . . . . . . . Months . . . (NA) 6 16 13 (NA) (NA)Casualties: 8 Battle deaths 2 . . . . . . . 1,000 . . . . 140 53 292 34 947 (Z)Other deaths . . . . . . . . . . . . . . . . . 1,000 . . . . 224 63 114 3 11 (Z)
Wounds not mortal 2 . . . . . . . . . . 1,000 . . . . 282 204 671 103 9153 (Z)Draftees: Classified . . . . . . . . . . . . . 1,000 . . . . 777 24,234 36,677 9,123 575,717 (X)
Examined . . . . . . . . . . . . . . . . . 1,000 . . . . 522 3,764 17,955 3,685 58,611 (X)Rejected . . . . . . . . . . . . . . . . . . 1,000 . . . . 160 803 6,420 1,189 53,880 (X)Inducted . . . . . . . . . . . . . . . . . . 1,000 . . . . 46 2,820 10,022 1,560 51,759 (X)
NA Not available. X Not applicable. Z Fewer than 500. 1 Union forces only. Estimates of the number serving inConfederate forces range from 600,000 to 1.5 million. 2 Source: U.S. Department of Defense, Selected Manpower Statistics,annual. 3 Covers Dec. 1, 1941, to Dec. 31, 1946. 4 Covers June 25, 1950, to July 27, 1953. 5 Covers Aug. 4, 1964, to Jan.27, 1973. 6 Excludes Navy. Covers July 1950, through Jan. 1955. Far East area only. 7 During hostilities only. 8 For periodscovered, see footnotes 3, 4, and 5. 9 Covers Jan.1, 1961, to Jan. 27, 1973. Includes known military service personnel who havedied from combat related wounds.
Source: Except as noted, the President’s Commission on Veterans’ Pensions, Veterans’ Benefits in the United States, Vol. I,1956; and U.S. Department of Defense, unpublished data; <http://www.dior.whs.mil/mmid/casualty/castop.htm>.
Table 505. Military Personnel on Active Duty by Rank or Grade: 1990 to 2004
[In thousands (2,043.7 represents 2,043,700). As of Sept. 30]
Rank/grade 1990 1995 2000 2001 2002 2003 2004
Total . . . . . . . . . . . . . . . . . . . . 2,043.7 1,518.2 1,384.3 1,385.1 1,411.6 1,434.4 1,426.8
General-Admiral . . . . . . . . . . . . . . . . (Z) (Z) (Z) (Z) (Z) (Z) (Z)Lieutenant General-Vice Admiral . . . . . 0.1 0.1 0.1 0.1 0.1 0.1 0.1Major General-Rear Admiral (U) . . . . . 0.4 0.3 0.3 0.3 0.3 0.3 0.3Brigadier General-Rear Admiral (L) . . . 0.5 0.4 0.4 0.4 0.4 0.4 0.4Colonel-Captain . . . . . . . . . . . . . . . . 14.0 11.7 11.3 11.2 11.4 11.6 11.5Lieutenant Colonel-Commander . . . . . 32.3 28.7 27.5 27.2 28.2 28.5 28.4Major-Lieutenant Commander. . . . . . . 53.2 43.9 43.2 43.1 43.6 44.1 44.0Captain-Lieutenant . . . . . . . . . . . . . . 106.6 84.3 68.1 66.0 66.5 68.1 69.51st Lieutenant-Lieutenant (JG) . . . . . . 37.9 26.1 24.7 25.7 28.1 29.9 31.12nd Lieutenant-Ensign . . . . . . . . . . . 31.9 25.6 26.4 28.1 29.0 29.1 26.9
Chief Warrant Officer W-5 . . . . . . . . . (Z) (Z) 0.1 0.1 0.1 0.1 0.1Chief Warrant Officer W-4 . . . . . . . . . 3.0 2.2 2.0 1.9 2.0 2.1 1.9Chief Warrant Officer W-3 . . . . . . . . . 5.0 4.5 3.8 3.9 4.3 4.6 4.1Chief Warrant Officer W-2 . . . . . . . . . 8.4 7.4 6.7 6.5 6.2 6.2 6.0Warrant Officer W-1 . . . . . . . . . . . . . 3.2 2.0 2.1 2.2 2.3 2.4 3.1
E-9 . . . . . . . . . . . . . . . . . . . . . . . . 15.3 11.1 10.2 10.4 10.6 10.8 10.7E-8 . . . . . . . . . . . . . . . . . . . . . . . . 38.0 28.8 26.0 26.7 27.0 27.7 27.1E-7 . . . . . . . . . . . . . . . . . . . . . . . . 134.1 109.3 97.7 98.4 101.9 101.4 99.6E-6 . . . . . . . . . . . . . . . . . . . . . . . . 239.1 180.5 164.9 164.9 170.0 172.4 173.1E-5 . . . . . . . . . . . . . . . . . . . . . . . . 361.5 261.4 229.5 239.7 242.5 250.7 251.1E-4 . . . . . . . . . . . . . . . . . . . . . . . . 427.8 317.2 251.0 240.1 248.1 264.5 264.1E-3 . . . . . . . . . . . . . . . . . . . . . . . . 280.1 197.1 196.3 210.4 219.6 222.1 220.1E-2 . . . . . . . . . . . . . . . . . . . . . . . . 140.3 99.7 99.0 92.4 91.8 85.1 84.3E-1 . . . . . . . . . . . . . . . . . . . . . . . . 97.6 63.4 80.0 72.5 64.7 59.2 55.8Cadets and Midshipmen . . . . . . . . . 13.3 12.1 12.5 12.8 12.5 12.6 12.6
Z Fewer than 50.
Source: U.S. Department of Defense, Directorate of Information Operations and Reports, Selected Manpower Statistics,an-nual. See also <http://www.dior.whs.mil/mmid/military/miltop.htm>.
344 National Security and Veterans Affairs
U.S. Census Bureau, Statistical Abstract of the United States: 2006

Table 506. Military Reserve Personnel: 1990 to 2004[As of September 30. The Ready Reserve includes the Selected Reserve which is scheduled to augment active forces duringtimes of war or national emergency, and the Individual Ready Reserve which, during times of war or national emergency,would be used to fill out Active, Guard and Reserve units, and which would also be a source for casualty replacements; ReadyReservists serve in an active status (except for the Inactive National Guard—a very small pool within the Army NationalGuard). The Standby Reserve cannot be called to active duty, other than for training, unless authorized by Congress under‘‘full mobilization,’’ and a determination is made that there are not enough qualified members in the Ready Reserve in therequired categories who are readily available. The Retired Reserve represents a lower potential for involuntary mobilization.]
Reserve status andbranch of service 1990 1995 2000 2001 2002 2003 2004
Total reserves 1 . . . . 1,688,674 1,674,164 1,276,843 1,249,043 1,222,337 1,188,851 1,166,937
Ready reserve . . . . . . . 1,658,707 1,648,388 1,251,452 1,224,121 1,199,321 1,167,101 1,145,035Army 2 . . . . . . . . . . . . . . 1,049,579 999,462 725,771 713,251 699,548 682,522 663,209Navy . . . . . . . . . . . . . . . 240,228 267,356 184,080 168,454 159,098 152,855 148,643Marine Corps . . . . . . . . . . 81,355 103,668 99,855 99,377 97,944 98,868 101,443Air Force 3. . . . . . . . . . . . 270,313 263,011 229,009 230,182 229,798 219,895 219,159Coast Guard . . . . . . . . . . 17,232 14,891 12,737 12,857 12,933 12,961 12,581
Standby reserve . . . . . . 29,967 25,776 25,391 24,922 23,016 21,750 21,902Army . . . . . . . . . . . . . . . 788 1,128 701 753 726 744 715Navy . . . . . . . . . . . . . . . 11,791 12,707 7,213 5,650 4,051 2,520 2,502Marine Corps . . . . . . . . . . 1,424 216 895 507 605 685 992Air Force. . . . . . . . . . . . . 15,369 11,453 16,429 17,826 17,430 17,578 17,340Coast Guard . . . . . . . . . . 595 272 153 186 204 223 353
Retired reserve . . . . . . . 462,371 505,905 573,305 580,785 590,018 601,611 614,904Army . . . . . . . . . . . . . . . 223,919 259,553 296,004 299,233 304,524 308,820 315,477Navy . . . . . . . . . . . . . . . 111,961 97,532 109,531 111,485 112,374 113,485 115,210Marine Corps . . . . . . . . . . 9,101 11,319 12,937 13,352 13,672 13,926 14,319Air Force. . . . . . . . . . . . . 117,390 137,501 154,833 156,715 159,448 165,380 169,898
1 Less retired reserves. 2 Includes Army National Guard. 3 Includes Air National Guard.
Source: U.S. Department of Defense, Official Guard and Reserve Manpower Strengths and Statistics, quarterly. See also<http://www.dior.whs.mil/mmid/pubs.htm>.
Table 507. Ready Reserve Personnel Profile—Race and Sex: 1990 to 2004[In thousands (1,658.7 represents 1,658,700). As of September 30]
Year
Race
Hispanic 2
Sex
Total 1 White Black AsianAmerican
Indian
Officer Enlisted
Male Female Male Female
1990 . . . . . 1,658.7 1,304.6 272.3 14.9 7.8 83.1 226.8 40.5 1,204.7 186.71992 . . . . . 1,876.4 1,459.5 309.7 20.2 9.3 95.4 232.7 44.7 1,382.4 216.61993 . . . . . 1,858.1 1,440.7 310.5 21.3 9.2 98.2 232.5 46.3 1,365.6 213.71994 . . . . . 1,795.8 1,380.9 298.3 22.4 9.0 99.1 223.9 46.2 1,315.8 210.0
1995 . . . . . 1,648.4 1,267.7 274.5 22.0 8.8 96.2 209.9 44.7 1,196.8 196.91996 . . . . . 1,536.6 1,179.0 249.8 21.5 8.6 93.1 196.9 43.6 1,108.8 187.41997 . . . . . 1,451.0 1,113.7 230.6 21.7 8.4 91.5 188.7 43.2 1,037.6 181.51998 . . . . . 1,353.4 1,033.9 210.4 21.7 7.8 88.2 175.9 40.3 964.1 173.11999 . . . . . 1,288.8 980.0 202.6 22.6 7.6 88.9 166.2 38.4 911.2 173.1
2000 . . . . . 1,251.5 942.2 199.6 26.7 8.4 91.8 159.4 36.9 879.9 175.32001 . . . . . 1,224.1 912.7 198.4 27.9 8.5 94.3 158.0 36.6 852.2 177.32002 . . . . . 1,199.3 891.3 193.2 27.9 8.8 96.0 152.1 35.6 835.2 176.42003 . . . . . 1,167.1 865.7 187.5 25.4 8.5 98.0 145.1 34.0 813.7 174.32004 . . . . . 1,145.0 845.3 181.3 26.2 9.1 100.2 141.9 33.6 799.7 169.8
1 Race subgroups do not sum to equal the total. ‘‘Pacific Islanders, Other, and Unknowns’’ are not listed. 2 Persons ofHispanic origin may be of any race.
Source: U.S. Department of Defense, Official Guard and Reserve Manpower Strengths and Statistics, annual. See also<http://www.dior.whs.mil/mmid/pubs.htm>.
Table 508. National Guard—Summary: 1980 to 2004[In thousands (368 represents 368,000). As of September 30]
Item Unit 1980 1985 1990 1995 2000 2001 2002 2003 2004
Army National Guard:Units . . . . . . . . . . . . . . . . . Number . . . 3,379 4,353 4,055 5,872 5,300 5,200 5,150 5,100 15,100Personnel 2 . . . . . . . . . . . . . 1,000 . . . . 368 438 444 375 353 352 352 351 343
Females . . . . . . . . . . . . . 1,000 . . . . 17 23 31 31 38 42 43 44 (NA)Funds obligated 3 . . . . . . . . . Bil. dol. . . . 1.8 4.4 5.2 6.0 6.9 7.7 8.0 10.0 48.3Value of equipment . . . . . . . . Bil. dol. . . . 7.6 18.8 29.0 33.0 35.0 35.0 35.0 36.0 526.0
Air National Guard:Units . . . . . . . . . . . . . . . . . Number . . . 1,054 1,184 1,339 1,604 1,550 1,500 1,500 1,500 1,500Personnel 2 . . . . . . . . . . . . . 1,000 . . . . 96 109 118 110 106 109 112 108 108
Females . . . . . . . . . . . . . 1,000 . . . . 8 12 (NA) 16 (NA) (NA) (NA) (NA) (NA)Funds obligated 3 . . . . . . . . . Bil. dol. . . . 1.7 2.8 3.2 4.2 5.6 5.8 6.8 6.4 7.6Value of equipment (est.) 6 . . . Bil. dol. . . . 5.2 21.4 26.4 38.3 44.0 44.0 44.0 44.0 44.0
NA Not available. 1 Includes units on active duty. 2 Officers and enlisted personnel. 3 Federal funds; includes personnel,operations, maintenance, and military construction. 4 Decrease due to units being mobilized for Gulf war operations.5 Decreased due to equipment left overseas by mobilized units. 6 Beginning 1985, increase due to repricing of aircraft to currentyear dollars to reflect true replacement value. Beginning 1995, includes value of aircraft and support equipment.
Source: National Guard Bureau, Annual Review of the Chief, National Guard Bureau; and unpublished data. See also<http://www.ang.af.mil> and <http://www.arng.army.mil>.
National Security and Veterans Affairs 345
U.S. Census Bureau, Statistical Abstract of the United States: 2006

Table 509. Veterans by Sex, Period of Service, and State: 2004[In thousands (24,523 represents 24,523,000). As of September 30. VetPop 2004 Ver 1.0 is the Department of Veterans Affairs(VA’s) new official estimate and projection of the veteran population as of December 31, 2004. It is based on published Census2000 data that has been supplemented by special data extracts prepared for the VA Office of the Actuary by the Census Bureau.This estimate and projection is also based on data provided by the Defense Manpower Data Center on service member separa-tions from active duty, information from the DoD Office of the Actuary, and Department of Veterans Affairs administrative data fromthe Veterans Benefits Administration and the Veterans Health Administration.]
StateTotal veterans 1, 2
Gulf War 3Vietnam
eraKoreanconflict
WorldWar II PeacetimeTotal Male Female
United States. . . . . 24,523 22,849 1,675 4,065 8,064 3,376 3,877 6,244Alabama. . . . . . . . . . . . 426 396 30 81 143 62 59 108Alaska . . . . . . . . . . . . . 67 60 7 18 27 5 4 17Arizona. . . . . . . . . . . . . 555 513 42 93 177 87 97 135Arkansas . . . . . . . . . . . 268 251 17 46 89 37 42 69California . . . . . . . . . . . 2,311 2,146 165 361 775 330 384 580Colorado. . . . . . . . . . . . 428 393 35 89 155 50 50 108Connecticut . . . . . . . . . . 269 254 15 28 85 41 53 69Delaware . . . . . . . . . . . 81 75 6 13 27 11 12 22District of Columbia . . . . 37 34 3 6 12 6 7 10Florida . . . . . . . . . . . . . 1,788 1,659 129 277 530 294 371 434Georgia . . . . . . . . . . . . 760 694 66 179 258 84 78 203Hawaii . . . . . . . . . . . . . 107 99 9 20 39 15 16 25Idaho . . . . . . . . . . . . . . 133 124 9 28 44 17 19 32Illinois . . . . . . . . . . . . . 897 844 52 133 283 123 152 228Indiana. . . . . . . . . . . . . 551 519 32 84 178 71 80 152Iowa . . . . . . . . . . . . . . 266 252 13 37 88 39 45 64Kansas. . . . . . . . . . . . . 246 231 16 43 84 32 39 59Kentucky . . . . . . . . . . . 360 338 22 62 121 48 51 92Louisiana . . . . . . . . . . . 367 340 27 72 120 47 54 90Maine. . . . . . . . . . . . . . 144 134 9 20 49 21 22 38Maryland . . . . . . . . . . . 486 443 43 95 158 59 66 132Massachusetts. . . . . . . . 491 462 28 54 150 76 99 127Michigan. . . . . . . . . . . . 837 790 47 116 274 109 132 224Minnesota. . . . . . . . . . . 427 404 23 55 147 58 64 114Mississippi . . . . . . . . . . 240 223 18 49 76 34 34 60Missouri . . . . . . . . . . . . 555 520 34 85 182 78 85 145Montana . . . . . . . . . . . . 103 96 7 16 37 14 15 25Nebraska . . . . . . . . . . . 159 149 11 28 53 24 24 37Nevada . . . . . . . . . . . . 244 225 19 41 86 35 33 64New Hampshire . . . . . . . 131 123 8 18 45 18 19 37New Jersey. . . . . . . . . . 583 552 30 62 175 91 118 152New Mexico . . . . . . . . . 180 166 15 32 64 25 26 44New York . . . . . . . . . . . 1,172 1,105 67 137 350 176 225 309North Carolina . . . . . . . . 767 708 59 154 253 99 102 198North Dakota. . . . . . . . . 55 52 4 10 19 7 8 13Ohio . . . . . . . . . . . . . . 1,052 990 62 155 336 137 170 281Oklahoma . . . . . . . . . . . 355 332 23 65 126 48 52 83Oregon. . . . . . . . . . . . . 367 342 25 53 130 47 58 94Pennsylvania. . . . . . . . . 1,146 1,083 63 134 352 170 227 296Rhode Island. . . . . . . . . 91 86 5 11 29 14 18 23South Carolina. . . . . . . . 414 382 31 86 142 54 52 106South Dakota . . . . . . . . 73 68 5 13 24 11 11 17Tennessee . . . . . . . . . . 541 505 36 97 188 69 70 143Texas. . . . . . . . . . . . . . 1,682 1,552 130 354 583 209 224 408Utah . . . . . . . . . . . . . . 151 142 9 29 49 21 24 35Vermont . . . . . . . . . . . . 58 54 4 7 19 8 9 16Virginia. . . . . . . . . . . . . 751 677 74 196 263 88 86 180Washington . . . . . . . . . . 633 583 49 122 231 76 82 160West Virginia . . . . . . . . . 188 178 10 27 64 27 30 46Wisconsin . . . . . . . . . . . 475 448 27 65 153 65 74 129Wyoming . . . . . . . . . . . 55 51 4 11 20 7 7 12
1 Veterans serving in more than one period of service are counted only once in the total. 2 Current civilians discharged fromactive duty, other than for training only without service-connected disability. 3 Service from August 2, 1990, to the present.Source: Department of Veterans Affairs, Office of Policy, Planning & Preparedness. Annual Report of the Secretary of VeteransAffairs <http://www.va.gov/vetdata/ProgramStatistcs/index.htm>.
Table 510. Veterans Living by Age and Period of Service: 2004[In thousands (24,793 represents 24,793,000). As of September 30. Includes those living outside U.S. See headnote, Table 509]
Age Totalveterans
Wartime veterans
PeacetimeveteransTotal 1 Gulf War 2 Vietnam era
Koreanconflict World War II
Total . . . . . . . . . . . 24,793 18,477 4,105 8,147 3,423 3,916 6,316Under 35 years old . . . . . 2,007 1,946 1,946 - - - 6135-39 years old . . . . . . . 1,332 768 768 - - - 56440-44 years old . . . . . . . 1,732 520 520 - - - 1,21245-49 years old . . . . . . . 1,906 738 383 393 - - 1,16850-54 years old . . . . . . . 2,172 1,858 267 1,731 - - 31455-59 years old . . . . . . . 3,572 3,448 151 3,409 - - 12460-64 years old . . . . . . . 2,553 1,762 48 1,755 - - 79165 years old and over . . . 9,520 7,437 22 859 3,423 3,916 2,083Female, total . . . . . . . . . 1,692 1,130 647 262 80 178 562
- Represents or rounds to zero. 1 Veterans who served in more than one wartime period are counted only once in the total.2 Service from August 2, 1990, to the present.
Source: U.S. Dept. of Veterans Affairs, VetPop 2004, Ver 1.0, VA Office of the Actuary <http://www.va.gov/vetdata/demographics>.
346 National Security and Veterans Affairs
U.S. Census Bureau, Statistical Abstract of the United States: 2006

Table 511. Veterans by Sex, Race, and Hispanic or Latino Origin: 2000[In thousands (26,403.7 represents 26,403,700). As of April 1. Data are based on a sample from the census.See Appendix III.]
Characteristics Total number 18 to 64 years 65 years and over
Total . . . . . . . . . . . . . . . . . . . . . . . . . . 26,403.7 16,740.2 9,663.5Sex:
Male . . . . . . . . . . . . . . . . . . . . . . . . . . . . . . . 24,810.4 15,494.6 9,315.9Female . . . . . . . . . . . . . . . . . . . . . . . . . . . . . 1,593.3 1,245.6 347.7
White alone . . . . . . . . . . . . . . . . . . . . . . . . . . . . 22,573.0 13,710.5 8,862.5Male . . . . . . . . . . . . . . . . . . . . . . . . . . . . . . . 21,373.2 12,829.6 8,543.6Female . . . . . . . . . . . . . . . . . . . . . . . . . . . . . 1,199.9 881.0 318.9
Black or African American alone . . . . . . . . . . . . . . 2,572.0 2,021.9 550.1Male . . . . . . . . . . . . . . . . . . . . . . . . . . . . . . . 2,297.6 1,765.8 531.8Female . . . . . . . . . . . . . . . . . . . . . . . . . . . . . 274.4 256.1 18.3
American Indian/Alaska Native alone . . . . . . . . . . . 195.9 160.3 35.6Male . . . . . . . . . . . . . . . . . . . . . . . . . . . . . . . 177.9 143.8 34.0Female . . . . . . . . . . . . . . . . . . . . . . . . . . . . . 18.0 16.5 1.5
Asian alone . . . . . . . . . . . . . . . . . . . . . . . . . . . . 284.3 198.4 85.9Male . . . . . . . . . . . . . . . . . . . . . . . . . . . . . . . 261.3 178.4 82.9Female . . . . . . . . . . . . . . . . . . . . . . . . . . . . . 23.0 20.0 3.0
Native Hawaiian, and other Pacific Islander alone. . . 28.6 23.9 4.6Male . . . . . . . . . . . . . . . . . . . . . . . . . . . . . . . 25.6 21.2 4.4Female . . . . . . . . . . . . . . . . . . . . . . . . . . . . . 3.0 2.7 0.2
Some other race alone . . . . . . . . . . . . . . . . . . . . 367.9 321.3 46.6Male . . . . . . . . . . . . . . . . . . . . . . . . . . . . . . . 333.3 288.5 44.8Female . . . . . . . . . . . . . . . . . . . . . . . . . . . . . 34.6 32.8 1.7
Hispanic or Latino origin 1 . . . . . . . . . . . . . . . . . . 1,139.2 905.5 233.7Male . . . . . . . . . . . . . . . . . . . . . . . . . . . . . . . 1,045.9 820.2 225.7Female . . . . . . . . . . . . . . . . . . . . . . . . . . . . . 93.3 85.3 8.0
1 Persons of Hispanic or Latino origin may be of any race.Source: U.S. Census Bureau, American FactFinder, 2000 Census of Population and Housing, Summary File 3, tables P39,
PCT66A, PCT 66B, PCT66C, PCT66D, PCT 66E, PCT 66F, PCT66G, PCT 66H and P66 (accessed 30 March 2004)<http://www.census.gov/Press-Release/www/2002/sumfile3.html>.
Table 512. Veterans Benefits—Expenditures by Program and Compensation forService-Connected Disabilities: 1980 to 2004
[In millions of dollars (23,187 represents $23,187,000,000). For year ending September 30.]
Program 1980 1990 1995 1999 2000 2001 2002 2003 2004
Total . . . . . . . . . . . . . . . . . . . . . 23,187 28,998 37,775 43,166 47,086 45,037 50,882 56,892 59,555Medical programs . . . . . . . . . . . . . . . . 6,042 11,582 16,255 18,223 19,637 21,330 23,049 25,188 28,158Construction . . . . . . . . . . . . . . . . . . . 300 661 641 521 466 421 449 411 318General operating expenses . . . . . . . . . 605 811 954 989 1,016 1,222 1,318 1,399 1,252Compensation and pension . . . . . . . . . 11,044 14,674 17,765 21,069 22,012 23,276 25,573 27,995 29,937Vocational rehabilitation and education . . 2,350 452 1,317 1,584 1,610 1,786 2,170 2,565 2,684All other 1 . . . . . . . . . . . . . . . . . . . . . 2,846 818 844 780 2,345 -2,999 -1,676 -666 -2,795
Compensation for serviceconnected disabilities 2 . . . . . . . . . . . 6,104 9,284 11,644 14,560 15,511 16,593 18,584 20,855 22,387
1 Includes insurance, indemnities and miscellaneous funds and expenditures. (Excludes expenditures from personal funds ofpatients.) 2 Represents Veterans receiving compensation for service-connected disabilities.
Source: U.S. Dept. of Veterans Affairs, Expenditure and Workload, annual. See also <http://www.va.gov/vetdata/index.htm>.
Table 513. Veterans Compensation and Pension Benefits—Number on Rolls byPeriod of Service and Status: 1980 to 2004
[In thousands (4,646 represents 4,646,000), except as indicated. As of Sept. 30. Living refers to veterans receiving com-pensation for disability incurred or aggravated while on active duty and war veterans receiving pension and benefits for non-service connected disabilities. Deceased refers to deceased veterans whose dependents were receiving pensions and com-pensation benefits]
Period of service and veteran status 1980 1990 1995 2000 2001 2002 2003 2004
Total . . . . . . . . . . . . . . . . . . . . . 4,646 3,584 3,330 3,236 3,218 3,285 3,369 3,432Living veterans . . . . . . . . . . . . . . . . . . 3,195 2,746 2,669 2,672 2,669 2,745 2,832 2,899
Service connected . . . . . . . . . . . . . . 2,273 2,184 2,236 2,308 2,321 2,398 2,485 2,556Nonservice connected . . . . . . . . . . . 922 562 433 364 348 347 347 343
Deceased veterans . . . . . . . . . . . . . . . 1,451 838 662 564 549 540 538 533Service connected . . . . . . . . . . . . . . 358 320 307 307 307 310 314 318Nonservice connected . . . . . . . . . . . 1,093 518 355 257 241 230 224 215
Prior to World War I . . . . . . . . . . . . . . . 14 4 2 1 1 1 1 (Z)Living . . . . . . . . . . . . . . . . . . . . . . (Z) (Z) (Z) (Z) (Z) (Z) (Z) (Z)
World War I . . . . . . . . . . . . . . . . . . . . 692 198 89 34 28 23 19 16Living . . . . . . . . . . . . . . . . . . . . . . 198 18 3 (Z) (Z) (Z) (Z) (Z)
World War II . . . . . . . . . . . . . . . . . . . . 2,520 1,723 1,307 968 906 856 813 766Living . . . . . . . . . . . . . . . . . . . . . . 1,849 1,294 961 676 624 583 546 506
Korean conflict 1 . . . . . . . . . . . . . . . . . 446 390 368 323 313 308 306 302Living . . . . . . . . . . . . . . . . . . . . . . 317 305 290 255 246 243 241 237
Peacetime . . . . . . . . . . . . . . . . . . . . . 312 495 559 607 608 613 620 624Living . . . . . . . . . . . . . . . . . . . . . . 262 444 514 567 569 575 583 587
Vietnam era 2 . . . . . . . . . . . . . . . . . . . 662 774 868 969 987 1,052 1,120 1,172Living . . . . . . . . . . . . . . . . . . . . . . 569 685 766 848 862 922 983 1,028
Gulf War 3 . . . . . . . . . . . . . . . . . . . . . (X) (X) 138 334 376 431 490 552Living . . . . . . . . . . . . . . . . . . . . . . (X) (X) 134 326 368 421 479 540
X Not applicable. Z Fewer than 500. 1 Service during period June 27, 1950, to Jan. 31, 1955. 2 Service from Aug. 5,1964, to May 7, 1975. 3 Service from August 2, 1990 to the present.
Source: U.S. Dept. of Veterans Affairs, Annual Report of the Secretary of Veterans Affairs to 1998; Annual AccountablilityReport and unpublished data 1999 to 2004. See also <http://www.va.gov/vetdata/index.htm>.
National Security and Veterans Affairs 347
U.S. Census Bureau, Statistical Abstract of the United States: 2006
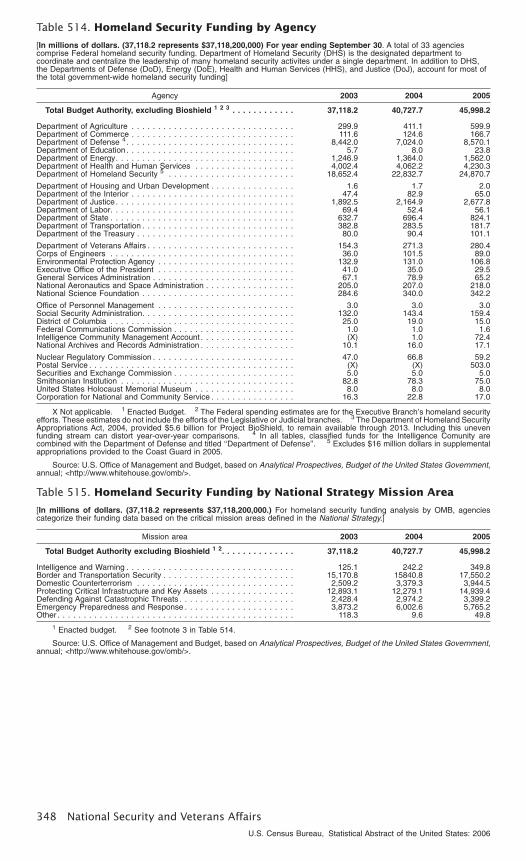
Table 514. Homeland Security Funding by Agency
[In millions of dollars. (37,118.2 represents $37,118,200,000) For year ending September 30. A total of 33 agenciescomprise Federal homeland security funding. Department of Homeland Security (DHS) is the designated department tocoordinate and centralize the leadership of many homeland security activites under a single department. In addition to DHS,the Departments of Defense (DoD), Energy (DoE), Health and Human Services (HHS), and Justice (DoJ), account for most ofthe total government-wide homeland security funding]
Agency 2003 2004 2005
Total Budget Authority, excluding Bioshield 1 2 3 . . . . . . . . . . . . 37,118.2 40,727.7 45,998.2
Department of Agriculture . . . . . . . . . . . . . . . . . . . . . . . . . . . . . . . 299.9 411.1 599.9Department of Commerce . . . . . . . . . . . . . . . . . . . . . . . . . . . . . . . 111.6 124.6 166.7Department of Defense 4. . . . . . . . . . . . . . . . . . . . . . . . . . . . . . . . 8,442.0 7,024.0 8,570.1Department of Education . . . . . . . . . . . . . . . . . . . . . . . . . . . . . . . . 5.7 8.0 23.8Department of Energy. . . . . . . . . . . . . . . . . . . . . . . . . . . . . . . . . . 1,246.9 1,364.0 1,562.0Department of Health and Human Services . . . . . . . . . . . . . . . . . . . 4,002.4 4,062.2 4,230.3Department of Homeland Security 5 . . . . . . . . . . . . . . . . . . . . . . . . 18,652.4 22,832.7 24,870.7
Department of Housing and Urban Development . . . . . . . . . . . . . . . . 1.6 1.7 2.0Department of the Interior . . . . . . . . . . . . . . . . . . . . . . . . . . . . . . . 47.4 82.9 65.0Department of Justice . . . . . . . . . . . . . . . . . . . . . . . . . . . . . . . . . . 1,892.5 2,164.9 2,677.8Department of Labor. . . . . . . . . . . . . . . . . . . . . . . . . . . . . . . . . . . 69.4 52.4 56.1Department of State . . . . . . . . . . . . . . . . . . . . . . . . . . . . . . . . . . . 632.7 696.4 824.1Department of Transportation . . . . . . . . . . . . . . . . . . . . . . . . . . . . . 382.8 283.5 181.7Department of the Treasury . . . . . . . . . . . . . . . . . . . . . . . . . . . . . . 80.0 90.4 101.1
Department of Veterans Affairs . . . . . . . . . . . . . . . . . . . . . . . . . . . . 154.3 271.3 280.4Corps of Engineers . . . . . . . . . . . . . . . . . . . . . . . . . . . . . . . . . . . 36.0 101.5 89.0Environmental Protection Agency . . . . . . . . . . . . . . . . . . . . . . . . . . 132.9 131.0 106.8Executive Office of the President . . . . . . . . . . . . . . . . . . . . . . . . . . 41.0 35.0 29.5General Services Administration . . . . . . . . . . . . . . . . . . . . . . . . . . . 67.1 78.9 65.2National Aeronautics and Space Administration . . . . . . . . . . . . . . . . . 205.0 207.0 218.0National Science Foundation . . . . . . . . . . . . . . . . . . . . . . . . . . . . . 284.6 340.0 342.2
Office of Personnel Management . . . . . . . . . . . . . . . . . . . . . . . . . . 3.0 3.0 3.0Social Security Administration. . . . . . . . . . . . . . . . . . . . . . . . . . . . . 132.0 143.4 159.4District of Columbia . . . . . . . . . . . . . . . . . . . . . . . . . . . . . . . . . . . 25.0 19.0 15.0Federal Communications Commission . . . . . . . . . . . . . . . . . . . . . . . 1.0 1.0 1.6Intelligence Community Management Account . . . . . . . . . . . . . . . . . . (X) 1.0 72.4National Archives and Records Administration . . . . . . . . . . . . . . . . . . 10.1 16.0 17.1
Nuclear Regulatory Commission . . . . . . . . . . . . . . . . . . . . . . . . . . . 47.0 66.8 59.2Postal Service . . . . . . . . . . . . . . . . . . . . . . . . . . . . . . . . . . . . . . . (X) (X) 503.0Securities and Exchange Commission . . . . . . . . . . . . . . . . . . . . . . . 5.0 5.0 5.0Smithsonian Institution . . . . . . . . . . . . . . . . . . . . . . . . . . . . . . . . . 82.8 78.3 75.0United States Holocaust Memorial Museum . . . . . . . . . . . . . . . . . . . 8.0 8.0 8.0Corporation for National and Community Service . . . . . . . . . . . . . . . . 16.3 22.8 17.0
X Not applicable. 1 Enacted Budget. 2 The Federal spending estimates are for the Executive Branch’s homeland securityefforts. These estimates do not include the efforts of the Legislative or Judicial branches. 3 The Department of Homeland SecurityAppropriations Act, 2004, provided $5.6 billion for Project BioShield, to remain available through 2013. Including this unevenfunding stream can distort year-over-year comparisons. 4 In all tables, classified funds for the Intelligence Comunity arecombined with the Department of Defense and titled ‘‘Department of Defense’’. 5 Excludes $16 million dollars in supplementalappropriations provided to the Coast Guard in 2005.
Source: U.S. Office of Management and Budget, based on Analytical Prospectives, Budget of the United States Government,annual; <http://www.whitehouse.gov/omb/>.
Table 515. Homeland Security Funding by National Strategy Mission Area
[In millions of dollars. (37,118.2 represents $37,118,200,000.) For homeland security funding analysis by OMB, agenciescategorize their funding data based on the critical mission areas defined in the National Strategy.]
Mission area 2003 2004 2005
Total Budget Authority excluding Bioshield 1 2. . . . . . . . . . . . . . 37,118.2 40,727.7 45,998.2
Intelligence and Warning . . . . . . . . . . . . . . . . . . . . . . . . . . . . . . . . 125.1 242.2 349.8Border and Transportation Security . . . . . . . . . . . . . . . . . . . . . . . . . 15,170.8 15840.8 17,550.2Domestic Counterterrorism . . . . . . . . . . . . . . . . . . . . . . . . . . . . . . 2,509.2 3,379.3 3,944.5Protecting Critical Infrastructure and Key Assets . . . . . . . . . . . . . . . . 12,893.1 12,279.1 14,939.4Defending Against Catastrophic Threats . . . . . . . . . . . . . . . . . . . . . . 2,428.4 2,974.2 3,399.2Emergency Preparedness and Response . . . . . . . . . . . . . . . . . . . . . 3,873.2 6,002.6 5,765.2Other . . . . . . . . . . . . . . . . . . . . . . . . . . . . . . . . . . . . . . . . . . . . . 118.3 9.6 49.8
1 Enacted budget. 2 See footnote 3 in Table 514.
Source: U.S. Office of Management and Budget, based on Analytical Prospectives, Budget of the United States Government,annual; <http://www.whitehouse.gov/omb/>.
348 National Security and Veterans Affairs
U.S. Census Bureau, Statistical Abstract of the United States: 2006

*Under
Sec
reta
ry
Emer
gen
cy P
repar
ednes
s &
R
esponse
(EP
&R
)
Dep
art
men
t of
Hom
ela
nd
Secu
rity
Org
an
izati
on
Ch
art
Exec
uti
ve S
ecre
tary
Figure
10
.3
Legis
lati
ve A
ffai
rs
Cit
izen
ship
& Im
mig
rati
on
Serv
ice
Om
budsm
an
Public
Aff
airs
Stat
e &
Loca
l C
oord
inat
ion
Spec
ial A
ssis
tant
to t
he
Secr
etar
y (p
riva
te s
ecto
r)
Nat
ional
Cap
ital
Reg
ion
Coord
inat
ion
Shar
ed S
ervi
ces
Secr
etar
y
Dep
uty
Sec
reta
ry
Dir
ecto
r, B
ure
au o
f C
itiz
ensh
ip &
Im
mig
rati
on
Serv
ices
*Under
Sec
reta
ry
Man
agem
ent
*Under
Sec
reta
ry
Scie
nce
& T
echnolo
gy
(S&
T)
*Under
Sec
reta
ry
Info
rmat
ion A
nal
ysis
and
Infr
astr
uct
ure
Pro
tect
ion (
IAIP
)
*Under
Sec
reta
ry
Bord
er &
Tra
nsp
ort
atio
n
Secu
rity
(BT
S)
Smal
l &
Dis
adva
nta
ged
Bu
sines
s Priv
acy
Off
icer
* M
ajor
com
ponen
ts t
hat
mak
e up D
epar
tmen
t of
Hom
elan
d
Secu
rity
Dir
ecto
rate
s as
of
May
2
00
5
Sourc
e: D
epar
tmen
t of
Hom
elan
d S
ecuri
ty <
htt
p:/
/ww
w.d
hs.
gov/
dhsp
ublic
/them
e_hom
e1.jsp
>
Chie
f of
Staf
f
Hea
dquar
ters
Oper
atio
nal
In
tegra
tion S
taff
Com
man
dan
t of
Coas
t G
uar
d
Insp
ecto
r G
ener
al
Gen
eral
Counse
l
Civ
il R
ights
&
Civ
il Li
ber
ties
Dir
ecto
r of
Secr
et S
ervi
ce
Inte
rnat
ional
Aff
airs
Counte
r N
arco
tics
Chie
f Fi
nan
cial
O
ffic
er
Chie
f In
form
atio
n
Off
icer
Chie
f Pr
ocu
rem
ent
Off
icer
Adm
inis
trat
ive
Serv
ices
Off
ice
of
Nat
ional
La
bora
tori
es
Hom
elan
d S
ecuri
ty
Labora
tori
es
Hom
elan
d S
ecuri
ty
Adva
nce
Res
earc
h P
roje
cts
Agen
cy (
HSA
RPA
)
Hom
elan
d S
ecuri
ty
Oper
atio
ns
Cen
ter
(HSO
C)
Info
rmat
ion A
nal
ysis
(IA
)
Infr
astr
uct
ure
Pro
tect
ion
(IP)
Tran
sport
atio
n S
ecuri
ty
Adm
inis
trat
ion (
TSA
)
Cust
om
s &
Bord
er
Prote
ctio
n (
CBP
)
Imm
igra
tion &
Cust
om
s En
forc
emen
t (IC
E)
Feder
al E
mer
gen
cy
Man
agem
ent
Agen
cy (
FEM
A)
National Security and Veterans Affairs 349
U.S. Census Bureau, Statistical Abstract of the United States: 2006

Table 516. Department of Homeland Security Total Budget Authority andPersonnel by Organization: 2004 and 2005
[Expenditures in thousands of dollars (35,604,092 represents $35,604,092,000). For the fiscal year ending September 30. Notall activities carried out by DHS constitute homeland security funding (e.g., Coast Guard search and rescue activities)]
OrganizationExpenditures Full-time employees
2004 2005 2004 1 2005
Adjusted total budget authority 2 3 . . . . . . . . . . . . . . . . . . 35,604,092 38,510,517 175,870 179,370
Border & Transportation Security (BTS) Under Secretary . . . . . . . 8,058 9,617 67 67United States−Visitor Immigrant Status IndicatorTechnology (US−VISIT) . . . . . . . . . . . . . . . . . . . . . . . . . . . . 328,053 340,000 64 102
U.S. Customs & Border Protection. . . . . . . . . . . . . . . . . . . . . . 5,997,287 6,416,398 40,076 40,616U.S. Immigration & Customs Enforcement . . . . . . . . . . . . . . . . 3,669,615 3,845,178 14,751 14,486Transportation Security Administration . . . . . . . . . . . . . . . . . . . 4,578,043 5,405,375 51,346 52,615Federal Law Enforcement Training Center . . . . . . . . . . . . . . . . 191,643 222,357 934 959U.S. Coast Guard. . . . . . . . . . . . . . . . . . . . . . . . . . . . . . . . . 6,994,222 7,558,560 45,532 46,809U.S. Secret Service . . . . . . . . . . . . . . . . . . . . . . . . . . . . . . . 1,334,128 1,375,758 6,381 6,516Federal Emergency Management Agency (FEMA),(Emergency Preparedness & Response (EP&R) Directorate) . . . 4,671,782 5,038,256 4,780 4,735
U.S. Citizenship & Immigration Services . . . . . . . . . . . . . . . . . . 1,549,733 1,775,000 9,795 9,937Information Analysis & Infrastructure Directorate (IAIP) . . . . . . . . 834,348 893,708 729 803Science & Technology Directorate (S&T) . . . . . . . . . . . . . . . . . 912,751 1,115,450 180 320State and Local Government Coordinationand Preparedness (SLGCP) 4 . . . . . . . . . . . . . . . . . . . . . . . . 4,192,120 3,984,846 146 220
Departmental Operations . . . . . . . . . . . . . . . . . . . . . . . . . . . . 394,435 524,457 632 683Counter-Terrorism Fund. . . . . . . . . . . . . . . . . . . . . . . . . . . . . 9,941 8,000 (X) (X)Inspector General. . . . . . . . . . . . . . . . . . . . . . . . . . . . . . . . . 80,318 82,317 457 502
X Not applicable. 1 Data comes from the Budget-in-Brief, Fiscal Year 2005. 2 Reflects adjustment for recission of prioryear carryover funds. 3 Excludes BioShield funding, see footnote 3, Table 514. 4 For FY 2005, the Office of DomesticPreparedness became part of SLGCP.
Source: U.S. Department of Homeland Security, ‘‘Budget-in-Brief, Fiscal Year 2006,’’ <http://www.dhs.gov/interweb/assetlibrary/BudgetBIB-FY2006.pdf> (accessed 7 February 2005).
Table 517. Homeland Security Grants by State/Territories: 2004 and 2005
[In thousands of dollars (3,115,550 represents 3,115,550,000). For fiscal years ending September 30. Grants consist of thefollowing programs: Citizen Corps Program (CCP), Law Enforcement Terrorism Prevention Program (LETPP), Emergency Man-agement Performance Grant (EMPG), State Homeland Security Program (SHSP), Metropolitan Medical Response System (MMRS),and Urban Areas Security Initiative (UASI). Urban Areas Security Initiative program includes the Urban Areas Program, Transit Secu-rity Program, Port Security Grant Program and the Intercity Bus Program. 2005 grants include all the programs as in 2004 exceptfor Port Security Grant Program and the Intercity Bus Program. These programs have not yet been awarded as of May 2005]
State/Territory 2004 2005
Total . . . 3,115,550 2,518,763
U.S. . . . . . 3,050,076 2,475,564
AL . . . . . . . 38,723 28,153AK . . . . . . . 21,218 14,879AZ . . . . . . . 53,371 41,705AR . . . . . . . 28,815 21,561CA . . . . . . . 349,894 282,622CO . . . . . . . 45,583 36,799CT . . . . . . . 46,523 24,080DE . . . . . . . 20,206 14,984DC . . . . . . . 49,231 96,144FL . . . . . . . 142,667 101,285GA . . . . . . . 70,815 54,918HI. . . . . . . . 26,865 23,130ID. . . . . . . . 22,621 16,805IL . . . . . . . . 114,925 102,593IN. . . . . . . . 55,534 38,996IA. . . . . . . . 29,918 22,291KS . . . . . . . 29,064 21,784KY . . . . . . . 45,537 31,419
State/Territory 2004 2005
LA . . . . . . . 76,005 42,670ME . . . . . . . 23,776 16,609MD . . . . . . . 64,014 42,250MA . . . . . . . 69,288 62,436MI . . . . . . . 76,981 64,075MN . . . . . . . 60,236 35,311MS . . . . . . . 31,795 22,081MO. . . . . . . 66,618 46,952MT . . . . . . . 20,689 15,318NE . . . . . . . 24,376 23,656NV . . . . . . . 37,196 28,386NH . . . . . . . 24,110 16,776NJ . . . . . . . 95,795 60,811NM . . . . . . . 24,946 18,499NY . . . . . . . 178,492 298,351NC . . . . . . . 65,392 46,609ND . . . . . . . 19,421 14,376OH . . . . . . . 103,582 77,823OK . . . . . . . 32,824 29,974OR . . . . . . . 41,665 34,820PA . . . . . . . 109,866 87,671
State/Territory 2004 2005
RI. . . . . . . . 23,485 16,074SC . . . . . . . 40,643 26,284SD . . . . . . . 19,996 14,809TN . . . . . . . 54,157 32,605TX . . . . . . . 195,671 138,570UT . . . . . . . 27,033 20,308VT . . . . . . . 19,594 14,326VA . . . . . . . 61,902 38,185WA . . . . . . . 73,593 45,330WV. . . . . . . 25,270 18,289WI . . . . . . . 51,343 37,251WY. . . . . . . 18,809 13,934
PR 1 . . . . 37,864 25,169VI . . . . . . 6,918 4,612AS . . . . . 5,776 4,279GU . . . . . 7,016 4,706NM . . . . . 7,960 4,333RM . . . . . - 50FM . . . . . - 50
- Represents zero. 1 PR−Puerto Rico, VI−Virgin Islands, AS−America Samoa, GU−Guam, NM−Northern Mariana Islands,RM−Marshall Islands, and FM−Micronesia.
Source: U.S. Department of Homeland Security, State and Local Government Coordination and Preparedness, Office forDomestic Preparedness, unpublished data. See also <http://www.ojp.gov/odp>.
Table 518. Coast Guard Migrant Interdictions by Nationality of Alien:2000 to 2004
[For the year ending September 30]
Year Total HaitiDominican
Republic China Cuba Mexico Ecuador Other
2000 . . . . . . . . 4,210 1,113 499 261 1,000 49 1,244 442001 . . . . . . . . 3,948 1,391 659 53 777 17 1,020 312002 . . . . . . . . 4,104 1,486 177 80 666 32 1,608 552003 . . . . . . . . 6,068 2,013 1,748 15 1,555 - 703 342004 . . . . . . . . 10,899 3,229 5,014 68 1,225 86 1,189 88
- Represents zero.Source: U.S. Department of Homeland Security, United States Coast Guard, ‘‘Fact File, Migrants Statistics, Statistics.’’
<http://www.uscg.mil/hq/g-cp/comrel/factfile/index.htm> (accessed 3 June 2005).
350 National Security and Veterans Affairs
U.S. Census Bureau, Statistical Abstract of the United States: 2006

Table 519. Customs and Border Protection (CBP)—Processed and ClearedPassengers, Planes, Vehicles, and Containers: 2000 to 2004
[For year ending September 30]
Characteristic 2000 2001 2002 2003 2004
AirPassenger . . . . . . . . . . . . . . . . 80,512,207 79,674,803 69,316,987 70,854,290 78,267,680Commercial plane 1 . . . . . . . . . . 829,318 839,221 768,879 789,805 823,757Private plane . . . . . . . . . . . . . . . 142,050 125,721 129,243 132,154 139,644
LandPassenger 2, 3 . . . . . . . . . . . . . . 397,312,173 381,477,331 333,651,738 329,998,234 326,692,741Auto 2 . . . . . . . . . . . . . . . . . . . 127,094,722 129,576,724 118,306,795 120,376,489 121,415,504Rail container . . . . . . . . . . . . . . 2,156,537 2,257,608 2,430,107 2,473,569 2,587,565Truck 4 . . . . . . . . . . . . . . . . . . . 11,575,243 11,186,909 11,239,541 11,095,397 11,346,725
SeaPassenger 5 . . . . . . . . . . . . . . . 10,990,098 11,281,774 12,224,397 15,127,461 18,127,781Vessel6. . . . . . . . . . . . . . . . . . . 211,242 214,610 211,922 203,635 190,701Vessel container 7 . . . . . . . . . . . 5,813,244 5,709,974 7,283,475 8,821,847 9,796,282
1 A commercial aircraft is any aircraft transporting passengers and/or cargo for some payment or other consideration, includingmoney or services rendered. 2 See Table 1256 for more details. 3 Includes pedestrians. 4 Trucks\containers entering theU.S. 5 Does not include passengers on ferries. 6 Number of vessels. The word vessel includes every description of water craftor other contrivance used or capable of being used as a means of transportation on water, does not include aircraft.7 Number of vessel containers.
Source: U.S. Department of Homeland Security, Customs and Border Protection, About CBP, Statistics and Accomplishments,National Workload Statistics, 2000−2004. See also <http://www.cbp.gov/xp/cgov/toolbox/about/accomplish/> (released 1 June2005).
Table 520. Deportable Aliens Located by Border Patrol Program: 2000 to 2004[As of the end of September. Excludes Immigration and Customs Enforcement (ICE) investigations’ data. Data for this tablecomes from the Performance Analysis System (PAS). This system captures aggregated data updated once a month by DHSoffices.]
Border Patrol Sector 2000 2001 2002 2003 2004
Total . . . . . . . . . . . . . . . . . 1,676,438 1,266,214 955,310 931,557 1,160,395All southwest sectors . . . . . . . . 1,643,679 1,235,718 929,809 905,065 1,139,282
San Diego, CA . . . . . . . . . . . . 151,681 110,075 100,681 111,515 138,608El Centro, CA. . . . . . . . . . . . . 238,126 172,852 108,273 92,099 74,467Yuma, AZ . . . . . . . . . . . . . . . 108,747 78,385 42,654 56,638 98,060Tucson, AZ . . . . . . . . . . . . . . 616,346 449,675 333,648 347,263 491,771El Paso, TX . . . . . . . . . . . . . . 115,696 112,857 94,154 88,816 104,399Marfa, TX . . . . . . . . . . . . . . . 13,689 12,087 11,392 10,319 10,530Del Rio, TX . . . . . . . . . . . . . . 157,178 104,875 66,985 50,145 53,794Laredo, TX . . . . . . . . . . . . . . 108,973 87,068 82,095 70,521 74,706McAllen, TX . . . . . . . . . . . . . . 133,243 107,844 89,927 77,749 92,947
All other sectors. . . . . . . . . . . . 32,759 30,496 25,501 26,492 21,113Blaine, WA . . . . . . . . . . . . . . 2,581 2,089 1,732 1,380 1,354Buffalo, NY . . . . . . . . . . . . . . 1,570 1,434 1,102 564 671Detroit, MI . . . . . . . . . . . . . . . 2,057 2,106 1,511 2,345 1,912Grand Forks, ND . . . . . . . . . . 562 921 1,369 1,223 1,225Havre, MT . . . . . . . . . . . . . . . 1,568 1,305 1,463 1,406 986Houlton, ME. . . . . . . . . . . . . . 489 685 432 292 263Livermore, CA . . . . . . . . . . . . 6,205 5,211 4,371 3,565 1,850Miami, FL . . . . . . . . . . . . . . . 6,237 5,962 5,143 5,931 4,602New Orleans, LA . . . . . . . . . . 6,478 5,033 4,665 5,151 2,889Ramey, PR . . . . . . . . . . . . . . 1,731 1,952 835 1,688 1,813Spokane, WA . . . . . . . . . . . . . 1,324 1,335 1,142 992 847Swanton, VT . . . . . . . . . . . . . 1,957 2,463 1,736 1,955 2,701
Source: U.S. Department of Homeland Security, Office of Immigration Statistics, Yearbook of Immigration Statistics, 2004. Seealso <http://uscis.gov/graphics/shared/aboutus/statistics/ybpage.htm>. Data as of 10 June 2005.
Table 521. Border Patrol Enforcement Activities: 2000 to 2004[As of September 30. Excludes Immigration and Customs Enforcement (ICE) investigations’ data. Data for this table comesfrom the Performance Analysis System (PAS). This system captures aggregated data updated once a month by DHS offices.]
Activities 2000 2001 2002 2003 2004
Persons processed by the Border Patrol 1 . . . . . . . 1,689,195 1,277,577 967,044 946,684 1,179,296Deportable aliens located by the Border Patrol . . . . 1,676,438 1,266,214 955,310 931,557 1,160,395
Mexican aliens . . . . . . . . . . . . . . . . . . . . . . . . . . 1,636,883 1,224,046 917,994 882,012 1,085,006Working in agriculture . . . . . . . . . . . . . . . . . . . . 1,330 1,248 1,821 1,908 1,647Working in trades, crafts, industry, and service . . . . 2,167 2,678 2,897 3,856 3,634Seeking employment . . . . . . . . . . . . . . . . . . . . . 1,525,422 1,107,550 822,161 810,671 997,986
Canadian aliens . . . . . . . . . . . . . . . . . . . . . . . . . 2,211 2,539 1,836 1,611 1,497All others. . . . . . . . . . . . . . . . . . . . . . . . . . . . . . 37,344 39,629 35,480 47,934 73,892
Smugglers of aliens located . . . . . . . . . . . . . . . . . . . 14,406 8,720 8,701 11,128 16,074Aliens located who were smuggledinto the United States . . . . . . . . . . . . . . . . . . . . . . 236,782 112,927 68,192 110,575 193,122
Seizures (conveyances) . . . . . . . . . . . . . . . . . . . . . 17,269 5,892 7,250 9,355 18,024Value of seizures (mil. dol.) . . . . . . . . . . . . . . . . . . 1,945 1,581 1,564 1,680 1,696
Narcotics . . . . . . . . . . . . . . . . . . . . . . . . . . . . . . 1,848 1,519 1,499 1,608 1,620Other . . . . . . . . . . . . . . . . . . . . . . . . . . . . . . . . 97 62 65 72 75
1 Includes deportable aliens located and non-deportable (e.g., U.S. citizens).
Source: U.S. Department of Homeland Security, Office of Immigration Statistics, Yearbook of Immigration Statistics, 2004. Seealso <http://uscis.gov/graphics/shared/aboutus/statistics/ybpage.htm>. Data as of 10 June 2005.
National Security and Veterans Affairs 351
U.S. Census Bureau, Statistical Abstract of the United States: 2006

Table 522. Immigration and Customs Enforcement (ICE) InvestigationsActivities: 2000 to 2003
[As of September 30. Investigative activity for 2003 carried out by Immigration and Customs Enforcement (ICE). Prior to 2003,investigation activity was carried out by Immigration and Naturalization Service (INS).]
Activities 2000 2001 2002 2003
Criminal investigations: 1
Cases completed. . . . . . . . . . . . . . . . . . . . . . . . . . . . . . . 90,519 89,222 78,841 82,236Defendants prosecuted . . . . . . . . . . . . . . . . . . . . . . . . . . . 3,802 2,962 2,309 3,138Defendants convicted . . . . . . . . . . . . . . . . . . . . . . . . . . . . 3,022 2,219 1,496 1,858
Employer investigations: 2
Cases completed. . . . . . . . . . . . . . . . . . . . . . . . . . . . . . . 1,966 1,595 2,061 2,194Warnings . . . . . . . . . . . . . . . . . . . . . . . . . . . . . . . . . . . . 282 169 124 479Notice of Intent to Fine . . . . . . . . . . . . . . . . . . . . . . . . . . . 178 100 53 162Final orders . . . . . . . . . . . . . . . . . . . . . . . . . . . . . . . . . . 180 78 13 124Arrests. . . . . . . . . . . . . . . . . . . . . . . . . . . . . . . . . . . . . . 953 735 485 445
Fraud investigations: 3
Cases completed. . . . . . . . . . . . . . . . . . . . . . . . . . . . . . . 3,733 3,721 2,527 3,050Defendants prosecuted . . . . . . . . . . . . . . . . . . . . . . . . . . . 483 397 253 347Defendants convicted . . . . . . . . . . . . . . . . . . . . . . . . . . . . 259 214 142 250
Smuggling investigations: 4
Cases completed. . . . . . . . . . . . . . . . . . . . . . . . . . . . . . . 3,309 2,885 2,395 2,346Smugglers arrested . . . . . . . . . . . . . . . . . . . . . . . . . . . . . 4,139 3,139 3,330 2,663Smuggled aliens arrested . . . . . . . . . . . . . . . . . . . . . . . . . 46,001 32,429 19,278 14,418Defendants prosecuted . . . . . . . . . . . . . . . . . . . . . . . . . . . 2,618 2,124 2,106 2,185Defendants convicted . . . . . . . . . . . . . . . . . . . . . . . . . . . . 1,474 1,174 1,252 1,418
Entered without inspection/status violators: 5
Cases completed. . . . . . . . . . . . . . . . . . . . . . . . . . . . . . . 38,311 25,301 23,067 27,240Aliens arrested . . . . . . . . . . . . . . . . . . . . . . . . . . . . . . . . 14,963 11,162 10,538 9,319
1 Criminal alien cases include large-scale organizations engaged in ongoing criminal activity and individual aliens convictedof crimes such as terrorism or drug trafficking. 2 Employer investigations target employers of unauthorized aliens and includecriminal investigations, administrative investigations, auxiliary investigations, ICE Headquarters Investigation Project, andDepartment of Labor ESA-91. In FY 2003, also includes statistics pertaining to Work Site Enforcement National InterestInvestigations. 3 Fraud investigations seek to penetrate fraud schemes of all sizes and degrees of complexity which are usedto violate immigration and related laws or to shield the true status of illegal aliens in order to obtain entitlement benefits.4 Smuggling cases involve those which target persons or entities who bring, transport, harbor or smuggle illegal aliens into or withinthe United States. The decline in Performance Analysis System (PAS) investigation figures for smugglers arrested and smuggledaliens arrested from fiscal year 2002 to 2003, may partially be attributable to the DHS reorganization and shift of workload fromsome anti-smuggling units in Border Patrol Sectors to ICE Special Agent in Charge (SAC) offices. 5 Includes Entry WithoutInspection (EWI), such as stowaways, or landed crewmen who were ordered detained on board, and status violators.
Source: U.S. Department of Homeland Security, Office of Immigration Statistics, 2003 Yearbook of Immigration Statistics. Seealso <http://uscis.gov/graphics/shared/aboutus/statistics/ybpage.htm>. Data as of 10 June 2005.
Table 523. Convictions for Immigration and Naturalization Violations:2000 to 2003
[As of September 30. Data for this table comes from the Performance Analysis System (PAS). This system captures aggregateddata updated once a month by DHS offices.]
Violations 2000 2001 2002 2003
All violations 1 2 . . . . . . . . . . . . . . . . . . . . . . . . . . . 20,751 21,055 21,042 22,479
Immigration violations . . . . . . . . . . . . . . . . . . . . . . . . . . 20,007 20,297 20,483 21,821Entry of aliens illegally. . . . . . . . . . . . . . . . . . . . . . . . . . 12,733 13,378 13,371 14,199Reentry of deported aliens . . . . . . . . . . . . . . . . . . . . . . . 4,759 4,315 4,699 4,939Bringing in, transporting, harboring illegal aliens. . . . . . . . . 1,700 1,680 1,691 1,612Fraud and false statements to obtainor confer immigration benefits . . . . . . . . . . . . . . . . . . . . 31 98 119 270
Fraud, forgery, misuse of visas, alien registration,and other documents. . . . . . . . . . . . . . . . . . . . . . . . . . 362 327 196 253
Fraud, forgery, misuse of identification documents . . . . . . . 363 432 367 390Conspiring to defraud the United States . . . . . . . . . . . . . . (D) (D) 5 6Employing unauthorized aliens, peonage, falseattestations for employment . . . . . . . . . . . . . . . . . . . . . 49 19 25 72
Other immigration violations . . . . . . . . . . . . . . . . . . . . . . 9 47 10 80
Naturalization violations . . . . . . . . . . . . . . . . . . . . . . . . . 181 168 146 137False representation as citizens of United States . . . . . . . . 93 129 98 101Fraud, misuse of citizen naturalization papers . . . . . . . . . . 3 4 7 6Fraud, forgery, misuse of U.S. passports . . . . . . . . . . . . . 85 35 41 30
Other violations . . . . . . . . . . . . . . . . . . . . . . . . . . . . . . . 563 590 413 521Racketeering . . . . . . . . . . . . . . . . . . . . . . . . . . . . . . . . 199 185 122 173Terrriosm, threat to national security. . . . . . . . . . . . . . . . . - - - 10Money laundering and financial fraud . . . . . . . . . . . . . . . . 29 10 17 10Weapons trafficking, unlawful possession by aliens. . . . . . . 64 84 105 67Drug trafficking. . . . . . . . . . . . . . . . . . . . . . . . . . . . . . . 175 226 126 158Obstructing justice . . . . . . . . . . . . . . . . . . . . . . . . . . . . 39 57 37 35Alien prostitution. . . . . . . . . . . . . . . . . . . . . . . . . . . . . . 4 6 (D) (D)Other violations . . . . . . . . . . . . . . . . . . . . . . . . . . . . . . 53 22 5 53
D Figure withheld to avoid disclosure pertaining to a specific organization or individual. 1 Data for fiscal years 2000-2003have been revised due to recategorized statutes and adjusted classification for various violation codes. 2 For FY 2000-2003,includes conviction data reported by Inspections Air, Land, Sea, Border Patrol, and Investigations offices.
Source: U.S. Department of Homeland Security, Office of Immigration Statistics, 2003 Yearbook of Immigration Statistics. Seealso <http://uscis.gov/graphics/shared/aboutus/statistics/ybpage.htm>. Data as of 10 June 2005.
352 National Security and Veterans Affairs
U.S. Census Bureau, Statistical Abstract of the United States: 2006

Table 524. Department Participation in the Control of Marijuana, Narcotics, andDangerous Drug Traffic: 2000 to 2003
[As of the end of September. Department participation includes Border Patrol, Inspections and Investigations. Data for this tablecomes from the Performance Analysis System (PAS). This system captures aggregated data updated once a month by DHS offices.]
Year and seizure Total
Type of contraband
Marijuana(lbs.)
Heroin(ozs.)
Cocaine(ozs.)
Dangerousdrug pills
(units) Other
2000 1
Number of seizures. . . . . . . . . . . . . . . . . . . . . 12,143 9,914 225 1,020 470 514Amount seized . . . . . . . . . . . . . . . . . . . . . . . . (X) 1,597,395 5,487 567,341 1,426,547 (X)Estimated value of seizures (mil. dol.) . . . . . . . . 2,314 1,289 32 946 5 41
2001 1
Number of seizures. . . . . . . . . . . . . . . . . . . . . 11,387 9,201 190 1,074 380 542Amount seized . . . . . . . . . . . . . . . . . . . . . . . . (X) 1,449,947 6,564 446,331 736,157 (X)Estimated value of seizures (mil. dol.) . . . . . . . . 1,959 1,144 40 744 3 28
2002Number of seizures. . . . . . . . . . . . . . . . . . . . . 10,231 8,289 160 991 250 541Amount seized . . . . . . . . . . . . . . . . . . . . . . . . (X) 1,440,488 6,887 489,491 619,004 (X)Estimated value of seizures (mil.dol.) . . . . . . . . . 1,980 1,177 32 736 2 32
2003Number of seizures. . . . . . . . . . . . . . . . . . . . . 10,284 8,528 119 742 362 533Amount seized . . . . . . . . . . . . . . . . . . . . . . . . (X) 1,562,368 6,624 336,493 395,714 (X)Estimated value of seizures (mil. dol.) . . . . . . . . 2,107 1,434 42 598 9 24
X Not applicable 1Revised data.
Source: U.S. Department of Homeland Security, Office of Immigration Statistics, 2003 Yearbook of Immigration Statistics. Seealso <http://uscis.gov/graphics/shared/aboutus/statistics/ybpage.htm> released 10 June 2005).
Table 525. Prohibited Items Intercepted at U.S. Airport Screening Checkpoints:2002 to 2004
[Passengers boarding aircraft in thousands (612,876 represents 612,876,000). For the calendar year. TransportationSecurity Administration (TSA) assumed responsibility for airport security on February 17, 2002, and by November 19, 2002, TSAassumed control over all passenger screenings from private contractors. TSA data are incomplete]
Year 2002 2003 2004
Passengers boarding aircraft total (1,000) 1 . . . . . . . . . . . . . . . . . 612,876 646,275 697,701Domestic. . . . . . . . . . . . . . . . . . . . . . . . . . . . . . . . . . . . . . . . . 560,107 592,412 635,515International. . . . . . . . . . . . . . . . . . . . . . . . . . . . . . . . . . . . . . . 52,769 53,863 62,276
Total prohibited items . . . . . . . . . . . . . . . . . . . . . . . . . . . . . . . . . 4,185,916 6,167,497 7,103,560Knife 2 . . . . . . . . . . . . . . . . . . . . . . . . . . . . . . . . . . . . . . . . . 1,147,843 1,969,003 2,055,306Other cutting items 3 . . . . . . . . . . . . . . . . . . . . . . . . . . . . . . . . 2,063,729 3,029,318 3,409,724Club 4 . . . . . . . . . . . . . . . . . . . . . . . . . . . . . . . . . . . . . . . . . . 13,134 25,578 28,998Box cutter 5 . . . . . . . . . . . . . . . . . . . . . . . . . . . . . . . . . . . . . . 37,504 21,396 22,428Firearm 6. . . . . . . . . . . . . . . . . . . . . . . . . . . . . . . . . . . . . . . . 983 638 254Incendiary 7 . . . . . . . . . . . . . . . . . . . . . . . . . . . . . . . . . . . . . . 83,086 485,792 697,242
Other 8 . . . . . . . . . . . . . . . . . . . . . . . . . . . . . . . . . . . . . . . . . . 839,637 635,772 889,608
1 Data comes from the Air Transport Association. 2 Knife includes any length and type except round-bladed, butter, andplastic cutlery. 3 Other cutting instruments refers to, e.g., scissors, screwdrivers, swords, sabers, and ice picks. 4 Club refersto baseball bats, night sticks, billy clubs, bludgeons; etc. 5 Box cutter. 6 Firearm refers to items like pistols, revolvers, rifles,automatic weapons, shotguns, parts of guns and firearms. 7 Incendiaries refer to categories of ammunition and gunpowder,flammables/irritants, and explosives. 8 Other refers to tools, self-defense items, and sporting good (excluding baseball bats).
Source: U.S. Department of Homeland Security, Transportation Security Administration, unpublished data; 13 June 2005<http://www.tsa.gov>;AirTransportAssociationofAmerica,Washington,DC,AirTransportAnnualReport,<http://www.airlines.org/home/default.aspx>.
Table 526. Federal Emergency Management Agency (FEMA) Declarations andExpenditures for Disasters: 2000 to 2004
[Expenditures in thousands of dollars (1,747,511 represents $1,747,511,000). For calendar year. FEMA leads the federalgovernment’s role in preparing for, mitigating the effects of, responding to, and recovering from all domestic disasters, whethernatural or manmade, including acts of terror]
Year
Declarations
Expenditures 1Total
disasterMajor
disaster Emergency
FireManagement
Assistance
2000 . . . . . . . . . . . . . . . . . 113 45 6 62 1,747,5112001 . . . . . . . . . . . . . . . . . 100 45 10 45 11,297,9692002 . . . . . . . . . . . . . . . . . 121 49 1 71 1,883,8222003 . . . . . . . . . . . . . . . . . 123 56 19 48 2,377,9082004 . . . . . . . . . . . . . . . . . 118 68 7 43 5,583,391
1 Expenditures represent FEMA funding obligated as of 12/31/04. Expenditures for declared disasters within a calendar yearrepresent obligations at the time data was collected. Figures will change as those disasters remaining open receive fundingobligated for ongoing recovery and mitigation projects.
Source: U.S. Department of Homeland Security, Federal Emergency Management Agency, Library, and unpublished data. Seealso <http://www.fema.gov/library/drcys.shtm> (accessed 5 April 2005).
National Security and Veterans Affairs 353
U.S. Census Bureau, Statistical Abstract of the United States: 2006