330 photoemission studies of high temperature …
TRANSCRIPT
330
PHOTOEMISSION STUDIES OF HIGH TEMPERATURE SUPERCONDUCTORS
Z.-X. Shen, P.A.P. Lindberg, W.E. Spicer and I. Lindau Stanford Electronics Laboratories, Stanford University, Stanford, CA 94305
J.W. Allen Department of Physics, University of Michigan, Ann Arbor, Michigan 48109-1120
ABSTRACT
Photoemission studies have been performed on all classes of high temperature superconductors except the Tl-related compounds. Particular attention was paid to the surface cleanliness. Comparison with band calculation shows that the one-electron picture cannot adequately explain the electronic structure of this type of materials. Most important, Cu satellites were observed both in the valence band and the Cu 2p core level for all the samples studied, signaling the importance of the d-d correlation effects. The Cu 3d character of these satellites in the valence band was verified using resonance photoemission. The results have been interpreted in terms of a cluster model derived from the two band Anderson Hamiltonian, which in the past has been used successfully to describe the electronic structure of highly correlated systems. No clear satellite structure was observed in the O 1 s core spectrum, which is consistent with the band- like nature of the oxygen states. Examples of changes in the electronic structure, which could be related to Tc, (such as substituting Y by Pr in the Y-Ba-Cu-O system and altering the number of Cu-O layers in the Bi-Ca-Sr-Cu-O system), are also discussed
I. INTRODUCTION
Since the discovery of high-temperature superconductors [ 1,2] photoelectron spectroscopy has been used extensively to investigate their electronic structures. In the literature there are several review papers that summarize the studies performed in the field [3,4,5,6]. In this paper, we review the work done at Stanford University in collaboration with groups at the University of Michigan, University of California at San Diego, and University of Northern Illinois [7-19]. For more complete reviews of the work by different groups, the reader is referred to the above mentioned review articles[3-6].
One of the great triumphs of solid state physics is the development of the one- electron band theory, which has been widely used to describe the electronic structures of solid materials. For a number of materials, band theory has provided an adequate explanation of the electronic structure. However, it has been found in the past that one- electron band theory cannot describe very well the electronic structure of many transition-metal compounds. For example, one-electron band theory predicts that NiO and CoO should be metals, whereas they are found experimentally to be insulators. Facing this dilemma, Mott and Hubbard proposed that the correlation effects are very important for these elements [20, 21]. In other words, the Coulomb interactions among the localized d-electrons are very strong and many-body effects must be taken into account. Hubbard showed that a band gap forms when the Coulomb interaction U is larger than the band width in the half filled case [20, 21]. Using this approach one could qualitatively explain why NiO and CuO are insulators. This model, named the Hubbard model (or the one-band Hubbard model) after its inventor, takes into account the d-d polar charge transfer but completely ignores the oxygen bands. In the last
© 1989 American Institute of Physics

331
decade this picture has been modified based on spectroscopic data in which the authors showed the importance of including charge transfer between oxygen and transition metal ions as well as the d-d coulomb interaction in describing the electronic structure of these compounds [22-32]. The approach of these authors is based upon the Anderson Hamiltonian (or two band Hubbard model):
0 + + H = ~ ° Z d i od i ¢--{- ~ p 0 ~ + Pj .Pj o + + tii(d, opj o h . c . )
i ¢~ j o < i j> o
+ Ud~nionio, + Up njonjo, + U .:nsj i j < i j>
(1)
The first and second terms are for the oxygen and copper bands, respectively. The third term deals with the hybridization of the two bands while the last three terms describe" the Coulomb repulsions among the electrons, where Udd , Unnvv, and U,,d,. are the Coulomb repulsion among the d electrons, p electrons and between p-d electrons respectively. This Hamiltonian is reduced to the one-band Hubbard model when one only considers the Cu bands. The most important parameters in the cluster model are Udd and the charge transfer energy A, which is defined as the energy that is needed to transfer one electron from Cu to O. In other words, it is the energy difference of the centroid of the renormalized Cu and O bands. Based on the extensive studies of the transition-metal compounds, Zannan, Sawatzky and Allen (ZSA) proposed a phase diagram for the transition-metal compounds [28]. In the case of Udd << A, the d-d polar charge transfer dominates the low energy excitations and the compound can be regarded as a traditional Mott insulator for which the Hubbard model is sufficient. On the other hand, the Anderson Hamiltonian is necessary if Udd > A and the insulators are actually charge transfer insulators. For low energy excitations of the charge transfer insulators, it may be possible to construct an effective one band model from the two band model [26, 27, 45].
One of the important common elements in all classes of high Te compounds is copper, which is a typical transition metal. Almost immediately after the discovery of the high T c compounds, possible mechanisms of superconductivity based on the One- band and Two-band Hubbard models were proposed by a number of authors who emphasized the d-d coulomb interactions among the Cud electrons [33-42]. Anderson predicted that the undoped compound La2CuO4 is an antiferromagnetic Mott insulator [33]. This prediction has been confirmed by later experiments which reinforce the importance of the correlations effect [43, 44]. At the same time, extensive band calculations were also performed, and more or less conventional pairing mechanisms were proposed. Given the uncertainty and controversy on the theoretical side, it is important to perform photoemission studies to explore the electronic structure of the high-T c superconductors.
For the transition metal compounds a typical and important characteristic is the existence of satellite structures in the valence band and core levels. The d-like valence band satellites can be identified by the resonance photoemission (RESPES) technique. We have performed RESPES and X-ray photoemission (XPS) studies of all classes of superconductors except the Tl-related compounds. Clear satellite structures were
332
observed which signal the importance of the correlation effects in the superconductors. We have also compared the photoemission results with the predictions of one-electron band calculations which serve as a good starting point for the understanding of the electronic structure. We systematically find that the experimentally observed states in the valence band are shifted to higher binding energy as compared to the results from one-electron band theory. This result, which is typical of many transition-metal compounds, has been attributed to the renormalization of the correlated bands [14]. Based on these results, we conclude that the one-electron band theory does not describe very well the electronic structures of the high Tc materials. We instead interpret our data in terms of a configuration interaction cluster model derived from the Anderson Hamiltonian. We find that the d-d coulomb interaction Udd is much larger than the charge transfer energy A. This validatess the use of a two-band Hamiltonian. Finally, we provide a set of the empirical values for the cluster model Hamiltonian.
This paper is organized in the following way: In section II we discuss the surface preparation and the surface cleanliness, which is a major concern in photoemission spectroscopy. In section III we compare our experimental results with the predictions of one-electron band calculation. In section IV we show the Cu and O core level data, and we use our resonance photoemission results to confirm the Cu 3d nature of the satellite structures in the valence band. Based on these data, in section V we provide an analysis using the configuration interaction cluster (CI) model. Finally, in section VI we discuss the effects on the electronic structure by changing x in the Yl-xPrxBa2Cu307-d system and by altering the number of CuO2 layers in the Bi-Sr-Ca-Cu-O related High-Tc superconductors.
II. SURFACE PREPARATIONS
Because of the inherent surface sensitivity of photoelectrons, the ability to prepare and maintain a clean surface in ultrahigh vacuum (UHV) is of crucial importance in all photoemission experiments. In the field of High-Tc superconductors, questions have been raised regarding the validity of photoemission results for the elucidation of the mechanism behind the superconductivity. This is mainly because of the ease with which many ceramic materials, including the perovskite-related structures, lose oxygen especially in UHV. Moreover, the inappropriateness of many surface cleaning procedures, such as ion-sputtering and in-situ annealing, because of disrupted valence state bands and loss of oxygen respectively, leaves only "mechanical" treatments as fracturing, in situ scraping (polycrystalline bulk samples) and in situ brushing (thin films) as possible means of producing clean surfaces in UHV. Until recently it has been difficult to know if these treatments produce surfaces characteristic of the bulk High-Tc superconductors. However, with the progressive improvement in the fabrication of High-Tc superconductors the situation has changed. Single crystals of a size large enough for photoemission studies are now available. Furthermore, probably because of the layered character of the high-Tc superconductors, single crystals can readily be cleaved, thus allowing an evaluation of earlier studies performed on polycrystalline materials. Stoffel et al. was the first to present LEED pictures and photoemission spectra from in situ cleaved single crystals of YBa2Cu307 [46].
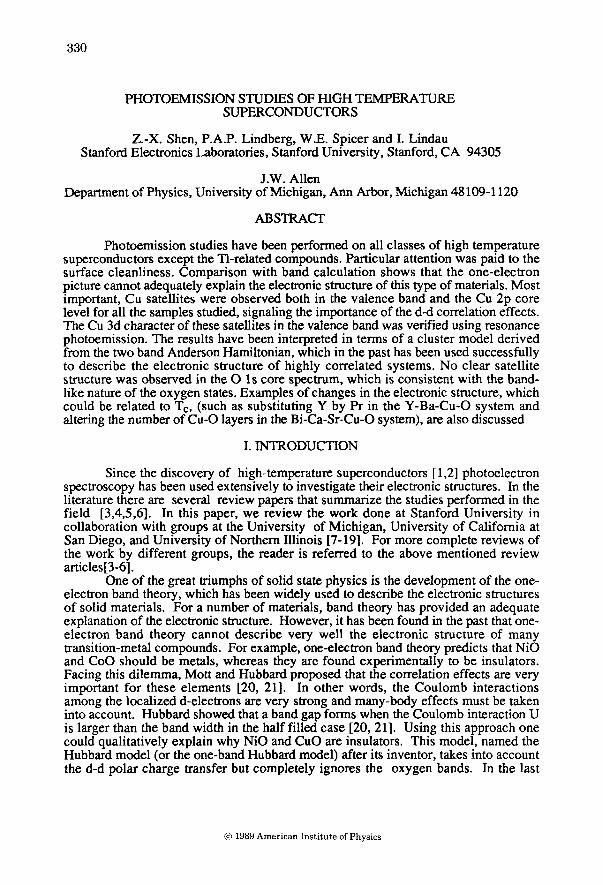
Recently we were able to cleave single crystals of the Bi2Sr2CaCu208 High-Tc superconductors in UHV. The cleaved surfaces were examined using Low-Energy Electron Diffraction (LEED). In Fig. 1 we present one of our LEED patterns recorded at a beam energy of 45 eV [ 18]. This LEED pattern was reproduced for six different crystals and is completely representative for the results we have obtained. As we described in detail elsewhere [18], the LEED pattern conclusively shows that the cleavage plane is c-axis oriented. Moreover, the surface structure, revealing a
333
superstructure along one of the axes, is in agreement with the bulk crystal structure [47]. Thus, we infer that the cleaved single-crystal produces a surface of high quality with a long-range periodicity representative of the layers in the bulk. Furthermore, 24 hours in UHV (at 1 x 10⁻¹u tort), including many hours of ultraviolet photoemission spectroscopy (UPS) and XPS measurements, did not adversely affect the quality of the LEED pattern, although the diffraction spots became somewhat fuzzier. In light of these facts, we are confident that these surfaces obtained in UHV conditions are clean over a time long enough to perform extensive photoemission studies.
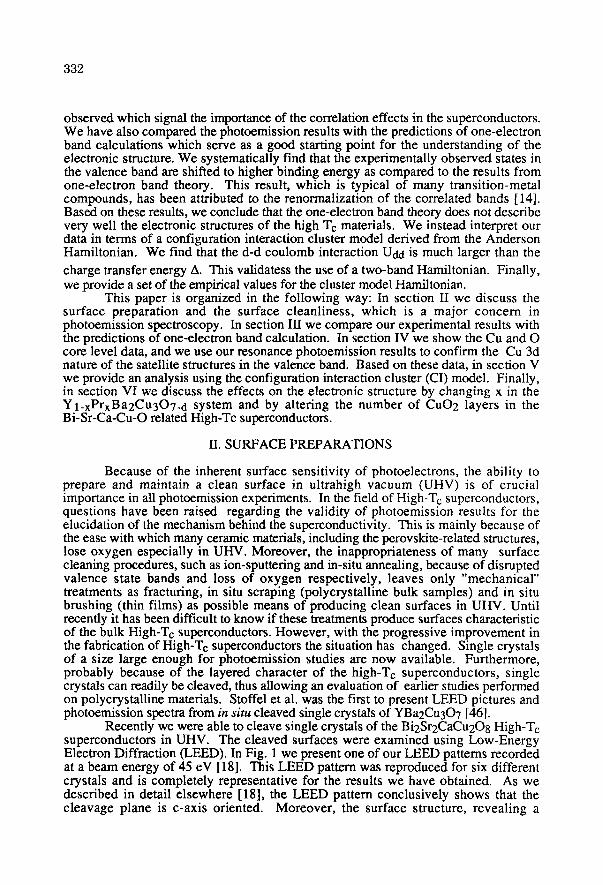
With the above discussion in mind, in this paragraph we will compare photoemission spectra, recorded in both the UPS and the XPS regimes, from in situ scraped polycrystalline and in situ cleaved single crystalline samples of Bi2Sr2CaCu2Os. In Fig. 2 we show the valence band spectra of the poly- and single- crystalline samples using (a) HeII (40.8 eV) and (b) MgKa (1253.6 eV) radiation. The significantly different energy resolutions of the two photon sources accounts for the different widths of the spectral features in the two panels. Apart from a higher background and slightly broader features for the polycrystalline sample in panel (a), there is a similarity between the spectra of the poly- and single crystalline samples in both panels. The HeII spectra (a) reveal a clear Fermi level cutoff for both samples, and all the peak positions are the same. The similarity between the two types of sample surfaces is further illustrated in Fig. 3 where the Ols core levels of the two samples are shown. Fig. 3 shows that both samples exhibit a single, symmetric Ols core level at the same binding energy and without any sign of oxygen in different chemical states. (within the experimental resolution). Note that the appearance of single Ols peaks for
e 0
4 • 0
Fig. 1. Low-Energy Electron Diffraction (LEED) pattern from a Bi2Sr2CaCu208 single-crystal recorded at 45 eV beam energy.

334
>- E:
r r
o 9 Z i i i
z
(a) ht) = 40 .8 eV
Po ly ~ . _ ~" ~ . , ~ £
:" A
Smgle ,"
Z
" , 4 _
t I ~ I J I L I
-16 -12 -8 -4 0 I
4
Fig. 2. Comparison of spectra from poly- and single- crystalline samples of Bi2Sr2CaCu20 8 measured at a photon energy of (a) 40.8 eV and (b) 1253.6 eV.
O9 I-- z
>- cc
n-
7
t .U
7
e e ' ~ o
• ",' Po ly • •
- . . :'-'~ . - " ...-..,;" -~ °o
• • • • ~ o ,
• -....."'---..o...- _ S ing le
"1
_ (b) ht~ = 1253 .6 e V
I I I I
-16 -12 -8 -4 0 4
E N E R G Y R E L A T I V E T O T H E F E R M I L E V E L (eV)
Bi2Sr2CaCu208 sharply contrasts with the corresponding core level data for the YBa2Cu307 system [3-5], with probably only one exception, as far as we are aware[48]. Based on these remarks, we conclude that the valence band states probed by photoemission at room temperature are almost identical for in situ scraped polycrystalline and in-situ cleaved single crystals of Bi2Sr2CaCu2Os. Consequently, the results previously obtained on in situ scraped polycrystalline samples of Bi2Sr2CaCu208 appear to reflect the electronic structure of a clean surface, thus validating the use of scraping as a cleaning procedure for this type of ceramic.
It should be pointed out here that the preparation of the YBa2Cu307 compound surface is more tricky. We found that the valence band and the O ls core level PES spectra of YBa2Cu307 samples change with time in UHV at room temperature [7]. Recent works by List and Arko el at. suggest that the PES experiments on the EuBa2Cu307 (which is the same as YBa2Cu307) samples must be performed at low temperature [49]. They found that the valence band PES spectra change dramatically upon warming the single crystals from 20 K to room temperature, which they attribute to the loss of oxygen in the surface region. This result may be related with the fact that the Ols core level spectra from different YBa2Cu307 samples are so inconsistent [3-5]. This deference of the surface stability in the UHV between the Bi2Sr2CaCu208 and
335
=< I -
z
I I I I -536 -532 -528 -524
ENERGY RELATIVE TO THE FERMI LEVEL (eV)
Fig. 3. Ols core level spectra for poly- and single- crystalline samples of Bi2Sr2CaCu208 measured at a photon energy of 1253.6 eV.
YBa2Cu307 is not fully understood at this point, but we think this might be related to the fact that the YBa2Cu307 compound has an intrisic defect structure (i.e., the oxygen vacancies in the same planes as the one dimensional Cu-O chains), while the Bi2Sr2CaCu208 compound does not have such a defect structure.
Because our discussion and modeling are based solely on the two common phenomena observed in all families of superconductors we studied even with the above mentioned uncertainty, we feel confident about our results. As we will discuss later, the two phenomena are: (a) satellite structures in the valence band and Cu core levels, and (b) the shift of the valence band to higher binding energy compared with band theory. These two phenomena were also observed in EuBa2Cu307 compounds cleaved at 20 K [49].
III. COMPARISON WITH BAND CALCULATIONS
Extensive band calculations have been performed on the high temperature superconductors [6]. These calculations provide much insight into the electronic structures of the high Tc compounds, in particular the energy distribution of different bands and the degree of hybridization in the valence band. However, significant discrepancies were found between the experimental results and the results derived from one-electron band calculations. As an example, we present in Fig. 4 the valence band EDC's of Bi2Sr2CaCu208 as a function of the photon energies in comparison with curves obtained from a one electron band calculation. The theoretical curves were obtained by adding the theoretical partial density of states (DOS) from band theory weighted by the photoionization cross section of the various elements at different

336
I--
>-
I.,- n--
z U.l t-- z
Bi2CaSrzCu208 (a) B'
(Band T h e ° r y ) ~ . I
. ~ -i:__ ~ ". .Jg
",,~ C
h•=21. 2 eV A ". I . . . . (b)
(Band Theo --. ~ S r y ) ~ l
I 1 hu=40.8 eV A "...
(c) (Band T h e o r y ) ~ ~
hu= 1253.6 oV
I r F I
Fig. 4. Comparison between photoemission spectra (dotted curves) from Bi2Sr2CaCu208 recorded at three different photon energies and the results of one- electron band calculations weighted by the photoionization cross-sections at the corresponding -16 -12 -8 -4 0 4
ENERGY RELATIVE TO FERMI LEVEL (eV) photon energies.
photon energies [50]. By comparing the experimental and theoretical curves, one finds that the experimental results do not agree with the band theory very well. There are two obvious differences between the experimental and theoretical curves. First of all, the DOS observed at EF is lower than predicted by the band theory. Second, the centroid of the experimental valence band is shifted to higher binding energy by about 1.5 eV. These two discrepancies are observed in all the superconductors we have studied. As has been pointed out earlier, we will only concentrate on the results which are common to all the superconductors. The shift in the valence band centroid has also been observed in some transition-metal oxides, such as NiO, where Sawatzky and Allen explained this shift as due to the coulomb interaction Udd of the 3d electrons [26]. We believe the shift of the valence band centroid observed in the superconductors is due to a mechanism similar to that in NiO, which is clearly due to correlation effects. Thus, this comparison shows the necessity to take into account many body effects.

337
IV. RESPES AND XPS EXPERIMENTS
As we have said in the introduction, the photoelectron spectroscopy (PES) features which are important in many transition-metal compounds, are the satellite structures observed in the valence band and the core level data. These satellites clearly demonstrate the existence of correlation effects among the d electrons in these compounds. For all families of the high temperature superconductors we studied, clear satellite structures were observed both in the valence band and the core levels. The assignment of a core level satellite to a particular element, (e.g., Cu in the high Tc material) is fairly straight forward because the core levels of the different elements are usually located at different bindiog energies. On the other hand, the determination of the valence band features requires more sophisticated experiments. Resonance photoemission (RESPES) has in the past been proven to be an extremely effective tool for the determination of the character of the valence band features in the transition metal compounds[51-59]. For simplicity we will concentrate on the element Cu, even though we performed RESPES experiment for different elements in the compounds. If one tunes the photon energy through the Cu 3p to 3d absorption edge at 74 eV, some electrons will be excited into the empty d states. Because these empty d states are localized, the electrons will decay through a two-electron Koster-Kronig process to the same final states as direct 3d photoemission, causing intensity changes of the Cu features and providing a good way to determine the origin of the valence band features. To our knowledge the first RESPES experiment on the YBa2Cu307 compound was performed by Kurtz et al [60]. We performed RESPES experiments independendy on the YBa2Cu307 and (Lal.xSrx)2CuO4 compounds [7]. In Fig. 5f we present the RESPES data for (Lal-xSrx)2CuO4 compound with the photon energy in the vicinity of the Cu 3p ---> Cu 3d absorption edge. Since feature D in Fig. 5 exhibits a resonant behavior at the absorption edge, it is assigned to a Cu 3d satellite. As we pointed out in our previous paper [7], the features A and B show antiresonance behavior, revealing
E-
>- tr, n-
tE v
z uJ i -
La~ 8Sro 2CUO4 A
I
La ~Plt2
I La 5P3t 2 1 D C
--ph (eV)
I I I I -20 - 15 - 10 -5 E F
ENERGY RELATIVE TO FERMI LEVEL (eV)
Fig. 5. Photoemission spectra from Lal.8Sr0.2CuO4 for various photon energies around the Cu2p absorption threshold around 74 eV. The inset shows the detailed structure of the Fermi edge.
338
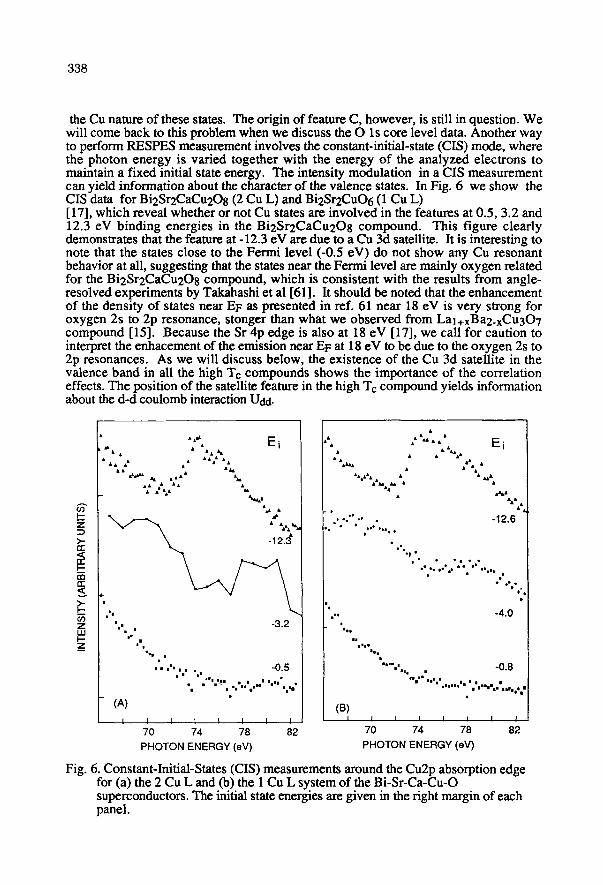
the Cu nature of these states. The origin of feature C, however, is still in question. We will come back to this problem when we discuss the O Is core level data. Another way to perform RESPES measurement involves the constant-initial-state (CIS) mode, where the photon energy is varied together with the energy of the analyzed electrons to maintain a fixed initial state energy. The intensity modulation in a CIS measurement can yield information about the character of the valence states. In Fig. 6 we show the CIS data for Bi2Sr2CaCu208 (2 Cu L) and Bi2Sr2CuO6 (1 Cu L) [17], which reveal whether or not Cu states are involved in the features at 0.5, 3.2 and 12.3 eV binding energies in the Bi2Sr2CaCu2Os compound. This figure clearly demonstrates that the feature at -12.3 eV are due to a Cu 3d satellite. It is interesting to note that the states close to the Fermi level (-0.5 eV) do not show any Cu resonant behavior at all, suggesting that the states near the Fermi level are mainly oxygen related for the Bi2Sr2CaCu208 compound, which is consistent with the results from angle- resolved experiments by Takahashi et al [61]. It should be noted that the enhancement of the density of states near EF as presented in ref. 61 near 18 eV is very strong for oxygen 2s to 2p resonance, stonger than what we observed from Lal+xBa2_xCu307 compound [15]. Because the Sr 4p edge is also at 18 eV [17], we call for caution to interpret the enhacement of the emission near EF at 18 eV to be due to the oxygen 2s to 2p resonances. As we will discuss below, the existence of the Cu 3d satellite in the valence band in all the high Te compounds shows the importance of the correlation effects. The position of the satellite feature in the high Tc compound yields information about the d-d coulomb interaction Odd.
>-
rr"
Z LU I-- z
" " E i a , j . • • • A
• A,, ." . . % . A
AA ",". , , N
":"2'
| l l
. - 3 . 2 1•• | II •
| l
%• m
-0 .5 I I I l l l l l l I 1111818"
8 j l I 81811811~ I I i 81 118 I l l I m
(A)
I
" \ : ' " "" E i
AA~ AILA A •
AAAAA A • • • ~
A A
* - . " - ' • -12 • • • e °~• I • o • o
• •°•1• ° , • ° • °~o°o,O e o eo o o***e,,e t
o ¢ e
" -4.0 = • • •
| • e • • • • e j
"°", '.. , . -0.8 = l == • • •
• • • • = = • • | e | | u • = • | • • == | • l • e e t |
(B) | I I I I I I I I I I I I I I
70 74 78 82 70 74 78 82
PHOTON ENERGY (eV) PHOTON ENERGY (eV)
Fig. 6. Constant-Initial-States (CIS) measurements around the Cu2p absorption edge for (a) the 2 Cu L and (b) the 1 Cu L system of the Bi-Sr-Ca-Cu-O superconductors. The initial state energies are given in the right margin of each panel.
339
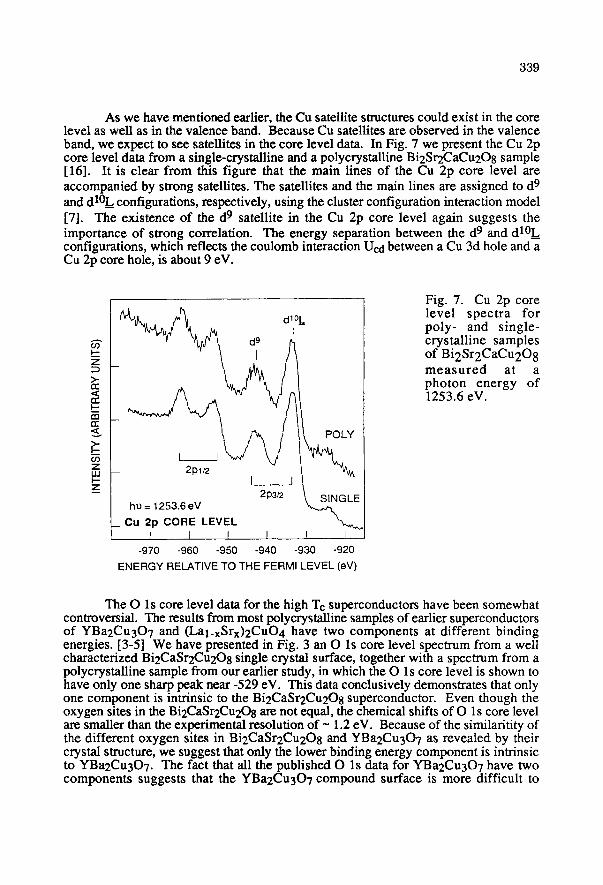
As we have mentioned earlier, the Cu satellite structures could exist in the core level as well as in the valence band. Because Cu satellites are observed in the valence band, we expect to see satellites in the core level data. In Fig. 7 we present the Cu 2p core level data from a single-crystalline and a polycrystalline Bi2Sr2CaCu208 sample [16]. It is clear from this figure that the main lines of the Cu 2p core level are accompanied by strong satellites. The satellites and the main lines are assigned to d 9 and dl0L,_ configurations, respectively, using the cluster configuration interaction model [7]. The existence of the d 9 satellite in the Cu 2p core level again suggests the importance of strong correlation. The energy separation between the d 9 and dl0L configurations, which reflects the coulomb interaction Ucd between a Cu 3d hole and a Cu 2p core hole, is about 9 eV.
I - -
O3 Z LLI I'-- _z
/ •J . , A , dl°L
1 _ _ 1 2p3~
h'~ = 1253.6 eV L , . ~ - -
_ Cu 2p CORE LEVEL I I I I I I
-970 -960 -950 -940 -930 -920
ENERGY RELATIVE TO THE FERMI LEVEL (eV)
Fig. 7. Cu 2p core level spectra for poly- and single- crystalline samples of Bi2Sr2CaCu208 m e a s u r e d at a photon energy of 1253.6 eV.
The O ls core level data for the high Tc superconductors have been somewhat controversial. The results from most polycrystaUine samples of earlier superconductors of YBa2Cu307 and (Lal.xSrx)2CuO4 have two components at different binding energies. [3-5] We have presented in Fig. 3 an O ls core level spectrum from a well characterized Bi2CaSr2Cu208 single crystal surface, together with a spectrum from a polycrystalline sample from our earlier study, in which the O ls core level is shown to have only one sharp peak near -529 eV. This data conclusively demonstrates that only one component is intrinsic to the Bi2CaSr2Cu208 superconductor. Even though the oxygen sites in the Bi2CaSr2Cu208 are not equal, the chemical shifts of O Is core level are smaller than the experimental resolution of ~ 1.2 eV. Because of the similaritity of the different oxygen sites in Bi2CaSr2Cu208 and YBa2Cu307 as revealed by their crystal structure, we suggest that only the lower binding energy component is intrinsic to YBa2Cu307. The fact that all the published O ls data for YBa2Cu307 have two components suggests that the YBa2Cu307 compound surface is more difficult to
340
prepare, which, as we pointed out earlier, is probably related with the intrinsic defect structure o f the YBa2Cu307 compound. The fact we see a sharp singlet O ls peak in the Bi2CaSr2Cu208 compound gives us confidence about the PES data obtained from Bi2CaSr2Cu208 compound. It is clear that the O ls core level does not have a strong satellite structure as the Cu 2p core level does. On the other hand, there have been suggestions that the coulomb interaction among the oxygen 2p electrons, Upo, is about 5-8 eV[5, 62], not too much smaller than Udd, the coulomb interaction amohg the Cu 3d electrons. The fact that we observed satellites in the Cu 2p core level spectrum while we did not see satellites in the O ls core level spectrum cannot be explained within the context of the configuration interaction model, but it may be understood if one takes into the account the difference between the oxygen and copper band widths. Since no strong satellite structure is observed in the O ls core level, which is consistent with the band-like nature of the oxygen 2p states, it seems unlikely that a clear oxygen two hole satellite will be observed in the valence band spectra. Returning to the issue of feature C in Fig. 4, it has been suggested by Thiry et al.that this is due to the two- oxygen hole satellites in the valence band [63]. In view of the O 1 s core level data, we think this is very unlikely to be true.
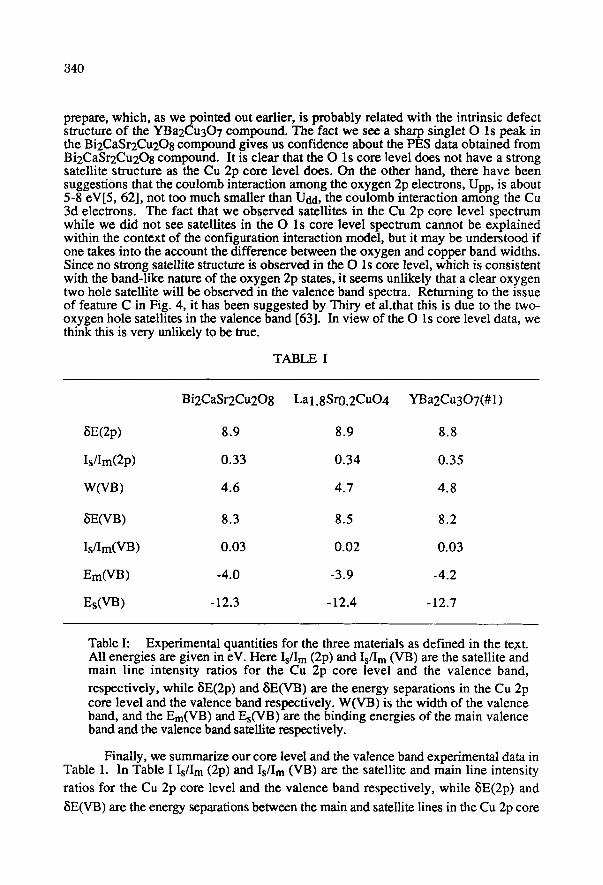
TABLE I
Bi2CaSr2Cu208 Lal.8Sr0.2CuO4 YBa2Cu307(#1)
8E(2p) 8.9 8.9 8.8
Isflm(2p) 0.33 0.34 0.35
W(VB) 4.6 4.7 4.8
6E(VB) 8.3 8.5 8.2
Isflm(VB) 0.03 0.02 0.03
Em(VB) -4.0 -3.9 -4.2
Es(VB) -12.3 -12.4 -12.7
Table I: Experimental quantities for the three materials as defined in the te~t. All energies are given in eV. Here Is/Ira (2p) and Is/Ira (VB) are the satellite and main line intensity ratios for the Cu 2p core level and the valence band,
respectively, while 8E(2p) and 8E(VB) are the energy separations in the Cu 2p core level and the valence band respectively. W(VB) is the width of the valence band, and the Em(VB) and Es(VB) are the binding energies of the main valence band and the valence band satellite respectively.
Finally, we summarize our core level and the valence band experimental data in Table 1. In Table I Is/Irn (2p) and Is/Ira (VB) are the satellite and main line intensity
ratios for the Cu 2p core level and the valence band respectively, while ~E(2p) and
8E(VB) are the energy separations between the main and satellite lines in the Cu 2p core
341
level and the valence band respectively. W(VB) is the width of the valence band and the Em(VB) and Es(VB) are the binding energies of the main valence band and the valence band satellite respectively. The detailed analysis of the experimental data with the cluster interaction model (CI) is based solely on these data. We would like to emphasize that, even though some uncertainty exists in the present data, (e.g., feature C in Fig. 4), the data we list in the table or which will be used in our model, are not varying from sample to sample, and similar values have also been reported by other groups [3-6]. The valence band Cu d8 satellite is also observed in the low temperature cleaved EuBa2Cu307 single crystal samples [49]. As we pointed out at the beginning of this paper, these are the results we would like to stress.
V. CI MODEL DESCRIPTION OF EXPERIMENTAL DATA
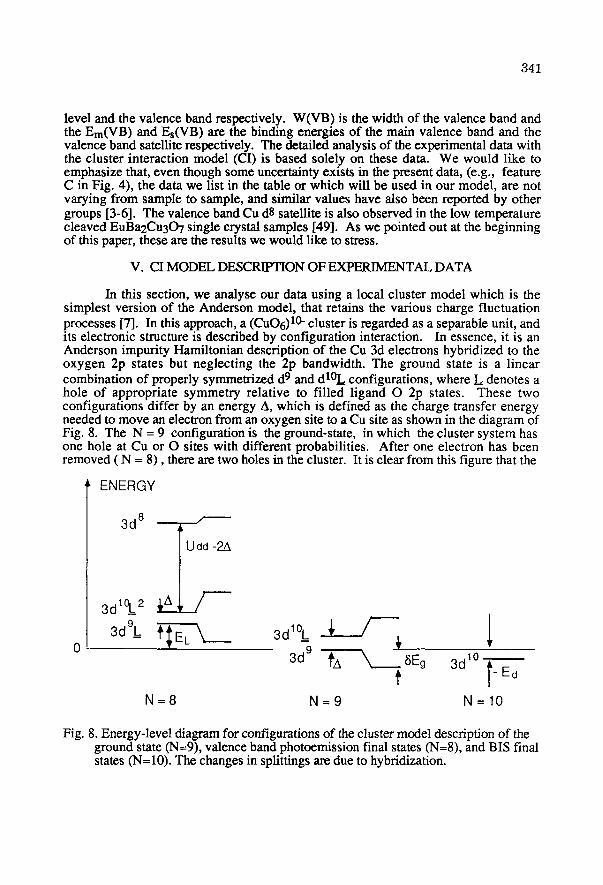
In this section, we analyse our data using a local cluster model which is the simplest version of the Anderson model, that retains the various charge fluctuation processes [7]. In this approach, a (CuO6) 10- cluster is regarded as a separable unit, and its electronic structure is described by configuration interaction. In essence, it is an Anderson impurity Hamiltonian description of the Cu 3d electrons hybridized to the oxygen 2p states but neglecting the 2p bandwidth. The ground state is a linear combination of properly symmetrized d 9 and dl0L configurations, where L denotes a hole of appropriate symmetry relative to filled ligand O 2p states. These two configurations differ by an energy A, which is defined as the charge transfer energy needed to move an electron from an oxygen site to a Cu site as shown in the diagram of Fig. 8. The N = 9 configuration is the ground-state, in which the cluster system has one hole at Cu or O sites with different probabilities. After one electron has been removed ( N = 8), there are two holes in the cluster. It is clear from this figure that the
0
ENERGY
3d8 - - ' ~ i -2&
= P / 3d9L {~EL \ 3d1°_L ~ /
3d 9
N=8 N=9
keg f
3d1° l- Ed N=10
Fig. 8. Energy-level diagram for configurations of the cluster model description of the ground state (N=9), valence band photoemission final states (N=8), and BIS final states (N= 10). The changes in splittings are due to hybridization.

342
TABLE II
Bi2CaSr2Cu208 Lat.sSr0.2CuO4 YBa2Cu3OT(#1)
Ucd 7.8 7.8 7.8
T 2.4 2.4 2.5
A 0.4 0.3 0.5
U 6.2 6.1 6.5
EL 2.4 2.3 2.6
Ed -2.0 -2.0 -2.1
BEg 2.2 2.25 2.2
Eml(VB) 0.7 0.65 0.9
Em2(VB) 6.8 6.85 7.5
Es(VB) 12.3 12.25 12.8
Is/Im(VB) 0.07 0.07 0.07
EBIS 0.2 0.25 0.2
nd 9.4 9.5 9.4
Egap 1.0 0.9 1.1
Table II: Model parameters and quantifies for the three materials measured. Energies are in eV. The various symbols are defined in reference 7. As can be clearly seen in Fig.8, Ucd is the coulomb repulsion between a 2p core hole and a 3d hole, while U is the coulomb repulsion between two 3d holes; T is the charge transfer integral, and A is the charge transfer energy by moving one electron from oxygen to copper; EL is the energy difference between the 3d 9 and 3d9L configurations; Ed is the energy difference between 3d 9 and 3d 10 configurations; BEg is the hybridization shift of the ground state; the centroid of Eml(VB) and Era2 (VB) can be compared with the Em (VB) in table I; Es (VB) is the valence band satellite position obtained by the model parameters T, A, and U which can be compared with the Es (VB) in table I; Is/Im (VB) is the valence band satellite and main line intensity ratio from the cluster model which can be compared with the Is/Im (VB) in table I; EBIS is the energy of BIS peak expected from the cluster model; nd is the number of the d electrons; Egap is the theoretical gap energy defined as the summation of EBIS and Eml(VB).
343
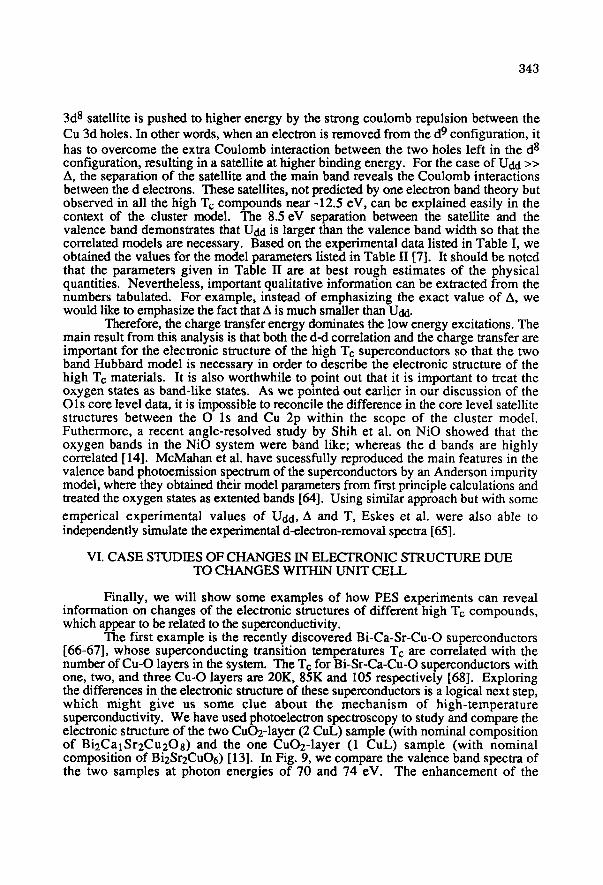
3d 8 satellite is pushed to higher energy by the strong coulomb repulsion between the Cu 3d holes. In other words, when an electron is removed from the d 9 configuration, it has to overcome the extra Coulomb interaction between the two holes left in the d 8 configuration, resulting in a satellite at higher binding energy. For the case of Udd >> A, the separation of the satellite and the main band reveals the Coulomb interactions between the d electrons. These satellites, not predicted by one electron band theory but observed in all the high Tc compounds near -12.5 eV, can be explained easily in the context of the duster model. The 8.5 eV separation between the satellite and the valence band demonstrates that Odd is larger than the valence band width so that the correlated models are necessary. Based on the experimental data listed in Table I, we obtained the values for the model parameters listed in Table II [7]. It should be noted that the parameters given in Table II are at best rough estimates of the physical quantities. Nevertheless, important qualitative information can be extracted from the numbers tabulated. For example, instead of emphasizing the exact value of A, we would like to emphasize the fact that A is much smaller than Udd.
Therefore, the charge transfer energy dominates the low energy excitations. The main result from this analysis is that both the d-d correlation and the charge transfer are important for the electronic structure of the high Te superconductors so that the two band Hubbard model is necessary in order to describe the electronic structure of the high Te materials. It is also worthwhile to point out that it is important to treat the oxygen states as band-like states. As we pointed out earlier in our discussion of the Ols core level data, it is impossible to reconcile the difference in the core level satellite structures between the O ls and Cu 2p within the scope of the cluster model. Futhermore, a recent angle-resolved study by Shih et al. on NiO showed that the oxygen bands in the NiO system were band like; whereas the d bands are highly correlated [14]. McMahan et al. have sucessfully reproduced the main features in the valence band photoemission spectrum of the superconductors by an Anderson impurity model, where they obtained their model parameters from first principle calculations and treated the oxygen states as extented bands [64]. Using similar approach but with some emperical experimental values of Udd, A and T, Eskes et al. were also able to independently simulate the experimental d-electron-removal spectra [65].
VI. CASE STUDIES OF CHANGES IN ELECTRONIC STRUCTURE DUE TO CHANGES WITHIN UNIT CELL
Finally, we will show some examples of how PES experiments can reveal information on changes of the electronic structures of different high Tc compounds, which appear to be related to the superconductivity.
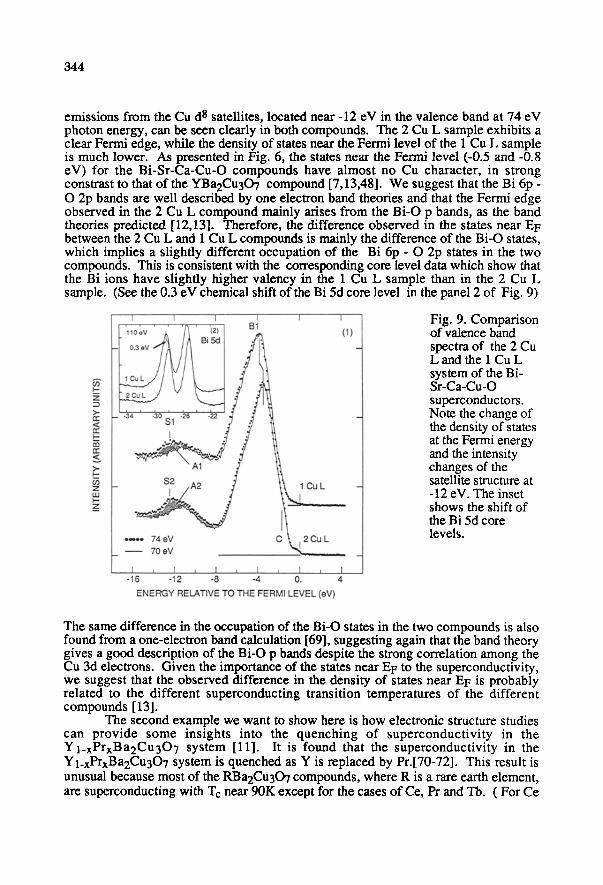
The first example is the recently discovered Bi-Ca-Sr-Cu-O superconductors [66-67], whose superconducting transition temperatures Tc are correlated with the number of Cu-O layers in the system. The T¢ for Bi-Sr-Ca-Cu-O superconductors with one, two, and three Cu-O layers are 20K, 85K and 105 respectively [68]. Exploring the differences in the electronic structure of these superconductors is a logical next step, which might give us some clue about the mechanism of high-temperature superconductivity. We have used photoelectron spectroscopy to study and compare the electronic structure of the two CuO2-1ayer (2 CuL) sample (with nominal composition of Bi2CalSr2Cu2Os) and the one CuO2-1ayer (1 CuL) sample (with nominal composition of Bi2Sr2CuO6) [13]. In Fig. 9, we compare the valence band spectra of the two samples at photon energies of 70 and 74 eV. The enhancement of the
344
emissions from the Cud 8 satellites, located near -12 eV in the valence band at 74 eV photon energy, can be seen clearly in both compounds. The 2 Cu L sample exhibits a clear Fermi edge, while the density of states near the Fermi level of the 1 Cu L sample is much lower. As presented in Fig. 6, the states near the Fermi level (-0.5 and -0.8 eV) for the Bi-Sr-Ca-Cu-O compounds have almost no Cu character, in strong constrast to that of the YBa2Cu307 compound [7,13,48]. We suggest that the Bi 6p - O 2p bands are well described by one electron band theories and that the Fermi edge observed in the 2 Cu L compound mainly arises from the Bi-O p bands, as the band theories predicted [12,13]. Therefore, the difference observed in the states near EF between the 2 Cu L and 1 Cu L compounds is mainly the difference of the Bi-O states, which implies a slightly different occupation of the Bi 6p - O 2p states in the two compounds. This is consistent with the corresponding core level data which show that the Bi ions have slightly higher valency in the 1 Cu L sample than in the 2 Cu L sample. (See the 0.3 eV chemical shift of the Bi 5d core level in the panel 2 of Fig. 9)
I I I I I I
0.3 eV .* '
I , I J I , I , I - ~ ' - 16 - 12 -8 -4 0. 4
E N E R G Y R E L A T I V E T O T H E F E R M I L E V E L ( e V )
Fig. 9. Comparison of valence band spectra of the 2 Cu L and the 1 Cu L system of the Bi- Sr-Ca-Cu-O superconductors. Note the change of the density of states at the Fermi energy and the intensity changes of the satellite structure at -12 eV. The inset shows the shift of the Bi 5d core levels.
The same difference in the occupation of the Bi-O states in the two compounds is also found from a one-electron band calculation [69], suggesting again that the band theory gives a good description of the Bi-O p bands despite the strong correlation among the Cu 3d electrons. Given the importance of the states near EF to the superconductivity, we suggest that the observed difference in the density of states near E F is probably related to the different superconducting transition temperatures of the different compounds [13].
The second example we want to show here is how electronic structure studies can provide some insights into the quenching of superconductivity in the Yl_xPrxBa2Cu30 7 system [11]. It is found that the superconductivity in the Yl_xPrxBa2Cu307 system is quenched as Y is replaced by Pr.[70-72]. This result is unusual because most of the RBa2Cu307 compounds, where R is a rare earth element, are superconducting with "re near 90K except for the cases of Ce, Pr and Tb. ( For Ce
345
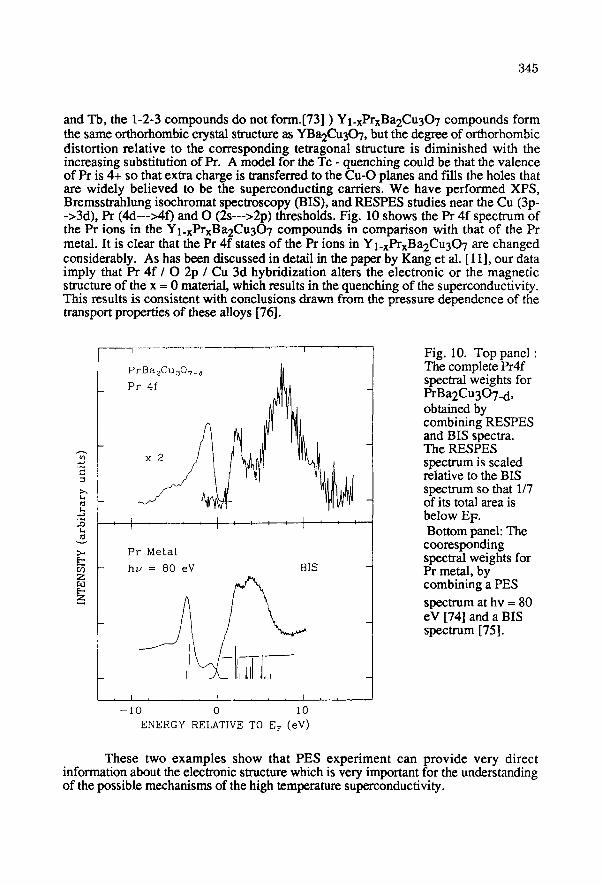
and Tb, the 1-2-3 compounds do not form.[73] ) Yl_xPrxBa2Cu307 compounds form the same orthorhombic crystal structure as YBa2Cu3OT, but the degree of orthorhombic distortion relative to the corresponding tetragonal structure is diminished with the increasing substitution of Pr. A model for the Tc - quenching could be that the valence of Pr is 4+ so that extra charge is transferred to the Cu-O planes and fills the holes that are widely believed to be the superconducting carriers. We have performed XPS, Bremsstrahlung isochromat spectroscopy (BIS), and RESPES studies near the Cu (3p- ->3d), Pr (4d--->4f) and O (2s--->2p) thresholds. Fig. 10 shows the Pr 4f spectrum of the Pr ions in the Yl_xPrxBa2Cu307 compounds in comparison with that of the Pr metal. It is clear that the Pr 4f states of the Pr ions in Yl_xPrxBa2Cu307 are changed considerably. As has been discussed in detail in the paper by Kang et al. [11], our data imply that Pr 4f / O 2p / Cu 3d hybridization alters the electronic or the magnetic structure of the x = 0 material, which results in the quenching of the superconductivity. This results is consistent with conclusions drawn from the pressure dependence of the transport properties of these alloys [76].
u? Z
z
Pz
Pl
' t . . . . I . . . . I ' ' '
P r M e t a l
h v = 80 eV BIS
- I 0 0 10
ENERGY RELATIVE TO E r (eV)
Fig. 10. Top panel : The complete Pr4f spectral weights for PrBa2Cu307_d, obtained by combining RESPES and BIS spectra. The RESPES spectrum is scaled relative to the BIS spectrum so that 1/7 of its total area is below E F. Bottom panel: The cooresponding spectral weights for Pr metal, by combining a PES spectrum at hv = 80 eV [74] and a BIS spectrum [75].
These two examples show that PES experiment can provide very direct information about the electronic structure which is very important for the understanding of the possible mechanisms of the high temperature superconductivity.
346
VII. SUMMARY
We have performed PES studies of the electronic structures for all the classes of the high temperature superconductors except the TI related compounds. One important common feature for all the high Tc compounds is the Cu 3d-O 2p bands, which are highly correlated we often has been observed in the transition metal compounds. The one-electron band theory is not sufficient to describe these bands. Our results suggest that both the d-d coulomb interaction and the p-d charge transfer are important for the electronic stucture of the superconductors, with the charge transfer process dominating the low energy excitations. On the other hand, there are also differences in the different compounds. The Bi-O bands derived from the Bi-O planes in the Bi2Ca1Sr2Cu208 compound, for example, are very important for the states near EF. Even though the Cu-O hybrids are best described by the two band Hubbard model, the details of the electronic structure, especially for the states near EF still remain largely unknown. There is evidence from the Bi2CalSr2Cu2Os compound that the states near the Fermi level, which presumably are most important for the superconductivity, are mostly of oxygen character [13, 61]. Our results show that the dispersive nature of the oxygen band is important. However, how to take the translational symmetry and correlation
"into account at the same time is still unexplored. Therefore, more experimental and theoretical work is needed to elucidate the electronic structure of the high Tc superconductors and many transition-metal oxides.
ACKNOWI .E'T~EMENTS
We are very grateful to many of our colleagues who participated in our experiments as reflected in the references 7 to 19. We especially thank M.B. Maple for sharing his insight and for providing the original motivation to study the Yl.xPrxBa2Cu307 alloys. We thank R.S. List and A.J. Arko for communicating the results on low temperature-cleaved single crystals before publication. The RESPES experiments were performed at Stanford Synchrotron Radiation Laboratory (SSRL) and Synchrotron Radiation Center of the University of Wisconsin. SSRL is funded by the DOE under contract DE-AC03-82ER-13000, Office of Basic Energy Sciences, Division of Chemical / Material Sciences. We gratefully acknowledge support from the National Science Foundation - Materials Research Laboratory Program at the Center for Materials Research at Stanford University, the Air Force Contract AFSOSR-87-0389, JESP contract DAAG 29-85-K-0048, and at the University of Michigan the U.S. National Science Foundation through Low Temperature Physics Grant No. DMR-87- 21654 (J.W.A.).
REFERENCES
1. J.G. Bednorz and K. A. Miiller, Zeitschrift fiir Physik B 64, 189 (1986). 2. M.K. Wu, J. R. Ashburn, C. J. Torng, P. H. Hor, R. L. Meng, L. Gao, S. J.
Huang, Y. Q. Wang, and C. W. Chu, Phys. Rev. I~tt. 58, 908 (1987). 3. G6ran Wendin, J. de Physique, Colloque C9, and the references therein. 4. R.L. Kurtz, AIP Conf. Proc. No. 165, p. 222, AIP, New York, 1988, and the
references therein. 5. C. Fuggle, J. Fink and N. Niicker, to be published as Int. J. Mod. Phys. B
(1988), and the references therein. 6. K.C. Hass, to appear in Solid State Physics. (H. Ehrenreich and D. Tumbull,
eds. ) Vol. 42, Academic Press, Orlando, 1989
347
7 Z.-X. Shen, J.W. Allen, J.-J. Yeh, J.-S. Kang, W. Ellis, W. E. Spicer, I. Lindau, M. B. Maple, Y. D. Dalichaouch, M. S. Torikachvili, J.Z. Sun and T.H. Geballe, Phys. Rev. B, Vol. 36, 8414, 1987
8 Z.-X. Shen, J.-J. Yeh, I. Lindau, W.E. Spicer, J.Z. Sun, K. Char, N. Missert, A. Kapitulnik, T.H. Geballe, M.R. Beasley, SPIE Syrup. Proc. Vol. 948- 10 ,41-48 1987
9 Z.-X. Shen, J.W. Allen, J.-J. Yeh, J.-S. Kang, W. Ellis, W. E. Spicer, I. Lindau, M. B. Maple, Y. D. Dalichaouch, M. S. Torikachvili, J.Z. Sun and T.H. Geballe, MRS Syrup. Proc. Vol. 99, P349, 1987
10. P.A.P. Lindberg, Z.-X. Shen, I. Lindau, W. E. Spicer, C.B. Eom and T.H. Geballe, Appl. Phys. Lett. 53, 529 (I988)
11. J.-S. Kang, J. W. Alien, Z.-X. Shen, W.P. Ellis, J.J. Yeh, B.-W. Lee, M.B. Maple, W. E. Spicer and I. Lindau, Journal of Less Common Metals, 24 & 25, (1988)
12. Z.-X. Shen, P.A.P. Lindberg, I. Lindau, W.E. Spicer, C.B. Eom, T.H. Geballe, Phys. Rev. B, 38, 7152 (1988).
13. Z.-X. Shen, P.A.P. Lindberg, P. Soukiassian, I. Lindau, W.E. Spicer, C.B. Eom, T.H. Geballe, Phys. Rev. B. to be published.
14. C. K Shih, Z.-X. Shen, P.A.P. Lindberg, I. Lindau, W.E. Spicer, S. Doniach, J.W. Allen, Submitted to Phys. Rev. Lett., and the reference therein.
15. P.A.P. Lindberg, Z.-X. Shen, J. Hwang, C.K. Shih, I. Lindau, W. E. Spicer, D.B. Mitzi and A. Kapitulnik, Solid State Communication, to be published.
16. Z.-X. Shen, P.A.P. Lindberg, B.O. Wells, D.B. Mitzi, I. Lindau, W.E. Spicer and A. Kapitulnik, Phys. Rev. B, Dec. 1 (in press).
17. P.A.P. Lindberg, P. Soukiassian, Z.-X. Shen, C.B. Eom, I. Lindau, W.E. Spicer, T.H. Geballe, to be published in Appl. Phys. Lett., in press.
18. P.A.P. Lindberg, Z.-X. Shen, B.O. Wells, D. Mitzi, I. Lindau, W.E. Spicer, A. Kapitulnik, Appl. Phys. Lett. to be published.
19. P.A.P. Lindberg, Z.-X. Shen, B.O. Wells, D. Dessau, D. Mitzi, I. Lindau, W.E. Spicer, preprint, submitted to Phys. Rev. B.
20. N.F. Mott, Proc. Phys. Soc., Sect A 62, 416 (1949) 21. J. Hubbard, Proc. Roy. Soc. Set A, 276, 238 (1963); 277, 237 (1964); 281,
401 (1964). 22. G. van der Laan, C. Westra, C. Haas, and G. A. Sawatzky, Phys. Rev. B 23,
4369 (1981). 23. G. van der Laan, Solid State Commun. 42, 165 (1982). 24. G.A. Sawatzky, in STUDIES IN INORGANIC CHEMISTRY, Vol. 3
(Elsevier, Amsterdam, 1983) p. 3. 25. A. Fujimori and F. Minami, Phys. Rev. B 30, 957 (1984). 26. G.A. Sawatzky and J. W. Allen, Phys. Rev. Lett. 53, 2339 (1985). 27. J.W. Allen, J. Mag. Mag. Mat. 47-48, 168 (1985). 28. J. Zaanen, G. A. Sawatzky, and J. W. Allen, Phys. Rev. Lett. 55, 418 (1985). 29. G. van der Laan, J. Zaanen, and G. A. Sawatzky, Phys. Rev. B 33, 4253
(1986). 30. J. Zaanen, C. Westra, and G. A. Sawatzky, Phys. Rev. B 33, 8060 (1986). 31. L. Ley, M. Taniguchi, J. Ghijsen, R. L. Johnson, and A. Fujimori, Phys. Rev.
B 35, 2839 (1987). 32. A. Fujimori, M. Saeki, N. Kimizuka, M. Tanigukchi, and S. Suga, Submitted to
Phys. Rev. B 35, 8814 (1987). 33. P.W. Anderson, Science 235, 1196 (1987). 34. G. Baskaran, Z. Sou, and P. W. Anderson, Solid State Commun., 63, 973
(1987).

348
35. P .W. Anderson, G. Baskaran, Z. Zou, and T. Hsu, Phys. Rev. Lett. 58, 2790 (1987).
36. H.B. Schiittler, M. Jarrell, and D. J. Scalapino, Solid State Commun., to be published
37. C.M. Varma, S. Schmitt-Rink, and E. Abrahams, Solid State Commun., 62, 681 (1987).
38. S. Robaszkiewicz, R. Micnas, and J. Ranninger, Phys. Rev. B36, 180 (1987). 39. H. Aoki and H. Kamimura, Solid State Commun., 8 40. V.J. Emery, Phys. Rev. Lett. 58, 2794 (1987). 41. J .E. Hirsch, Phys. Rev. B35, 8726 (1987). 42. D.H. Lee and J. Ihm, Solid State Commun.62, 811 (1987). 43. D. Vaknin et al., Phys. Rev. Lett. 58, 2802 (1987); Mitsuda et al., Phys. Rev.
B36, 822 (1987); T. Freltoft et al. , Phys. Rev. B 36, 826 (1987). 44. M.A. Beno, et al., Appl. Phys. Lett. 51, 57 (1987); D.C. Johnston et al., in
Chemstry of High-Temperature Superconductors, edited by D.L. Nelson, M.S. Whittingham, and T.F. George, ACS symposium Series 351, 1987; J.D. Jorgensen et al., Phys. Rev. B36, 3608 (1987)
45. F.C. Zhang and T.M. Rice, Phys. Rev. B 37, 3759 (1988). 46. N.G. Stoffel, P.A. Morris, W.A. Bonner, D. LaGraffe, Ming Tang, Y. Chang,
G. Margaritondo, M. Onellion, Phys. Rev. B 38 47. H.W. Zandbergen, Y.K. Hwang, M.J.V. Menken, J.N. Li, K. Kadowaki, A.A.
Menovsky, G. van Tendeloo and S. Amelinckx, Nature 332, 620 (1988). 48. J .H. Weaver, H. M. Meyer III, T. J. Wagener, D. M. Hill, Y. Gao, D.
Peterson, Z. Fisk and A. J. Arko, Phys. Rev. B 38, 4558 (1988). 49. R.S. List and A.J. Arko, private communication. 50. M.S. Hybertsen and L.F. Matheiss, Phys. Rev. Lett. 60, 1661 (1988) ( band
calculation ) , J.-J. Yeh and I. Lindau, At. Data Nucl. Data Tables 32 (1985) (Photoionization cross section ).
51. J .W. Alien, S.-J. Oh, O. Gunnarsson, K. Sch6nhammer, M. B. Maple, M. S. Torikachvili, and I. Lindau, Adv. in Phys. 35, 275 (1986).
52. L.C. Davis, Phys. Rev. B 25, 2912 (1982). 53. U. Fano, Phys. Rev. 124, 1866 (1961). 54. J.-I. Igarashi and T. Nakano, submitted to J. Phys. Soc. Japan. 55. M. Aono, T. C. Chiang, F. J. Himpsel, and D. E. Eastman, Solid State
Commun. 37, 471 (1981). 56. J. Sugar, Phys. Rev. B 5, 1785 (1972). 57. O. Gunnarsson and K. Sch6nhammer, in Giant Resonances in Atoms,
Molecules, and Solids, edited by J. P. Connerade, J.-M. Esteve, and R. C. Karnatak, Proceedings of NATO Summer School, Les Houches, June 1986 (New York, Plenum, 1987), P. 405.
58. O. Gunnarson and T. C. Li, Phys. Rev. B 36, 9488 (1987). 59. M.H. Hecht and I. Lindau, Phys. Rev. Lett. 47, 821 (1981). 60. R.L. Kurtz, R.L. Stockbauer, D. Muller, A. Shih, C.E. Toth, M. Osofsky and
S.A. Wolff, Phys. Rev. B 35, 8818 (1987) 6 I. T. Takahashi, H. Matsuyama, H. Katayama-Yoshida, Y. Okabe, S. Hosoya, K.
Seki, H. Fujimoto, M. Sato and H. Inokuchi, Nature Vol. 334, 691 (1988) 62. D. van der Marel, J. van Elp, G.A. Sawatzky and D. Heitmann, Phys. Rev. B
37, 5136 (1988) 63. P. Thiry, G. Rossi, Y. Petroff, A. Revcolevschi and J. Jegondez, Europhys.
Lett., in press. 64. A.K. McMahan, R.M. Martin and S. Stapathy, Phys. Rev. B 38, 5560 (1988). 65. H. Eskes and G.A. Sawatzky, Phys. Rev. Lett. 61, 1415 (1988)
349
66. H. Maeda, Y. Tanaka, M. Fukutomi, and T. Asano, Jap. Journ. Appl. Phys. Lett. 27, 1209 (1988)
67. R.M. Hazen, C.T. Prewith, R.J. Angle, N.L. Ross, L.W. Finger, C.G. Hadiaiacos, D.R. Veblen, P.J. Heaney, P.H. Hor, R.L. Meng, Y.Y. Sun, Y.Y. Xue, Z.J. Huang, L. Gao, J. Bechtold and C.W. Chu, Phys. Rev. Lett. 60, 1174
68. J.M. Tarascon, Y. Le Page, P. Barboux, B.G. Bagley, L.H. Greene, W.R. Mckinnon, G.W. Hull, M. Giroud and D.M. Hwang, preprint, Submitted to Phys. Rev. B
69. R.V. Kasowski, private communication. 70 Y. Dalichaouch, M. S. Torikachvili, E.A. Early, B.W. Lee, C.L. Seaman, K.N.
Yang, H. Zou and M.B. Maple, Solid State Commun. 65, 1001 (1987) 71. L. Soderholm, K. Zhang, D.G. Hinks, M.A. Beno, J.D. Jorgensen, C.U.
Segre, and I.K. Schuller, Nature 328, 604 (1987) 72. J.K. Liang, X.T. Xu, S.S. Xie, G.H. Rao, X.Y. Shao and Z.G. Duan, Z.
Phys. B 69, 137 (1987) 73. K.N. Yang, B.W. Lee, M.B. Maple and S.S. Laderman, Applied Physics (in
press) 74. D.M. Wieliczka, C.G. Olson and D.W. Lynch, Phys. Rev. Lett. 52, 2180
(1984) 75. J.K. Lang, Y. Baer and P.A. Cox, J. Phys. F 11, 121 (1981) 76. J.J. Neumeier, M.B. Maple and M.S. Torikochvili, Physica C (to be published)