3.2 evaluation for thermal loading / jet imp!ngement
TRANSCRIPT
. .. 2 _ - - . = . . . . . - . .-- :- - =.: = --
.
q pressure of 145 psig) (Reference 1), the maximum liner plate strain due to theb
internal pressure is estimated to be 0.13 x 33 = 4.3%. This strain is still far
lower (by a factor of almost 5) than the ultimate fracture strain of 21% for the
liner plate material. The internal pressure results in uniform tension in the liner
but does not produce any load on the liner anchors. Thus, it can be inferred
that the liner plate will not tear for the severe accident pressure of 134 psig.
3.2 EVALUATION FOR THERMAL LOADING / JET IMP!NGEMENT
s
The internal temperature causes compressive forces on the liner resulting in
potential buckling of the plate, it has bean assessed that under temperature of-
500 F, the forces exerted on the liner plate as well as the of liner anchors are
within the permissible limits based on plastic solution as suggested in BC-TOP-1
(Reference 2). The safety factor expressed in terms of the ratio of the total
energy capacity of the anchor to the energy required for the equilibrium is
calculated to be 1.9. The computations are shown in Attachment A to this
write up. ,
|!ll
O X:\ABWR\fASK.E1 Page 6 of 14
9306040277 930601PDR ADDCK 05200001A PDR
.-
. - - - -- : - =- - -. - - - - - . _ - -4.
.
.
O4.0 CONCLUSIONS
Based on the discussions in Sections 3.1 and 3.2 above, it is concluded that
the ABWR containment liner plate and the liner anchorage will maintain its
structural integrity even when subjected to severe accident pressure of 134
psig at 500 F. In this evaluation, a very conservative strain concentration,
factor of 33, observed at the discontinuities in the Sandia containment tests,
has been used. It is demonstrated that there are adequate margins over the
maximum conceivable strains to the ultimate fracture strains available to
preclude the type of tearing failures observed in the Sandia containment tests.
it should also be noted that there are major differences between the liner plate
system used in the Sandia tests and the ABWR containment. The significant,
difference is the use of intermittent stud type liner anchor in the Sandia tests
as opposed to the welded WT 4 anchors for the ABWR containment. This
should result in a more uniform distribution' of the strain for the ABWR
containment and in much lower strain concentration factors compared to those
observed in the Sandia test. This will further improve the margins of safety
over the ones computed in the previous section.
X:\ABWR\ TASK.E1 Page 7 of 14
7l.
.
6.0 REFERENCES
(1) NUREG/CR-5341 SAND 89-0349 "Round Robin Analysis of the Behavior
of a 1:6 scale reinforced concrete containment model pressurized to
Failute: Post-test Evaluations" Sandia National Laboratories. Prepared by
D.B. Clauss. October 1989
(2) Bechtel BC-TOP-1 " Containment Building Liner Plate Design Report"
Rev.1, December 1972.
(3) Supplement #1 to ABWR Containment Structural Evaluation for Ultimate'
gm Pressure Capacity Report, Bechtel Report No. RPT-STRU-008, Maysi
'
LJ1993.
,-
i b'"
X:\ASWE\ TASK.E1 Page 8 of 14
|
.
.. . __-. _. -
i
.
ATTACHMENT Ae
EVALUATION OF LINER PLATE FOR THERMAL LOADING / JET IMPINGEMENT
i
The analysis indicates that the liner plate and the steel embed system is
adequate to resist the thermal / jet impingement loads applied to the liner plate.
The following cases are considered:
1) LOCA caused temperature rise in containment.
2) Jet impingement load applied locally on a small area of liner.
In each case, one panel of liner plate is likely to buckle in. The analysis is to
assure the adequacy of the embed system to resist these loads and for the liner
plate not to fail, i.e., loss of its function.
The liner plate and the anchor system arrangement is as shown in SSAR Fig.
3.8-9.
The liner plate material is SA-516 grade 70
Assumed temperature of jet = 500 F,
\'x:\A8WR\fASK.E1 Page 9 cf 14
.. . -- - - - - . - . . -
.
4
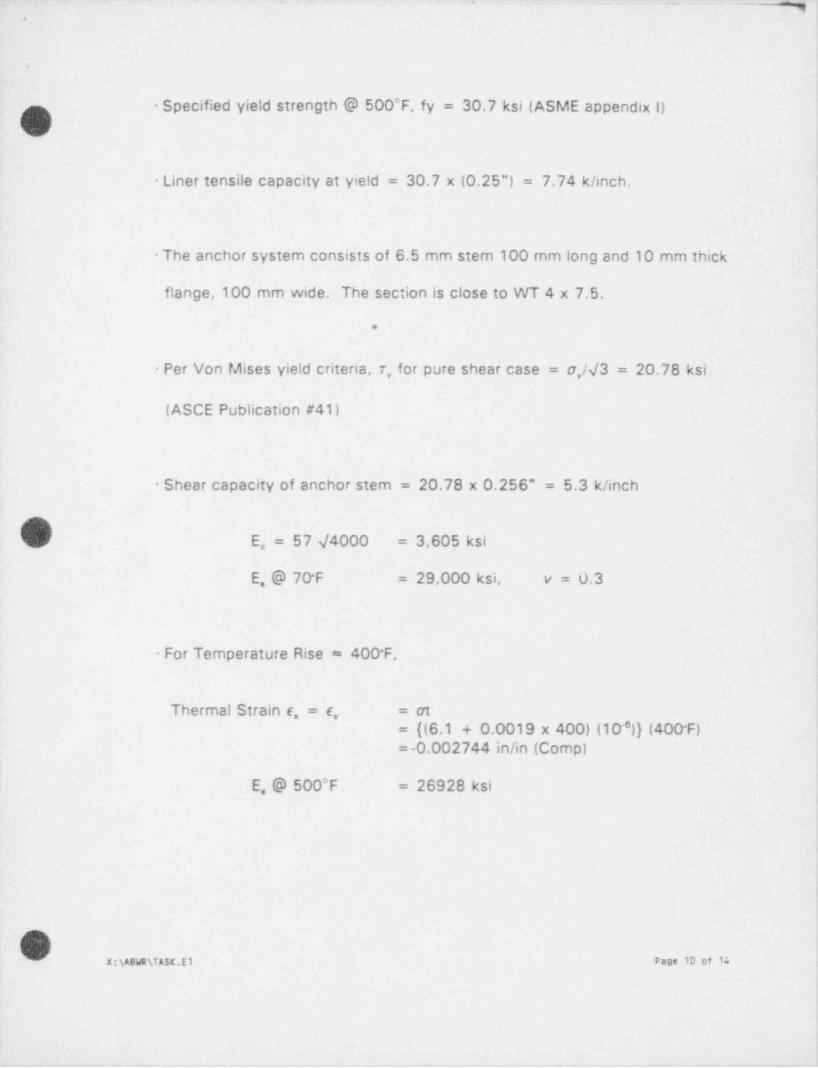
Specified yield strength @ 500 F, fy = 30.7 ksi (ASME appendix |}(m
;
,
Liner tensile capacity at yield = 30.7 x (0.25") = 7.74 k/ inch.
The anchor system consists of 6.5 mm stem 100 mm long and 10 mm thick
flange,100 mm wide. The section is close to WT 4 x 7.5.
.
Per Von Mises yield criteria, 7, for pure shear case = a,/V3 = 20.78 ksi
(ASCE Publication #41) ,
,
Shear capacity of anchor stem = 20.78 x 0.256" = 5.3 k/ inch
k E, = 57 V4000 3,605 ksi=
E @ 70 F 29,000 ksi, v = 0.3=
For Temperature Rise = 400 F,
Thermal Strain e, = e = aty
((6.1 + 0.0019 x 400) (10~')} (400-F)=
= -0.002744 in/in (Comp)
E, @ 500 F = 26928 ksi,
i
.I
|
|
i
|.
X :\ABVit \T ASK.E1 Page 10 of 14;
i
:
1
_z_:._._.._ _ _ . _ . . _ . . _ . _ _ . . . - . _ . _ . . __; _: :_. _ __ ._
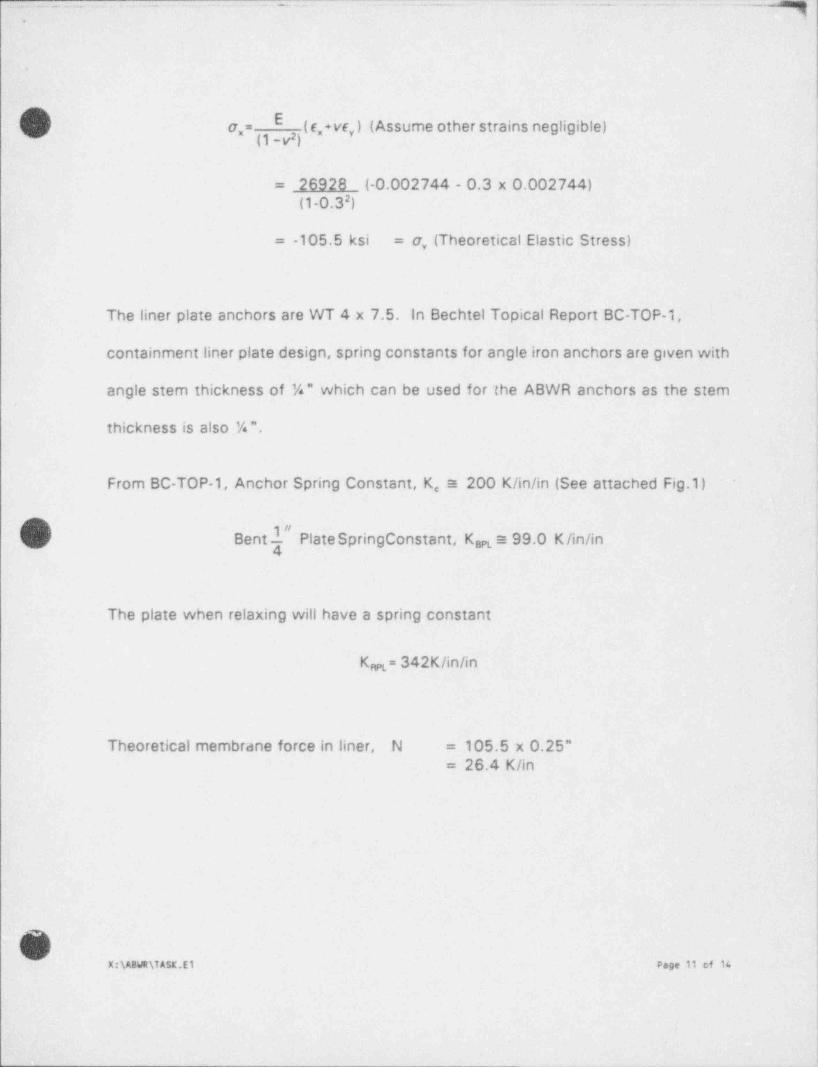
r's E(j a,= (e,+ve ) (Assume other strains negligible)_
y
= 26928 (-0.002744 - 0.3 x 0.002744)2(1-0.3 3
= -105.5 ksi = a, (Theoretical Elastic Stress)
The liner plate anchors are WT 4 x 7.5. In Bechtel Topical Report BC-TOP-1,
containment liner plate design, spring constants for angle iron anchors are given with
angle stem thickness of %" which can be used for the ABWR anchors as the stem
thickness is also %".
From BC-TOP-1, Anchor Spring Constant, K, a 200 K/in/in (See attached Fig.1)
Bent 1" PlateSpringConstant, Km ~ 99.0 K/in/in4
The plate when relaxing will have a spring constant
Km= 342K/in/in
Theoretical membrane force in liner, N = 105.5 x 0.25"= 26.4 K/in
|
|4
l
|-
X:\ABWR\ TASK.E1 Page il of 14 )i
!
.-- . . -
4. - . - . , . - - - - - . . ._ . . - . .
e
6.
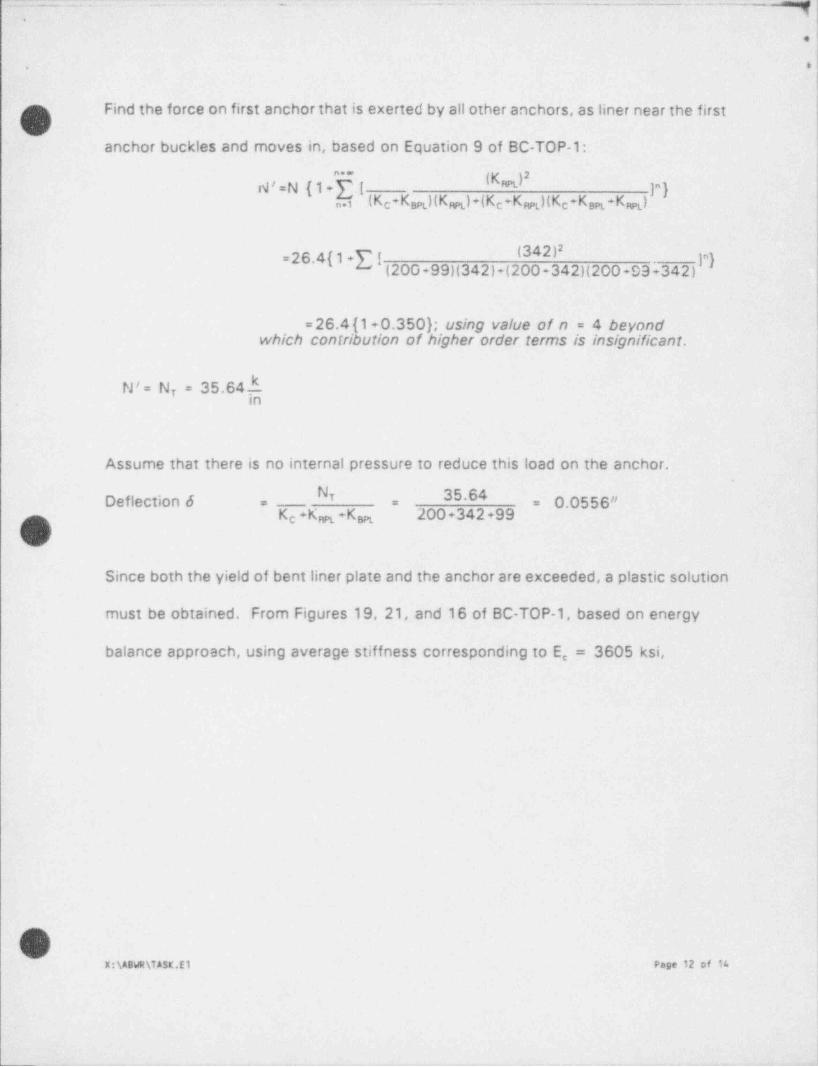
Find the force on first anchor that is exerted by all other anchors, as liner near the first '~
Oanchor buckles and moves in, based on Equation 9 of BC-TOP-1:
N' =N { 1 +f.i (Ke+Km)(Km)+(Kc+K"[
m)(Ke+Km+Km)]a } 'n
(342)2=26.4{ 1 +{ [ (200 +99)(342)+(200+342)(200 +D9 +342)jn)'
,
which contribution of } higher order terms is insignificant.= 26.4 {1 +0.350 ; using value of n = 4 beyond
),
N' = Nr = 35.64 k_, qin
,
'
Assume that there is no internal pressure to reduce this load on the anchor. ;
Deflection 6 . "T 35.64: , 0.0556"' i= =
Ke+Km +Km 200+342+99 )
O ii
Since both the yield of bent liner plate and the anchor are exceededi a plastic solution.-t
must be obtained. From Figures 19,'21, and-16 of BC-TOP-1, based on energy~
q
balance approach, using average stiffness corresponding to E, = 3605 ksi,z|;
I
i
!
i
-
?!-q
!.
-|1
X:\ABWR\TA$lt.E1 Page 12'of 14.
q
l1
-_ .. . .
~
^i,
.
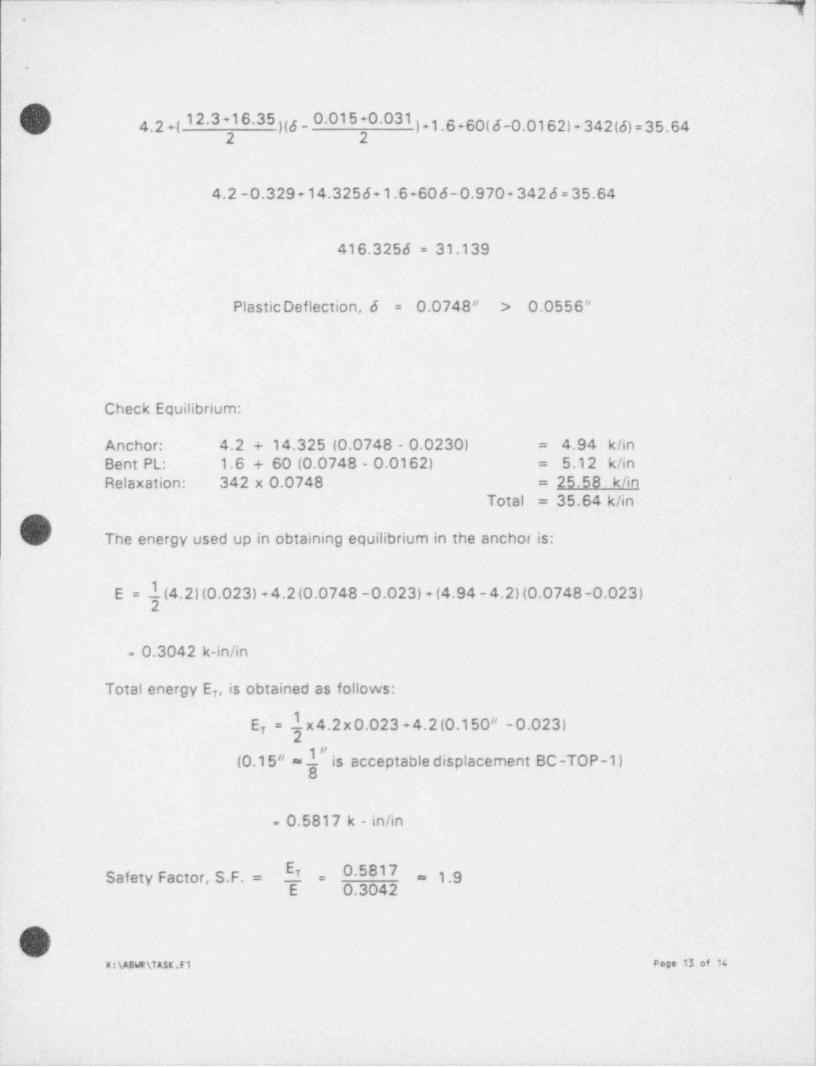
in() 4.2 +( 12.3 +16.35 )(g _ 0.015 +0.031 ) + 1.6 + 60( 6-0.0162) + 342(6) = 35.642 2
4.2 -0.329 + 14.3256 + 1.6 + 60 6-0.970 + 342 6 = 35.64
416.3256 = 31.139
0.0748" > 0.0556"Plastic Deflection, 6 =
Check Equilibrium:
Anchor: 4.2 + 14.325 (0.0748 - 0.0230) = 4.94 k/in
Bent PL: 1.6 + 60 (0.0748 - 0.0162) 5.12 k/in=
Relaxation: 342 x 0.0748 = 25.58 k/in-
Total = 35.64 k/in/
C The energy used up in obtaining equilibrium in the anchor is:
E = 1(4.2HO.023) +4.2 (0.0748 -0.023) + (4.94 -4.2)(0.0748-0.023)2
- 0.3042 k-in/in
Total energy Er, is obtained as follows:
Er = .1x4.2x0.023 +4.2(0.150" -0.023)2
(0.15" = 1 u is acceptabledisplacement BC-TOP-1)
- 0.5817 k - in/in
ErSafety Factor, S.F. - _ 0.5817 , 3,9E 0.3042
(O%,|X:\ABWR\ TASK.pt Page 13 of 14

. . _ _ _ .
.
,
4.94 k/in < 5.3 k/in (shear capacity)- Force on anchor =
Os5.12 k/in < 7.74 k/in (yield capacity)Force on liner =
,
t
9
/. The anchor system is safe under applied loads.
,
I
,
?
I
8
O
,
t
6
i
'K:\ABWR\ TASK.E1 Page 14 of 14.
"1,
,\
~/-
* *m m
"f%e r *m
*c,- g.se") {
|/*
\oe ww ,,
I 8
!
| -
ssm,r _ _,-kU e ,
gNT
i'I" ~
.
s% - x-ne
CONTAINMENT LINER BUCKLING1
.
Fro. 1
,-,
_,-
,
__ _. .-. _ =m.
.
!
.:.
i;
O !
!:
i
i!
ABWR -!
SUPPLEMENT # 1- !-t
TO ,!
!
CONTAINMENT STRUCTURAL EVALUATION !
;
FOR ;
ULTIMATE PRESSURE CAPACITY REPORT
(BECHTEL REPORT NO. RPT-STRU-008) . -
|!
O 1:
.I;
.i;
ki!
,
!
!
:
i
'I>
|
'i
O t
X:ABWR\RPTSTRU.008 May 1993
!
~ 't
. . .
., _ %.
. - - - _
_
-,
i
.
O1. INTRODUCTION
For the determination of ABWR Containment Ultimate Strength, evaluation was '
performed and results presented in a report earlier (Ref.1). The evaluation'was-,
limited to containment capacity for pressure loads only and was based on'
"FINEL" computer code. In that evaluation, the tensile strength of concrete
was assumed to have a small value of 100 psi in order to avoid potential,
numeric difficulties.
?
During a telephone conference call between NRC, GE and Bechtel on April 28,-
1993, NRC raised concern about conservativism of results based on 100 psi i
Otensile strength of concrete, as during SIT the containment concrete may'be
already cracked. To address this concern,it was decided to perform the FINEL !
analyses with 100 psi as well as 10 psi tensile strength of concrete-and
compare the results. f
The scope of this report is limited to performing the analysis with 134 psi :
pressure in the containmen" with concrete tensile strength of (1) 100 psi and
L(2) 10 psi and comparing the results for the two cases.
t
!
|L
O X:ABWR\RPT5tRU.008 May 1993[>
1
,

' -;.
:-
.
.i
id 2. ANALYSIS AND RESULTS;
i
!,
The finite element model has been described in Section 2 of Reference 1.
!
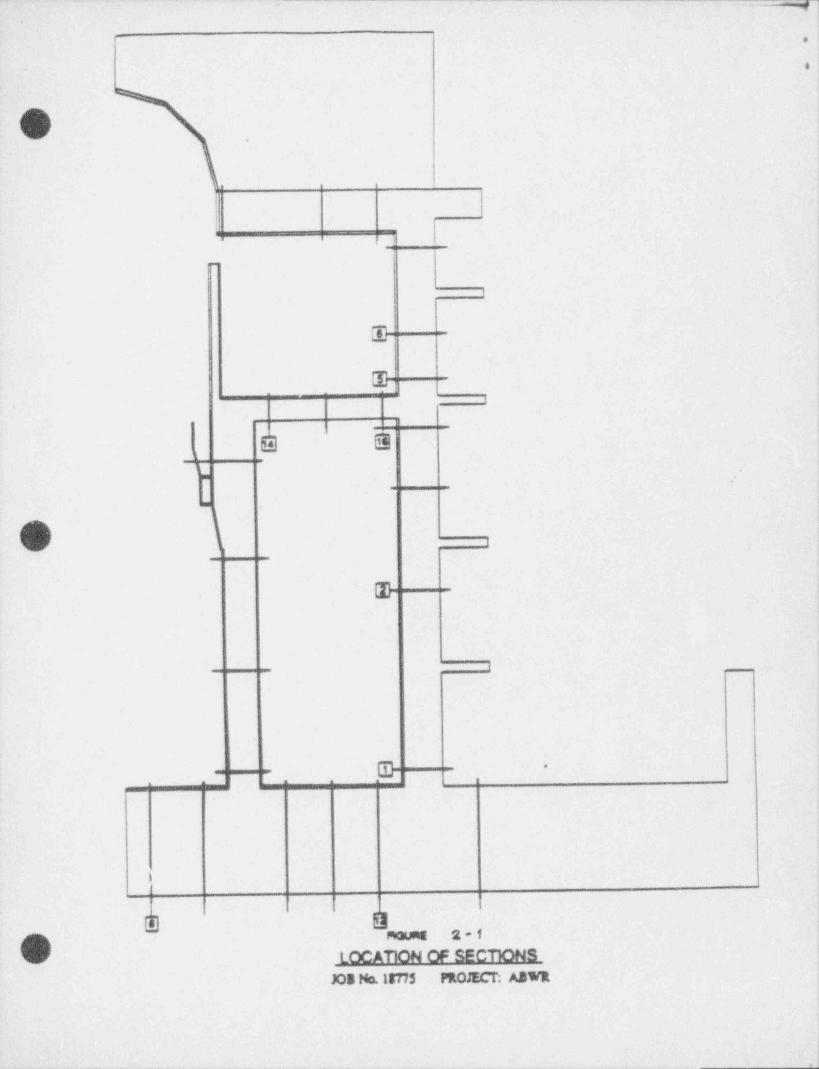
Figure 2-1 shows the location of critical sections of the RCCV for which
!analytical results have been reported.
!
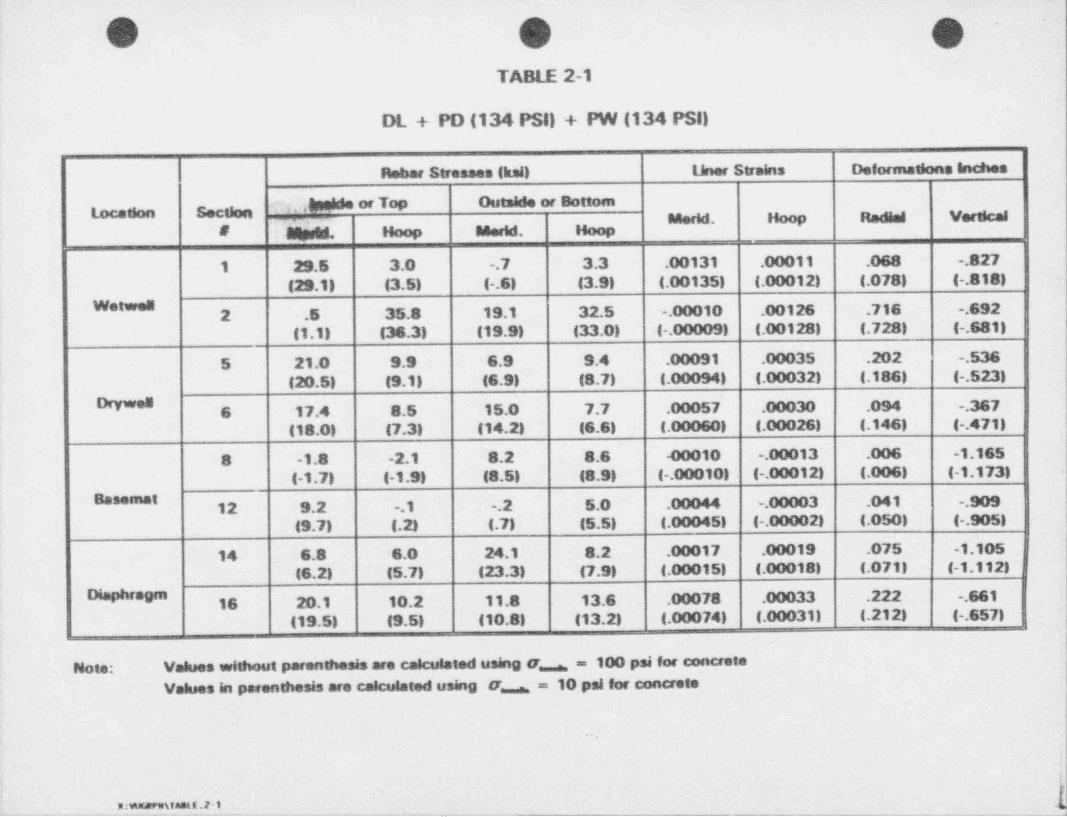
'Table 2-1 shows comparison of the results in terms of the rebar stresses, the
liner strains and the deformations.,
-,
!
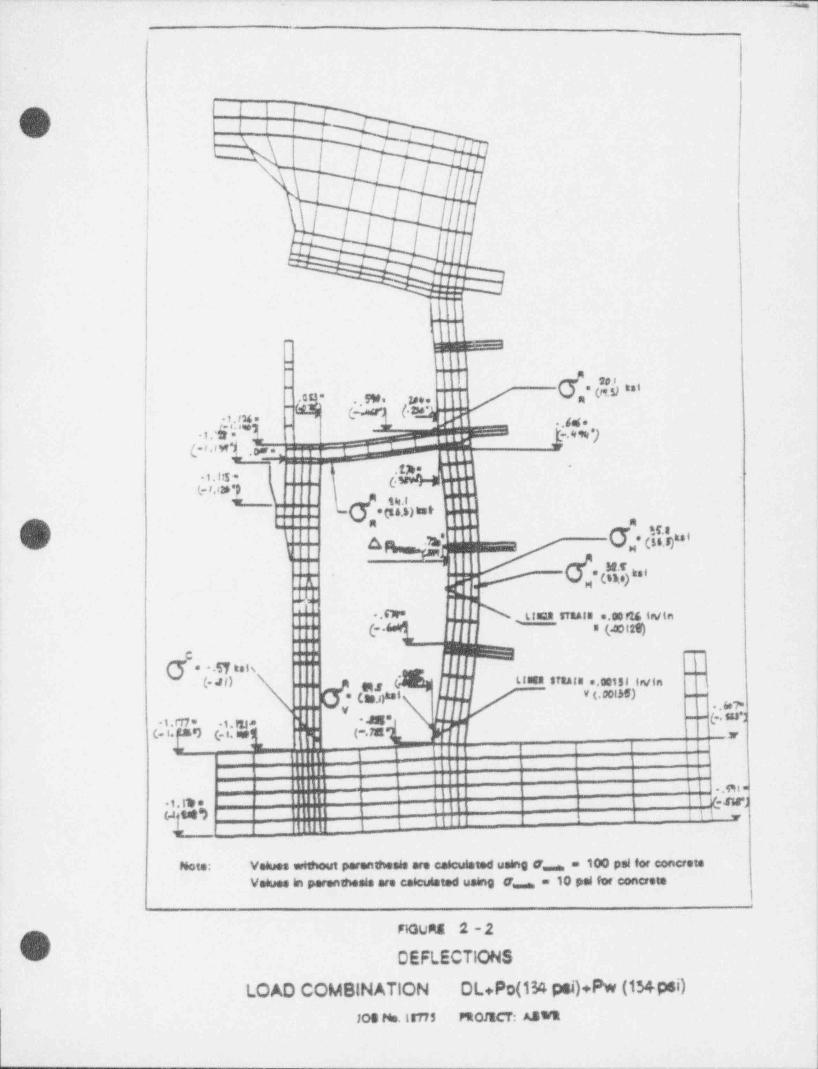
Figure 2-2 shows the deformation plot together with some of the significant
O :results.
,
f
i
The results of the analyses show that there is insignificant change due to
assumption of concrete tensile strength between 100 psi and 10 psi. For
example, the highest stress in the hoop rebar at Section 2 in the wetwell went
up to 36.3 ksi with 10 psi concrete tensile strength as against 35.8 ksi based 1
on 100 psi concrete tensile strength. Similarly, the maximum radial deformation,
went up to 0.728 inches from 0.716 inches. This is well within the range of_
calculational accuracy.
1
X:ABWR\RPTSTRU.008 May 1993
---
m---
.
9
3. CONCLUSIONSg.
Based on the results of the analyses, it can be concluded that there is no
significant difference in the results based on 10 psi concrete tensile strength
and 100 psi concrete tensile strength used earlier in Reference 1.
REFERENCES: *
1. Containment Structural Evaluation for Pressure Capacity, Summary
Report, Bechtel Report No RPT - STRU - 008, Revision 1, Dated 2/1/93.
O
X:ABWR\RPTSTRU.008 May 1993
_ _ _ . __ .
O O O~TABLE 2-1
D(. + PD (134 PSI) + PW (134 PSI)
Rober Stresses (kni) Liner Strains Deformations Indies
% @ orTop Outskio or BottomWh W "' **P "*d'd V''8**'
a M imp asered. map
1 29.5 3.0 .7 3.3 .00131 .00011 .068 .827
(29.1) (3.5) ( .6) (3.9) (.00135) (.00012) (.078) - (.818)* 2 .5 35.8 19.1 32.5 .00010 .00126 .716 .692
(1.1) (36.33 (19.9) (33.0) (.00009) (.00128) (.728) (.681)
5- 21.0 9.9 6.9 9.4 .00091 .00035 .202 .536
(20.5) (9.1) (6.9) (8.7) (.00094) (.00032) (.186) (.523)
6 17.4 8.5 .15.0 7.7 .00057 '.00030 .094 .367-
(18.0) (7.3) (14.2) (6.6) (.00060) (.00026) (.146) (.471)
8 -1.8 -2.1 8.2 8.6 -00010 .00013 .006. -1.165(-1.7) (-1.99 (8.5) (8.9)~ (.00010) (.00012) (.006) . (-1.173) i
12 9.2 .1 .2 5.0 .00044 .00003 .041 .909"
(9.7) (.2) (.7) (5.51 (.00045) (.00002) (.050) (.905)
~14 6.8 6.0 24.1- 8.2 .00017 .00019 .075 -1.105(6.23 (5.7) (23.3) (7.9) (.00015) (.000181 (.071) . (-1.112)
16 20.1 11 0.2 11.8 13.6 .00078 .00033 .222 .661
(19.5) (9.5) (10.8) (1 3.21 (.00074) (.00031) (.212) (.657)
Note: - Values without parenthesis are calculated using a = 100 psi for concreteValues in parenthesis are e=Ar* dated using F = 10 poi for concrete
.i!
. - - . . ., .'.i ?. * b. _ ,
. _ _ , L _ _
*
. . _
_ q- _._
4
e-3
. 4 .)
O ..
j - !
l;
i i1
1
1
1
T.
,
.;'
O 3'.
.
-
O \ .,
2 |
,
t'i
E ;-
,s.
r
)
i
8 9meums 2-f
O,
LOCATION OF RECT 10NS i''
JOB No.18775 PROJECT: ASWR
r
_ _ _
^!
. - - . ... .g
.
11
:0'
+ .<
|,' |R~1 ' i
/ |'
/ /I.
!
T ;~
.....I
~ nasses ;- .- ...-
Y 8 (w a'
/ / no- -.an- .,,,. ...
;
!84 cm (q-";;". -
s. , . ,x .!
MN?c:':(.h~e # """eu
t. ,. ,1 t13: J :- :. -
..... _ -..
, , , , _\ - - .
Cf'.ou.. ". .
... _
u> . . . '..._
Q i::: %;,n .....- ,,.. .
o< w ;,. 7,,
,:o b ., ... .
.
.t .,.
.... .
. N u mm ...,u iyio.s *-.--
'.:: (- '1__, |.. .
a eow)",
..
| | |uma T .;e . ..
g . . w .is ....
as u......,,,,,,,.
:--
C f,.e W,
.....,, fc. ,) .... n..u>
\. . .. .. n--
... .
(.. so ;* -Jg* _.1.rr7 ,,, pg3, l
(- 8. .tag (. . ang, l ( .78 1 , ;. ", ,
< =,, __
!;
- . .c i .
tIt
,
t
Note: Veiues unithout parenthesis are ceiculated seing a,,,,,, = 100 poi for concrets jvoeues in perentheels are caeculated using a, , = 10 poi for concrem ;
e
noung 2-2 .
O DEFLECTIONS |::
LOAO COMBINATION OL+Po(1M psi)+Pw (154 psi)
100 No.18775 MtOMCT: ASWRi
_
,
,
OTASK WAF # A-002
NRC Comment: Provide validation to the 'FINEL' program using SIT results.
Response: The attached report " Validation of 'FINEL' Computer Code"provides response to the NRC Comment.
,
!
O
_
'e V
|
|
O !, _ , _ ,
l
:
_. . . _ _ g.
7 y_GilDATION OF 'FINEL' COMPUTER CODE-,
The 'FINEL' computer code has been used to evaluate the ABWR containment,
capacity.
The 'FINEL' code has been extensively used in the past to design reinforced
concrete containment structtJres and to predict the strains and deflections
during their structural integrity tests (SIT). The correlation between the
predicted and observed deflections and strains during such tests has been very
satisfactory. 'FINEL' code predictions have been on the conservative side.
The 'FINEL' code was validated by comparing results based on 'FINEL' with-
Vresults based on classical solutions and/or experimental results existing in
literature. A further confirmation of its validity is provided by comparison of
predicted strains and deformations based on 'FINEL' with the experimental
results obtained during SIT on various Bechtel designed containments.
'X:ABWR\FINEL Page 1 of 4
-
-_
.-
?
?.
!
2.0 FINEL VAllDATION
Attachment 1 lists the various problems for which 'FINEL' results were >|
compared with the classical solutions and/or experimental results that were,
'
available in the literature. The first two problems in Attachment 1 compare the
'experimental results with 'FINEL' predictions. The comparisons showed a close;
co-relation between the two sets of results.
|I
3.0 COMPARISON OF SUSQUEHANNA NUCLEAR POWER PLANT CONTAINMENT t
SIT RESULTS
i
.
As is normal with the nuclear power plants, before the start of the operation
O of the Susquehanna Nuclear Power Plant Unit 1, the SIT was performed for the;
containment. The SIT report is included as attachment 2. The Final Safety
Analysis Report (FSAR) of the Susquehanna Plant in section 3.8.1.7.1.1.
describes the structural acceptance test. Therein, on page 3.8-22, it is stated
that, (a) the 'FINEL' computer code was used to calculate the deflections and
the strains for the containment and, (b) the deflections and strains measuredf
during the test were less than or approximately equal to the predicted values,
|at all critical locations.
In Attachment 2, the measured strains and deformations are compared at 61.0
O1
1
X;ABWR\f]NEL Page 2 of 4
. i
-
.
P
,
psiinternal pressure which is 1.15 times the design accident pressure. Figures
O ,
t
5-16 through 5-18 compare the measured deformations against the 'FINEL' ,
computer code predictions. Figures 5-29 through 5-34 show the plots of_
strains and deformations as measured and compares those with 'FINEL'
predictions. The 'FINEL' predictions are bounding on the measured values
except in a few local areas. The 'FINEL' predictions did not have a better fit
to the measured values probably due to the fact that the observed cracks in the
containment wall were discrete as shown in Figures 5-36 and 5-37. The
'FINEL' code assumes these tensile cracks as uniformly distributed. Due to
this, the containment wall stiffness probably was lower in the 'FINEL' model.
However, the measured deformations were always less than those predicted.
O 4.0 CONCLUSION .
Structural integrity tests, such as that of Susquehanna, in addition to the
validation problems discussed in Section 2, justify use of the 'FINEL' code for,
conservatively predicting the ultimate strength of ABWR containment structure.
K:ASWR\FlkEL Page 3 of 4
, .,
.
.
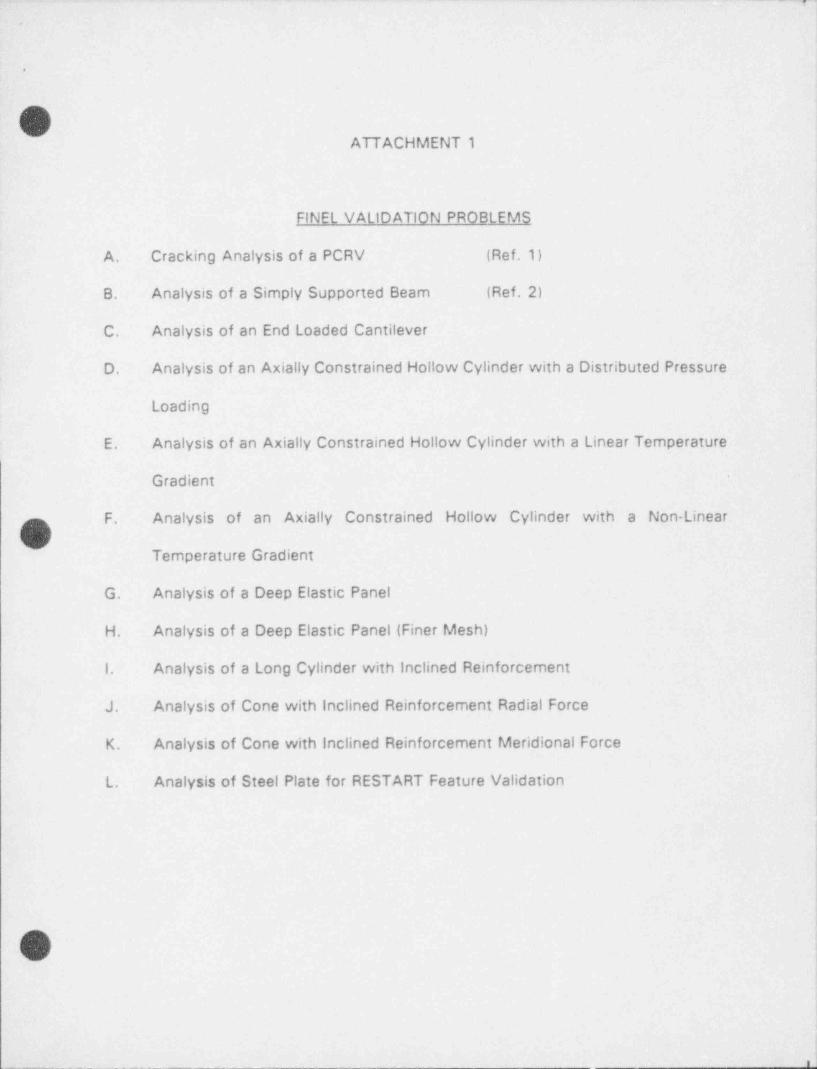
OATTACHMENT 1
FINEL VAllDATION PROBLEMS
A, Cracking Analysis of a PCRV (Ref. 1)
B. Analysis of a Simply Supported Beam (Ref. 2),.
C. Analysis of an End Loaded Cantilever
D. Analysis of an Axially Constrained Hollow Cylinder with a Distributed Pressure
Loading
E. Analysis of an Axially Constrained Hollow Cylinder with a Linear Temperature
Gradient -
F. Analysis of an Axially Constrained Hollow Cylinder with a Non-Linear
Temperature Gradient
G. Analysis of a Deep Elastic Panel
H. Analysis of a Deep Elastic Panel (Finer Mesh)
1. Analysis of a Long Cylinder with inclined Reinforcement
J. Analysis of Cone with inclined Reinforcement Radial Force
K. Analysis of Cone with inclined Reinforcement Meridional Force
L. Analysis of Steel Plate for RESTART Feature Validation
O
m

o
i
REFERENCES:t3V
(1) M.A. Sozen and S.L. Paul, " Structural Behavior of A Small-Scale
Prestressed Concrete Reactor Vessel," Nuclear Enaineerina and Desian,
Vol. 8, pp. 403-414.
(2) N.H. Burns and C.P. Siess, " Load Deformation Characteristics of Beam- <
Column Connections in Reinforced Concrete", Structural Research Series
No. 234. Civil Enaineerina Studies, University of Illinois, Urbana-
Champaign, Ill., January 1962.
L
O
i
?
ATTACHMENT 2-
,
SUSQUEHANNA NUCLEAR POWER PLANT
S.I.T. REPORT.
!
.
:k
>
-
,
'
h
ii