3193 tn2 study of cost issues in transport operation …s3.amazonaws.com/zanran_storage/©the tas...
TRANSCRIPT

Study of Cost Issues in Transport Operation: Phase One: Understanding the Trends and Drivers in Cost Inflation: Task Note 2: The Bus Industry Commission for Integrated Transport November 07 Final

Freedom of Information Act 2000
The TAS Partnership Limited regards the daily and hourly rates that are charged to clients, and the terms of engagement under which any projects are undertaken, as trade secrets, and therefore exempt from disclosure under the Act.
In many of the Reports and Task Notes we produce, The TAS Partnership Limited uses commercially or personally sensitive data provided under confidentiality agreements by third parties to inform projects, and disclosure of this information could constitute an actionable breach of confidence. The detailed content of such Reports and Task Notes is therefore likely to be exempt from disclosure under the Act.
Consequently, The TAS Partnership Limited will expect to be consulted before any content of our Reports and Task Notes is released under a Freedom of Information Act 2000 request.
Copyright
The contents of this document are copyright The TAS Partnership Ltd., with the exceptions set out below. Reproduction in any form, in part or in whole, is expressly forbidden without the written consent of a Director of The TAS Partnership Ltd.
Cartography derived from Ordnance Survey mapping is reproduced by permission of Ordnance Survey on behalf of the Controller of HMSO under licence number WL6576 and is © Crown Copyright – all rights reserved.
Other Crown Copyright material, including census data and mapping, policy guidance and official reports, is reproduced with the permission of the Controller of HMSO and the Queen’s Printer for Scotland under licence number C02W0002869.
Quality Assurance
DOCUMENT INFORMATION
Document Title
Study of Cost Issues in Transport Operation: Phase One: Understanding the Trends and Drivers in Cost Inflation: Task Note 2: The Bus Industry
First Draft Created On Last Revision Saved On Name of File File Size Version (Revision) Number Total Prep & Editing Time (Minutes) To Date
28/02/2007 16:41:00 01/11/2007 11:24:00 3193 TN2 Study of Cost Issues in Transport Operation Bus Industry FINAL APPROVED 1664512 kb 8 32
QUALITY ASSURANCE Revision Final Prepared by Checked by Approved by Date 01/11/2007 ER/PT/SW SW CC

©The TAS Partnership Limited ▪ November 07
Study of Cost Issues in Transport Operation: Phase One: Understanding the Trends and Drivers in Cost Inflation: Task Note 2: The Bus Industry ▪ Contents ▪ 1
Contents
Executive Summary .................................................................................5
1 Introduction and Objectives .........................................................7
1.1 Understanding the Trends and Drivers in Cost Inflation - Introduction .........7
1.2 Structure ............................................................................................8
1.3 Objectives...........................................................................................8
1.4 Projected Outcomes .............................................................................9
2 Key Elements of Cost for the Bus Industry ........................................11
2.1 Information Supply ............................................................................11
2.2 Identifying Cost and Revenue Trends – A Dilemma .................................12
2.3 Proportion of Costs.............................................................................14
2.4 Labour Costs .....................................................................................15
2.5 Pensions ...........................................................................................15
2.6 Fuel .................................................................................................15
2.7 Spares and Materials ..........................................................................15
2.8 Insurance Costs .................................................................................16
2.9 Finance, Capital and Tax .....................................................................16
2.10 Overheads ........................................................................................16
2.11 The Community Transport Sector .........................................................17
3 Comparison of Costs for Public and Private Transport Modes ...............19
3.1 Motoring Costs ..................................................................................19
3.2 Public Transport Fares ........................................................................24
3.3 Fare Structure ...................................................................................28
3.4 Perceptions of Travel Cost versus True Cost ...........................................32
3.5 Fares Comparisons between Public Transport Modes ...............................37
3.6 Light Rail ..........................................................................................41
3.7 Taxis................................................................................................41
3.8 Household Transport Expenditure .........................................................41
4 Core Cost Key Performance Indicators..............................................45

©The TAS Partnership Limited ▪ November 07
Study of Cost Issues in Transport Operation: Phase One: Understanding the Trends and Drivers in Cost Inflation: Task Note 2: The Bus Industry ▪ Contents ▪ 2
4.1 Cost Headings ...................................................................................45
4.2 Establishing KPIs ...............................................................................46
5 Core Sensitivities and Cost Drivers...................................................49
5.1 Wage Levels......................................................................................49
5.2 The Effect of Traffic Congestion............................................................49
5.3 Legislation ........................................................................................52
5.4 Corporate Costs .................................................................................52
5.5 Spares and Materials ..........................................................................53
5.6 Fuel and Utilities ................................................................................54
6 Growth Disparities in Current and Forecast Costs Compared to Other Sectors .................................................................................................55
6.1 Trends in Wage Costs .........................................................................55
6.2 The Effect upon Bus Drivers.................................................................56
6.3 Trends in Weekly Earnings ..................................................................57
6.4 Regional Comparisons ........................................................................58
6.5 Paid Hours ........................................................................................58
6.6 Productivity.......................................................................................64
6.7 Comparisons with Wages in other Transport Sectors ...............................66
6.8 Comparisons with Other Sectors...........................................................68
6.9 Sample Data .....................................................................................69
6.10 Custom and Practice...........................................................................71
6.11 The Workforce ...................................................................................72
6.12 Barriers to Employment ......................................................................73
6.13 Recruitment and Retention ..................................................................74
6.14 Other Issues .....................................................................................76
6.15 Trends in Service Provision..................................................................78
6.16 Depot and Crew Change Locations........................................................83
6.17 Opportunities for Cost Control..............................................................84
6.18 Tender Preparation Costs ....................................................................85
6.19 Public Support for Buses .....................................................................85
7 Effect of Pension Issues and Additional Social Legislation in Labour Intensive Industries ...............................................................................87
7.1 Pensions ...........................................................................................87

©The TAS Partnership Limited ▪ November 07
Study of Cost Issues in Transport Operation: Phase One: Understanding the Trends and Drivers in Cost Inflation: Task Note 2: The Bus Industry ▪ Contents ▪ 3
7.2 Potential Impact of the EU Working Time Directive..................................90
7.3 National Insurance .............................................................................91
7.4 Social Legislation- Maternity, Paternity and Parental Leave ......................92
7.5 Child and Working Tax Credit Limits......................................................93
7.6 Overall Impact...................................................................................94
8 Compliance Costs and Legislative Change .........................................95
8.1 Disability Compliance Issues................................................................95
8.2 Environmental Legislation ...................................................................96
8.3 Traffic Commissioners.........................................................................96
8.4 Changes to Drivers’ Hours Regulations ..................................................99
8.5 Contract Compliance ..........................................................................99
8.6 Quality Contracts ............................................................................. 100
8.7 The EU Driver Training Directive......................................................... 102
9 Trends in Fuel and Fuel Consumption ............................................. 103
9.1 Fuel and Fuel Duty ........................................................................... 103
9.2 Vehicle Specification......................................................................... 107
9.3 Euro Engine Standards...................................................................... 110
10 Trends in Accident and Insurance Costs.......................................... 113
10.1 Insurance Issues.............................................................................. 113
10.2 The Predominant Approach................................................................ 114
10.3 Insurance Premium Increases ............................................................ 114
10.4 Insurance Costs Containment ............................................................ 116
10.5 Employers Liability Insurance ............................................................ 117
11 Base Composition of Apparently Fixed Costs ................................... 119
11.1 Fixed Costs ..................................................................................... 119
12 Trends in Capital Costs ................................................................. 121
12.1 New Vehicle Cost ............................................................................. 121
12.2 Vehicle Depreciation ......................................................................... 123
12.3 Coaches.......................................................................................... 125
12.4 The Second-Hand Market .................................................................. 126
12.5 Buy or Lease?.................................................................................. 126

©The TAS Partnership Limited ▪ November 07
Study of Cost Issues in Transport Operation: Phase One: Understanding the Trends and Drivers in Cost Inflation: Task Note 2: The Bus Industry ▪ Contents ▪ 4
12.6 Motoring Comparisons ...................................................................... 127
12.7 Cost Increases in Highway Infrastructure Projects................................. 128
13 Cost of Capital............................................................................. 131
13.1 Current Investment Climate .............................................................. 131
13.2 Cost and Types of Capital .................................................................. 131
13.3 Rates of Return ............................................................................... 133
13.4 Is this Achievable? ........................................................................... 134
14 Effect on Financial Outputs within the Various Scenarios................... 137
14.1 Future Modelling .............................................................................. 137
15 Effect of Operators Restoring Eroded Margins by more than Cost Recovery Fare Increases ....................................................................... 139
15.1 Historical Fares Policy ....................................................................... 139
15.2 Fares Trends Since 1986 ................................................................... 140
15.3 Effects of Fare Increases and Other Factors ......................................... 142
15.4 TAS Fares Model .............................................................................. 143
15.5 The Sheffield Experience ................................................................... 144
15.6 Is There a Better Way? Alternative Approaches to Fares ........................ 144
16 Summary and Conclusions ............................................................ 147
16.1 Scenario Summary........................................................................... 147

©The TAS Partnership Limited ▪ November 07
Study of Cost Issues in Transport Operation: Phase One: Understanding the Trends and Drivers in Cost Inflation: Task Note 2: The Bus Industry ▪ 5
Executive Summary
Trends in Cost in the Bus Industry
Above inflation cost increases in the bus industry have been of some concern for a few years. Operators are seeing decreasing profit margins, local authorities are faced with further deregistrations of services and increasing tender prices, while the passenger faces more frequent and significant fare increases. This exercise set out to establish the main drivers of this level of increased cost.
Wages are the main item of expenditure for bus operators, accounting for just under 70% of all costs. Thus any increase in wages has a significant effect. Wages in the wider economy have been rising above the level of inflation for several years and this is equally true of the bus industry.
We have established that drivers in London have received pay rises well above inflation year on year, yet outside London drivers have received increases in line with general wage rises, although there has been a reduction in their working week (hence more drivers for the same work). In one region – the North West – bus drivers are now worse off in real terms than in 1994. There have also been additional add-on costs to wage bills caused by social legislation and EU regulations.
Maintaining funding for pension schemes has been problematical. The major groups have used reserves or proceeds of sale to top up pension funds.
The industry has been exposed to significant fuel price rises (particularly in 2005). As modern vehicles are less fuel efficient than their predecessors the level of consumption has increased too.
Traffic congestion and the need to schedule reliable services in the face of it, has imposed additional cost on bus operators. In areas where there is day -long congestion operators are forced to increase resources to maintain the same level of service, or look at widening headways or removing sections of route in order to implement an achievable timetable.
Local authority support for bus services has grown significantly, but almost all of the extra expenditure has been in London. Budgets outside London have just about kept pace with inflation and hence can support fewer services. Local authority budgets are also under pressure to maintain funding for the continuation of challenge-funded services when that funding expires.
Overhead costs are an increasing proportion of bus company cost, be they additional management or supervisory staff, or headquarters overheads passed down to the operating companies. This is despite the closure of many depot and bus station facilities.

©The TAS Partnership Limited ▪ November 07
Study of Cost Issues in Transport Operation: Phase One: Understanding the Trends and Drivers in Cost Inflation: Task Note 2: The Bus Industry ▪ 6
Insurance and accident costs have been escalating in recent years, largely due to the increasing claims culture. Companies have been able to stem the increase in motor insurance, but the area of major concern is Employers’ Liability insurance, for which a doubling or trebling of premium over five years is not unknown.
Whilst passengers have undoubtedly faced some significant fare increases, we believe that the level of these increases has not been as steep as official figures show. Moreover, the highest fare increases have applied only to single or return fares, which are purchased by a decreasing proportion of passengers. Multi-journey tickets, conversely, seem to have largely increased at or below the rate of inflation.
The industry faces significant future costs with the introduction of the EU Driver Training Directive from 2008 and full DDA compliance between 2015 and 2020.

©The TAS Partnership Limited ▪ November 07
Study of Cost Issues in Transport Operation: Phase One: Understanding the Trends and Drivers in Cost Inflation: Task Note 2: The Bus Industry ▪ 7
Introduction and Objectives 1
1.1 Understanding the Trends and Drivers in Cost Inflation - Introduction
1.1.1 The problems of cost escalation and cost pressures within the passenger transport industry are well documented and are of major concern for transport co-ordinators and operators.
1.1.2 Bus operating costs are currently rising well ahead of RPI. This is despite the bus industry operating in a competitive market with relatively low entry barriers. Labour is a major proportion of the industry’s costs and competition within the job market has intensified. The industry has faced staff shortages in recent years resulting in steep increases in wages in order to recruit and retain adequate personnel. Rapid expansion in bus provision in London has exacerbated the problem in the capital.
1.1.3 Above-inflation cost increases impact upon commercial services in a number of ways. Operators can raise fares or reduce services in order to maintain profit levels. Core commercial services are affected by increasing wages, higher cost of new vehicles, rising fuel costs and ever-increasing traffic congestion.
1.1.4 Marginal services may become unprofitable requiring the local authority to step in if it wishes services to remain. Budgets also face pressures from increasing cost for existing supported services. This is set against a general decline in local authority bus service support budgets as councils face pressures to fund other activities. Tender prices are also related in many cases to the level of revenue taken. Evening trade for the bus industry has all but evaporated in many areas, leading to further increases in cost.
1.1.5 This leads local authorities to prioritise supported services in order to maintain those which either fulfil the greatest social need or offer the best value for money. In some cases marginal services have simply been lost, while the local authorities have continued to support more poorly patronised services. This approach leads to increased costs per tendered journey as the passenger base on the remaining secured journeys is so much lower.
1.1.6 Cost escalation poses a serious threat to continued spending on the transport network as it raises the question of public ‘value for money’. Many local authorities have some measure of VFM in terms of subsidy per passenger and this threshold can be breached in the face of continuing price increases. It is vital that costs are controlled so that the industry can reinvest in expanding and strengthening the network – at an affordable cost and not by additional public expenditure.

©The TAS Partnership Limited ▪ November 07
Study of Cost Issues in Transport Operation: Phase One: Understanding the Trends and Drivers in Cost Inflation: Task Note 2: The Bus Industry ▪ 8
1.1.7 Infrastructure investment is also called into question as local authorities have suffered significant cost increases in highway infrastructure and also have reservations about the continuation of services for which bus priorities are being designed. Conversely, the continuation of the levels of service may depend upon the priorities offered by the infrastructure provision.
1.1.8 Although not within the remit of this work, it must be acknowledged that overall the bus industry remains in the decline which started in the late 1950’s. The whole subject of bus regulation or deregulation has risen up the political agenda. But statistics clearly show that deregulation was not the cause of this decline, though there is some evidence that it may have slowed it down.
1.1.9 It is against this background that the Commission for Integrated Transport (CfIT) is looking to conduct an analysis of cost trends within the bus and rail industry and possible mitigating strategies.
1.2 Structure
1.2.1 This Task Note is arranged into a series of sections with each devoted to a question as asked by CfIT in the original brief. At the head of each section of this Task Note the questions asked by CfIT are reproduced verbatim in red and the issues raised are addressed within the section.
1.2.2 There is some overlap in subject headings within the questions. To avoid repetition of subject matter and disjointed discussion of subjects, reference is made to key sections, such as section 9, which deals with all matters related to fuel, for example.
1.3 Objectives
1.3.1 This project has three objectives specified by CfIT:
• To understand the trends in cost inflation in the transport sector, and the reasons for it;
• To examine the impacts of these trends on behaviour of operators, financiers, local authorities, government; hence on transport policy objectives (congestion, pollution, accessibility); and
• To identify possible solutions (and their impacts).
1.3.2 The first phase of the project, researching and understanding the trends and drivers in cost inflation, will be dealt with in a series of Task Notes covering the key modes of bus, rail, tube / light rail, air and road / rail freight.
1.3.3 This first Task Note considers the bus industry:

©The TAS Partnership Limited ▪ November 07
Study of Cost Issues in Transport Operation: Phase One: Understanding the Trends and Drivers in Cost Inflation: Task Note 2: The Bus Industry ▪ 9
• Key elements of cost for buses and how they are changing.
• How public and private transport modes compare in their costs.
• Core cost Key Performance Indicators.
• Core sensitivities and cost drivers.
• Growth disparities in current and forecast costs compared to other sectors.
• Effect of pension issues and additional social legislation in labour intensive industries
• Existing and forthcoming compliance costs and legislative change.
• Trends in fuel and fuel consumption.
• Trends in accident and insurance costs.
• Base composition of apparently fixed costs.
• Trends in capital costs.
• Cost of capital.
• Effect on financial outputs within the various scenarios.
1.4 Projected Outcomes
1.4.1 The research will provide a policy response to cost escalation within the transport industry and strategies available to minimise or control costs. It is hoped the report will provide a useful stimulus for engagement between Government, local authorities and operators on industry costs. The research will also add to the scientific evidence base, of which there is little published analysis of trends and mitigating strategies.


©The TAS Partnership Limited ▪ November 07
Study of Cost Issues in Transport Operation: Phase One: Understanding the Trends and Drivers in Cost Inflation: Task Note 2: The Bus Industry ▪ 11
Key Elements of Cost for the Bus Industry 2
CfIT Question 8: What are the key elements of costs for key modes - rail, bus, tube, air, freight (road and rail); and how are they changing?
• Labour
• Pensions
• Fuel
• Materials
• Finance
• Capital
• Tax.
2.1 Information Supply
2.1.1 Within this Task Note we have tried to be as representative as possible, given the available data. However, we do acknowledge that it is much easier to obtain information from larger operators, and particularly the five ‘big groups’ than it is to gather equivalent information from smaller operators. In particular, many of the statistics on bus usage, extent of operations and income are chiefly derived from DfT sources, gathered from those larger operators which complete the annual ‘Stats100’ form.
2.1.2 Information from small operators is difficult to obtain. Many such companies are family firms and even when they are constituted as limited companies, only submit abbreviated accounts to Companies House, which allow little financial analysis. The breakdown of costs and those key cost drivers may well be totally different for an operator surviving on school and private hire work.
2.1.3 GoSkills has calculated that around 75% of bus companies have ten or fewer vehicles, but conversely that 80% of bus drivers and a slightly higher proportion of local bus service mileage form part of or are provided by the major groups.
2.1.4 We acknowledge, therefore, that this Task Note’s findings will under-represent the small operators and the coaching sector and this must be borne in mind when interpreting the results.
©The TAS Partnership Limited ▪ November 07
Study of Cost Issues in Transport Operation: Phase One: Understanding the Trends and Drivers in Cost Inflation: Task Note 2: The Bus Industry ▪ 12
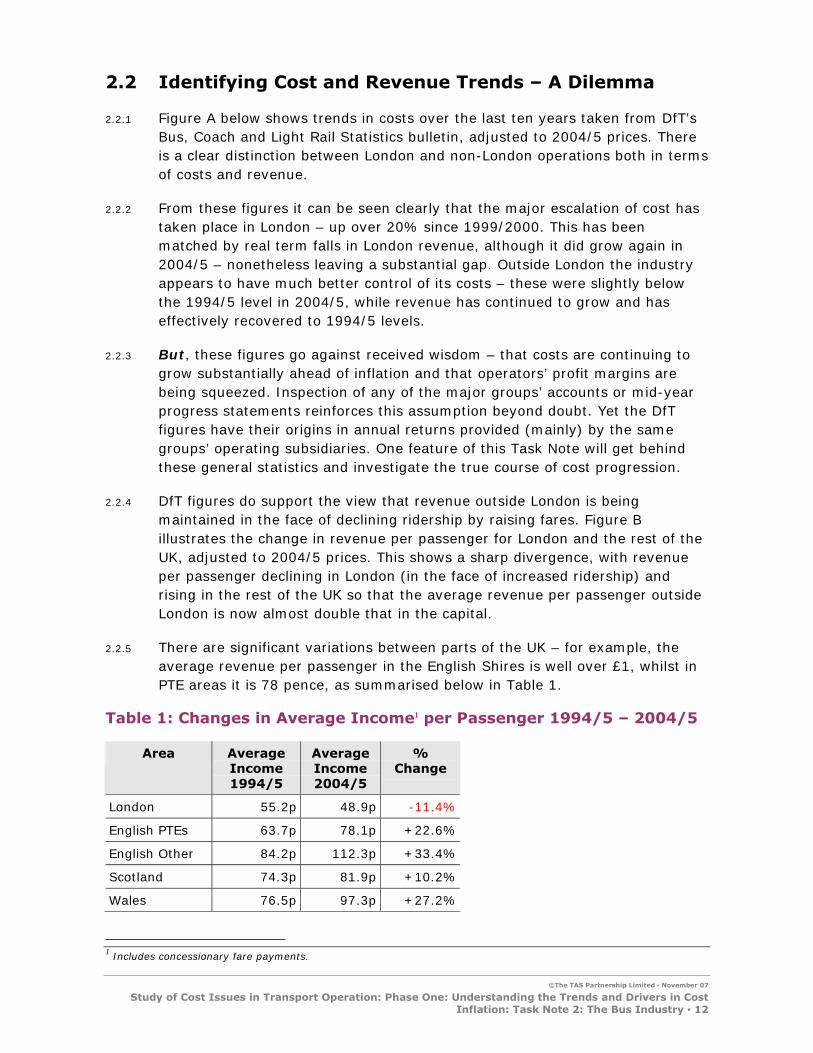
2.2 Identifying Cost and Revenue Trends – A Dilemma
2.2.1 Figure A below shows trends in costs over the last ten years taken from DfT’s Bus, Coach and Light Rail Statistics bulletin, adjusted to 2004/5 prices. There is a clear distinction between London and non-London operations both in terms of costs and revenue.
2.2.2 From these figures it can be seen clearly that the major escalation of cost has taken place in London – up over 20% since 1999/2000. This has been matched by real term falls in London revenue, although it did grow again in 2004/5 – nonetheless leaving a substantial gap. Outside London the industry appears to have much better control of its costs – these were slightly below the 1994/5 level in 2004/5, while revenue has continued to grow and has effectively recovered to 1994/5 levels.
2.2.3 But, these figures go against received wisdom – that costs are continuing to grow substantially ahead of inflation and that operators’ profit margins are being squeezed. Inspection of any of the major groups’ accounts or mid-year progress statements reinforces this assumption beyond doubt. Yet the DfT figures have their origins in annual returns provided (mainly) by the same groups’ operating subsidiaries. One feature of this Task Note will get behind these general statistics and investigate the true course of cost progression.
2.2.4 DfT figures do support the view that revenue outside London is being maintained in the face of declining ridership by raising fares. Figure B illustrates the change in revenue per passenger for London and the rest of the UK, adjusted to 2004/5 prices. This shows a sharp divergence, with revenue per passenger declining in London (in the face of increased ridership) and rising in the rest of the UK so that the average revenue per passenger outside London is now almost double that in the capital.
2.2.5 There are significant variations between parts of the UK – for example, the average revenue per passenger in the English Shires is well over £1, whilst in PTE areas it is 78 pence, as summarised below in Table 1.
Table 1: Changes in Average Income1 per Passenger 1994/5 – 2004/5
Area Average Income 1994/5
Average Income 2004/5
% Change
London 55.2p 48.9p -11.4%
English PTEs 63.7p 78.1p +22.6%
English Other 84.2p 112.3p +33.4%
Scotland 74.3p 81.9p +10.2%
Wales 76.5p 97.3p +27.2%
1 Includes concessionary fare payments.

©The TAS Partnership Limited ▪ November 07
Study of Cost Issues in Transport Operation: Phase One: Understanding the Trends and Drivers in Cost Inflation: Task Note 2: The Bus Industry ▪ 13
Figure A: Trends in Bus Industry Costs and Revenue2
75
95
115
135
155
175
195
215
1994/95 1995/96 1996/97 1997/98 1998/99 1999/00 2000/01 2001/02 2002/03 2003/04 2004/05
Co
st o
r R
even
ue (
pen
ce)
London Cost per km Non London Cost per km London Rev per km Non London Rev per km
Figure B: Trends in Revenue per Passenger3
45
50
55
60
65
70
75
80
85
90
95
1994/95 1995/96 1996/97 1997/98 1998/99 1999/00 2000/01 2001/02 2002/03 2003/04 2004/05
Pen
ce p
er
Pase
ng
er
London Outside London
2 Source www.dft.gov.uk/transstats 3 At 2005 prices

©The TAS Partnership Limited ▪ November 07
Study of Cost Issues in Transport Operation: Phase One: Understanding the Trends and Drivers in Cost Inflation: Task Note 2: The Bus Industry ▪ 14
2.3 Proportion of Costs
2.3.1 Figure C shows the breakdown of bus industry costs for 2006 whilst a similar breakdown for 1978 is shown in Figure D. It is notable that despite labour costs being significantly lower (in real terms) than in 1978 they are broadly the same proportion of the total costs.
2.3.2 The proportion of industry expenditure devoted to maintenance has declined by about 50% since the late 1970s whilst the proportion of costs devoted to overheads has roughly doubled. However both of these categories of cost have fallen in real terms.
Figure C: Breakdown of Bus Industry Costs4 2006
Labour 68%
Bus Maintenance 9%
Depreciation 4%Overheads
10%
Fuel 9%
Figure D: Breakdown of Bus Industry Costs – National Bus Company, 19785
Fuel 6%
Overheads 5%
Depreciation 3%
Bus Maintenance 17%
Labour 69%
4 Source – Bus Industry Monitor 2006 5 Source – National Bus Company Annual Report for 1978.

©The TAS Partnership Limited ▪ November 07
Study of Cost Issues in Transport Operation: Phase One: Understanding the Trends and Drivers in Cost Inflation: Task Note 2: The Bus Industry ▪ 15
2.4 Labour Costs
2.4.1 The major influence on costs is labour, this accounts for over two thirds of bus operating costs, as illustrated in Figure C. Labour costs are now significantly lower in real terms than in 1978 although recent years have seen above inflation increases.
2.4.2 Driver recruitment and retention continues to be an issue in some areas, particularly where unemployment is low. Substantial pay increases have affected the viability of commercial bus services, resulting in greater pressure on the local authorities’ subsidised bus service budgets. Despite initial optimism, some driver shortages remain. A full investigation of wage trends and comparisons with other sectors is included in section 6.
2.5 Pensions
2.5.1 Pensions have become a major issue in all industries, and particularly affect labour-intensive industries such as the bus industry. The pension situation is discussed fully in section 7.
2.6 Fuel
2.6.1 Large increases in fuel cost have driven many operators to introduce multiple fare rises in 2005. The cost of fuel is internationally influenced and users of fuel suffer price fluctuations as a result. Despite increasing world demand and an acknowledgement of supplies of oil being finite, the cost of fuel has not followed a uniformly upward curve. There are signs that 2005’s severe increases are not being followed through into 2006 – reflected in price competition by the major supermarkets.
2.6.2 The current government has imposed only one increase in the level of fuel duty since 2000, thus the major driver of fuel cost is the cost of the fuel itself. Trends in fuel costs and fuel consumption are discussed fully in section 9.
2.7 Spares and Materials
2.7.1 The prime components of materials (engineering) costs are spare parts and labour. Evidence from the analysis of industry costs suggests that expenditure on spares and materials has remained roughly constant in real-terms since the early 1990s6, although the industry periodically has supply problems with particular spares and particular suppliers. None of the company reports we examined raised increases in costs for spare parts as a particular issue, although some increases in wages for engineering staff were apparent.
6 TAS Bus Industry Monitor 1991 to date.

©The TAS Partnership Limited ▪ November 07
Study of Cost Issues in Transport Operation: Phase One: Understanding the Trends and Drivers in Cost Inflation: Task Note 2: The Bus Industry ▪ 16
2.7.2 Real price increases have been offset by reductions in fleet size, the elimination of older, more maintenance-intensive vehicle types and improved designs. However, early low floor designs are now showing higher maintenance costs as they reach mid-life. There are signs that tyres, especially, are increasing in price well ahead of RPI. Further discussion of trends in spares and materials is contained in section 5.5.
2.8 Insurance Costs
2.8.1 Insurance costs for bus operation have increased very substantially in the last few years. This would appear to have resulted from a number of pressures on the insurance industry such as some high profile international incidents, an increasing “claims culture” in the UK and a reduction in the number of insurers willing to offer policies in respect of bus operation. The motor insurance industry has also become extremely competitive to the point that claims have exceeded premiums, which is obviously unsustainable.
2.8.2 Existing bus operators are finding that all premiums have been increasing substantially year on year, although there is evidence that motor insurance premiums are now levelling out. Operators are also expected to take on policies with higher levels of excess, so that their level of effective self-insurance has risen substantially.
2.8.3 New entrants to the industry are finding that without a low / no claims record, they are unable to find any insurer willing to take their risk without a disproportionately high initial premium.
2.8.4 Employers and Public Liability (EL) Insurance, however, continues to rise significantly. Premia have risen by up to three times in five years and EL insurance is now exceeding motor insurance costs significantly at many companies. The cost of EL insurance is particularly onerous for small to medium concerns. A fuller discussion of insurance issues is contained in section 10.
2.9 Finance, Capital and Tax
2.9.1 The raising of finance is an area of major difference between large and small operators, with the big groups able to borrow capital at just above the base rate, while smaller companies pay market rates of interest. Finance and capital issues are discussed fully in section 13.
2.10 Overheads
2.10.1 The immediate post-privatisation period saw huge reductions in company overheads, with central works facilities closed, bus depots and bus station sites sold off and layers of management and administrative staff removed.

©The TAS Partnership Limited ▪ November 07
Study of Cost Issues in Transport Operation: Phase One: Understanding the Trends and Drivers in Cost Inflation: Task Note 2: The Bus Industry ▪ 17
However, recent trends have reversed the reduction in overhead costs. A detailed analysis of overheads is contained in section 11.
2.11 The Community Transport Sector
2.11.1 There has been significant growth in the Community Transport (CT) sector over the last fifteen years. However, the sector has a very different breakdown of cost from that of the mainstream public transport industry, despite a general CT sector trend to develop away from the traditional volunteer-led organisational structure to more professional, business-led approaches.
2.11.2 Figure E shows a breakdown of costs for a typical mid-sized, 11-vehicle CT operator, taken from its annual accounts. Note that labour costs and vehicle running costs are reduced to around 30% of costs each, maintenance becomes a very unimportant cost heading as CT vehicles are generally operating low mileages and not subject to the degree of wear and tear suffered by buses in the mainstream.
2.11.3 Depreciation constitutes roughly five times the proportion of costs in the mainstream – CT vehicles are major items of expenditure but tend to have much shorter operating lives, and overheads account for 17% of all costs, much higher proportionally than the bus industry. There is logic to this as a CT organisation typically has premises, management and some sort of booking agency supported by only a small number of vehicles.
2.11.4 Figure F shows the five year trend in costs for the same organisation at outturn prices. It is difficult to identify any particular trends other than increases in both labour costs and running costs (principally fuel).
2.11.5 It can be fairly safely assumed that the CT sector will experience similar levels of cost increases to the mainstream sector, but in different proportions, thus, for example, labour cost increases are less critical to the CT sector while the effect of a significant increase in new vehicle cost becomes more critical.

©The TAS Partnership Limited ▪ November 07
Study of Cost Issues in Transport Operation: Phase One: Understanding the Trends and Drivers in Cost Inflation: Task Note 2: The Bus Industry ▪ 18
Figure E: Breakdown of Industry Costs – Community Transport Sector
Depreciation20%
Labour29%
Repairs and Maintenance3%
Overheads17%
Vehicle Running Costs31%
Figure F: Five Year Trends in Costs – Community Transport Sector
0
10,000
20,000
30,000
40,000
50,000
60,000
2001 2002 2003 2004 2005
£ S
pen
t P
er
Year
Vehicle Running Costs Overheads Depreciation Labour Repairs and Maintenance

©The TAS Partnership Limited ▪ November 07
Study of Cost Issues in Transport Operation: Phase One: Understanding the Trends and Drivers in Cost Inflation: Task Note 2: The Bus Industry ▪ 19
Comparison of Costs for Public and PrivateTransport Modes
3
CfIT Question 9: How do public and private transport modes compare in their costs – and would we expect the divergence between the cost of motoring and public transport fares to continue?
3.1 Motoring Costs
3.1.1 Figure G below illustrates trends in indices for various aspects of motoring costs in addition to a total cost index and RPI since 1987. Total motoring cost has followed RPI closely, although there is wide divergence in the factors making up total cost. Motoring costs and public transport fares followed the same general trend until 2001 since when public transport fares have continued to rise at the same level while increases in RPI and motoring costs have levelled off since 2001.
3.1.2 The purchase cost of vehicles (both new and secondhand) has continued to decline in real terms since 1996 and is now only 11% above the 1987 base level, despite the increased sophistication of cars. Fuel costs grew significantly in the late 1990s as did tax and insurance although both levelled off in more recent years. The one area of motoring cost which has consistently climbed at a rate much higher than RPI is maintenance (parts, accessories, labour costs and roadside recovery) and there is little evidence of any alteration to this trend.
3.1.3 Recent evidence7, however, indicates that the running costs of a car are set to increase significantly due to fuel price increases above 10% in one year and with one of the major insurers increasing premiums by an average of 16% due principally to the increase in personal injury claims and increased liability due to the number of uninsured drivers on the road. The impact of new pay-as-you-drive car insurance schemes is likely to be another significant factor as this will ‘de-fix’ another substantial element of motoring costs.
3.1.4 Parking charges can be a significant element of the cost of journeys by car. There is some evidence to suggest that parking charges are increasing significantly, both as a result of real increases in charges for existing car parks and the introduction of charges in areas which once offered free parking, including hospitals, colleges and some major businesses. In West Yorkshire, for example, parking in the district council controlled car parks increased by between 18 and 38% in the four years between 1997 and 20018. However, a
7 Report from Sainsbury’s Bank detailed on BBC News website 5-9-2006 and insurance details on 31-8-2006. 8 Source: West Yorkshire Local Transport Plan 2001-5

©The TAS Partnership Limited ▪ November 07
Study of Cost Issues in Transport Operation: Phase One: Understanding the Trends and Drivers in Cost Inflation: Task Note 2: The Bus Industry ▪ 20
study of car-borne commuters by the RAC in 200325 showed that at that time some 51% still had free parking provided by their employers at their place of work.
Figure G: Trends in Aspects of Motoring Costs9
0
50
100
150
200
250
300
350
1987 1991 1996 2001 2004 2005
Cost
In
dex
Vehicle tax and insurance MaintenancePetrol and oil Purchase of vehiclesAll motoring expenditure RPI
3.1.5 In order to demonstrate the relative importance of each of the cost headings shown in Figure G, a sample breakdown of motoring cost is shown in Figure H. This is prepared from RAC data from 2005 with the fuel price per litre updated to April 200612.
3.1.6 It can be seen that for new cars at least, depreciation takes up the major share of car costs at 40%, followed by fuel which accounts for 32% of motoring costs. Despite experiencing the highest rises in cost over the years since 1987, insurance and maintenance together make up only around 20% of running costs. On its own, tax (excluding fuel duty) accounts for a small proportion, just under 3%, of the total costs.
3.1.7 Evidence from a Motor Insurance report by BW-Deloitte-Touche10 indicates a growing gap between new car purchase price and secondhand prices, with prices for used cars falling at a greater rate in real terms than the trend in new car prices.
9 Data taken from ONS Social Trends Report, 2005 10 http://www.bw-deloitte.com/documents/BWDeloitte_UKMotorInsurance.pdf

©The TAS Partnership Limited ▪ November 07
Study of Cost Issues in Transport Operation: Phase One: Understanding the Trends and Drivers in Cost Inflation: Task Note 2: The Bus Industry ▪ 21
3.1.8 Figure I then breaks down the motoring costs to the average family by category11 (although in this case purchase and finance are included under the same heading). It is notable how the effect of multiple car ownership within households shifts the proportions of expenditure so that insurance and maintenance become much more significant items of expenditure.
3.1.9 Figure J relates these categories to their effect on average household expenditure over time. Although the biggest proportionate increase has been in the insurance and tax category, it is notable that the average household now spends around 80% more on vehicle purchase than in 1981, despite real terms drops in car prices. This has reflected the growing trend toward multiple car households and an increased tendency to purchase new cars.
3.1.10 The percentage of households owning two or more cars grew from 17% in 1981 to 30% by 2003. Over the same period households that previously had no access to a car have acquired a car for the first time. Consequently the proportion of households owning a single car has remained broadly constant since 1967 at around 43-44%.
Figure H: Sample Breakdown of Annual Motoring Costs (2005)12
Insurance & Tax13%
Maintenance & Breakdown Cover
9%
Finance6%
Fuel32%
Depreciation40%
11 Source – Social Trends 36, April 2006, Office of National Statistics 12 Sample data taken from RAC cost of motoring index quarter three 2005. Figures based on VW Golf 1.6 over four year life at 12,000 miles per annum, fuel price updated to 93 pence per litre and fuel consumption at 41.5 miles per gallon.

©The TAS Partnership Limited ▪ November 07
Study of Cost Issues in Transport Operation: Phase One: Understanding the Trends and Drivers in Cost Inflation: Task Note 2: The Bus Industry ▪ 22
Figure I: Breakdown of Household Motoring Expenditure
Insurance and tax18.4%
Fuel27.0%
Repairs and servicing12.8%
Purchase41.8%
Figure J: Index of Average Household Expenditure on Motoring Costs
0
50
100
150
200
250
300
1981 1986 1991 1996/97 2001/02 2004/05
Exp
en
dit
ure
In
dex (
19
81
=1
00
)
Purchase Repairs and servicing Insurance and tax Fuel

©The TAS Partnership Limited ▪ November 07
Study of Cost Issues in Transport Operation: Phase One: Understanding the Trends and Drivers in Cost Inflation: Task Note 2: The Bus Industry ▪ 23
3.1.11 Trends in the total amount of fuel (petrol) consumed by cars show some remarkable variations, illustrated in Figure K. This does not show any real trend in total consumption although there is a distinct fall in the last two years for which there is data.
3.1.12 The rate of fuel consumed by cars in terms of kilometres per litre is illustrated in Figure L. This shows clearly that cars have become considerably more fuel efficient over the ten year period being examined, with average fuel consumption improving by two kilometres per litre (5.6 miles per gallon) over ten years. This overall figure for improvements in fuel consumption probably masks even better performance by standard cars as it will be affected by significantly worse fuel consumption figures produced by the growing numbers of MPVs and 4x4s.
Figure K: Total Fuel Used by Cars 1994 -2004
28500
29000
29500
30000
30500
31000
31500
1994 1995 1996 1997 1998 1999 2000 2001 2002 2003 2004
Million
Lit
res

©The TAS Partnership Limited ▪ November 07
Study of Cost Issues in Transport Operation: Phase One: Understanding the Trends and Drivers in Cost Inflation: Task Note 2: The Bus Industry ▪ 24
Figure L: Trends in Fuel Consumption by Cars 1994 – 200413
10.50
11.00
11.50
12.00
12.50
13.00
13.50
14.00
1994 1995 1996 1997 1998 1999 2000 2001 2002 2003 2004
Kilom
etr
es
per
Lit
re
3.2 Public Transport Fares
3.2.1 Figure M, taken from the ‘Social Trends’ report shows how DfT calculates that public transport fares, and more specifically bus and rail fares, have increased consistently ahead of RPI since 1987. Increases in bus and rail fares are now some 30% ahead of RPI. It is not a new development for bus fares to grow ahead of RPI. Between 1976 and 1985 fares grew by around 15% above RPI14. ‘Other’ fares, (taxi, ferry and air travel), have generally followed RPI, as have motoring costs, as demonstrated in Figure G above.
3.2.2 Although rail fares have consistently increased above RPI since 1987, bus fares remained in line with RPI until 1991, since which time they have risen consistently ahead of RPI.
13 Fuel Consumed: - Transport Statistics GB, Energy and Efficiency tables 2005. Kilometres Travelled: - Transport Trends 2005 14 Transport Statistics Great Britain 1976 - 1986

©The TAS Partnership Limited ▪ November 07
Study of Cost Issues in Transport Operation: Phase One: Understanding the Trends and Drivers in Cost Inflation: Task Note 2: The Bus Industry ▪ 25
Figure M: Public Transport Fare Trends9
100
120
140
160
180
200
220
240
260
1987 1991 1996 2001 2004 2005
Cost
In
dex
Bus and coach fares Rail faresOther All fares and other travelRetail prices index
3.2.3 We have calculated our own fare index based upon the simple calculation of revenue (including payments for concessionary travel) divided by the number of passengers taken from DfT figures, with all figures adjusted to current prices and using 1994/95 as the base year with an index of 100. Figure N and Figure O show our estimates of how fares have risen in real terms since 1994/95. This period should have eliminated the deregulation effect and therefore illustrates the general ongoing trend in fare levels. Other than in Wales, income per passenger has grown around 10% above RPI.
3.2.4 The DfT’s own bus fare index does not include revenue in its calculation. The DfT figures generally show a higher increase than that indicated by our calculation, with a very wide difference shown in London. It must be noted, however, that the fares do not all relate to the same base level of income per passenger in 1994/199515 (which may reflect different journey lengths).
3.2.5 Table 2 below shows the actual income per passenger (adjusted to current prices) in each area. Note that the highest average income per passenger in 1994/95 was in English non-PTE areas and that these areas have suffered the highest percentage fare increases in subsequent years.
15 See Figure B

©The TAS Partnership Limited ▪ November 07
Study of Cost Issues in Transport Operation: Phase One: Understanding the Trends and Drivers in Cost Inflation: Task Note 2: The Bus Industry ▪ 26
3.2.6 Figures for each country show that fares have risen in England and Scotland by around 10% in real terms over ten years, while Wales has seen a larger increase of 26% following significant progressive increases after the turn of the century. The Welsh figure may reflect changes in travel habits after the introduction of free concessionary travel, but there has been no equivalent shift in Scotland.
Breaking England’s figures down by area type in Figure O shows that there is considerable variation within the English results. While the non-PTE areas have increased by over 30% in real terms, PTE areas have incurred an increase just over 20% while London has seen a fall of just over 10%.
3.2.7 Table 3 goes on to show that this general pattern of fares increases by area type above does not apply uniformly as it compares changes in fares over ten years in a PTE area (South Yorkshire) and a shire area (County Durham). Overall there has been a lower level of increase in the shire area. RPI increased by around 52% in this period thus all single fares have increased well above RPI. At the foot of Table 3 the prices of weekly season tickets are shown – it is notable how the prices of these have increased at or below the level of RPI. This is discussed further in section 3.3.
Table 2: Average Income per Passenger 1994/1995 and 2004/2005
Year / Area London English PTE areas
English non-PTE areas
England Scotland Wales
1994/1995 £0.55 £0.64 £0.84 £0.68 £0.74 £0.77
2004/2005 £0.49 £0.78 £1.12 £0.75 £0.82 £0.97
Change -10.9% +21.9% +33.3% +10.3% +10.8% +26.0%

©The TAS Partnership Limited ▪ November 07
Study of Cost Issues in Transport Operation: Phase One: Understanding the Trends and Drivers in Cost Inflation: Task Note 2: The Bus Industry ▪ 27
Table 3: Comparison of Fare Changes over 10 Years PTE and Shire
Fare in 1996
First South Yorkshire Fare 2006
% Change since 1996
Go Northern County Durham
Fare 2006 % Change since 1996
£0.45 £1.00 +122.2% £0.85 +88.9%
£0.65 £1.50 +130.8% £1.30 +100.0%
£0.75 £1.50 +100.0% £1.40 +86.7%
£0.85 £1.80 +111.8% £1.50 +76.5%
£0.95 £1.80 +89.5% £1.95 +105.3%
£1.10 £2.10 +90.9% £2.05 +86.4%
First Week16
£10.95 £15.00 +37.0%
Go n Save16
£12.50 £19.00 +52.0%
Figure N: Indices of Bus Fares in the UK (Current Prices) since 1994
90
100
110
120
130
140
1994
/95
1995
/96
1996
/97
1997
/98
1998
/99
1999
/200
0
2000
/01
2001
/02
2002
/03
2003
/04
2004
/05
Ind
ices
England Scotland Wales Great Britain
16 In both cases the prices for the ‘all routes’ versions bought on-bus is shown.

©The TAS Partnership Limited ▪ November 07
Study of Cost Issues in Transport Operation: Phase One: Understanding the Trends and Drivers in Cost Inflation: Task Note 2: The Bus Industry ▪ 28
Figure O: Indices of Bus Fares in England (Current Prices) since 1994
80
90
100
110
120
130
140
1994
/95
1995
/96
1996
/97
1997
/98
1998
/99
1999
/200
0
2000
/01
2001
/02
2002
/03
2003
/04
2004
/05
Ind
ices
London English PTE areas English non-PTE areas Great Britain
3.3 Fare Structure
3.3.1 One aspect of fares for bus journeys which has changed in many areas is the structure of ticketing. Prior to deregulation bus fare structures focussed principally upon single (and sometimes return) fares with a limited range of multi-journey tickets, which usually required some sort of photocard and a visit to a travel office to carry out each renewal. This approach has now changed radically. The majority of larger companies now offer day and weekly tickets which are bought on the bus. Initially, most of these were introduced (or relaunched) at very attractive prices to retain patronage and market share in competitive situations. It is perhaps worth noting that such tickets have an influence on the accuracy of passenger counts, since there is always a tendency to under-record non-fare-paying passengers.
3.3.2 In many urban areas – and particularly in PTE areas - the predominance of these tickets means that fewer than 25% of passengers now travel by purchasing single tickets and in many areas the day ticket acts as a default maximum value for a return ticket. A particular case in point exists in south Manchester, where Stagecoach’s day ticket at £2.70 is cheaper than two single fares for all but the shortest journeys.
3.3.3 Thus the significance of single fare levels can be significantly overstated and the importance of the pricing of day tickets overlooked. For example, in South

©The TAS Partnership Limited ▪ November 07
Study of Cost Issues in Transport Operation: Phase One: Understanding the Trends and Drivers in Cost Inflation: Task Note 2: The Bus Industry ▪ 29
Yorkshire First implemented three fare increases in 2005 which led to criticism from the PTE, press and local elected representatives. The headline figures all related to the effects upon single fare values, which had indeed increased significantly, but this focus masked some very large increases and structural changes to day and weekly tickets which potentially affected far more users. In particular, the previous users of off-peak day tickets – priced at £2.20 at the beginning of 2005, found their only alternative (other than reverting to single fares) at the end of the year to be a £3.50 day ticket, or a 59% increase in one year. Conversely, those who continued to purchase the all-routes weekly ticket saw only a small price rise across the year.
3.3.4 The chart shown in Figure P illustrates changes to single fares over a range of distances and weekly ticket17 prices for First South Yorkshire since 1995, including the Retail Price Index for comparison, with all values scaled to 100 in 1995 for comparative purposes. Single fares are shown for one, two, three and seven mile journeys.
3.3.5 This shows clearly that there has been a steady rate of increase above RPI in all of the single fares, with fares for shorter distances increasing by the greatest proportion (equivalent to 9½% per year for the one mile fare) and longer journeys by a lower proportion (around 7½% per year). In the intervening period RPI has grown by an average of 2½% per year. It is notable, however, that the price growth of weekly tickets has remained at or below the rate of increase in RPI throughout this period.
3.3.6 It is perhaps unfair to concentrate on one company in one area. Some operators have applied significant price increases to multi-journey tickets with every price increase applied to single fares and there are also those who have not imposed the same level of single fare increases as the case above. But there does appear to be an overlying trend for single fares to rise well above the level of RPI while the cost of multi-journey tickets has risen roughly in line with RPI.
3.3.7 A similar exercise was performed using data for Go Northern’s operations in County Durham. The single fares which ranged between 50p and 180p at November 1996 have once again been scaled to 100 for comparative purposes. Figure Q shows a much lower rate of increase to single fares, except for the low-value short distance fares and once again its weekly Go’n’Save (GNS) season ticket has roughly followed RPI. There is one significant similarity to the First data in that fares in County Durham took a major upward divergence from RPI in 2005, again in response to fuel price increases18.
3.3.8 To look at another range of multi journey tickets, Figure R illustrates the price trend of Lothian Buses’ day and weekly tickets since 1991. After an initial
17 The price for the all day network-wide FirstDay ticket is shown here. 18 www.simplygo.com

©The TAS Partnership Limited ▪ November 07
Study of Cost Issues in Transport Operation: Phase One: Understanding the Trends and Drivers in Cost Inflation: Task Note 2: The Bus Industry ▪ 30
period of above-inflation increases, prices have generally followed the trend of RPI since 1996 until 2005 when there was a significant increase in weekly ticket price but the day ticket price is now below the rate of growth of RPI.
3.3.9 The figures from both County Durham and Lothian support our findings from South Yorkshire that the price of multi journey tickets generally follows RPI much more closely. This also helps to explain why shire areas have shown a higher rate of overall increase in fares (expressed in terms of revenue per passenger) than the PTE areas. Shire areas tend to have lower availability of multi-journey tickets and a greater dependency upon off-peak passengers who are less likely to purchase multi-journey tickets. The level of single fares is therefore much more germane to shire areas.
Figure P: Trends in Bus Fares for First South Yorkshire 1995 – 2006
50
70
90
110
130
150
170
190
210
230
250
Dec-9
5
Apr-96
Aug-
96
Dec-9
6
Apr-97
Aug-
97
Dec-9
7
Apr-98
Aug-
98
Dec-9
8
Apr-99
Aug-
99
Dec-9
9
Apr-00
Aug-
00
Dec-0
0
Apr-01
Aug-
01
Dec-0
1
Apr-02
Aug-
02
Dec-0
2
Apr-03
Aug-
03
Dec-0
3
Apr-04
Aug-
04
Dec-0
4
Apr-05
Aug-
05
Fare
s In
dex (
19
95
=1
00
)
1 mile 2 miles 3 miles 7 miles Weekly RPI

©The TAS Partnership Limited ▪ November 07
Study of Cost Issues in Transport Operation: Phase One: Understanding the Trends and Drivers in Cost Inflation: Task Note 2: The Bus Industry ▪ 31
Figure Q: Trends in Fares since 1996 – Go Northern, County Durham
100
120
140
160
180
200
220
240
260
Nov-
96
Mar
-97
Jul-9
7
Nov-
97
Mar
-98
Jul-9
8
Nov-
98
Mar
-99
Jul-9
9
Nov-
99
Mar
-00
Jul-0
0
Nov-
00
Mar
-01
Jul-0
1
Nov-
01
Mar
-02
Jul-0
2
Nov-
02
Mar
-03
Jul-0
3
Nov-
03
Mar
-04
Jul-0
4
Nov-
04
Mar
-05
Jul-0
5
Nov-
05
Mar
-06
Ind
ex (
Base
19
96
= 1
00
)
50 80 110 150 180 GNS RPI
Figure R: Trends in Day and Weekly Ticket Prices at Lothian Buses 1991 - 2006
100
110
120
130
140
150
160
170
180
190
May-9
1
Nov-
91
May-9
2
Nov-
92
May-9
3
Nov-
93
May-9
4
Nov-
94
May-9
5
Nov-
95
May-9
6
Nov-9
6
May-9
7
Nov-
97
May-9
8
Nov-
98
May-9
9
Nov-9
9
May-0
0
Nov-
00
May-0
1
Nov-
01
May-0
2
Nov-0
2
May-0
3
Nov-
03
May-0
4
Nov-
04
May-0
5
Nov-
05
Ind
ex (
19
91
= 1
00
)
All Day One Week RPI

©The TAS Partnership Limited ▪ November 07
Study of Cost Issues in Transport Operation: Phase One: Understanding the Trends and Drivers in Cost Inflation: Task Note 2: The Bus Industry ▪ 32
3.4 Perceptions of Travel Cost versus True Cost
3.4.1 Motorists owning their own cars ostensibly face the same types of costs as bus operators:
• Overheads – purchase cost of the car, tax, insurance, MOT.
• Depreciation – this can be translated as an allowance against the purchase price of the next car or, more likely, finance costs against the existing vehicle. New cars can depreciate by around 40% as soon as they are driven from the garage forecourt.
• Semi-variable Cost – repairs, replacement tyres etc.
• Labour Costs – but in this case a value of the owner’s time spent driving.
• Marginal Costs – the marginal cost of fuel plus parking charges.
3.4.2 However, most motorists in calculating the cost of a journey consider only the marginal cost of such journeys – typically fuel at around 10 pence per mile. The true cost per mile of motoring has been shown to vary considerably dependent upon the owner’s annual mileage and the period of intended ownership. Using figures for a mid-range new car (Vauxhall Astra 1.4) the average cost per mile – excluding parking charges - varies between 23 pence for an owner driving 40,000 miles per year and the vehicle having a four year life to 76 pence per mile for an owner driving 10,000 miles per year and selling the car in year one19.
19 Source Glass’s Whole Life Costs – www.virtual-showroom.co.uk

©The TAS Partnership Limited ▪ November 07
Study of Cost Issues in Transport Operation: Phase One: Understanding the Trends and Drivers in Cost Inflation: Task Note 2: The Bus Industry ▪ 33
Figure S: Comparisons of Whole Life Average Mileage Cost – Based on Vauxhall Astra 1.4 new in 2006.
0
10
20
30
40
50
60
70
80
1 Year 2 Years 3 Years 4 Years
Vehicle Life
Lif
e C
ost
- P
en
ce p
er
Mil
e
10000 mpa 20000 mpa 30000 mpa 40000 mpa
3.4.3 The range of whole life average mileage costs is shown above in Figure S. Note that for a motorist driving 10,000 miles per year the average cost is never below 47 pence per mile. 10,000 miles per year equates to around 32 miles per day over six days per week. The RAC has recently reported that a significant proportion of motorists make daily journeys of five miles and under20 - these people will therefore incur average mileage costs exceeding those shown for the 10,000 miles per annum category above as the overhead cost of owning the car must be spread over fewer miles driven. Conversely, it is clear from the above figures that for high mileage drivers covering 40,000 miles per year, the average mileage cost varies little between a three or four year vehicle life.
3.4.4 The costs above reduce for second-hand cars, with a three year old car costing £7,000 spreading the reduced purchase cost over the life of the vehicle. Over a four year life this reduces the average cost per mile by between 17.5 pence (10,000 miles per annum) and 4.4 pence (40,000 miles per annum) but this must be set against the increased maintenance cost as the vehicle grows older.
3.4.5 Thus the motorist’s perceived cost of motoring of around 10 pence per mile for fuel fails by some margin to reflect the true costs of motoring. One true advantage perceived by the motorist, however, is that additional passengers
20 RAC 2006 Annual Report at www.rac.co.uk

©The TAS Partnership Limited ▪ November 07
Study of Cost Issues in Transport Operation: Phase One: Understanding the Trends and Drivers in Cost Inflation: Task Note 2: The Bus Industry ▪ 34
effectively travel free – incurring marginal additional fuel costs for transporting additional weight but again this is ignored by the motorist in estimating journey costs. Public transport fares generally do relate to individual passengers – group discounts are rare in public transport fares and, where they exist, cannot offer the same level of discount offered by the occupation of spare seats in cars.
3.4.6 Conversely, public transport fares are often perceived at the other extreme in that potential users, particularly infrequent travellers, perceive the headline maximum fares – standard open return fares for rail and basic single fares for bus which disguise the availability of other discounted tickets.
3.4.7 The need to interchange to complete a journey usually adds a disproportionate fares penalty to public transport journeys, particularly where there is also a change of operator. In general, the rail industry retains through ticketing across operating companies, but unlike the bus industry, there are actually many instances when the fare for a journey involving interchange is cheaper if the passenger purchases separate tickets21.
3.4.8 The difficulty is that whereas the car is an instantly available means of transport, even if there is a bus or train available to make the journey within a few minutes, the cheapest fare option is likely to involve some sort of pre-booking or prepayment. It could be considered that information is the key element here and the current information systems for public transport are flawed. Particularly for those unused to public transport, Traveline has many deficiencies and the National Rail Enquiry Service is prevented from informing intending passengers of situations where cheaper fares are available by purchasing separate tickets.
3.4.9 The following examples in Table 4 and Table 5 compare the mileage costs of two distinct journeys based on Preston. The first is a regular commuting trip within Preston from Ribbleton to the Royal Preston Hospital, while the second relates to a longer-distance trip from Preston to Newcastle. For car cost comparisons, the first assumes a driver covering 10,000 miles per annum, the second 30,000 miles per annum. The comparative public transport costs use the same mileage figure as the car journey, even though in both cases the route taken is longer than the direct car journey and both involve a change of vehicle.
3.4.10 Although in a more thorough comparison of journey costs, a generalised cost model would include values of time, this exercise simply compares out-of-pocket expenses.
21 This is an ongoing subject in Barry Doe’s ‘Fare Dealer’ column in Rail magazine – see issue 546 for examples.

©The TAS Partnership Limited ▪ November 07
Study of Cost Issues in Transport Operation: Phase One: Understanding the Trends and Drivers in Cost Inflation: Task Note 2: The Bus Industry ▪ 35
Table 4: Cost Comparisons – Local Commuting Journey
Mode
Daily Cost (Round
Trip) Cost per
Mile Notes
Car Journey
Car (Full Cost)22 £4.04 £0.64 Based on 10,000 mpa and 4 yr life
Car (Marginal Cost) £0.86 £0.27 Marginal fuel only
Parking Charges £1.50 Hospital Daily Parking Charge
Distance (miles) 8.6 Ribbleton - RPH from route planner
Bus Options
Single Fares £4.40 £0.51
Day Ticket23 £3.00 £0.35
Weekly Ticket23 £1.80 £0.21 Assuming over 5 working days
Monthly Ticket23 £1.45 £0.17 Assuming 22 working days per month
3-Monthly Ticket23 £1.32 £0.15 Assuming 22 working days per month
3.4.11 Table 4 shows that the true motoring cost for the local commuting journey is the most expensive of all travel options. Perhaps even more so, as the estimated annual commuting mileage is only 2,270 miles – needing significant ‘other’ mileage to spread the vehicle purchase cost over 10,000 miles.
3.4.12 Note that the public transport season ticket options are less expensive than even the marginal motoring cost. The key here is that the perceived cost comparison will be between the marginal motoring cost and the upfront single bus fares, hence the view that ‘catching the bus is twice as expensive as the car’.
22 Using figures shown in Figure S 23 Restricted to single operator only.

©The TAS Partnership Limited ▪ November 07
Study of Cost Issues in Transport Operation: Phase One: Understanding the Trends and Drivers in Cost Inflation: Task Note 2: The Bus Industry ▪ 36
Table 5: Cost Comparisons – Long Distance Journey
Mode
Cost (Round
Trip) Cost per
Mile Notes
Car Journey
Car (Full Cost)22 £71.14 £0.29 Based on 30,000 mpa and 4 yr life
Car (Marginal Cost) £27.36 £0.13 Marginal Fuel only
Parking Charges £7.30 Parking for 4-6 hours NCP Newcastle
Distance 273.6 Preston City Centre - Newcastle from route planner
Rail Ticket Options
Saver £54.20 £0.20 Through ticket - any train, any time walk-on fare
2 Saver £42.70 £0.16 Rebook at Carlisle - any train, any time walk-on fares
Saver + 2 Singles24 £31.90 £0.12 Pre-booked singles Preston - Carlisle and rebook at Carlisle.
3.4.13 Once again, for the long distance journey, all of the public transport options cost less per mile than the full car cost. The cost per mile of the cheapest version of rail fares is lower than the marginal car cost. The perception, however, will set the marginal car cost against the most expensive standard rail ticket.
3.4.14 However, the key factors in both journey examples are flexibility, information and pre-planning. For the local example the cheapest public transport option involves a commitment to a single operator, a large upfront payment and the need for a special journey to go and purchase the ticket.
3.4.15 The second example produces the cheapest travel option by purchasing three separate rail tickets but the need to commit to specific train journeys and considerable knowledge of rail ticketing.
3.4.16 These comparisons, however, only apply for single person journeys. Each additional person would face the same public transport cost while up to four additional people could share the car journey at no extra cost.
3.4.17 Some data from the RAC Report on Motoring25 on regular car drivers, reproduced in Table 6, provides illustration of the difficulties faced in dealing with issues of perception. The average car commuter drives in his or her car alone and their 14-mile journey takes them about 25 minutes. However, if they were to go on public transport, they estimate that it would have taken
24 Single tickets are Virgin Value Advance tickets, must be booked by 1800 the day before travel on specified trains and not valid on Fridays. 25 Taken from presentation ‘Commuting and Travel Choices (Aug 2003) at www.racfoundation.org

©The TAS Partnership Limited ▪ November 07
Study of Cost Issues in Transport Operation: Phase One: Understanding the Trends and Drivers in Cost Inflation: Task Note 2: The Bus Industry ▪ 37
them more than three times as long – although a quarter admitted to not really knowing how long it would take.
3.4.18 There is even greater ignorance about cost. Although car drivers think it costs them about £3.20 to commute (around 23 pence per mile) compared with £4 for a public transport journey, nearly half have no idea how much it really costs either in the car or by public transport.
Table 6: Knowledge of Commuting Journeys by Car Drivers25
Category Perception
Level of commuting trips with only one person in car 80%
Length of car commuting journey 14 miles
Time taken to complete commuting journey 25 minutes
Time taken if there were no congestion 17 minutes
Estimated time taken by public transport instead of car 84 minutes (27% don’t know)
Approximate cost by car £3.20 (44% don’t know)
Approximate cost by public transport £4.00 (46% don’t know)
3.5 Fares Comparisons between Public Transport Modes
3.5.1 Traditionally, bus fares were almost always cheaper than equivalent rail fares. However, in many areas, successive above-inflation increases to bus fares have coincided with the regulation of some rail fares and the continuation of PTE support for others. Thus rail fares are often below, and sometimes significantly below, bus fares for equivalent journeys, especially over shorter distances. There can often be peak and off-peak differences. Whilst bus operators tend to retain a standard farescale across the day, rail cheap day return tickets are not valid in the morning peak, but offer a large discount for off-peak travel (often single fare plus 10 or 20 pence). Given rail’s inherent advantages in terms of journey time, this inequity will have encouraged a switch to rail travel.
3.5.2 Some sample rail and bus fare comparisons for medium-distance journeys are shown below in Table 7. In all but two cases the rail single fare is higher than bus, but the reverse is the case for off-peak returns. It is noteworthy how the off-peak rail fares significantly undercut bus fares for the journeys in PTE areas, the last three entries in the table.


©The TAS Partnership Limited ▪ November 07
Study of Cost Issues in Transport Operation: Phase One: Understanding the Trends and Drivers in Cost Inflation: Task Note 2: The Bus Industry ▪ 39
Table 7: Fare Comparisons – Sample Bus and Rail Journeys
From To Rail Adult Single
Bus Adult Single
Bus as % Rail Fare
Rail Adult Peak Day
Return
Bus Peak Day Return
Bus as % Rail Fare
Rail Adult Cheap Day
Return
Bus Adult Cheap Day
Return
Bus as % Rail Fare
Preston Chorley £3.50 £3.10 88.6% £4.05 £5.65 139.5% £4.05 £5.65 139.5%
Newcastle Durham £4.60 £2.80 60.9% £5.90 £4.9026 83.1% £4.90 £4.9026 100.0%
Winchester Southampton £4.30 £3.70 86.0% £4.70 £5.0026 106.4% £4.40 £5.0026 113.6%
Chandlers Ford Southampton £2.80 £2.60 92.9% £3.40 £4.30 126.5% £3.10 £4.30 138.7%
Poole Bournemouth £2.60 £2.00 76.9% £2.90 £2.00 69.0% £2.70 £2.00 74.1%
Cardiff Barry £2.20 £2.90 131.8% £2.60 £3.0026 115.4% £3.30 £3.0026 90.9%
Leeds Bradford £2.40 £2.00 83.3% £4.25 £3.3026 77.6% £2.40 £3.3026 137.5%
Manchester Bolton £2.45 £3.80 155.1% £4.45 £3.3026 74.2% £2.55 £3.3026 129.4%
Doncaster Conisbrough £1.90 £1.80 94.7% £2.90 £3.5026 120.7% £2.10 £3.5026 166.7%
26 Day Ticket as cheapest travel option


©The TAS Partnership Limited ▪ November 07
Study of Cost Issues in Transport Operation: Phase One: Understanding the Trends and Drivers in Cost Inflation: Task Note 2: The Bus Industry ▪ 41
3.6 Light Rail
3.6.1 Fares on light rail systems are generally akin to those charged on local bus services, as most are within PTE or TfL areas with fare levels influenced, if not set, by the PTE or TfL. There are two principal exceptions:
• Blackpool – tram fares are typically around 20% higher than those for equivalent bus journeys by the same operator.
• Manchester – At opening, Metrolink fares were significantly higher than those applying on the local bus and heavy rail networks: however, there is some evidence that bus fares caught up in the late 1990s, though continuing patronage growth on Metrolink’s Bury-Altrincham route led to pricing up of peak fares. Manchester is also unique in that its trams do not participate in the full range of multi-operator passes, largely due to its premium peak fares.
3.6.2 In Nottingham, although NET adopts the same farescale as NCT buses, this farescale with a low maximum fare was extended out of the City of Nottingham to its terminus at Hucknall, forcing Trent Barton – somewhat to its irritation – to reduce its commercial fares on parallel bus services and to reconfigure its network to feed the tram.
3.7 Taxis
3.7.1 Taxis have also become a more viable travel option over time, due to reduced fares in real terms and greater availability of taxis due to removal of controls on the number of taxi licences in most areas. Local authorities still control the level of taxi fares and are unwilling to sanction increases much above inflation, despite many of the cost increases which affect the bus industry filtering through into the taxi trade.
3.7.2 Increasing affluence has increased disposable income, coupled with better choice for groups and people with large quantities of shopping. The provision of services at unsocial hours, and bespoke transport to overcome personal safety fears, all contribute to the utility of taxis. With the growth in out-of-town supermarkets, taxis can often be the only feasible transport option for those with low incomes and/or no car.
3.8 Household Transport Expenditure
3.8.1 The most recently published edition of Social Trends27 shows a changing trend in household expenditure on transport. Despite the fall in motoring costs,
27 Social Trends 36, April 2006 (Office of National Statistics)

©The TAS Partnership Limited ▪ November 07
Study of Cost Issues in Transport Operation: Phase One: Understanding the Trends and Drivers in Cost Inflation: Task Note 2: The Bus Industry ▪ 42
household expenditure on motoring had been rising steadily (largely due to the increasing number of households with more than one car) before dropping slightly between 2001/2 and 2004/5. This fall is wholly due to the fall in purchase prices as expenditure on all other aspects of motoring has increased significantly.
3.8.2 Conversely, average household expenditure on bus and coach fares continues to decline slowly while expenditure on rail has grown to above its 1981 level. Comparative figures are shown below in Figure T.
3.8.3 Figure U illustrates how expenditure on transport as a proportion of all household expenditure has grown consistently but with a small decline in the most recent years. The growth has been almost exclusively due to increased expenditure on motoring, although in recent years the percentage of expenditure on rail has increased. The average household’s expenditure on bus fares is now negligible amounting to only 0.3% of the average household spend.
Figure T: Index of Average Household Expenditure on Transport28
0
20
40
60
80
100
120
140
160
180
1981 1986 1991 1996/97 2001/02 2004/05
Exp
en
dit
ure
In
dex (
19
81
=1
00
)
Motoring expenditure Rail and tube fares Bus and coach fares
28 All figures adjusted to 2004 prices.

©The TAS Partnership Limited ▪ November 07
Study of Cost Issues in Transport Operation: Phase One: Understanding the Trends and Drivers in Cost Inflation: Task Note 2: The Bus Industry ▪ 43
Figure U: Percentage of Household Expenditure on Transport
0.0%
2.0%
4.0%
6.0%
8.0%
10.0%
12.0%
14.0%
16.0%
18.0%
1981 1986 1991 1996/97 2001/02 2004/05
Per
centa
ge
of
Tota
l H
ouse
hold
Exp
enditure
Motoring Rail Bus Taxi & Air


©The TAS Partnership Limited ▪ November 07
Study of Cost Issues in Transport Operation: Phase One: Understanding the Trends and Drivers in Cost Inflation: Task Note 2: The Bus Industry ▪ 45
Core Cost Key Performance Indicators 4
CfIT Question 10: Establish core cost Key Performance Indicators for the subsequent phases that are meaningful to the actors.
4.1 Cost Headings
4.1.1 In Task Note 1 we identified the following breakdown of bus industry costs:
• Direct Costs (Hours or Mileage Based):
Driver Costs (per bus hour)
Fuel (per km)
Oil, Tyres and Mileage-based Maintenance (per km).
• Semi-variable Costs (Hours Based):
Administration
Supervision
Time-based maintenance.
• Fixed Costs (Fixed Unit – Bus Based):
Vehicle Ownership or Leasing Costs
Ticketing and Revenue Systems
Depot, Garaging and Cleaning Systems
Other Overheads (Head Office Costs etc.).
4.1.2 In section 2 we broke down costs into five simple headings for which information was readily available in company accounts:
• Labour
• Maintenance
• Fuel
• Overheads
• Depreciation (including leasing charges).

©The TAS Partnership Limited ▪ November 07
Study of Cost Issues in Transport Operation: Phase One: Understanding the Trends and Drivers in Cost Inflation: Task Note 2: The Bus Industry ▪ 46
4.1.3 It is not possible to directly translate the simplified categories into direct, semi-variable or fixed costs, but we acknowledge that a set of key performance indicators are needed to measure trends as they emerge.
4.2 Establishing KPIs
4.2.1 Key performance indicators must be meaningful measures based upon accurate and easily obtained figures. The cost headings described in Task Note 1 listed three fundamental cost measures to be used as a basis for measurement:
a) Miles or kilometres operated.
b) Hours in service.
c) Peak Vehicle Requirement (PVR).
4.2.2 Kilometres operated is a fundamental figure required in the calculation of rebateable mileage for BSOG purposes (kilometres operated minus non eligible kilometres equals rebateable mileage).
4.2.3 Most companies will have a measure of hours in service, even if this is only a scheduled hours figure. We feel that this is preferable to using paid hours as a measure, as the latter reflects hours paid at overtime premia and such and is very dependent upon local agreements.
4.2.4 Across the bus industry, the PVR is a standard measure of the minimum number of vehicles needed to fulfil the operators’ service requirements. This may be a more problematic measure for the coach industry where private hire arrangements result in day to day fluctuations in vehicle requirements.
4.2.5 We also suggest that a measure of the total number of staff employed is needed, preferably broken down into driving and non-driving staff.
4.2.6 Our suggested KPI figures are therefore:
• Mileage Based:
Total cost per km operated
Fuel cost per km operated
Spares, oil, tyres and maintenance per km operated
Motor Insurance and accident cost per km operated:
• This will cover self insurance of small value accidents and claims.
©The TAS Partnership Limited ▪ November 07
Study of Cost Issues in Transport Operation: Phase One: Understanding the Trends and Drivers in Cost Inflation: Task Note 2: The Bus Industry ▪ 47
• Hours Based:
Total cost per hour operated
Drivers’ wages per hour operated
Drivers’ paid hours per hour operated
Km operated per paid driver hour
Passengers carried per paid driver hour.
• PVR Based:
Total cost per PVR
Overheads per PVR
Other Insurance per PVR (chiefly EL)
Depreciation and leasing charges per PVR.
• Staff Based:
Average driver wages
Average wages per staff member
Km operated per full time driver employed
Passengers carried per full time driver employed
Drivers employed as a percentage of driver establishment29.
29 Establishment = the number of drivers needed to fulfil all scheduled duty requirements allowinf for holiday cover etc..


©The TAS Partnership Limited ▪ November 07
Study of Cost Issues in Transport Operation: Phase One: Understanding the Trends and Drivers in Cost Inflation: Task Note 2: The Bus Industry ▪ 49
Core Sensitivities and Cost Drivers 5
CfIT Question 11: Establish the core sensitivities and cost drivers
5.1 Wage Levels
5.1.1 Figure C in section 3 shows that 68% of bus industry costs are accounted for by labour cost. It is obvious, therefore, that any major shift in labour costs has a significant effect upon overall cost. The major proportion of labour cost relates to drivers’ wages, typically representing 75% of labour cost.
5.1.2 In average terms, the basic pay rate for all bus drivers has increased from £5.48 per hour in 1997 to £8.15 per hour in 2005 at outturn prices, representing a 48.7% increase over eight years. Over the same period average weekly earnings for all full time bus drivers rose from £265 per week to £381 per week including overtime payments, an increase of 43.8 %.
5.1.3 Over the same period, the Retail Price Index increased by 26%. This obviously has a major influence in pushing the cost of transport provision ahead of the underlying rate of inflation. As labour costs account for almost 70% of all costs, this automatically indicates cost rises around 20% above inflation. However, these generalised figures hide significant variations and are notably skewed upwards by figures for London. The reasons for this are discussed more fully in section 6.
5.2 The Effect of Traffic Congestion
5.2.1 The level of total road traffic and the number of vehicles licensed continue to grow. As shown below in Figure V, the mileage travelled by all vehicles has almost doubled since 1980 and in Figure W we can see how the number of licensed vehicles has also grown, with the number of cars licensed increasing by 75% in 25 years against growth in other vehicles of 43%.
5.2.2 With this growth in traffic comes increasing congestion, although there is some evidence that urban traffic levels have levelled out. Speed surveys were carried out for the DfT in urban areas other than London during 1993, 1996/97, 1999/00 and 2002. There were no significant changes in average speeds across the total urban road network over this period30.
30 Transport Trends 2005, DfT

©The TAS Partnership Limited ▪ November 07
Study of Cost Issues in Transport Operation: Phase One: Understanding the Trends and Drivers in Cost Inflation: Task Note 2: The Bus Industry ▪ 50
Figure V: Growth in Road Traffic (Annual Distance Travelled)
0.0
100.0
200.0
300.0
400.0
500.0
600.0
1980
1981
1982
1983
1984
1985
1986
1987
1988
1989
1990
1991
1992
1993
1994
1995
1996
1997
1998
1999
2000
2001
2002
2003
2004
Bil
lio
n K
ilo
metr
es
Cars and taxis Other
Figure W: Numbers of Vehicles Licensed by Year
0.00
5.00
10.00
15.00
20.00
25.00
30.00
35.00
1980
1981
1982
1983
1984
1985
1986
1987
1988
1989
1990
1991
1992
1993
1994
1995
1996
1997
1998
1999
2000
2001
2002
2003
2004
Veh
icle
s Li
cense
d (
Mill
ions)
Cars Other Vehicles

©The TAS Partnership Limited ▪ November 07
Study of Cost Issues in Transport Operation: Phase One: Understanding the Trends and Drivers in Cost Inflation: Task Note 2: The Bus Industry ▪ 51
5.2.3 Increases in traffic volumes increase traffic congestion. This leads to slower bus journeys and decreasing reliability, making bus journeys less attractive. This in turn can lead to further transfer of passengers to private transport, thus leading to a higher volume of traffic, more congestion, and further delays thus creating a circle of decline.
5.2.4 Bus operators are under further pressure to meet the Traffic Commissioners’ targets for reliability (discussed further in section 8.3). To achieve reliability targets, operators must implement achievable timetables and continually review timetables to reflect changing circumstances. The principal way in which this is done is by retiming peak journeys and inserting additional running time. This adds to cost in that there are extra hours-based costs.
5.2.5 It must not be assumed that serious delays caused by congestion are restricted purely to major urban areas or at locations where routes cross the major road network. Most operators can quote examples of services in smaller towns which have had to be retimed or adjusted to handle the effects of traffic congestion, such as:
• Alsager, Staffordshire – First PMT needed to allocate extra peak running time to ameliorate the effects of congestion.
• Ingleby Barwick, Stockton – A new settlement of 14,000 people served by only two single carriageway roads. Arriva North East had to allocate up to 40 minutes extra running time to cope with peak delays.
• Leighton Buzzard, Bedfordshire – Arriva the Shires was forced to revise its town service to omit some residential areas to overcome congestion which was not helped by locating a Tesco superstore adjacent to a pinch point of the local road network across the Grand Union Canal.
• Stapleford, Nottinghamshire – Trent Barton was forced to withdraw its services from Nottingham beyond Stapleford to Bulwell and Ilkeston in order to maintain the core service within the level of resources which the service’s revenue could support due to frequent delays caused by congestion.
5.2.6 Traffic queuing to access or egress out-of-town shopping centres often severely delays buses but these centres frequently do not produce large volumes of bus passengers31. Almost all operators who serve large, centralised hospital sites will report times where severe delays are experienced around these hospitals, both due to heavy volumes of traffic to and from the hospital and as a result of indiscriminate parking in the vicinity. Major hospitals have often been developed on sites where the surrounding highway network is woefully inadequate to deal with the levels of traffic generated.
31 There are notable exceptions to this – such as the Gateshead MetroCentre and Meadowhall (Sheffield).

©The TAS Partnership Limited ▪ November 07
Study of Cost Issues in Transport Operation: Phase One: Understanding the Trends and Drivers in Cost Inflation: Task Note 2: The Bus Industry ▪ 52
5.2.7 Further serious delays are often experienced around schools due to the volume of cars used on ‘the school run’, poor driving and poor parking near school entrances.
5.2.8 In some cases, particularly where a service is affected by day-long congestion, adjusting selected journeys is not an option and the operator must devote extra resources to a service in order to maintain reliability or amend the route of the service to omit certain sections. The likelihood of this has increased as a result of ‘peak-spreading’ due to flexibility in working hours.
5.2.9 These actions all attract extra costs or reduced revenue-earning potential with little prospect of revenue enhancement (although it may stem the loss of patronage due to unreliability). In effect actions to overcome the effects of traffic congestion incur extra cost to maintain the same level of service. Whatever change is made there is always a cost associated with that change in terms of management time, monitoring and publicity.
5.3 Legislation
5.3.1 A number of new and revised pieces of legislation have affected the working environment of bus companies and have added to wages costs in recent years. These include EU Drivers’ Hours Regulations, the forthcoming Driver Training Directive and Working Time Directive; Social Legislation including maternity and paternity pay and various tax credits.
5.3.2 Additional costs have also been incurred, principally by engineering departments, as a result of the need to conform to Health and Safety legislation. A detailed examination of costs associated with legislation compliance is contained in section 8.
5.4 Corporate Costs
5.4.1 All operating companies which are part of the larger groups incur a significant level of corporate costs. The most obvious pressure on the companies is to produce sufficient profits to produce dividends to shareholders and investors. There is budgeting pressure on the operating companies to produce year-on-year improvements in profit and profit margins which the companies aim to achieve by a mix of measures.
5.4.2 Each operating company must also pay its share of group overheads (all of the major groups have a group head office structure of some sort). For example, the performance of Wilts & Dorset will have declined due purely to the need for it to pay a contribution to Go Ahead group overheads. In some cases the larger groups have a regional structure and therefore regional overheads are also added.

©The TAS Partnership Limited ▪ November 07
Study of Cost Issues in Transport Operation: Phase One: Understanding the Trends and Drivers in Cost Inflation: Task Note 2: The Bus Industry ▪ 53
5.4.3 It cannot be ascertained from the company accounts how these costs are spread – the bus operating companies may well bear their share of group overheads from other activities such as rail franchise bids (particularly failed bids) or overseas activities. Initial feedback from the expert panel gave rise to concerns that such costs are not always allocated fairly and logically, leading to misinterpretation of the true level of cost of an operation and hence also its level of viability.
5.5 Spares and Materials
5.5.1 The prime components of materials (engineering) costs are spare parts and labour. The cost of spare parts will be determined by:
• The design life of the parts and the reliability of the vehicles.
• The unit cost of the parts.
• The size of the fleet.
• How many hours the vehicles are in service.
5.5.2 By comparison to the late 1970s (Figure D) the proportion of industry expenditure devoted to maintenance has declined by about 50%. The reasons for this decline are due largely to three main factors:
• The removal of the need to recertify vehicles after seven years and at subsequent intervals after that (this often involved a complete rebuild of a vehicle to almost as new condition).
• Particular difficulties in obtaining, and the expense of, spare parts in the late 1970s32 .
• The presence in most fleets in the early to mid 1970s of types of vehicle requiring frequent remedial maintenance work, either unreliable types or elderly vehicles retained as a consequence of the shortage of new vehicles.
5.5.3 Evidence from the analysis of industry costs suggests that expenditure on spares and materials has remained roughly constant in real-terms since the early 1990s33. Real price increases have been offset by reductions in fleet size, the elimination of older, more maintenance-intensive vehicle types and improved designs. However, early low floor designs are now showing higher maintenance costs as they reach mid-life. There are also some cost increases on a per vehicle basis due to the increasing trend to work vehicles to the maximum, with fewer buses returning to the depot between peaks.
32 NBC’s Annual Report for 1978 quotes an increase in the cost of spares by over 14% in one year. 33 TAS Bus Industry Monitor 1991 to date.

©The TAS Partnership Limited ▪ November 07
Study of Cost Issues in Transport Operation: Phase One: Understanding the Trends and Drivers in Cost Inflation: Task Note 2: The Bus Industry ▪ 54
5.6 Fuel and Utilities
5.6.1 Fuel constitutes a significant percentage of company costs, but prices are subject to market variations in addition to the governments decisions on Fuel Duty levels and on the level of BSOG. There has also been a trend for modern vehicles to be much less fuel efficient than their predecessors. Fuel is discussed fully in section 9

©The TAS Partnership Limited ▪ November 07
Study of Cost Issues in Transport Operation: Phase One: Understanding the Trends and Drivers in Cost Inflation: Task Note 2: The Bus Industry ▪ 55
Growth Disparities in Current and Forecast Costs Compared to Other Sectors
6
CfIT Question 12: Are there growth disparities in current or forecast costs compared to other sectors? And what is the cause of these disparities?
Unit bus labour costs fell after deregulation such that bus workers’ income indexed to average earnings fell: this trend is now being reversed? What are the implications?
For many categories of unskilled and semi-skilled rail workers normalised earnings are high compared to similar sectors of the economy and have been trending higher.
What are the barriers to entry (to the labour market) that have led to this trend? How successful are contingency plans - e.g. bringing in Eastern European workers.
Possibilities include the role of railways trades unions, the use of H&S arguments to artificially increase training costs (it takes well over one year these days to train someone to drive a train on even the simplest line), structure of the market; e.g. the ability of TOC owners to pass wage inflation on to the SRA at franchise re-bid [current emphasis on maximising premia limits the scope for this], the effect of performance regimes in strengthening the hand of trades unions.
Are there sector specific labour shortages that may be adding to wage and cost inflation? – construction sector labour shortages, engineering skill shortages, transport planning etc
6.1 Trends in Wage Costs
6.1.1 There are various reasons why a continuing trend towards increased labour costs can be expected. These include:
• The historic tendency for overall wages to increase at above the rate of inflation.
• Continuing falls in unemployment, further exacerbating upward pressure on wage rates in order to attract staff.
• A possible continuing ‘catch up’ process, whereby wage levels attempt to recover their previous position in relation to average earnings [see 6.1].
• Increases in taxation (for example, the National Insurance increase which took effect in April 2003).
• Increases in pension contributions.

©The TAS Partnership Limited ▪ November 07
Study of Cost Issues in Transport Operation: Phase One: Understanding the Trends and Drivers in Cost Inflation: Task Note 2: The Bus Industry ▪ 56
• Increased staff turnover as a result of a tightening labour market, an unwillingness of many to work unsocial hours and, in some areas, public order issues.
• Legislative changes, such as drivers’ hours regulations and the Working Time directive. Maternity leave (and subsequent), paternity leave, Working Tax Credits, Health & Safety Issues.
• Increased requirements for management and supervision and the acknowledgement that such posts may have been reduced too drastically in the past.
• Increased lead-in time to train new drivers.
• Improved pay for engineering staff.
6.2 The Effect upon Bus Drivers
6.2.1 Figures from the Department for Transport in 200234 showed that, in the period immediately prior to deregulation, bus and coach drivers average weekly earnings were £334.06 per week (at 2002 prices), compared with the national average wage of £332.26, thus bus and coach drivers earned 0.5% above the national average in 1985.
6.2.2 Deregulation resulted in a significant fall in drivers’ basic wage rates, but more significantly in conditions. Even prior to deregulation, the ‘minibus revolution’ led to significant numbers of minibus drivers on minimum wages and pared down conditions. Since that time there has been a period of ‘catch-up’ in most areas to move drivers’ wages closer to the national average, but the evidence against turning this into a generalisation is that this is hampered by:
• The influence of significant real-terms increases in pay rates for bus drivers in London.
• A general trend for all wages to continue to rise above the rate of inflation.
6.2.3 The move to revert from minibus operation to the use of full-size vehicles has resulted in commensurate increases in wages and many larger operators have either significantly reduced or removed the wage differential between minibus and big bus drivers.
6.2.4 The changes in working practices and in the structure of the industry which followed deregulation and privatisation resulted in drivers’ wages falling significantly below the national average, where they still remain. Trends since 1997 are shown in Table 8 below, this shows that although average weekly earnings for bus and coach drivers have increased by 18% in real terms since
34 Bulletin of Public Transport Statistics 2002, Table 30.

©The TAS Partnership Limited ▪ November 07
Study of Cost Issues in Transport Operation: Phase One: Understanding the Trends and Drivers in Cost Inflation: Task Note 2: The Bus Industry ▪ 57
1997, this accompanies a general 14% increase in real terms across all sectors. Thus the ‘catch up’ process is slow – only 4% over ten years. There is additional evidence, however, that the number of hours worked per week is also falling (see 6.4.3 et. seq.).
6.3 Trends in Weekly Earnings
6.3.1 Table 8 shows the average gross weekly earnings, taken from the Regional Statistics section of the Annual Survey of Hours and Earnings for the period covering 1997 to 2005. These figures are shown at 2005 prices. In 1997 bus and coach drivers earned 29% less than the national average wage and by 2005 this had reduced only slightly to 26% less than the national average.
Table 8: Bus & Coach Drivers Average Gross Weekly Earnings compared with National Average35
Year on Year change
Year All
Occupations Bus & Coach
Drivers %
Difference All Occupations
Bus & Coach Drivers
1997 £454 £323 -28.9%
1998 £463 £321 -30.6% 1.8% -0.6%
1999 £473 £330 -30.4% 2.3% 2.7%
2000 £479 £328 -31.6% 1.2% -0.6%
2001 £498 £344 -30.9% 4.0% 5.0%
2002 £514 £351 -31.8% 3.3% 1.9%
2003 £516 £359 -30.4% 0.3% 2.3%
2004 £513 £368 -28.3% -0.6% 2.5%
2005 £517 £382 -26.2% 0.8% 3.8%
6.3.2 Bus and coach drivers have consistently been paid less than the average of all occupations across all regions in the UK since 1986. In 2005 the region with the smallest difference in pay was the North East at 14.2% and the region with the largest difference in pay was Wales at 27.4%.
6.3.3 Across the UK there has been a 14% increase in real terms from 1997 to 2005 in the average wages across all occupations compared with an 18% increase in the average wage of bus and coach drivers. Year on Year comparisons of wage increases between the bus and coach drivers and all occupations shows that in the first period post 1997 bus and coach drivers’ wage increases were generally below the average whilst since 2003 bus and coach drivers’ increases have been above the average for all occupations.
35 Figures shown at 2005 prices.

©The TAS Partnership Limited ▪ November 07
Study of Cost Issues in Transport Operation: Phase One: Understanding the Trends and Drivers in Cost Inflation: Task Note 2: The Bus Industry ▪ 58
6.4 Regional Comparisons
6.4.1 In Figure X we can see the comparison between the national average weekly pay for all occupations against the national and regional averages for bus and coach drivers. In 2005 the London region is just below the national all occupation average, with drivers in the remaining regions earning between £100 and £200 per week less.
6.4.2 Figure Y shows the regional variations in average gross weekly pay since 1997 for fulltime bus and coach drivers. London drivers started off roughly £50 per week above the other areas and has shown a substantially higher average wage increase than other regions of the UK, so that by 2005 bus and coach drivers in London earned over £100 per week more than their counterparts in second highest earning region, the South East, and over £200 more than their counterparts in Wales, the lowest earning region. There is a difference of £79 per week in weekly wages between the South East region (£386) and Wales (£307).
6.4.3 The gap between earnings in London and the South East and other regions has widened considerably. In 1997 the difference between the highest earning region (London) and the lowest earning region (North East) was approximately £115 per week, which is just under half the difference between the highest and lowest earning regions in 2005 due to diverging wage trends. Part of the level of increase in drivers’ pay in London undoubtedly results from the conversion from crew (driver + conductor) to one person operation as drivers working as part of a crew were traditionally paid at lower rates, but there remains a wide and growing divergence in pay rates. Over the eight years since 1997 pay rates in London have grown by 31% whilst the figure in the rest of the UK averages around 12%.
6.4.4 Pay levels in regions other than London and the South East have moved little over the period of the ten-year comparison. Indeed, in the North West, drivers are now worse off in real terms than they were in 1997.
6.5 Paid Hours
6.5.1 The average paid hours per week in each region is shown in Figure Y which also includes trend lines of the national average paid hours worked for all occupations and for bus and coach drivers. Note that this is not a figure for hours worked, but hours paid.
6.5.2 On a national basis the average number of paid hours per week for bus and coach drivers has decreased from 48.4 hours in 1997 to 45.9 hours per week, in 2005. This is a 5% decrease in paid hours per week by bus and coach drivers, compared to a 2% decrease in paid hours per week for all occupations across the UK.

©The TAS Partnership Limited ▪ November 07
Study of Cost Issues in Transport Operation: Phase One: Understanding the Trends and Drivers in Cost Inflation: Task Note 2: The Bus Industry ▪ 59
6.5.3 Table 9 below shows that there has been a decrease in paid hours worked over the previous eight years for all occupations and more so for bus and coach drivers. On a regional basis all regions have higher average paid hours per week for bus and coach drivers than the national average for all occupations. In 2005 a range of 42.6 hours in the North West to 49 hours in London against the national average of 39.4 hours. The range in 1997 was between 44.2 hours in the North East to 52.1 hours in Wales set against the national average of 40 hours over all occupations.
6.5.4 Figure X and Figure Y show that whilst bus and coach drivers on average earn substantially less than the national average, they also work more hours per week than the national average. Figure Z translates the average earnings and paid hours per week into an illustration of gross pay per paid hour (this includes overtime), adjusted to 2005 prices. This once again shows the disparity between London and the rest of the UK, with only the East and South East regions showing significant increases. London has averaged a £2.50 per hour increase in pay per hour in real terms while the rest of the country sees figures increase by only around £1 per hour.
6.5.5 Table 10 shows these comparative figures over eight years in tabular form. This shows clearly a general trend for a reduction in paid hours, wide variation in gross weekly pay and a uniform increase in pay per hour – with Scotland and West Midlands performing badly here (below 10%) compared to rises over 30% in London and the East.
Table 9: Average Paid Hours per Week – National
Year on Year Change
Year All
Occupations Bus and Coach
Drivers %
Difference All Occupations
Bus and Coach Drivers
1997 40.0 48.40 21.0%
1998 40.0 48.20 20.5% 0.0% -0.4%
1999 39.8 48.00 20.6% -0.5% -0.4%
2000 39.7 47.20 18.9% -0.3% -1.7%
2001 39.7 47.10 18.6% 0.0% -0.2%
2002 39.6 46.30 16.9% -0.3% -1.7%
2003 39.5 46.50 17.7% -0.3% 0.4%
2004 39.5 46.30 17.2% 0.0% -0.4%
2005 39.4 45.90 16.5% -0.3% -0.9%

©The TAS Partnership Limited ▪ November 07
Study of Cost Issues in Transport Operation: Phase One: Understanding the Trends and Drivers in Cost Inflation: Task Note 2: The Bus Industry ▪ 60
Table 10: Eight Year Trends in Weekly Pay and Hours Worked35
Gross Weekly Pay Weekly Paid Hours Gross Pay Per Hour
Region 1997 2005 %
Change 1997 2005 %
Change 1997 2005 %
Change
England £312.06 £362.31 +16% 48.4 45.9 -5% £6.45 £7.89 +22%
Scotland £323.90 £348.90 +8% 45.5 45.2 -1% £7.12 £7.72 +8%
Wales £294.28 £306.90 +4% 52.1 43.7 -16% £5.65 £7.02 +24%
London £387.90 £509.60 +31% 49.0 49.0 0% £7.92 £10.40 +31%
South East £333.90 £385.70 +16% 50.6 45.9 -9% £6.60 £8.40 +27%
East £326.95 £366.20 +12% 51.5 44.1 -14% £6.35 £8.30 +31%
East Midlands £290.13 £368.90 +27% 47.8 48.7 +2% £6.07 £7.57 +25%
Yorks & Humber £303.91 £327.00 +8% 49.3 44.4 -10% £6.16 £7.36 +19%
North East £270.26 £330.90 +22% 44.2 45.9 +4% £6.11 £7.21 +18%
North West £318.78 £313.90 -2% 48.6 42.6 -12% £6.56 £7.37 +12%
West Midlands £303.79 £319.30 +5% 47.1 46.4 -1% £6.45 £6.88 +7%
South West £272.94 £339.30 +24% 46.2 47.1 +2% £5.91 £7.20 +22%

©The TAS Partnership Limited ▪ November 07
Study of Cost Issues in Transport Operation: Phase One: Understanding the Trends and Drivers in Cost Inflation: Task Note 2: The Bus Industry ▪ 61
Figure X: Average Weekly Pay (Gross) for Full Time Bus & Coach Drivers 1997 - 2005
250
280
310
340
370
400
430
460
490
520
550
1997 1998 1999 2000 2001 2002 2003 2004 2005
Avera
ge R
eg
ion
al
Weekly
Pay G
ross
£(a
t 2
00
5 P
rice
s)
London South East EastEast Midlands Yorkshire & the Humber North EastNorth West West Midlands South WestScotland Wales National Bus & Coach DriversNational All Occupations

©The TAS Partnership Limited ▪ November 07
Study of Cost Issues in Transport Operation: Phase One: Understanding the Trends and Drivers in Cost Inflation: Task Note 2: The Bus Industry ▪ 62
Figure Y: Average Paid Hours per Week for Full Time Bus & Coach Drivers
35
37
39
41
43
45
47
49
51
53
55
1997 1998 1999 2000 2001 2002 2003 2004 2005
Avera
ge P
aid
Ho
urs
per
Week
London South East EastEast Midlands Yorkshire & the Humber North EastNorth West West Midlands South WestScotland Wales National Bus & Coach DriversNational All Occupations

©The TAS Partnership Limited ▪ November 07
Study of Cost Issues in Transport Operation: Phase One: Understanding the Trends and Drivers in Cost Inflation: Task Note 2: The Bus Industry ▪ 63
Figure Z: Average Earnings per Hour for Full Time Bus & Coach Drivers
£5.00
£6.00
£7.00
£8.00
£9.00
£10.00
£11.00
1997 1998 1999 2000 2001 2002 2003 2004 2005
Wag
e p
er
Paid
Hou
r
Scotland Wales London South East East East Midlands Yorkshire & the Humber North East North West West Midlands South West

©The TAS Partnership Limited ▪ November 07
Study of Cost Issues in Transport Operation: Phase One: Understanding the Trends and Drivers in Cost Inflation: Task Note 2: The Bus Industry ▪ 64
6.6 Productivity
6.6.1 The changes over an eight year period in local bus kilometres operated and in local bus passengers carried per paid driver hour and per full time driver employed (part time drivers form only a small proportion of total hours worked) are shown in Table 11. It can be seen that all four measures of productivity have declined over the eight year period with the decline being greatest in London.
6.6.2 Measures based on the number of kilometres operated have fallen more steeply than measures based on the number of passengers carried in London. Outside London productivity measures based on the number of full time drivers employed have fallen more steeply than those based on the number of paid driver hours.
Table 11: Eight Year Trends in Driver Output36
Outside London London Great Britain
1997 2005 % Change
1997 2005 % Change
1997 2005 % Change
Kilometres/ driver hour 16 13 -21.4% 14 9 -35.6% 16 12 -25.2%
Passengers/ driver hour 22 17 -21.8% 49 35 -29.2% 26 21 -18.6%
Annual Km/ full time driver 36,548 27,697 -24.2% 32,909 21,136 -35.8% 36,000 26,224 -27.2%
Annual Passengers/ FT driver 50,790 38,276 -24.6% 116,455 82,273 -29.4% 60,685 48,153 -20.7%
6.6.3 Figure AA shows the average distance operated by drivers per paid hour worked, while Figure BB shows how the ratio of drivers’ paid hours to bus hours operated has changed by area since 1997. This suggests that there have been some efficiency improvements in Scotland and, particularly in the shire counties. However, in Wales, efficiency appears to have been lost but it is now broadly in line with Scotland and the shires. Inefficiency has grown at a greater rate in the PTE areas, with the greatest rate in London. The reduction in kilometres operated per hour is at least in part a product of slower operating speeds due to increased traffic delays (see section 6.15)
36 Number of local bus kilometres and number of local bus passengers carried from Transport Statistics GB 2006.

©The TAS Partnership Limited ▪ November 07
Study of Cost Issues in Transport Operation: Phase One: Understanding the Trends and Drivers in Cost Inflation: Task Note 2: The Bus Industry ▪ 65
Figure AA: Bus Kilometres per Hour Worked
10
11
12
13
14
15
16
1997/98 1998/99 1999/00 2000/01 2001/02 2002/03 2003/04 2004/05 2005/06
Avera
ge d
ista
nce
op
era
ted
per
paid
dri
ver
ho
ur
(km
)
Figure BB: Ratio of Driver Paid Hours per Bus Hour Operated by Area
1
1.1
1.2
1.3
1.4
1.5
1.6
1997 1998 1999 2000 2001 2002 2003 2004 2005
Year
Rati
o o
f P
aid
Hou
rs t
o B
us H
ou
rs
London PTEs Shires Scotland Wales

©The TAS Partnership Limited ▪ November 07
Study of Cost Issues in Transport Operation: Phase One: Understanding the Trends and Drivers in Cost Inflation: Task Note 2: The Bus Industry ▪ 66
6.7 Comparisons with Wages in other Transport Sectors
6.7.1 This section compares the trends in bus and coach drivers’ wages and hours against other transport drivers and all occupations generally. This includes:
• bus and coach drivers,
• rail drivers,
• HGV and white van drivers,
• taxi, private hire drivers and chauffeurs, and
• all occupations.
6.7.2 Figure CC and Figure DD show the difference in gross weekly pay and weekly paid hours in the different sectors of driving in the years since 1997. Train drivers are paid an average of 27% more than the national average gross weekly wage for all occupations, compared to bus and coach drivers (30% below the average), HGV and white van drivers (23% below the average) and taxi and private hire drivers (31% below the average). It is notable how the disparity in rail-based and road-based wages is increasing and that the national average figure is well below the high wages in the rail sector and well above the road-based occupations.
6.7.3 Figure CC shows the trend in weekly gross pay that has taken place over the last eight years. Note that drivers in the taxi, private hire and chauffeuring sector have suffered a decrease in real terms income over the same time period. The number of paid hours per week in the transport sector in general has decreased at a faster rate compared to all occupations. HGV and taxi, private hire and chauffeur drivers reduced their paid hours per week by 8%, bus and coach drivers reduced by 5% and train drivers by 4%, against a national average reduction of just 2%.
6.7.4 It is noticeable that train drivers earn substantially more per week gross (57% in 2005) than the national average but their average paid week is only 21% (in 2005) more than the national average. Note once again that the hours figures used are paid hours, not worked hours and that working conditions may result in more paid hours than those actually worked.
6.7.5 Train drivers’ average gross weekly pay has fluctuated over the eight years, although overall it has increased by 19% in real terms and from a much higher base level. This can be compared with both the HGV and bus and coach drivers whose pay has increased by 9% and 18% respectively over the same period. Taxi, private hire drivers and chauffeurs’ wages have decreased by 10% in real terms over the same period.
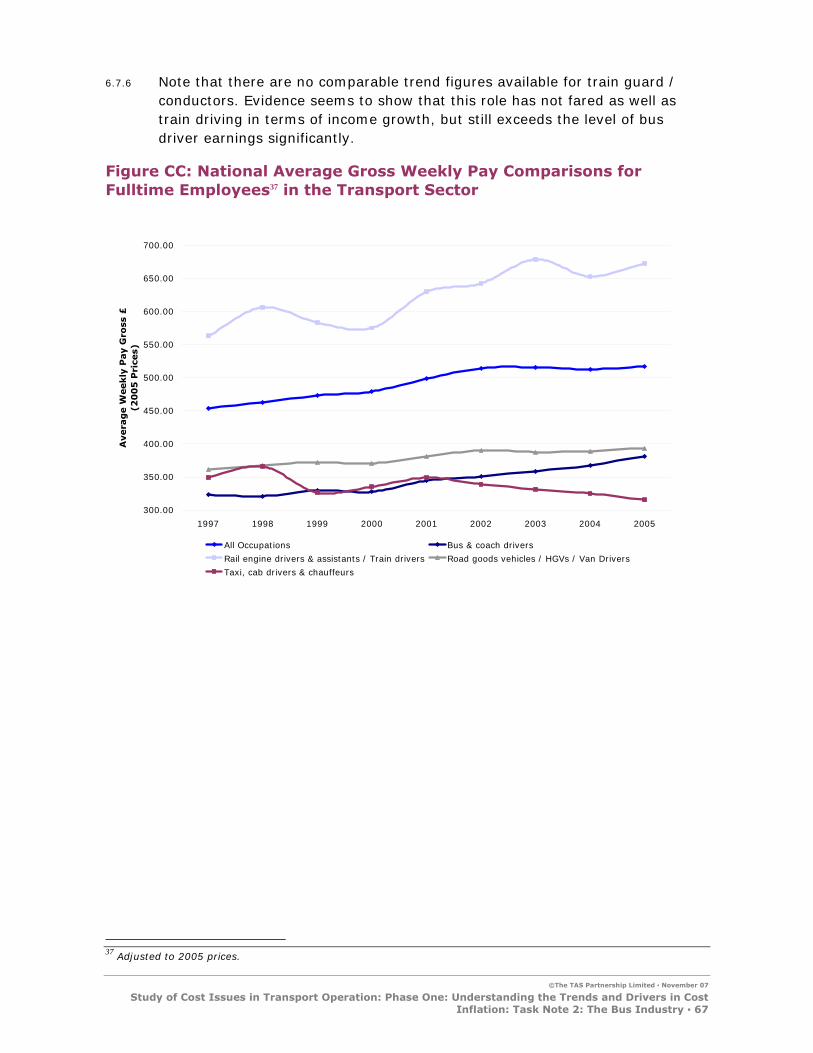
©The TAS Partnership Limited ▪ November 07
Study of Cost Issues in Transport Operation: Phase One: Understanding the Trends and Drivers in Cost Inflation: Task Note 2: The Bus Industry ▪ 67
6.7.6 Note that there are no comparable trend figures available for train guard / conductors. Evidence seems to show that this role has not fared as well as train driving in terms of income growth, but still exceeds the level of bus driver earnings significantly.
Figure CC: National Average Gross Weekly Pay Comparisons for Fulltime Employees37 in the Transport Sector
300.00
350.00
400.00
450.00
500.00
550.00
600.00
650.00
700.00
1997 1998 1999 2000 2001 2002 2003 2004 2005
Avera
ge W
eekly
Pay G
ross
£(2
00
5 P
rice
s)
All Occupations Bus & coach drivers
Rail engine drivers & assistants / Train drivers Road goods vehicles / HGVs / Van Drivers
Taxi, cab drivers & chauffeurs
37 Adjusted to 2005 prices.

©The TAS Partnership Limited ▪ November 07
Study of Cost Issues in Transport Operation: Phase One: Understanding the Trends and Drivers in Cost Inflation: Task Note 2: The Bus Industry ▪ 68
Figure DD: National Average Paid Hours per Week Comparisons
32
35
38
41
44
47
50
1997 1998 1999 2000 2001 2002 2003 2004 2005
Avera
ge P
aid
Ho
urs
Wo
rked
per
Week
Bus & Coach Drivers Rail engine drivers & assistants / Train driversRoad goods vehicles / HGVs / Van Drivers Taxi, cab drivers & chauffeurs
6.8 Comparisons with Other Sectors
6.8.1 Figure EE illustrates the trend in gross hourly pay over ten years for public and private sectors and for those in the transport, manufacturing and construction industries.
6.8.2 Broadly speaking, the five sectors have maintained their differentials and have grown at more or less the same rate, although the gap between public and private sector wages appears to be growing, as private sector wage increases have failed to keep up with those in the public sector.

©The TAS Partnership Limited ▪ November 07
Study of Cost Issues in Transport Operation: Phase One: Understanding the Trends and Drivers in Cost Inflation: Task Note 2: The Bus Industry ▪ 69
Figure EE: Ten Year Wage Trends – Industry Sectors (Outturn Prices)38
6.00
7.00
8.00
9.00
10.00
11.00
12.00
13.00
S
pri
ng 1
994
S
um
mer
1995
W
inte
r 1995/9
6
S
um
mer
1996
W
inte
r 1996/9
7
S
um
mer
1997
W
inte
r 1997/9
8
S
um
mer
1998
W
inte
r 1998/9
9
S
um
mer
1999
W
inte
r 1999/2
000
S
um
mer
2000
W
inte
r 2000/0
1
S
um
mer
2001
W
inte
r 2001/0
2
S
um
mer
2002
W
inte
r 2002/0
3
S
um
mer
2003
W
inte
r 2003/0
4
Sum
mer
2004
W
inte
r 2004/0
5
Sum
mer
2005
W
inte
r 2005/0
6
Avera
ge G
ross
Ho
url
y E
arn
ing
s (O
utt
urn
)
All Public Sector All Private Sector Manufacturing Construction Transport
6.9 Sample Data
6.9.1 Table 12 shows details of average wages per employee for a range of bus companies comparing 1995 with 2004 and 2005 taken from company accounts. These figures include all staff from part time cleaner to director level.
6.9.2 Some of the smaller operators produced abbreviated accounts in 1991 and therefore direct comparisons are not possible. There was also an apparent shift at Horseman Coaches from part time to full time employees, leading to a significant increase in earnings per employee. This has also influenced the combined figures for small operators.
6.9.3 Taking figures for 2005 it is notable how average earnings per employee are about 25% higher for major urban operators, but are equivalent for small and ‘other’ operators. The figures are almost identical at Truronian and East Yorkshire, for example.
6.9.4 The data shown above for regional trends, with London companies seeing much higher than normal increases in pay, is backed up by the percentage increase at Stagecoach Selkent – 77.8% in ten years (the comparison with its sister company in Manchester at 30.6% is marked). The only other operators with above 50% increases are Safeguard and Wilts & Dorset. The lowest
38 Source ONS Labour Force Survey Winter 2005/6.

©The TAS Partnership Limited ▪ November 07
Study of Cost Issues in Transport Operation: Phase One: Understanding the Trends and Drivers in Cost Inflation: Task Note 2: The Bus Industry ▪ 70
increase in earnings over ten years was at Strathtay, with an increase of only 23.8%.
Table 12: Average Pay per Staff Member for Selected Companies
Company Wages / Staff Wages / Staff Wages / Staff % Change
Year 1995 2004 2005 95-05
Arriva Cymru £10,699 £15,023 £15,795 47.6%
East Yorkshire £11,606 £14,513 £14,839 27.9%
First Manchester £13,902 £16,129 £18,883 35.8%
Holmeswood Coaches N/A £13,586 £15,309 N/A
Horseman Coaches £9,649 £18,589 £21,266 120.4%
Lothian Buses £13,744 £20,119 £20,276 47.5%
Nottingham £13,426 £16,895 £18,153 35.2%
Safeguard £11,784 £18,519 £19,222 63.1%
Stagecoach Manchester £14,006 £16,659 £18,294 30.6%
Stagecoach Selkent £15,942 £25,109 £28,347 77.8%
Strathtay £12,433 £14,622 £15,397 23.8%
Truronian N/A £13,933 £14,916 N/A
Whittle N/A £11,766 £14,195 N/A
Wilts & Dorset £12,328 £21,688 £19,365 57.1%
All Operators £13,556 £18,229 £19,588 44.5%
Small Ops £10,160 £14,684 £16,190 59.3%
Other £11,679 £16,728 £16,528 41.5%
Major Urban £14,110 £18,873 £20,692 46.7%
6.9.5 It will be seen that recent trends have reduced the overall gap between bus drivers’ and general wages only slightly – by 2% - since 1997. We have yet to see average earnings in the bus and coach industry reach their 1986 levels in real terms; much less match the improvements that other sectors have seen since 1986. It will be noted that national average weekly earnings have risen by 39.9% in real terms since 1986 – an average of 2.5% per annum.
6.9.6 There are important regional differences – in London there are signs of a catch-up process with general wages, but bus drivers’ wages elsewhere in the country continue to lag seriously behind.
6.9.7 In London, the TGWU’s stated aim is to restore parity between bus and Underground drivers’ wages, as was the case in the 1970s. This appears unlikely in the short term; given that tube drivers’ wages have continued to increase in much the same way as those for London bus drivers. Given the evidence above, it seems unlikely that achievement of that aim would have any ‘ripple’ effect in the rest of the country beyond the London periphery.

©The TAS Partnership Limited ▪ November 07
Study of Cost Issues in Transport Operation: Phase One: Understanding the Trends and Drivers in Cost Inflation: Task Note 2: The Bus Industry ▪ 71
6.9.8 There is a possibility that the introduction of Quality Contract Areas might see repetition of this disparity in other areas, in fact there are arguments why QCs might worsen conditions and wage awards in areas not affected by the QC (see section 8.6).
6.9.9 On the basis of this analysis, it appears that industry labour costs could be projected forward on two separate models to match trends in real-term increases inside and outside London. It seems unlikely that drivers outside London would see wage rises to meet the general average for many years to come (at current rates it will take almost 400 years!). To achieve this would require real-term costs rising by around 4.5% per annum, increasing overall by 55.7% in real terms by 2012.
6.10 Custom and Practice
6.10.1 In addition to revised, lower pay rates introduced at or around the time of deregulation, there were other material changes made to drivers’ working conditions. These often involved eliminating or drastically reducing enhanced payments for overtime, weekend and rest day working, the elimination of paid meal breaks and relaxation of local agreements on shift patterns in terms of shift length and working patterns.
6.10.2 One of the chief changes to drivers’ wages and conditions was the introduction of lower wage rates for minibus drivers and for new starters. The new starter rate in some cases was a long-term status which effectively represented a protection of some conditions for existing staff, a form of ‘grandfather rights’, while steadily introducing the new, less generous, conditions to those entering the company’s service, with a view to eventually having the new conditions as standard.
6.10.3 The companies briefly enjoyed the cost savings resulting from these measures, although reduced pay rates for minibus drivers were often offset in terms of overall wages by the need to operate many more minibuses than the previous number of full size vehicles.
6.10.4 However, the benefits of these cost savings are being steadily eroded due to:
• The trend toward larger minibuses or the elimination of minibus operation with drivers changing to higher rates of pay.
• The need to pay more attractive rates to new starters in order to reduce first year staff turnover rates.
• Union pressure to achieve equality of pay between depots within the same company and between drivers on different pay structures.
6.10.5 In addition, there has been a continuing policy across all of the major groups to reduce the number of depot facilities. Set against the reductions in

©The TAS Partnership Limited ▪ November 07
Study of Cost Issues in Transport Operation: Phase One: Understanding the Trends and Drivers in Cost Inflation: Task Note 2: The Bus Industry ▪ 72
overhead costs, this has led to an increase in operational costs due to extra light mileage, the need to upgrade ‘small depot’ rates of pay to ‘large depot’ rates and the need to reach agreements on paid travelling time allowances for staff transferring to other depots.
6.10.6 There are also issues of inefficient vehicle workings, awkward driver scheduling, lack of supervision of remote services and the need to provide vans or other transport for drivers. In worst case scenarios, services linking the surviving depot with the town where the depot is closing may be increased in frequency (with all the implications for resource cost) purely for operational convenience. Integration of work carried out by two depots requires planning and scheduling expertise to maximise efficiency – but this expertise has been lost in many cases as a result of reductions in ‘overheads’, with depot staff expected to do their own planning and crew scheduling in addition to all the other day-to-day tasks.
6.10.7 A further effect of depot closures is increased staff turnover. In addition to potential redundancy costs, there will be some staff unwilling to transfer and a high proportion of those who do initially transfer will leave in the first few months after the transfer. This adds further recruitment and training costs. Those staff who leave the company may well be long-serving staff members and they are replaced by newly recruited staff. As it has been shown that staff turnover is highest amongst first year employees, there is likely to be a strand of ongoing and recruitment cost associated with any depot closure.
6.10.8 Within the larger groups the effect of depot closures upon the operating subsidiaries can be worsened by the fact that although the operating company suffers the additional costs associated with depot closures, proceeds from property sales are likely to be absorbed by the group’s property division.
6.11 The Workforce
6.11.1 There are around 225,000 bus, coach and tram drivers in the UK39. The five major groups employ 80% of these. The bus driving workforce is ageing – the average age of bus drivers in 2005 was 45.4 years, and the proportion of those aged 55 and over is around 23%. Of more concern to the industry is the reduction in the proportion of bus drivers aged 34 and under – from 23% in 2001 to 18% in 2005.
6.11.2 Bus driving is still a predominantly white male profession – only 17% of drivers are female and only 12% are from ethnic minorities. The latter masks significant variations between areas so those areas with very high concentrations of drivers from ethnic minorities balance a very low proportion generally. The inflexibility of traditional shift patterns is cited as one of the main reasons behind the failure to attract more women to the industry.
39 Labour force survey 2005.

©The TAS Partnership Limited ▪ November 07
Study of Cost Issues in Transport Operation: Phase One: Understanding the Trends and Drivers in Cost Inflation: Task Note 2: The Bus Industry ▪ 73
6.12 Barriers to Employment
6.12.1 There are many barriers to employment for prospective bus drivers, including a long training lead in time. The lead in time for recruits to the industry deters applicants causing significant problems for operators. Recruiting difficulties have resulted in the use of Eastern European staff due to the reluctance of local people to join the industry40.
6.12.2 Legal and other age restrictions on bus drivers have implications for staff recruitment. Bus drivers aged 18 can legally drive the following:
• Any national work on minibuses with 16 or fewer seats.
• Any local bus service which falls outside of the scope of EU drivers’ hours (less than 50km).
6.12.3 Other driving can only be performed by drivers aged 21 or over. Many operators restrict drivers to a minimum age of 21 due to the restrictions placed on the work that they can carry out. Further age restrictions are often imposed by the company’s insurers, limiting the lower age for driving to 25 years41.
6.12.4 These legal and self-imposed restrictions mean that bus driving cannot be a first choice of career for school leavers. Almost of necessity recruits to bus driving do so as a change of career unless they are out of work prior to starting. Unlike any other change of career there is a high degree of uncertainty surrounding the move to bus driving in that there is no certainty that the new recruit will pass their PCV test at the end of the training period. There is therefore a lack of confidence in continued secure employment in the initial stages. Potential drivers must also satisfy medical standards laid down by statute and additional criteria specified by the DVLA.
6.12.5 Company approaches to the costs of training vary. In some cases drivers must fund the cost of their own medical examination and there are often caveats in employment agreements that training costs may be recharged to drivers if they leave company service within a set period.
6.12.6 Training now usually includes many aspects outside the operational side of bus driving, covering customer care, disability awareness and other factors, which adds to the length of training. It is stated that it now costs £6,000 to train a bus driver42.
40 An example of this relating to Preston Bus was reported in the Lancashire Evening Post 6/7/2006. 41 Information supplied by GoSkills 42 http://www.durhamlabour.org.uk/martlew/transcomm060621.htm
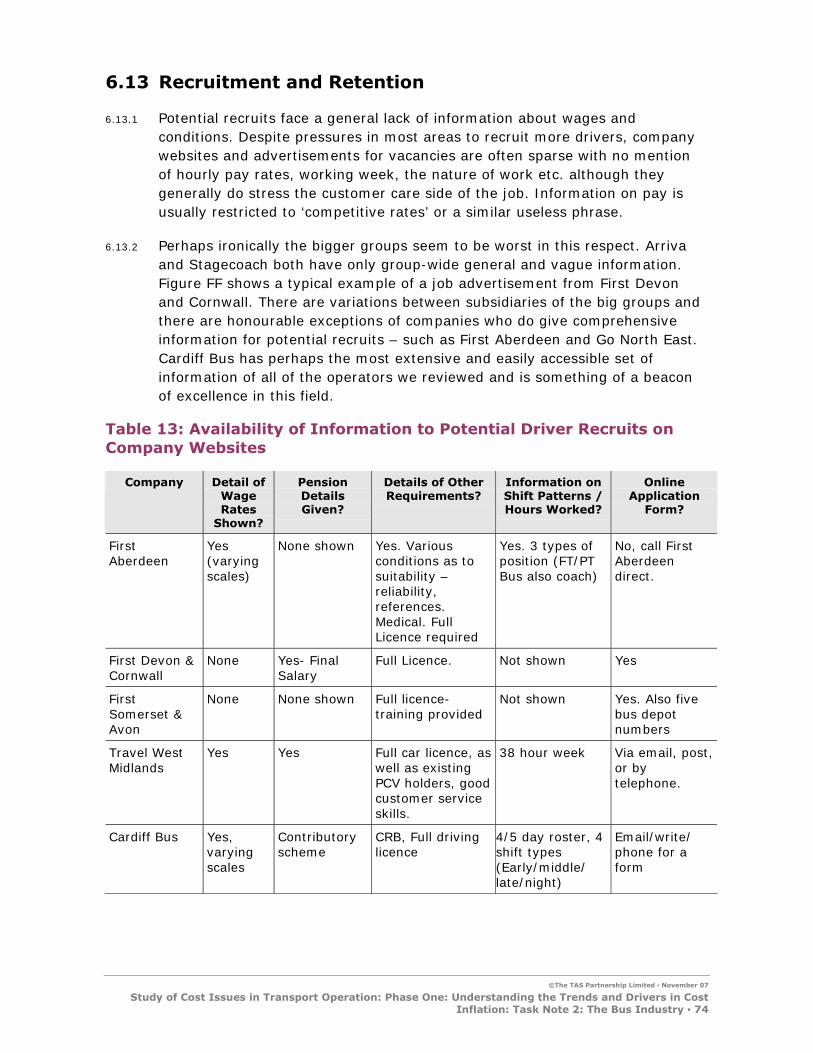
©The TAS Partnership Limited ▪ November 07
Study of Cost Issues in Transport Operation: Phase One: Understanding the Trends and Drivers in Cost Inflation: Task Note 2: The Bus Industry ▪ 74
6.13 Recruitment and Retention
6.13.1 Potential recruits face a general lack of information about wages and conditions. Despite pressures in most areas to recruit more drivers, company websites and advertisements for vacancies are often sparse with no mention of hourly pay rates, working week, the nature of work etc. although they generally do stress the customer care side of the job. Information on pay is usually restricted to ‘competitive rates’ or a similar useless phrase.
6.13.2 Perhaps ironically the bigger groups seem to be worst in this respect. Arriva and Stagecoach both have only group-wide general and vague information. Figure FF shows a typical example of a job advertisement from First Devon and Cornwall. There are variations between subsidiaries of the big groups and there are honourable exceptions of companies who do give comprehensive information for potential recruits – such as First Aberdeen and Go North East. Cardiff Bus has perhaps the most extensive and easily accessible set of information of all of the operators we reviewed and is something of a beacon of excellence in this field.
Table 13: Availability of Information to Potential Driver Recruits on Company Websites
Company Detail of Wage Rates
Shown?
Pension Details Given?
Details of Other Requirements?
Information on Shift Patterns / Hours Worked?
Online Application
Form?
First Aberdeen
Yes (varying scales)
None shown Yes. Various conditions as to suitability – reliability, references. Medical. Full Licence required
Yes. 3 types of position (FT/PT Bus also coach)
No, call First Aberdeen direct.
First Devon & Cornwall
None Yes- Final Salary
Full Licence. Not shown Yes
First Somerset & Avon
None None shown Full licence-training provided
Not shown Yes. Also five bus depot numbers
Travel West Midlands
Yes Yes Full car licence, as well as existing PCV holders, good customer service skills.
38 hour week Via email, post, or by telephone.
Cardiff Bus Yes, varying scales
Contributory scheme
CRB, Full driving licence
4/5 day roster, 4 shift types (Early/middle/ late/night)
Email/write/ phone for a form

©The TAS Partnership Limited ▪ November 07
Study of Cost Issues in Transport Operation: Phase One: Understanding the Trends and Drivers in Cost Inflation: Task Note 2: The Bus Industry ▪ 75
Company Detail of Wage Rates
Shown?
Pension Details Given?
Details of Other Requirements?
Information on Shift Patterns / Hours Worked?
Online Application
Form?
Go North East Yes. Varies according to depot.
Contributory pension scheme
Basic level of arithmetic, understanding of highway code,
39 per week Downloadable from Website. Alternatively telephone central recruitment office.
Solent Blue Line
None Not shown Smart appearance, good driving skills, good communication skills
Not shown Yes, also a central phone line
Western Greyhound
Yes, but only the maximum figure
Not shown CRB, PCV licence, good references
Yes, 4/5 day week mostly Mon-Sat shifts, optional days for part timers.
No – applicants must call a telephone number.
Stagecoach (General)
Not shown
Not shown A pleasant disposition, enjoyment of driving and enjoyment of serving the public
No Yes
Lothian Buses £22,000 p/a
Contributory scheme
Aged 19+, 2yrs experience, good customer service skills, good employment record
Average of 45 hours per week
Yes, also phone and postal address.
London Central / General
£470 per week full and part time.
Contributory scheme
1 years driving experience, over 20 years of age, good level of numeracy
Option of full and part time
Via telephone and email.
Travel London Not shown
Contributory scheme
Full driving licence
no Telephone only
Zak’s Buses (Birmingham)
Not shown
No Not shown no Telephone only
Countryliner/ RDH
Not shown
Not shown PCV licence, good, reliable people. References
Not shown No, email, write or phone detailing experience
Arriva (general)
Not shown
yes Full car licence Not shown Online contact form

©The TAS Partnership Limited ▪ November 07
Study of Cost Issues in Transport Operation: Phase One: Understanding the Trends and Drivers in Cost Inflation: Task Note 2: The Bus Industry ▪ 76
Figure FF: First Devon and Cornwall Driver Recruitment Advertisement43
Jobs @ First
Position: Drivers Area: Devon and Cornwall
'The relationship between the bus driver and customer is vital to the enjoyment and safety of the journey' 'The bus driver is the unsung hero of the commumnity' 'People depend on the buses and the men and women who drive them so safely; they provide a uniquelyimportant service' Do you believe in the statements above? If you do we would love to speak to you about joining us. We'll help you all the way, with paid training, advice, support and a comprehensive benefits package, of competitive rates of pay, free UK-wide travel for you and your family, a final pension salary scheme, paid holiday and ongoing training such as NVQs if you wish. We'll train you to get your Passenger vehicle license so long as you have a current, clean driving license so in a few weeks you could be making those statements true for you. Simply complete the online details and send them to us.
6.14 Other Issues
6.14.1 Away from the core set of employees driving buses, there are issues surrounding the recruitment and retention of engineering staff. As modern vehicles become increasingly technologically sophisticated, a higher level of technical expertise is required for those carrying out maintenance.
6.14.2 There was a significant reduction in the number of engineering staff in the post deregulation / privatisation period. The principal reason for this was closure of central works facilities, but depot closures and consolidations also played a part. Many companies adopted a policy of contracting out heavy maintenance, overhauls and repaints and there were some purchase and maintenance agreements between operators and manufacturers.
6.14.3 As operators attempt to maximise the use of their resources, a higher proportion of vehicles is used all day as a result of the reduction in the number of peak only vehicles. Even where peak only buses remain, these are often vehicles dedicated to school work – possibly older vehicles which cannot readily substitute for modern low floor buses on all day service. The engineers therefore increasingly must carry out their work in the evenings or overnight, adding an increased bias toward unsocial hours. Members of the expert panel
43 Source: First Website

©The TAS Partnership Limited ▪ November 07
Study of Cost Issues in Transport Operation: Phase One: Understanding the Trends and Drivers in Cost Inflation: Task Note 2: The Bus Industry ▪ 77
report increases in engineering wages ahead of other grades but we have no empirical evidence to support this.
6.14.4 A session of the Scottish Parliamentary Transport Committee44 looked into staff recruitment and retention issues, among other issues, in 2003. The two largest Scottish operators, First Glasgow and Lothian Buses, were experiencing some difficulty in recruiting and retaining drivers. This was not considered to be because of inadequate rates of pay. The main problem was retention of staff rather than recruitment with staff turnover of the order of 20-30% per year at the time.
6.14.5 This stemmed from the unattractiveness of shift working, concerns over personal safety because of assaults on drivers and the frustration of coping with ever increasing traffic congestion which can lead to uncertainty as to when drivers were going to be able to complete their shifts. First Glasgow had experimented with better pay rates for new starters and providing opportunities for longer shifts with enhanced earning opportunities.
6.14.6 Both operators felt that the seniority system whereby shifts were allocated in order of driver seniority also led to problems of retention because newer drivers were left with unpopular shifts. Other operators expressed no difficulty over staffing except Stagecoach in the Dunfermline area paradoxically because of the attractive wage rates available at Lothian Buses.
6.14.7 None of the operators interviewed expressed any difficulty over recruitment of other types of staff such as maintenance and clerical staff. Strathtay had a limited amount of crew operation using conductors. Despite lower wage rates for conductors and crew drivers, the company experienced no difficulty in recruiting sufficient staff.
6.14.8 GoSkills45 reports that in addition to low pay, passenger behaviour and unsocial hours, the low status of bus drivers is also a key issue in recruitment and retention. A Scottish Executive investigation in 2005 into anti-social behaviour on and around buses found that around 51% of those surveyed felt anti-social behaviour was one of the main problems in terms of doing their job, with anti-social behaviour at bus stops noted by 15% of drivers. This has a negative effect upon recruitment.
6.14.9 When drivers were asked how they perceived any changes in the level of anti-social behaviour over the last five years the Scottish Executive study found that 65% of bus drivers perceived the number of instances had increased substantially. According to the HSE, anti-social behaviour results in lost time and production through staff absence. Anti-social behaviour can also discourage potential passengers from travelling by bus thus having a negative impact on revenues.
44 http://www.scotland.gov.uk/Publications/2003/12/18622/29905 45 Skills Needs Assessment – Bus and Coach Industries, 2005

©The TAS Partnership Limited ▪ November 07
Study of Cost Issues in Transport Operation: Phase One: Understanding the Trends and Drivers in Cost Inflation: Task Note 2: The Bus Industry ▪ 78
6.14.10 A further disincentive to adopting bus driving as a career is a lack of career progression opportunities. In many companies there is a natural career progression among drivers from starting on minibus work through to big bus work (usually on higher rates of pay) and possibly on to dedicated rotas on high profile services. However beyond this career progression opportunities are limited. The traditional promotion track to become inspectors, supervisors or depot detailers now usually means a transfer to a low salary with less earning potential than driving, if such posts exist.
6.14.11 The gulf between driving or day-to-day supervisory roles and depot management is now a huge one as depot managers usually have as much if not more of a role in human resources, accountancy (preparing depot budgets etc.) and liaison with local authorities as in day-to-day operational responsibilities. Some groups or companies do, however, have management training programmes which are geared to training suitable existing employees in addition to the traditional graduate training schemes.
6.15 Trends in Service Provision
6.15.1 Commercial operators are under increasing cost pressures which will lead to above-inflation fare rises, service frequency reductions and withdrawal of marginal services where the market for bus travel is not growing significantly. These actions all have a negative impact on bus patronage.
6.15.2 There is some evidence that above-inflation fare increases are becoming self-defeating (see section 15). Not only does the patronage base decrease due to resistance to the fares increases, but over time the actual revenue base improves little leading to service reductions as costs rise.
6.15.3 There have been year-on-year reductions in supported services, particularly in shire areas, as budgets are squeezed. In many areas evening and Sunday services have been severely reduced as a result of local authorities prioritising secured services – but these evening services are often relatively inexpensive contracts undertaken at marginal cost. As a result the remaining contracts are more resource-intensive and thus measures of average cost per mile for secured services increase accordingly.
6.15.4 It is difficult to measure the effect that withdrawal of evening services can have upon the commercial daytime operation, but there is an obvious effect that a passenger who makes an outward daytime journey and returns in the evening can no longer make his or her current journey if there is no evening service and will either make alternative arrangements or simply not bother.
6.15.5 Extra problems for some local authorities have come around following the introduction of challenge-funded services. Where these have not become commercial after the challenge-funded period, local authorities are under pressure to continue to support their operation, but by their nature these

©The TAS Partnership Limited ▪ November 07
Study of Cost Issues in Transport Operation: Phase One: Understanding the Trends and Drivers in Cost Inflation: Task Note 2: The Bus Industry ▪ 79
services tend to be expensive in resources and low in passenger numbers and thus add significantly to costs.
6.15.6 Even where patronage increases are being achieved, cost pressures are absorbing the revenue growth making it difficult for operators to improve services for further growth without external assistance. Growing traffic congestion is also causing additional costs due to the need to schedule additional vehicles to maintain frequencies where peak hour operating speeds are falling, or alternatively by reducing the number of peak journeys in order to maintain an achievable timetable within the same resources. Some examples in the change in operating hours and speeds over the last fifteen years are detailed below in Table 14.
6.15.7 In Table 14 ‘running speeds’ represent the timetabled running time; ‘operating speeds’ represent the timetabled running time plus the (assumed) layover time and thus includes any additional recovery time that has been built into the schedule. Nine services were investigated with a view to comparing bus service operating speeds in 1991 and in 2006. Table 14 summarises the data. Overall, timetabled running speeds and service operating speeds have reduced over the fifteen years. Timetabled bus hours per day have reduced slightly over fifteen years, with a small number of exceptions.
6.15.8 Two exceptions have grown the number of bus hours. Travel West Midlands service 37 between Birmingham and Solihull has seen a significant increase with bus hours of 209 in 2006 and 147 in 1991. As the service is now registered as a frequent service there are no figures for operating speeds as layover times cannot be calculated. The second example is Solent Blue Line Service 47 between Winchester and Southampton which has seen an increase in bus hours from 40 in 1991 to 102 in 2006. Both of these examples illustrate an industry trend to devote more resources to core services.


©The TAS Partnership Limited ▪ November 07
Study of Cost Issues in Transport Operation: Phase One: Understanding the Trends and Drivers in Cost Inflation: Task Note 2: The Bus Industry ▪ 81
Table 14: Sample of Comparative Bus Service Operating Speeds
Timetabled Running
Speed (kph)
Operating Speed (kph including
layover time)
Timetabled Bus Hours per day (Mon-Fri)
Service Operator
Route and Area Type Time Period46
1991 2006
% Change
1991 2006
% Change
1991 2006
% Change
Peak 21.6 19.3 -10.6% 17.7 16.4 -7.3% 1, 2 First Potteries
Hanley – Longton
(Urban) Inter-Peak 21.6 21.6 - 17.7 16.4 -7.3%
150.0 130.5 -13%
Peak 21.3 19.5 -8.8% 19.2 19.2 - 1, 2 First Devon & Cornwall
Plymouth – Saltash
(Urban) Inter-Peak 21.3 19.5 -8.8% 18.0 18.0 -
126.25 111.75 -11%
Peak 22.3 18.6 -16.7% 37 Travel West Midlands
Birmingham – Solihull
(Urban) Inter-Peak 22.3 19.8 -11.1%
?47 146.5 209.0 43%
Peak 16.448 15.2 -7.7% 13.248 12.1 -8.3% 58 Nottingham Transport
Arnold – Nottingham
(Urban) Inter-Peak 16.948 16.2 -3.9% 13.548 12.8 -5.2%
112.75 92.5 -18%
Peak 22.3 18.3 -17.8% 18.3 17.4 -4.9% 2 First Essex Southend – Basildon
(Inter Urban) Inter-Peak 22.3 20.3 -9.0% 18.3 17.9 -2.2%
69.75 65.75 -6%
Peak 29.7 23.7 -20.0% 26.0 21.4 -18.0% 5 Southern Vectis
East Cowes – Newport
(Inter Urban) Inter-Peak 29.7 26.7 -10.0% 26.0 23.7 -8.9%
51.0 52.0 -2%
Peak 31.3 29.6 -5.4% 29.7 26.6 -10.4% 22, 2349 First Potteries
Chester – Meols/West Kirby
(Inter Urban) Inter-Peak 31.3 29.6 -5.4% 29.7 27.3 -8.1%
43.0 41.25 -4%
Peak 13.3 12.6 -4.8% 10.6 10.2 -3.8% 4750 Solent Blue Line
Winchester – Southampton
(Inter Urban) Inter-Peak 13.3 13.3 - 11.1 11.1 -
40.0 102.0 155%
46 ‘Peak’ speeds are calculated using the maximum journey time, ‘Inter-Peak’ speeds are calculated using journey time 47 Frequent service. Therefore unable to accurately identify ‘lay-over’ time 48 1989 journey times used 49 Now operated by Arriva numbered 421, 422. All Journeys now terminate at West Kirby 50 Now Numbered ‘bluestar’ 1

©The TAS Partnership Limited ▪ November 07
Study of Cost Issues in Transport Operation: Phase One: Understanding the Trends and Drivers in Cost Inflation: Task Note 2: The Bus Industry ▪ 82
Timetabled Running
Speed (kph)
Operating Speed (kph including
layover time)
Timetabled Bus Hours per day (Mon-Fri)
Service Operator
Route and Area Type Time Period46
1991 2006
% Change
1991 2006
% Change
1991 2006
% Change
Peak 18.451 17.3 -6.4% 17.651 17.0 -3.2% 213 Arriva Durham County
Darlington – Sunderland
(Inter Urban) Inter-Peak 18.451 17.7 -4.0% 17.651 17.6 -
65.0 58.0 -
51 1990 Journey times used

©The TAS Partnership Limited ▪ November 07
Study of Cost Issues in Transport Operation: Phase One: Understanding the Trends and Drivers in Cost Inflation: Task Note 2: The Bus Industry ▪ 83
6.16 Depot and Crew Change Locations
6.16.1 In both the bus and rail industries there are many examples of arrangements which require vehicles, crews or both to be positioned to work on a particular service. This may be because a depot facility is remote from the actual service operated or because crew facilities are not on the line of route. In each case, the level of increasingly expensive labour resource, fuel required or even peak vehicle requirement will be greater than if depot and crew facilities were along the line of route.
6.16.2 In some cases additional vehicles are required to enable crews to be ‘ferried’ between an appropriate point on the route and their facilities. These vehicles may take the form of taxis, vans or life-expired minibuses but nevertheless require drivers and fuel. Staff travelling time also has to be paid for.
6.16.3 There are also cases where services are operated from remote locations due to problems with staff recruitment and retention at a more appropriate location. Similarly, the location of depot facilities may be remote from the route due to specific requirements for the fleet used on a given service.
6.16.4 Examples of this would be where a fleet of vehicles is shared between several unconnected services but maintained at a purpose-built facility, maybe as part of a maintenance contract arrangement, or where replacement vehicles are too large for a previous facility, such as articulated buses replacing the previous Routemaster type fleet in London.
6.16.5 Franchising of services or tender bids can also lead to operation from remote locations where services are operated in areas without depot facilities. The London bus tendering system is a clear example of this. Bidders will tender for services which they feel they can reasonably operate from their existing bases. This has led to a number of cases where the winning bid is based on remote operation. But this is not limited to the London situation – in the deregulated world outside London there have been many such cases. East Midlands’ forays into tendered services in Essex and Manchester are well known as is the winning of services on the Scottish Islands by Essbee Coaches of Coatbridge. Notably, neither of these was successful in the long term.
6.16.6 Depot closures, intended to achieve overall economies, can lead to operation of services from remaining depots at remote locations. Rationalisation of depot locations has an effect on recruitment as the catchment area for potential staff becomes more restricted. It is also possible that some depots have been closed to realise a valuable asset and give a business a short-term gain. As labour and fuel costs rise disproportionately to other costs, the benefits can soon be outweighed by the additional on-going costs.
©The TAS Partnership Limited ▪ November 07
Study of Cost Issues in Transport Operation: Phase One: Understanding the Trends and Drivers in Cost Inflation: Task Note 2: The Bus Industry ▪ 84
6.16.7 In other cases, operators have closed canteens or crew relief facilities remote from the company’s operating depots. This has added ongoing cost in terms of crew transfers to and from depots.
6.16.8 It is important that operators do not lose sight of inefficiencies in their operations. Schedule efficiency is typically calculated by comparing the paid hours with the operating hours. The operating hours typically include positioning journeys for vehicles and crews and sometimes crew ‘ferry’ journeys.
6.16.9 It is better and more realistic, to compare paid hours to ‘live’ operating hours and to similarly look at the proportion of ‘live’ miles to total miles, including ‘light’ and ‘ferrying’ journeys, even if the ‘ferry’ journey is by another mode, for example, in a taxi.
6.17 Opportunities for Cost Control
6.17.1 There are, therefore, opportunities for the industry as a whole to review its practices with particular focus on those areas where costs are rising most rapidly:
• Labour Costs.
• Fuel Costs.
6.17.2 Control of positioning journeys for vehicles and crews could result in significant savings in both labour and fuel. This could be achieved in a number of ways:
• Interworking of vehicles between services passing depot facilities and those operating remote from depots, taking care to ensure reliability is maintained.
• Establishing stabling points (outstations) at remote locations with minimal facilities and creating vehicle cycles to return vehicles to their main base on, say, alternate days.
• Relocating depots to more suitable locations to reflect current and likely future needs rather than historic requirements.
• Ensuring that crew start and finish points are common to vehicle start and finish points and that crews both start and finish at points which do not incur payable time travelling from or to base.
6.17.3 Interworking of services does not occur in London as for the most part each service is let as a separate contract, but there are cases where an improved service could be provided at the current cost level if this was permitted. We have concerns that, under a Quality Contract scenario, that this area of inefficiency might expand.

©The TAS Partnership Limited ▪ November 07
Study of Cost Issues in Transport Operation: Phase One: Understanding the Trends and Drivers in Cost Inflation: Task Note 2: The Bus Industry ▪ 85
6.18 Tender Preparation Costs
6.18.1 It is difficult to quantify the costs of tender preparation and bidding for bus companies. Although bid costs are very high for the rail industry, tender bids by bus companies for local authority contracts are generally simple although many separate contracts for small numbers of journeys can occupy significant amounts of management time. For most major companies secured services make up only a small fraction of work. The time and resources committed to tendering can vary dependent upon the local authority’s tendering procedure and the length of time for which contracts are awarded. It is doubtful, however, whether even many of the companies could quantify the cost of tender bid preparation.
6.18.2 Smaller companies are likely to devote proportionally more time to contract bids. Many survive on a base of tendered services and the annual round of bidding for school contracts will be of paramount importance. The only area where the cost of bid preparation is likely to be significant for larger operators is in London where franchise-style contracts involve significant resources.
6.18.3 The major costs associated with tendered bus services lie in their implementation after the award of contracts. There are costs associated with registration and publicity (for new, changed and lost contracts), arranging compliance with contract conditions (vehicle type, special ticketing etc) and making changes to operational arrangements. For operators covering several local authority areas this is likely to be disproportionately greater.
6.19 Public Support for Buses
6.19.1 The level of public support for buses (excluding concessions) since 1994 is illustrated in Figure GG (showing all areas) and Figure HH (excluding London) indexed to 100 at 1994 and adjusted to current prices. The London figures refer to the cost of contracts to operate TfL services net of revenue taken and while these obviously far exceed the levels of public support in other areas in amounts of cash, indexing all sums to 100 in 1994 shows clearly the level of proportionate change in public support.
6.19.2 Figure GG shows that the huge growth in the degree of additional support for London services is predominant with support increasing tenfold between 1994/95 and 2003/4. However, Figure HH also shows moves in other areas, with significant increases in support in Wales and Scotland reflecting devolved governments favouring public transport in preference to spending on other areas. Support in the English PTE areas increased by around 15% however in ‘other’ English areas support remains little changed since 1994. This illustrates the restraints on supported services budgets generally and, given that there have been many commercial deregistrations in the period, reflects the reduction or loss of many supported services.

©The TAS Partnership Limited ▪ November 07
Study of Cost Issues in Transport Operation: Phase One: Understanding the Trends and Drivers in Cost Inflation: Task Note 2: The Bus Industry ▪ 86
Figure GG: Trend in the Level of Public Support for Buses since 1994 (All Areas)
0
200
400
600
800
1,000
1,200
1994
/95
1995
/96
1996
/97
1997
/98
1998
/99
1999
/00
2000
/01
2001
/02
2002
/03
2003
/04
2004
/05
Level
of
Su
pp
ort
(1
99
4=
10
0)
London English metropolitan areas English other areas Scotland Wales
Figure HH: Trend in the Level of Public Support for Buses since 1994 (outside London)
0
50
100
150
200
250
1994
/95
1995
/96
1996
/97
1997
/98
1998
/99
1999
/00
2000
/01
2001
/02
2002
/03
2003
/04
2004
/05
Level of
Su
pp
ort
(1
99
4=
10
0)
English metropolitan areas English other areas Scotland Wales

©The TAS Partnership Limited ▪ November 07
Study of Cost Issues in Transport Operation: Phase One: Understanding the Trends and Drivers in Cost Inflation: Task Note 2: The Bus Industry ▪ 87
Effect of Pension Issues and Additional Social Legislation in Labour Intensive Industries
7
CfIT Question 13: In labour intensive industries what is the effect of pension's issues and additional social legislation?
Pension costs can be up to 20% on top of headline wages. In industries such as rail, currently with final salary pensions, wage inflation automatically inflates the funding needed to pay for ‘past service’; what are the implications of this?
Social legislation, such as the working time directive, EU rail drivers’ hours, or NI 1% Surcharge, may bear down most heavily on labour intensive industries. Have the implications of these factors on costs been considered?
Wages rise faster than general inflation over the long term and transport operation costs have a high labour element and relatively low scope for automation or outsourcing to lower cost countries.
7.1 Pensions
7.1.1 There has been great concern in recent years about the potential ‘pension crisis’ in general. There have been several related factors that have contributed to this concern and these have included:
• The increase in life expectancy.
• The increase in persons receiving pensions compared to the number employed.
• A trend toward early retirement.
• The reduction in returns from the stock and bond markets, where pension funds are invested.
• ‘Raids’ on pension funds when the financial climate was more favourable.
7.1.2 All of these factors have been major contributors to the problem of maintaining pension benefits and payments at an acceptable level for members and employers.
7.1.3 Traditionally employers have offered what it known as a ‘final salary’ pension plan. In one of these plans the person who retires obtains a percentage of their salary as it was when they retired. These types of pension plans have been very attractive and have often been a factor in employee retention, as long serving employees know that they will have a pension with a guaranteed

©The TAS Partnership Limited ▪ November 07
Study of Cost Issues in Transport Operation: Phase One: Understanding the Trends and Drivers in Cost Inflation: Task Note 2: The Bus Industry ▪ 88
monthly income upon retiring and that the level of pension would increase in line with salaries until retirement date.
7.1.4 However, many employers have found that the final salary pension plans have been unsustainable due to the factors cited above. As a result most private sector employers have now changed to what is called a ‘money purchase’ pension plan. In these plans the final payout is determined by the amount of money put into the scheme by the employee and the employer, as well as the consequent returns on the money invested over the years. If the pension fund performs well this may result in a good pension, but if it performs poorly then the resulting pension may be small and the retiree may then be left to be largely dependent upon the state pension and its supplements for their basis needs.
7.1.5 Employees can choose to bolster their share of the pension pot by making Additional Voluntary Contributions (AVCs). The maximum level of AVCs is set by pension legislation and varies proportionately with age. Some companies also offer additional company contributions to match or partially match AVCs on a voluntary basis.
7.1.6 Most bus operating companies have both final salary and money purchase schemes that they contribute to. As a rule employees who have been with the company for more than ten years normally would have a final salary pension plan, while employees who have started more recently have a money purchase (or defined contribution) scheme. However, there are some exceptions to this and some bus operating companies still have a final salary scheme open to new entrants.
7.1.7 A condition of some of the sales of former local authority undertakings has been provision for existing employees to remain within the more generous Local Government Pension Scheme (this applies, for example to both First Manchester and Stagecoach Manchester). An added complication arises if all or part of the bus operating company was at one time owned by the public sector. In these situations the employees who were with the company would likely be members of a public sector pension scheme, where the benefits are particularly good. Former public sector companies that have been acquired pass their pension obligations on to their successors.
7.1.8 The impact of the current crisis over pensions is partly reflected in the financial results of the largest bus operating groups. First, for example, reported that their pension deficit (for final salary pension obligations) reduced from £132 million to £89 million during the 2005-6 financial year. This reduction was largely related to increased cash contributions being paid into the UK Bus schemes, the continuing recovery of the stock market and UK Bus pay deals in many operating companies that cap pensionable pay going forward and therefore reduces the Group’s exposure to volatility in pension costs.
©The TAS Partnership Limited ▪ November 07
Study of Cost Issues in Transport Operation: Phase One: Understanding the Trends and Drivers in Cost Inflation: Task Note 2: The Bus Industry ▪ 89
7.1.9 Stagecoach had increased pension obligations of £1.3m during 2005/6, but this was largely due to the acquisition of companies acquired during the year. Excluding the impact of these acquisitions, the retirement benefit obligations fell by £20.2m during the year.
7.1.10 Arriva similarly increased the contributions of members and company starting in 2003 in order to eliminate a projected deficit in its pension fund that was predicted as far back as 2002. Its pension fund is currently underfunded by 49%, partly for historical reasons. It made the unusual step in 2006 of agreeing to extend and reopen its final salary pension scheme for employees.
7.1.11 The impact of the retention of final salary pension plans and liabilities has influenced potential bus industry takeovers. For example, pensions were a major issue in the sale of Yellow Buses from Bournemouth Council to Transdev. Pensions are also an issue in the sale process of Chester City Transport.
7.1.12 As a rule for larger groups which have mainly transferred to money purchase schemes pension cost are around 10% additional to salaries, a figure that was reported in the most recent Stagecoach Manchester accounts. However, for operators having a higher exposure to final salary plans this could be 20% or higher.
7.1.13 The major groups’ statement of the status of their pension schemes varies, although all are now reporting improved returns from their pension investments. All make a point of not investing pension fund capital in the parent company. It is notable that some companies have used proceeds of sales to bolster pension funds (notably around a third of the proceeds from the sale of Stagecoach’s London operations were used in this way).
7.1.14 2003 was the crisis year for pension fund investments. Since then, remedial measures such as increased contributions and stock market recovery has seen an improvement in the situation. There may indeed be a period of stability in pensions, although pressure on those companies retaining final salary schemes is likely to continue. Government proposals to progressively raise retirement age will also help in that it provides for a longer working life where contributions are made and a shorter period of benefit payment.
7.1.15 An example of the fluctuation in pension fund valuation is given for the TfL Pension Fund in Table 15 below, which illustrates the recent recovery of stock market performance. Table 16 below details pension contributions per employee and as a percentage of wages for a sample of companies in 1995 and 2005. Other than those small companies which only pay pensions contributions to directors, there is a general pattern of contributions doubling between 1995 and 2005 and a significant increase in the proportion of pension to wages. Of the major group companies, Arriva Cymru stands out as having the lowest increase in pension contributions and a reduction in pension as a proportion of wages.

©The TAS Partnership Limited ▪ November 07
Study of Cost Issues in Transport Operation: Phase One: Understanding the Trends and Drivers in Cost Inflation: Task Note 2: The Bus Industry ▪ 90
Table 15: Variation in the Value of TfL Pension Fund
Year End
Fund Value
2001 £3,389.2m
2002 £3,285.7m
2003 £2,664.7m
2004 £3,156.4m
2005 £3,516.3m
Table 16: Pension Contributions per Employee 1995 / 2005
Company Pensions / Staff
Pension as % Wages
Pensions / Staff
Pension as % Wages
Year 1995 1995 2005 2005
Arriva Cymru £345 3.2% £472 3.0%
East Yorkshire £546 4.7% £1,680 11.3%
First Manchester £590 4.2% £1,658 8.8%
Holmeswood Coaches52 #N/A #N/A £86 0.6%
Horseman Coaches52 £42 0.4% £31 0.1%
Lothian Buses £401 2.9% £1,692 8.3%
Nottingham £834 6.2% £1,844 10.2%
Safeguard52 £412 3.5% £167 0.9%
Stagecoach Manchester £905 6.5% £1,314 7.2%
Stagecoach Selkent £1,203 7.5% £1,682 5.9%
Strathtay £567 4.6% £1,440 9.4%
Truronian52 #N/A #N/A £98 0.7%
Whittle #N/A #N/A £354 2.5%
Wilts & Dorset £905 7.3% £1,127 5.8%
All Operators £700 5.2% £1,464 7.5%
Small Ops £131 1.3% £135 0.8%
Other £598 5.1% £1,174 7.1%
Major Urban £740 5.2% £1,630 7.9%
7.2 Potential Impact of the EU Working Time Directive
7.2.1 In spite of the UK signing up to much European legislation in recent years it still maintains its commitment to allowing workers to ‘opt out’ of the EU Working Time Directive, which limits the hours worked during one week to 48
52 Pension contributions at these companies are paid on behalf of directors only

©The TAS Partnership Limited ▪ November 07
Study of Cost Issues in Transport Operation: Phase One: Understanding the Trends and Drivers in Cost Inflation: Task Note 2: The Bus Industry ▪ 91
(averaged over a number of weeks so that occasional weeks over 48 hours are permitted.)
7.2.2 It is felt that many employees in the UK currently feel obliged to ‘opt out’, not only to conserve their employment (as it is felt that refusing to sign an ‘opt out’ may risk continued employment or promotion) but also to ensure overtime opportunities which traditionally have made a significant difference to take home pay in some sectors.
7.2.3 There has been continual pressure to end the UK opt out of the working time directive from other EU countries as well as trade unions in the UK. It is felt that the continued acceptance of the UK ‘opt-out’ enables UK employers to have a competitive advantage based on the exploitation of the workforce through long working hours.
7.2.4 In the road transport field long working hours are commonplace. While increased base pay rates have reduced the dependence upon overtime, many employees in the sector look to work additional hours to increase their income and a restriction of this possibility may not be viewed positively among front line employees. However, balanced against this is that bus driving may become more attractive for other potential employees if the hours are reduced.
7.2.5 Employers would normally face additional costs if the number of employees needed to maintain the same level of service increases. Although the hourly pay in the transport sector means that the number of paid hours will remain largely unchanged, additional employees generally mean additional costs such as pensions, holiday pay, national insurance and other non wage costs such as training. There is, however, a counter-argument that shorter working weeks reduce stress and therefore reduce sickness levels.
7.2.6 As a rule these ‘per employee’ costs can add up to 20% to the wage costs for employers. Consequently a reduction in the average working week from 44 to 40 hours would likely incur an increase in 2% in overall labour costs, due to the increased costs of maintaining additional employees.
7.2.7 The above is based on a situation with no overtime premium. This is now largely the case in the bus industry and one can see the opposition of industry employers to allowing the UK government to drop its opt out from the Working Time Directive. However as we have already identified a trend for reduced working hours. The introduction of the directive is therefore only likely to affect a limited proportion of employees.
7.3 National Insurance
7.3.1 In order to pay for increased health spending the UK government increased National Insurance contributions for both employees and employers from 6th April 2003. Although the increase was 1% over the current rates the effective

©The TAS Partnership Limited ▪ November 07
Study of Cost Issues in Transport Operation: Phase One: Understanding the Trends and Drivers in Cost Inflation: Task Note 2: The Bus Industry ▪ 92
rate of the increase was slightly less, as (like income tax) there are earning limits and NI is not paid on all of the income. Nevertheless the increase will have resulted in an overall increase of just under 1% for most employers.
7.3.2 Other social legislation provisions have led to significant increases in Social Security payments since 1995 as illustrated in Table 17, although the degree of variation in the change reported is inexplicable and may have more to do with accountancy methods. It is difficult to see why there should be such a large increase at Stagecoach Selkent, for example. Horseman’s increase results from a move to full time staff. Note, however, that with the exception of Selkent the Social Security payments per staff member are broadly equal regardless of sector.
Table 17: Changes on Social Security Payments 1995-2005
Company
Social Security /
Staff
Social Security /
Staff
Social Security /
Staff %
Change
Year 1995 2004 2005 91-05
Arriva Cymru £782 £1,309 £1,385 77.0%
East Yorkshire £810 £1,161 £1,120 38.2%
First Manchester £1,042 £1,287 £1,484 42.4%
Holmeswood Coaches N/A £1,211 £1,358 N/A
Horseman Coaches £915 £1,630 £1,859 103.3%
Lothian Buses £1,076 £1,470 £1,468 36.5%
Nottingham £1,209 £1,293 £1,403 16.0%
Safeguard £1,255 £1,741 £1,889 50.5%
Stagecoach Manchester £1,058 £1,457 £1,495 41.3%
Stagecoach Selkent £1,257 £2,606 £2,816 124.0%
Strathtay £1,289 £1,329 £1,493 15.9%
Truronian N/A £1,254 £1,329 N/A
Whittle N/A £870 £1,159 N/A
Wilts & Dorset £1,000 £1,975 £1,793 79.3%
All Operators £1,066 £1,552 £1,639 53.7%
Small Ops £996 £1,290 £1,438 44.3%
Other £917 £1,455 £1,438 56.8%
Major Urban £1,105 £1,596 £1,710 54.7%
7.4 Social Legislation- Maternity, Paternity and Parental Leave
7.4.1 Statutory paid maternity leave of 26 weeks is available to any pregnant woman, increasing to 39 weeks from April 2007. If the woman has been

©The TAS Partnership Limited ▪ November 07
Study of Cost Issues in Transport Operation: Phase One: Understanding the Trends and Drivers in Cost Inflation: Task Note 2: The Bus Industry ▪ 93
employed for at least 26 weeks prior to becoming pregnant she can request an additional 26 weeks unpaid leave. The pay during maternity leave is 90% of regular pay for the first six weeks, and a flat rate (currently £108) for the additional 20 weeks. 92% of this can be reclaimed by deducting it from their payments for National Insurance and Income tax.
7.4.2 In addition to maternity leave fathers are permitted to take paternity leave, for either one or two weeks. While on paternity leave the fathers receive statutory paternity pay (£108/week), and this is recoverable on the same basis as statutory maternity pay. In addition to maternity leave and paternity leave parents can also take Parental Leave on an unpaid basis for 13 weeks for each child under 5, or disabled children under 18.
7.4.3 Adoption leave is also available for adoptive parents for 26 weeks paid, with a further 26 weeks unpaid. The leave is paid at the same £108 per week as statutory maternity and paternity leave. Like maternity leave these payments are recoverable from National Insurance and Income Tax.
7.4.4 In addition to the various forms of parental leave parents of children under six or disabled children under 18 have a right to request flexible working. This request must be considered seriously by the employer, but there may be changes to salary and/or working conditions if the request is accepted.
7.4.5 All of the different forms of parental leave and the request for flexible working would not normally incur a high cost to an employer unless there were more generous arrangements under a labour agreement. However, there would be a requirement to provide cover for the employee’s absence in most cases, and this would incur additional costs. Other than using agency staff, often not an option for bus operating companies, the implications would be a larger number of spare drivers and other staff to cover statutory periods of absence, with consequent increased costs.
7.5 Child and Working Tax Credit Limits
7.5.1 In order to encourage persons on benefits to take up employment the government introduced Working Tax Credits which provide additional income for persons who are working, but have low incomes. The actual amount depends on the level of income as well as the individual circumstances, but those who are working for more than 30 hours a week, as well as those aged over 50 and re-entering the workforce receive more.
7.5.2 Working Tax Credits reduce as income increases and above a certain level of income eligibility ends completely. Persons who are eligible also need to report any change of circumstances immediately, as the tax credits can be ‘clawed back’ if overpaid, potentially causing financial hardship in the following tax year.

©The TAS Partnership Limited ▪ November 07
Study of Cost Issues in Transport Operation: Phase One: Understanding the Trends and Drivers in Cost Inflation: Task Note 2: The Bus Industry ▪ 94
7.5.3 At the moment, with more competitive pay being offered, it is unlikely that single employees of major bus operating companies would be eligible for Working Tax Credit. However, many employees who are over 50 and have partners and / or dependent children could possibly receive tax credits. Working Tax Credits are more likely to be relevant for those working for smaller companies on lower wages.
7.5.4 Working Tax Credits can be used to contribute toward the cost of childcare. As such they can assist bus operators in attracting working mothers to the industry, although finding childcare flexible enough to handle the shift patterns of bus workers can be difficult.
7.5.5 More importantly, those initially entering work from benefits are eligible to receive a range of related benefits such as housing and council tax benefit. An immediate increase in wage would lead to the employee losing these crucial linked benefits and it may make the prospect of additional hours or additional pay less appealing as in real terms the employee would be worse off. This can impact upon bus operators if an employee risks losing benefit as a result of working overtime. This will particularly be the case for operators who pay premium rates for overtime or rest day working.
7.6 Overall Impact
7.6.1 As labour costs in bus operation generally constitute over two thirds of total costs, increases in National Insurance, pensions and other non-wage employee costs have a disproportionate impact on the total costs on bus operations compared to, for example, manufacturing or other sectors which are less labour-intensive.
7.6.2 In addition wages have tended to rise faster than general inflation and especially so in London. As bus industry costs are largely determined by labour costs, above inflation increases in labour costs lead to cost increases for the bus industry well in excess of inflation. These tend to be passed on to passengers by increasing fares, but the above inflation fare increases also lead to a reduction in passenger numbers, as outlined in chapter 15.

©The TAS Partnership Limited ▪ November 07
Study of Cost Issues in Transport Operation: Phase One: Understanding the Trends and Drivers in Cost Inflation: Task Note 2: The Bus Industry ▪ 95
Compliance Costs and Legislative Change 8
CfIT Question 14: Is there a full understanding of existing and forthcoming compliance costs and legislative change – especially European proposals?
• Disability Discrimination Act
• European bus workers’ training directive
• Traffic commissioners’ performance regime
• DDA for coaches
• DDA operational requirements (as opposed to construction and use)
8.1 Disability Compliance Issues
8.1.1 The target implementation dates for full accessibility of buses and coaches is shown in Table 18 below. All buses must comply by January 2017 and coaches by January 2020. As described more fully in section 9.2, the industry must increase its rate of capital investment in new vehicles if the target date is to be met.
Table 18: Implementation timetable for Accessibility Regulations
Latest Implementation Date
New Vehicles ALL VEHICLES
Vehicle Type Aids for disabled people
(Schedule 2 or 3)
Wheelchair access
(Schedule 1)
All requirements
(Schedule 1&2 or 1&3)
Single-deck buses (capacity over 22, incl. standing) weighing up to 7.5 tonnes GVW
31 December 2000 1 January 2005 1 January 2015
Single-deck buses (capacity over 22, incl. standing) weighing more than 7.5 tonnes GVW
31 December 2000 31 December 2000 1 January 2016
Double-deck buses 31 December 2000 31 December 2000 1 January 2017
Small buses / coaches (under 23 passengers)
Not yet specified Not yet specified Not yet specified
Large coaches (over 22 passenger capacity)
31 December 2000 1 January 2005 1 January 2020
8.1.2 The slow rate of investment in new vehicles will put a premium on low floor accessible vehicles which will impact upon the secondhand market. This is
©The TAS Partnership Limited ▪ November 07
Study of Cost Issues in Transport Operation: Phase One: Understanding the Trends and Drivers in Cost Inflation: Task Note 2: The Bus Industry ▪ 96
likely to have an impact upon costs for smaller operators and could lead to deregistration of some commercial operations. Although school contract operations will be exempt from accessibility regulations this will only be the case for ‘closed door’ contracts. Any school operation which issues fares will be included in the accessibility regulations. This is likely to lead to cost increases on such services and for ‘closed door’ operations will preclude the use of non-accessible vehicles on any other work
8.2 Environmental Legislation
8.2.1 Operators are also subject to other legislation which has increased costs. Health and Safety legislation is a major influence, particularly on the engineering side of the business. Waste Disposal, especially of potentially hazardous chemicals, is another area of concern. l
8.2.2 Buildings and Planning Legislation also have a significant influence on bus operators. In many areas, property values in town centres have led to the selling off of town centre depots and facilities. It is no longer seen as acceptable for bus depots to be situated in residential areas, even if the hapless operator has occupied the site for many more years than the surrounding housing, due to extended hours of operation.
8.2.3 The general trend is for replacement depot facilities to be situated on out-of-town industrial estates, with ensuing problems of accessibility (few drivers living within walking distance of the depot) and incurring increased costs through additional light mileage.
8.3 Traffic Commissioners
8.3.1 The Traffic Commissioners jointly have issued strict guidelines for reliability criteria for registered local bus services. All operators must adhere to these criteria and VOSA inspectors will use these as a measure of whether a service is being operated correctly.
8.3.2 Local authorities – and PTEs in particular, have often been critical of bus operators for making frequent changes to services, but a large proportion of such changes are reliability-related, adjusting particular journeys or timings to suit the appropriate local traffic conditions and to meet the Traffic Commissioners’ standards of reliability.
8.3.3 We have available data from Stagecoach Manchester which breaks down all of its service changes excluding school services in 2004 and most of 2005 by category. A summary of the results is shown below in Figure II. Stagecoach Manchester is very heavily committed to University term-time custom and hence has a high degree of term and holiday timetable variation, leading to many seasonal timetables. These have been excluded from the analysis below in order to give a more typical representation.

©The TAS Partnership Limited ▪ November 07
Study of Cost Issues in Transport Operation: Phase One: Understanding the Trends and Drivers in Cost Inflation: Task Note 2: The Bus Industry ▪ 97
8.3.4 There were 130 changes to registrations in a twenty month period. Notwithstanding this, it is of note that significant commercial service changes account for only 30.8% of all changes. This is within a few percent of the level of changes for reliability reasons or as a result of changes to PTE contracts. ‘Other minor’ changes are principally those which previously would have been made under the ‘five minute’ rule.
Figure II: Stagecoach Manchester Service Change by Reason 2004-5
Contract Changes26.2%
Other Minor Changes14.6%
Commercial Service Change30.8%
Reliability28.5%
8.3.5 Growing traffic congestion is causing additional costs due to the need to schedule additional vehicles to maintain frequencies where peak hour operating speeds are falling, or alternatively by reducing the number of peak journeys in order to maintain an achievable timetable within the same resources. However, operators in all parts of the country have made strenuous efforts to reduce lost mileage and thus satisfy the fundamental requirement of the Traffic Commissioners as well as various local and company targets for mileage operated.
8.3.6 Operation of the maximum amount of registered (or licensed) mileage is a key aim, thus reducing the level of lost mileage is paramount. Figure JJ and Figure KK illustrate trends in lost mileage since 2001 in England outside London and in London respectively. In both cases 2005/6 has seen major improvement over previous years and ‘lowest ever’ levels of mileage lost – for the first time this was below 1% outside London. London’s lost mileage stands at around twice the level in the rest of the country but has improved greatly to just over

©The TAS Partnership Limited ▪ November 07
Study of Cost Issues in Transport Operation: Phase One: Understanding the Trends and Drivers in Cost Inflation: Task Note 2: The Bus Industry ▪ 98
2%. This improvement results from the dramatic reduction in lost mileage due to staffing problems and, in London, a dramatic decrease in mileage lost through traffic congestion since the introduction of congestion charging in 2004. Mileage lost due to other causes has remained fairly static. We suspect that the effect of traffic congestion is grossly underestimated here. Most bus services affected by congestion will not be ‘lost’, but will be delayed and run off-timetable.
Figure JJ: Trend in Lost Mileage – England outside London
0.0
0.2
0.4
0.6
0.8
1.0
1.2
1.4
1.6
2000/1 2001/2 2002/3 2003/4 2004/5 2005/6
Per
centa
ge
of
Mile
age
Lost
Traffic congestion Staffing problems Mechanical problems Other
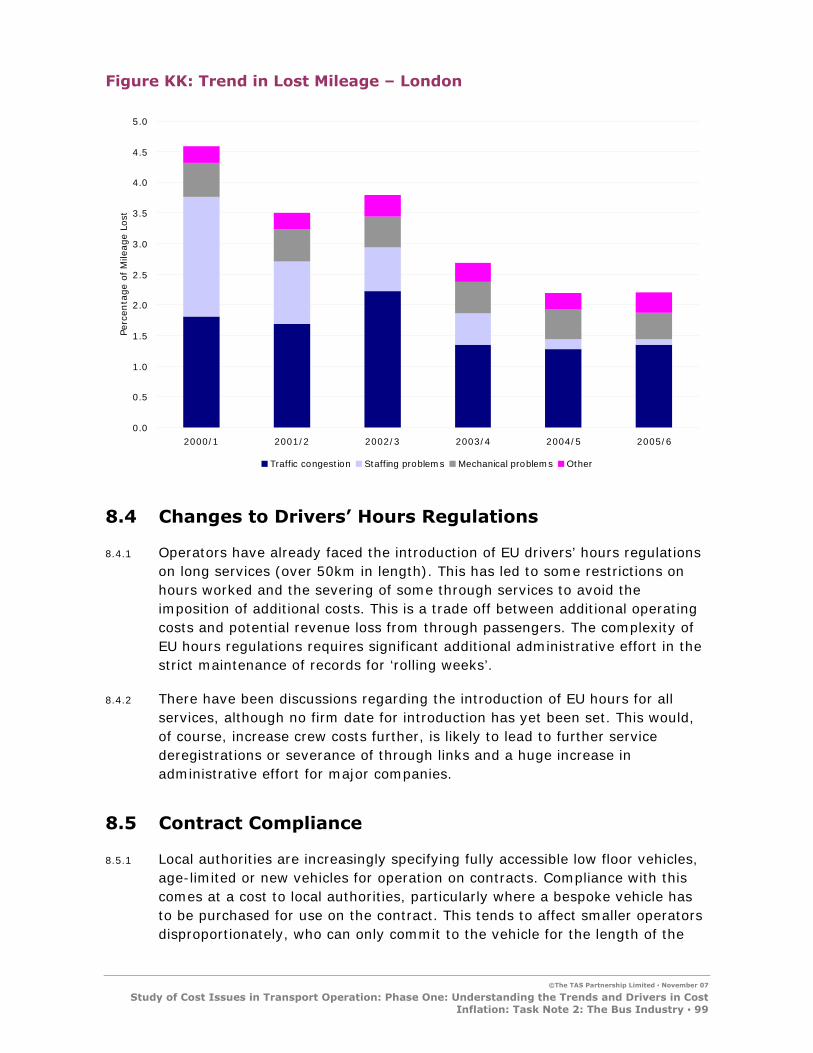
©The TAS Partnership Limited ▪ November 07
Study of Cost Issues in Transport Operation: Phase One: Understanding the Trends and Drivers in Cost Inflation: Task Note 2: The Bus Industry ▪ 99
Figure KK: Trend in Lost Mileage – London
0.0
0.5
1.0
1.5
2.0
2.5
3.0
3.5
4.0
4.5
5.0
2000/1 2001/2 2002/3 2003/4 2004/5 2005/6
Perc
enta
ge o
f M
ileage
Lost
Traffic congestion Staffing problems Mechanical problems Other
8.4 Changes to Drivers’ Hours Regulations
8.4.1 Operators have already faced the introduction of EU drivers’ hours regulations on long services (over 50km in length). This has led to some restrictions on hours worked and the severing of some through services to avoid the imposition of additional costs. This is a trade off between additional operating costs and potential revenue loss from through passengers. The complexity of EU hours regulations requires significant additional administrative effort in the strict maintenance of records for ‘rolling weeks’.
8.4.2 There have been discussions regarding the introduction of EU hours for all services, although no firm date for introduction has yet been set. This would, of course, increase crew costs further, is likely to lead to further service deregistrations or severance of through links and a huge increase in administrative effort for major companies.
8.5 Contract Compliance
8.5.1 Local authorities are increasingly specifying fully accessible low floor vehicles, age-limited or new vehicles for operation on contracts. Compliance with this comes at a cost to local authorities, particularly where a bespoke vehicle has to be purchased for use on the contract. This tends to affect smaller operators disproportionately, who can only commit to the vehicle for the length of the

©The TAS Partnership Limited ▪ November 07
Study of Cost Issues in Transport Operation: Phase One: Understanding the Trends and Drivers in Cost Inflation: Task Note 2: The Bus Industry ▪ 100
contract (maximum of five years) while the larger companies can usually deploy the vehicle elsewhere if the contract is lost.
8.5.2 Some local authorities have specified the use of low floor vehicles on evening and Sunday contracts as a means of securing additional accessible vehicles for use on the daytime network, however this may not be the daytime version of the same service nor might it allow conversion of the whole daytime service.
8.5.3 Local authorities may package together secured services to ensure efficient use of new low floor vehicles and in some cases may even retain ownership of the vehicles themselves. Although commendable, this can lead to new accessible vehicles operating lightly used journeys while commercial core services remain in the hands of older less accessible vehicles.
8.5.4 Dependent upon the stringency of local authority contract conditions, there may be significant administrative effort in supporting secured services to avoid penalty payments and to supply information on tendered services.
8.5.5 There have been costs incurred by both local authorities and operators as a result of Quality Partnership agreements and initiatives such as ‘Superoutes’ in Tyne & Wear. Since these largely involve core trunk routes this perhaps reflects investment which operators would have made in any case, with the addition of guarantees made to ensure the appropriate local authority investment.
8.6 Quality Contracts
8.6.1 The effect which possible Quality Contracts (QCs) would have upon costs is difficult to quantify given the lack of any examples in operation but a possible scenario, looking at each of the main cost headings, is as follows:
• Labour Costs – are likely to increase as there will be some ‘normalisation’ of wages and conditions similar to the current London situation, even if wage levels remain the contractor’s responsibility. This is unlikely to involve a significant worsening of pay and conditions for those who previously worked for the highest paying operators if staff establishment levels and industrial relations are to be maintained.
• Overheads – are likely to increase significantly as the existing bus company management structure will be retained and supplemented by increased staffing levels at local authorities overseeing contracts. As contracts are likely to be quite prescriptive, the level of supervisory staff at both contractor and local authority is likely to increase in order to monitor contract compliance and delivery. There is also likely to be an increase in administrative functions in terms of information transfer and audit control.

©The TAS Partnership Limited ▪ November 07
Study of Cost Issues in Transport Operation: Phase One: Understanding the Trends and Drivers in Cost Inflation: Task Note 2: The Bus Industry ▪ 101
• Depreciation - will increase significantly if the local authorities specify new vehicles for each contract or maintain strict maximum age limits. There is certain to be a significant level of investment at the start of QCs.
• Maintenance – costs are likely to decrease as a result of having a newer fleet, although some maintenance costs – vandalism repair, tyres etc. would be unaffected.
• Fuel Cost – is unlikely to change dramatically unless, of course, there is significantly less mileage operated under the aegis of the QC, but this would be unlikely. Fuel costs may increase marginally as newer vehicles tend to be less fuel efficient than their older counterparts.
8.6.2 There are concerns regarding the effects which QCs may have upon bus operations in surrounding areas, partially reflecting some of the effects which the London situation has had in the Home Counties:
• Higher wage levels in a QC area could force up wages in surrounding areas to avoid loss of staff to QC operators.
• Dependent upon the attitude to cross-boundary services within the QC area, the neighbouring local authorities may be faced with having to financially support more services which become unviable as a result of the QC conditions.
• There may be a further threat to continued operation of other services in neighbouring areas if the current services are operated from a depot within a QC area.
• If investment in new vehicles is concentrated in QC areas, other areas may be starved of new investment.
8.6.3 The public service union, UNISON, expressed some further concerns regarding the effects of QCs upon bus company staff, both within and outside the QC area53:
• They are critical of the PTEs’ unwillingness to guarantee existing terms and conditions of employment and their unwillingness to set minimum standards.
• They have concerns that reduction in bus company profits will adversely affect the provision of pension funds for employees.
• Loss of assets by the major companies following QC awards could have a detrimental effect upon the financial position of those companies and impact upon the remaining employees.
53 Motions passed at the 2006 Transport Conference in Bournemouth, June 2006.

©The TAS Partnership Limited ▪ November 07
Study of Cost Issues in Transport Operation: Phase One: Understanding the Trends and Drivers in Cost Inflation: Task Note 2: The Bus Industry ▪ 102
8.7 The EU Driver Training Directive
8.7.1 This becomes law from September 2008 and will undoubtedly have an impact upon wage costs. The directive applies to new drivers immediately from September 2008 but existing drivers have a five year window in which to qualify to the required standard.
8.7.2 The principal focus is the introduction of a CPC for bus and coach drivers. For new entrants the UK government must choose between either a course-based training programme or a detailed written and practical test (of six hours duration). New drivers will, however, be able to drive in service while they study for the CPC. Existing drivers will have certain grandfather rights, but will still have to study for the CPC to be completed by 2013.
8.7.3 Many, especially larger, companies have already initiated some sort of NVQ training for drivers. By Spring 2005 just over 50% of the workforce had achieved NVQ to level 2 or higher.
8.7.4 This new system will place particular pressure on training costs. Some estimates suggest an increase of up to 5% in overall drivers’ wage bills. This would also add an extra strain on staff retention – those failing the CPC may have to leave their employment, although it is not clear at this stage what ‘resit’ arrangements there will be.
8.7.5 The possible plus side of the new arrangements is that new entrants to the industry will be subject to an extended period of training which will offer greater support and may reduce the high turnover of staff experienced among first year employees.

©The TAS Partnership Limited ▪ November 07
Study of Cost Issues in Transport Operation: Phase One: Understanding the Trends and Drivers in Cost Inflation: Task Note 2: The Bus Industry ▪ 103
Trends in Fuel and Fuel Consumption 9
CfIT Question 15: What are the trends in fuel and fuel consumption?
Buses and trains designed to meet DDA and ‘Euro-emission standards’ have generally become heavier and more fuel-consuming. This is in addition to general increases in fuel prices.
How might public transport vehicles be made more fuel efficient?
9.1 Fuel and Fuel Duty
9.1.1 Fuel costs have been highly variable as a result of changes in the market and of taxation levels. Recent trends in fuel price would indicate that fuel will continue to rise in price. The primary determinants of bus industry fuel costs include:
• World oil prices and availability.
• The ability to hedge future block fuel purchases.
• Fuel taxation policies, including levels of rebates.
• Vehicle fuel consumption levels.
9.1.2 Trends in many of these areas have been adverse either consistently or in isolation over recent years. Changes in fuel taxation and levels of rebate were particularly adverse in the mid 1990s and fluctuations in world oil prices – mainly associated with political events in the Middle East, but also following Hurricane Katrina’s effects on the Gulf of Mexico – have been unhelpful.
9.1.3 In recent years, Fuel Duty Rebate for bus services (latterly Bus Service Operators Grant (BSOG)) has stabilised. It was frozen in the Conservative Budget of 1993 but the first budget of the new Labour Government in 1998 restored it index linked to the level of overall fuel duty, giving a rebate of 80% of Fuel Duty. BSOG currently stands at 37.96 pence per litre.
9.1.4 The duty paid on diesel itself has fluctuated over the same period. It had increased by 21 pence per litre between 1991 and 2001, but was reduced by 3 pence per litre in the March 2001 budget, having had only one increase since, in the March 2004 budget to its current level of 47.1 pence per litre. VAT is charged on fuel plus duty at the standard rate of 17.5%, which was last increased in March 1991 from its previous standard rate of 15% - but the VAT element is recovered by operators while public transport remains zero rated.

©The TAS Partnership Limited ▪ November 07
Study of Cost Issues in Transport Operation: Phase One: Understanding the Trends and Drivers in Cost Inflation: Task Note 2: The Bus Industry ▪ 104
9.1.5 Figure LL below shows a breakdown of the constituent parts of the cost of diesel to bus operators in July 2006. Total diesel price at the time was 99.5 pence per litre. Thus including BSOG, the true price to operators was around 46.5 pence per litre at the time. Figure MM shows the varying trend in make-up of the cost of diesel fuel (before FDR / BSOG) since 1990 taken from DTI figures. It can be seen that in just over fifteen years the total price per litre has increased by a factor of 2.5.
9.1.6 The cost of the fuel itself was remarkably stable in the first ten years up to 2000, but there was then a steady increase leading into steep increases from 2005. Fuel Duty, on the other hand, rose consistently throughout the 1990s (the period when Fuel Duty Rebate was frozen) but has remained stable since then. VAT has applied as a constant percentage since 1991.
9.1.7 Thus to summarise:
• 1990s – stable fuel price, but increasing duty.
• 2000s – increasing fuel price, but little change in the level of duty.
9.1.8 There is little evidence to suggest that the increases in fuel costs in recent years will cease. The US Energy Information Authority has revised its fuel price projections through to 2030 upwards in 200754, estimating a 1.25% real terms increase by 2010, falling by 2020 but rising again to 4.2% above current levels by 2030. The DTI’s energy review of 2006 has a range of fuel cost assumptions.
9.1.9 From 1991 the then Conservative government introduced a fuel duty escalator – duty on fuel would automatically increase by 3% above the inflation rate each year. Gordon Brown’s first budget raised the value of the escalator to 6%. The application of the fuel duty escalator ceased in 2001 after the campaign of fuel protests and in fact has even failed to keep pace with inflation since then.
9.1.10 Transport 2000 has argued55 that government cannot afford to continue fuel tax at its current level if it wishes to avoid a major tax revenue shortfall (predicted to be between £3-5 billion by 2012) in the future as more fuel efficient vehicles and vehicles using alternative fuels decrease fuel consumption. It argues that a return to the fuel duty escalator is also needed to offset the reductions in motoring costs and to hinder traffic growth. It has been hinted that a future Conservative government would be likely to reintroduce the fuel duty escalator56. David Begg argues57 that the failure of the fuel duty escalator was that it was seen as a pure revenue-raising exercise
54 www.eia.doe.gov/oiaf/aeo/pdf/table1.pdf 55 http://www.transport2000.org.uk/news/maintainNewsArticles.asp?NewsArticleID=138 October 2003 56 Telegraph Online, 1 September 2006 57 Transport Times 8 September 2006

©The TAS Partnership Limited ▪ November 07
Study of Cost Issues in Transport Operation: Phase One: Understanding the Trends and Drivers in Cost Inflation: Task Note 2: The Bus Industry ▪ 105
without any environmental agenda and that both current Liberal Democrat and Conservative proposals would clearly link this to tax cuts elsewhere.
9.1.11 Given its importance as a source of revenue to government58, it also appears unlikely that fuel duty will remain fixed at its present rate for much longer, whatever the political hue of a future government.
Figure LL: Breakdown of Cost of Diesel Fuel to Bus Operators July 06
VAT14.9%
Fuel37.4%
Duty9.3%
BSOG38.4%
58 Fuel duty revenue is estimated at around £23.5bn per year in 2005/6 and is one of the government’s most important sources of tax revenue.

©The TAS Partnership Limited ▪ November 07
Study of Cost Issues in Transport Operation: Phase One: Understanding the Trends and Drivers in Cost Inflation: Task Note 2: The Bus Industry ▪ 106
Figure MM: The Varying Cost of Diesel Fuel (Outturn Prices)
0.00
20.00
40.00
60.00
80.00
100.00
120.00
Jan-9
0
Jul-
90
Jan-9
1
Jul-
91
Jan-9
2
Jul-
92
Jan-9
3
Jul-
93
Jan-9
4
Jul-
94
Jan-9
5
Jul-
95
Jan-9
6
Jul-
96
Jan-9
7
Jul-
97
Jan-9
8
Jul-
98
Jan-9
9
Jul-
99
Jan-0
0
Jul-
00
Jan-0
1
Jul-
01
Jan-0
2
Jul-
02
Jan-0
3
Jul-
03
Jan-0
4
Jul-
04
Jan-0
5
Jul-
05
Jan-0
6
Jul-
06
Pen
ce p
er L
itre
Fuel Duty VAT
9.1.12 On first inspection, raising the level of fuel duty would appear to automatically be a bad thing for bus operators, even if the increased level of duty is only 20% of that normally applied after BSOG. As a direct cost it certainly would be a negative factor. But there is strong evidence that increases in fuel costs to motorists influences travel habits. David Begg57 quotes figures from Scotland since the large fuel price rises of 2005/6:
• Car kilometres reduced by 1%
• Rail trips up 9%
• Bus trips up 2%.
9.1.13 The sample figures broadly support research by Dr Phil Goodwin59 which suggested a cross elasticity of around +0.34 between fuel price and public transport use – that is, for each ten per cent increase in fuel price there would be a 3.4% increase in public transport use. Fuel price has increased overall by 20% in the last two years. If a 10% annual increase produces the above effects then bus operators would appear to have little to fear from the reinstatement of the fuel duty escalator.
59 Goodwin PB (1992) A review of new demand elasticities with special reference to short and long run effects of price changes. Journal of Transport Economics and Policy 26.

©The TAS Partnership Limited ▪ November 07
Study of Cost Issues in Transport Operation: Phase One: Understanding the Trends and Drivers in Cost Inflation: Task Note 2: The Bus Industry ▪ 107
9.1.14 Fuel only accounts for 9% of typical bus operating costs (see Figure C) of which fuel duty accounts for 9.5%. Therefore if fuel duty increases by 10% this represents only a 0.9% cost increase to bus operators – if this is offset by a 2% patronage increase then things look more favourable for bus operators.
9.1.15 Conversely, if the cost of the fuel itself increases by a further 10%, then operator costs increase by 3.7% to be compensated by only a 2% patronage increase. It is this latter factor which is of more concern to operators and which has led to what are effectively ‘fuel surcharge’ fare increases.
9.2 Vehicle Specification
9.2.1 There has been a continuing trend, dating back several years, for newer vehicles to have significantly poorer fuel consumption than the older vehicles they replace. There are a variety of reasons for this, including changed regulatory requirements and increased sophistication of new vehicles, including fittings for ancillary equipment such as air conditioning, power-operated ramps and other electronic equipment for a range of add-ons such as electronic destination blinds and CCTV. One of the side effects of sophistication has been a trend towards increasing weight of vehicles.
9.2.2 Traffic congestion also has an adverse effect upon fuel consumption as buses spend more of their time in stop / start traffic. It was found, for example, that fuel consumption for double-deck vehicles in Central London was 18% worse than for equivalent models in rural areas60.
9.2.3 In some ways, however, the major switch toward vehicles with worsening levels of fuel consumption took place before the 1990s with a shift from vehicles powered by larger and more efficient (but more polluting) engines to smaller, turbocharged, higher revving engines which were cleaner but less fuel efficient, in some cases almost doubling the fuel consumption of their predecessors.
9.2.4 The mid 1980s minibus revolution lead to the use of small, more fuel efficient vehicles – but the increase in the number of vehicles employed increased considerably so that there was unlikely to be a reduction in the total amount of fuel consumed. By the mid 1990s the minibus era was over and most have been replaced by midibuses or full size buses. Many of the latest generation of midibuses are derivatives of, or have much in common with, full size models and their fuel consumption differs from full size buses only in as much as they are smaller and therefore lighter61.
9.2.5 Traditional British buses had chassis and body manufactured separately. One side effect of the move to low floor accessible buses is the reduction in the extent of and strength of chassis components, leaving the bus body to bear
60 DETR Good Practice Guide 247: Fuel Management Guide for the Bus and Coach Industry, 1999 61 Research carried out by TAS in 1997 showed a difference in fuel consumption of only 0.3 km/litre.

©The TAS Partnership Limited ▪ November 07
Study of Cost Issues in Transport Operation: Phase One: Understanding the Trends and Drivers in Cost Inflation: Task Note 2: The Bus Industry ▪ 108
more of the weight. Thus compliance with disability measures has not, per se, led to increased bus weights, this has come about more as a side effect of the adoption of different principles of chassis / body structure for low floor vehicles. We would have liked to compare fuel consumption of the types of vehicles listed in Table 19 by weight, but have found figures on vehicle weight difficult to obtain.
9.2.6 In one area, however, weight and sophistication of vehicles has grown very significantly and that is in coaching. Modern coaches are increasingly sophisticated with items such as air conditioning, double-glazing, toilets, in-coach entertainment systems and serveries now commonplace. There is also a move for coaches to be taller thus allowing a large under-floor storage area for luggage. This extra luggage adds weight which of course requires additional power and fuel to propel62 whilst maintaining adequate performance.
9.2.7 Figure NN shows the total volume of diesel consumed by buses in the period between 1994 and 2004. It shows a steady decline only reversed in last two years, corresponding to significant increases in bus mileage in London. Figure OO then shows the trend in the rate of fuel consumption by buses over the same period. This actually corresponds closely, but inversely, to Figure NN in that the consumption per mile steadily decreases but then increases again in the last two years. The downturn between 2003 and 2004 is quite marked, but this corresponds with the large growth in the London bus fleet, where buses are less fuel efficient in very urban operations. Except for this 2004 trend, these figures go against the perception (and data in Table 19) that vehicles are becoming much less fuel efficient.
62 Shearings has in fact done a health and safety audit researching the increased weight of luggage which its extended tour drivers are expected to load and unload as a reflection of the increased tendency for holidaymakers to take increasing amounts of luggage.

©The TAS Partnership Limited ▪ November 07
Study of Cost Issues in Transport Operation: Phase One: Understanding the Trends and Drivers in Cost Inflation: Task Note 2: The Bus Industry ▪ 109
Figure NN: Total Fuel (Diesel) Consumed by Buses 1994 – 2004
1200
1300
1400
1500
1600
1700
1800
1994 1995 1996 1997 1998 1999 2000 2001 2002 2003 2004
Mil
lio
n L
itre
s
Figure OO: Rate of Fuel Consumption in Buses 1994 – 2004
2.50
2.70
2.90
3.10
3.30
3.50
3.70
3.90
4.10
4.30
1994 1995 1996 1997 1998 1999 2000 2001 2002 2003 2004
Kil
om
etr
es
per
Lit
re

©The TAS Partnership Limited ▪ November 07
Study of Cost Issues in Transport Operation: Phase One: Understanding the Trends and Drivers in Cost Inflation: Task Note 2: The Bus Industry ▪ 110
Table 19: Comparisons of Fuel Consumption 1970s to Date63
1970s 1980s 1990s 2000s
Make / Model Bristol VR Leyland Olympian
Volvo Olympian Dennis Trident
Weight (tonnes) 9.1 9.5 10.3 14.2
Kms / Litre 2.69 2.56 2.29 1.98
Double Deck
Km/l/tonne 0.296 0.269 0.222 0.139
Make / Model Leyland National
Leyland Lynx Dennis Dart Scania L94UB
Weight (tonnes) 9.3 9.1 8.7 11.2
Kms / Litre 2.64 2.56 3.48 2.44
Single Deck
Km/l/tonne 0.284 0.281 0.400 0.218
Make / Model Leyland Leopard
Leyland Tiger Volvo B10M Volvo B12B (12.8m)
Weight (tonnes) 8.7 10.0 10.9 13.9
Kms / Litre 2.90 2.99 3.21 2.88
Coach
Km/l/tonne 0.333 0.299 0.294 0.220
Make / Model Ford Transit Mercedes L608 Optare Metrorider
Optare Solo
Weight (tonnes) 3.0 3.7 5.0 8.5
Kms / Litre 7.33 5.89 3.69 3.62
Midibus
Km/l/tonne 2.443 1.592 0.738 0.426
9.3 Euro Engine Standards
9.3.1 The imposition of Euro standards for engines has progressively worsened fuel consumption up to the Euro III standard. The principal aim of the Euro standards was to reduce the production of Oxides of Nitrogen (NOx) and particulate emissions (PM10
64). There have been three key dates for Euro engine standards (Euro I – Euro IV) applying to new vehicles registered since 1993 with a fifth standard to be imposed from October 2009. These aims have been met, but at the cost of increased fuel consumption and increased CO2 emissions. Indeed some sources have queried whether the initial Euro standards have in fact contributed to the reduction environmental pollution overall65.
63 Figures for 1970s to 1990s taken from research carried out by TAS in 1997, 2000s figures taken from returns from a major operator with a mix of busy urban and interurban work. 64 PM10 is particulate matter with an (equivalent aerodynamic) aerodynamic diameter of ten microns (10µm) or less, small enough to penetrate the lungs. 65 See, for example, item in Buses magazine for August 2006 and subsequent letter in October edition. There is now some doubt also whether diesel particulates are the key pollutants – it has been established that other finer particulates, such as brake dust, cause much more irritation to the lungs.

©The TAS Partnership Limited ▪ November 07
Study of Cost Issues in Transport Operation: Phase One: Understanding the Trends and Drivers in Cost Inflation: Task Note 2: The Bus Industry ▪ 111
9.3.2 Many Euro IV engines achieve their emission targets through Selective Catalytic Reduction (SCR) by the use of fuel additives, such as ‘AdBlue’, to reduce emissions. There is, obviously, a cost attached to the ongoing use of these additives66 and some engineering costs incurred in converting fuel lines and installing additional additive tank storage areas. For bus operators, the cost of AdBlue is disproportionately expensive as it costs more per litre than the rebated price for diesel, although as the use of AdBlue increases its price is decreasing.
9.3.3 The urea-based additives such as AdBlue cannot be pre-mixed with diesel and thus therefore need there own storage tanks both within depots and on the vehicles. However, there are indications that Euro IV engines using additives are showing improved fuel economy. Cummins initially claimed a likely fuel saving of 7%, but field trials of the first Euro IV engined vehicles are in fact showing much better figures than this, more in the region of 10%, but up to 18% in double decks. At this level, an overall cost saving of around 5% is anticipated allowing for AdBlue67. One major user of Euro IV engines with AdBlue in the freight sector68 has also found that the consumption of AdBlue has not been as high as anticipated as the level of NOx produced by Euro IV engines was so low.
9.3.4 Cummins has also indicated maintenance savings as a result of reduced particulate emissions, extending the mileage operated between oil changes to 80,000km using standard E5 mineral oil69. A further advantage to purchasers of vehicles equipped with Euro IV engines is that the predicted engine cost increase of £3 - 4,000 has been drastically reduced due to market pressures and in particular to different approaches to meeting Euro IV standards either by use of additives or by Exhaust Gas Recirculation. Here the bus industry has benefited from competitive pricing in a depressed HGV market.
9.3.5 The alternative approach to additives is Exhaust Gas Recirculation (EGR). EGR devices are installed as an integral part of the engine and require no additional fuel tank or storage. Engines with EGR are reputedly less-fuel efficient (although no less so than Euro III engines) and more costly to purchase, although there are weight advantages. Engines using EGR require a higher degree of cooling, thus larger radiators, and require various additives within the engine’s exhaust system to prevent the build up of soot and other particulates. Those manufacturers who have adopted the EGR system are confident that it should be easily adaptable to Euro V standards.
9.3.6 Neither version of the new technology is limited to new vehicles. Grants exist through the Energy Savings Trust and Transport Energy Clean-Up programme towards the costs of retrofitting particulate filters and devices to reduce NOx
66 AdBlue averages around 45% of the total cost of diesel – at September 2006 it stood at 50p/ltr and is typical added to diesel at the rate of 5% of the volume of diesel fuel. 67 www.soe.org.uk/news/item.php?id=412 68 John Lewis Partnership, figures quoted in www.soe.org.uk/news/item.php?id=557 69 ‘Transport Engineer’, April 2006

©The TAS Partnership Limited ▪ November 07
Study of Cost Issues in Transport Operation: Phase One: Understanding the Trends and Drivers in Cost Inflation: Task Note 2: The Bus Industry ▪ 112
emissions. Options exist under this scheme to retrofit Exhaust Gas Re-Circulation (EGR), or Selective Catalytic Reduction (SCR) Technology. EGR systems typically reduce emissions per vehicle by 40%. It typically costs in the region of £6,000 to fit an EGR system to a bus.
9.3.7 Although the Euro standards do not propose any dates by which all vehicles must be powered appropriately, London’s proposed Low Emission Zone (LEZ) pushes forwards the Euro IV standards with the aim of these being achieved by all vehicles by 2010. In April this year The Martin Higginson Consultancy reported to CPTUK on the proposed cost of re-engineering coaches to meet the standards70. The conversion costs to meet Euro IV standards are quite staggering. Estimates per vehicle are:
• Particulate filter - £3,500 to £5,000 per coach
• Re-power with Euro IV engine - £20,000 - £30,000
• Exhaust adaptation to reduce PM10 and NOx - £10,000
• Total: £33,500 - £45,000 per vehicle
9.3.8 This sum will exceed the value of many older coaches in service. To achieve complete compliance with Euro IV standards by 2010 across the country would cost in the region of £300m. This would be a sum that would be difficult for the coach industry to raise and recoup. It would cause premature retirement of many vehicles which would normally continue giving service for many years, create an inflated demand for new coaches in the years preceding 2010 and cause a subsequent hiatus in new orders. These factors would then be cyclic.
70 Martin Higginson Transport Research and Consultancy, CPTUK, ‘The impact of the proposed London Low Emission Zone on coaches’, April 2006

©The TAS Partnership Limited ▪ November 07
Study of Cost Issues in Transport Operation: Phase One: Understanding the Trends and Drivers in Cost Inflation: Task Note 2: The Bus Industry ▪ 113
Trends in Accident and Insurance Costs 10
CfIT Question 16: What are current trends in accident and insurance costs?
Has the post 9/11 need to recover catastrophic losses in the insurance sector worked through insurance costs?
What are the long term costs of a worsening ‘claims culture' (both passenger claims, worker claims, corporate manslaughter)?
10.1 Insurance Issues
10.1.1 Insurance costs for bus operation have increased very substantially over the last few years. This would appear to have resulted from a number of pressures on the insurance industry such as some high profile international incidents, an increasing “claims culture” in the UK and a reduction in the number of insurers willing to offer policies in respect of bus operation.
10.1.2 Existing bus operators are finding that premiums increase substantially year on year. New entrants to the industry are finding that without a low / no claims record, they are unable to find any insurer willing to take their risk without a disproportionately high initial premium. This issue is particularly onerous for smaller operators and has been a factor (amongst other external factors such as the cost of diesel) in the decision to sell for many operators, even in the case of quite sizeable operations such as the Traction Group and Blue Bus of Bolton.
10.1.3 Buses Magazine noted in November 2005 that the industry was entering a phase of consolidation driven by the above factors, and the magazine further noted smaller operators were more vulnerable to such cost increases than the larger ones. Insurance premium increases were used as one reason for the poor performance of 2 Travel Group in the 2002/3 financial year. Some AIM listed operators felt insurance cost rises would have an adverse effect on future development of business.
10.1.4 Prior to its sale, the Dunn Line Group issued this statement71:
‘’There has been a significant increase in premiums in the general insurance market recently. The Group is required to maintain appropriate insurance. Any significant increase in insurance premiums would adversely affect the financial position of the Group.’’
71 http://dunn-line.com/images/stories/docs/Dunn-Line_final_prospectus.pdf

©The TAS Partnership Limited ▪ November 07
Study of Cost Issues in Transport Operation: Phase One: Understanding the Trends and Drivers in Cost Inflation: Task Note 2: The Bus Industry ▪ 114
10.1.5 The larger groups are far from immune from increases to insurance costs. The Stagecoach annual report for 2003 stated that the group had faced increases in insurance costs (along with increases in labour costs and increased pension costs) implying that profits would have been greater without these particular cost pressures.
10.1.6 Recent change to legislation enables the NHS to recoup up to £10,000 in treatment costs for accident victims where a driver can be proved to be at fault. This cost falls upon the company if one of its employees is blameworthy.
10.2 The Predominant Approach
10.2.1 All of the major transport operating groups either adopt a self-insurance policy (with an insurance policy covering major events) or have comprehensive third party insurance with a high excess waiver. These both have roughly the same effect:
• The company withstands the cost of high frequency, low-value claims.
• The insurance policy covers larger claims.
10.2.2 The Go Ahead Group also has an aggregate annual stop loss policy, effectively putting a ceiling on the total value of uninsured claims.
10.2.3 Insurance and claims allowances appear as ‘contingent liabilities’ in the company accounts. The amounts involved are significant – First Group had insurance reserves in the order of £80m in 2005 and the uninsured claim accrual at Go Ahead Group was £6.8m. These sums are significant – the First Group figure is equivalent to the annual turnover at First Manchester, for example.
10.3 Insurance Premium Increases
10.3.1 In recent years there has been an increase in insurance premia, with operators looking for ways to reduce this cost. One Essex independent operator rejected insurance costs of £150,000 per annum to convert to a policy where they were liable for first the £40,000 of each accident, but the revised policy means they still pay £34,000 per annum. Increasing the insurance excess is now a standard way of reducing premia, but then leaves the onus on the operator to reduce accident claims.
10.3.2 One medium sized local authority owned operator has seen its excess per claim rise six fold from £12,500 to £75,000 between 1999 and 2006. As a result of these large rises in the level of excess waiver, it has been possible to contain increases in the motor premium to 8% (a real term decrease) in the six years to 2006. No information has been offered as to how the overall cost (excess pay-outs plus premium) has changed.

©The TAS Partnership Limited ▪ November 07
Study of Cost Issues in Transport Operation: Phase One: Understanding the Trends and Drivers in Cost Inflation: Task Note 2: The Bus Industry ▪ 115
10.3.3 Table 20 shows changes in bus industry insurance and claims costs over a two year period. As is apparent from the table there was a significant increase in costs in 2004, but in 2005 some areas saw reductions.
Table 20: Bus Industry Insurance Premium Increases during 2004/200572
Year Nationally (%)
London & Home
Counties
Midlands Northern England
South West
England
Wales Scotland
6/2004 22.2 17.4 15.9 29.9 28.1 4.8 15.4
12/2004 30.3 25.5 8.3 40.6 33.8 19.3 29.8
6/2005 -0.6 3.0 0.3 -4.8 -6.5 14.3 5.2
12/2005 -4.3 6.8 -9.8 -9.0 -19.5 0.4 -11.2
10.3.4 Commercial vehicles accounted for some 26% of the motor insurance market in 2002. Comparative statistics for the private and commercial sectors for 2002 are shown below in Table 21. Commercial vehicles make up around 17% of the insured vehicle parc, thus premia for commercial vehicles are around 50% higher than for private motoring. Premia are higher due to fleet vehicles sustaining higher annual mileages in comparison to private cars. Higher purchase costs and larger vehicle sizes thus higher asset value also gives rise to higher premia.73
Table 21: Private and Commercial Motor Business Comparison 200273
Category Private Commercial
Exposure (in Vehicle Years) 21,245,000 4,456,000
Gross earned Premiums (£000) 7,573,814 2,750,747
Average Premium (£) £356.50 £617.30
Claim Frequency (%) 15.7% 19.8%
Average Claim (£) £1,705 £2,157
10.3.5 Although Table 20 appears to support some recent evidence that insurance costs have levelled out, the Association of British Insurers (ABI) has indicated that, in fact, competition in the motor insurance market (and especially for private motor insurance) has artificially depressed premia to the point where the total value of claims is outstripping premia, with significant levels of underwriting. A report by the BBC showed that the situation in 2005 within the insurance industry that for every £1 paid in premium, £1.20 was being paid out in claims. If true, this situation is not sustainable and given the move of major insurers Churchill and Direct Line into common ownership and some
72 Source: CPT Costs Index. www.cpt.org.uk 73 Source: Association of British Insurers

©The TAS Partnership Limited ▪ November 07
Study of Cost Issues in Transport Operation: Phase One: Understanding the Trends and Drivers in Cost Inflation: Task Note 2: The Bus Industry ▪ 116
other consolidation in the business, premia might be expected to rise to overcome this.
10.3.6 Increased globalisation of the insurance market leads to widespread effects from major international disasters, particularly in the developed world. Hurricane Katrina is estimated to have cost up to $200bn in insurance claims.
10.4 Insurance Costs Containment
10.4.1 One way that operators have countered the trend towards increased insurance costs is through the fitting of CCTV, and black box technologies to vehicles as well as providing enhanced staff training.
10.4.2 There is a role for the introduction of CCTV both as a means of reduction of insurance costs through their use in combating claims, establishing liability for claims and also defence of fraudulent claims. This has become necessary with the development of ‘no-win, no-fee’ accident claim firms in the past few years. Cyberlyne Communications markets its CCTV cameras with this in mind, putting a figure of hundreds of thousands of pounds as the cost to the transport industry in out of court settlements:
• One operator74 claims to have recouped in eighteen months the money which would have otherwise been spent on spurious insurance claims by equipping the entire fleet with a CCTV system.
• Arriva launched counter-investigations in Liverpool after discovering that only around 20% of 400 compensation claims lodged by the now defunct Accident Group were genuine. The costs of the claims were estimated to run into many thousands of pounds75. In one case an out of service Arriva bus in Liverpool was involved in an accident, with only the driver on board, which then prompted 22 injury claims from people who claimed to have been on board the bus at the time of the accident.
• A First Manchester bus was allegedly involved in an accident, with five people making a claim for personal injury, but examination of the vehicle’s CCTV cameras showed no accident had taken place.
10.4.3 As the trend towards no win, no fee legal representation increases, so too has the incidence of trivial and spurious insurance claims. The transport industry is particularly prone and it is costing the industry hundreds of thousands of pounds, mainly in out of court settlements. Apart from the cost of road accidents themselves, (in which front facing CCTV cameras help to provide valuable evidence of blame and therefore reduce insurance costs) false claims from members of the public are increasing.
74 From www.cyberline.co.uk – the operator’s identity is not revealed. 75 http://www.telegraph.co.uk/money/main.jhtml?xml=/money/2003/06/08/ccacc08.xml

©The TAS Partnership Limited ▪ November 07
Study of Cost Issues in Transport Operation: Phase One: Understanding the Trends and Drivers in Cost Inflation: Task Note 2: The Bus Industry ▪ 117
10.4.4 As a means of reducing the 50,000 injury claims received by Arriva in recent years, the company has introduced ‘black boxes’ which record erratic and sudden movements aboard the vehicle. Fitted to around 115 buses in Kent the system cost around £600,000 coupled to CCTV cameras and panic alarms which can be used in an emergency.
10.4.5 The use of CCTV and other electronic technology along with measures such as undertaking driver retraining programmes and teaching defensive driving techniques have led to reducing insurance and claims costs for some operators.
10.4.6 East Yorkshire Motor Services’ annual report for 2005 shows that the reduction in accident claims following the above approach earned the company an insurance rebate in that year. A large urban operator has seen claim levels remain relatively constant after a range of measures (included fitting CCTV) were introduced.
10.5 Employers Liability Insurance
10.5.1 Employer’s Liability Insurance is a compulsory requirement for Small and Medium sized enterprises. Recent years have seen a dramatic increase in premia across all sectors of industry. As examples - a care home with a turnover of £300,000 saw their annual premium rise from £2,000 to £6,000 which resulted in temporary closure of the home until alternative insurance was found. The National Federation of Roofing Contractors showed that on average in a two person business a typical premium rose from £595 in 2001, to £1,600 in 2002 to £2,050 in 2003. Their 800 members spent £9m in 2001, £17m in 2002 and £27m in 2003 on Employers Liability premia. It could, of course, be argued that the roofing business might be especially prone to EL claims but nonetheless this is representative of the trend in premium payments generally.
10.5.2 Regardless of a positive no claims history, and excellent records with regard to Health and Safety, premia have increased for businesses in the UK. In part this is also driven by the growth in ‘claims culture’. In the bus industry one large local authority owned company reports a tripling of its Employers Liability Insurance premium in five years, and is now nearly twice the size of the motor premium.

©The TAS Partnership Limited ▪ November 07
Study of Cost Issues in Transport Operation: Phase One: Understanding the Trends and Drivers in Cost Inflation: Task Note 2: The Bus Industry ▪ 118
10.5.3 There are two main causes for the recent rises in EL and public liability premiums:
• The general insurance market. General insurance is sold, like many products and services, in a highly competitive marketplace. It therefore experiences cyclical price movements. It is currently going through one of its regular upturns in prices following a long period of lower prices and underwriting losses. However, a number of factors have recently combined to make the current phase of rising prices more pronounced than in previous cycles.
• The costs of compensation. Liability insurance is the main way of providing compensation for damages for accidents and occupational disease. Changes to personal injury law are causing the cost of claims rapidly to increase. This inevitably requires liability insurance premiums to rise to fund the extra compensation. The average cost of an EL claim has risen 100% in five years76.
76 http://www.abi.org.uk/Display/default.asp?Menu_ID=1140&Menu_All=1,946,1140&Child_ID=534

©The TAS Partnership Limited ▪ November 07
Study of Cost Issues in Transport Operation: Phase One: Understanding the Trends and Drivers in Cost Inflation: Task Note 2: The Bus Industry ▪ 119
Base Composition of Apparently Fixed Costs
11
CfIT Question 17: What is the base composition of apparently ‘fixed costs’?
Rail track access costs have labour, material and capital elements. What are the trends?
Do the current TOC track access and government funding of Network Rail create perverse incentives? (For example, it could be argued that TOCs have relatively little to gain by simplifying infrastructure or reducing renewals costs because these costs are effectively fixed and remote).
Network Rail is responding to ORR with respect to network condition and its spending is underwritten by the Treasury– does this reflect cost optimisation)?
11.1 Fixed Costs
11.1.1 As the industry has progressively reduced its levels of management, supervision and administration since the mid 1980s, so these costs have fallen. This has been assisted in the administrative sector by the introduction of new technology, the rapid falls in the cost of acquiring and operating equipment such as computers and telephones and the ability to centralise accounting and payroll systems.
11.1.2 Our estimates of overhead costs show a significant reduction over the post-privatisation period. The rationalisation of management structures, depots and the closure of central works complexes across the country achieved significant real-term cuts. There have also been significant cost reductions as a result of the closure of travel office or enquiry facilities, although the negative effect of this measure upon revenue is unquantified.
11.1.3 It is also open to question whether some depot closures have actually led to a significant overall cost reduction as, although undoubtedly reducing overhead costs, there are significant ongoing direct costs resulting from increased light mileage and higher rates of staff turnover.
11.1.4 Current evidence suggests that, across the industry as a whole, overhead costs are unlikely to fall further. In most cases these savings would appear to have already been maximised and it would not seem prudent to assume that these levels of savings will continue.
11.1.5 A central assumption would be that such costs should now be assumed to rise at least in line with inflation. Indeed, there is some evidence that some overhead costs may be increasing again. Factors might include:

©The TAS Partnership Limited ▪ November 07
Study of Cost Issues in Transport Operation: Phase One: Understanding the Trends and Drivers in Cost Inflation: Task Note 2: The Bus Industry ▪ 120
• Continuing increases in property costs (rent, rates, stamp duty etc).
• Continuing increases in insurance costs – particularly Employers Liability Insurance.
• Increases in utility costs – utility prices have been increasing dramatically in the past year.
• Health and Safety Issues.
• The need to replace or rebuild older depot buildings.
• Increased ‘group HQ’ type costs as the industry consolidates.
11.1.6 To counter the trend of cost increases, technological developments and other changes in working practices may help to mitigate the effects. At one stage the industry’s ability to raise cash by selling lucrative depot or bus station sites was an important income stream to offset against overhead costs, but such opportunities must now be considered limited.

©The TAS Partnership Limited ▪ November 07
Study of Cost Issues in Transport Operation: Phase One: Understanding the Trends and Drivers in Cost Inflation: Task Note 2: The Bus Industry ▪ 121
Trends in Capital Costs 12
CfIT Question 18: What are trends in capital costs?
Is the (public) transport sector benefiting from the reduction in manufacturing costs associated by globalisation? There seems to be little evidence of this. If so, this would be another divergence between general and transport inflation. If not, why not?
12.1 New Vehicle Cost
12.1.1 It is difficult to generalise about the trend in new vehicle cost. The price of some comparable new vehicles has increased significantly over the last several years, although we only have limited data. In one case we can show a £30K increase for a similar chassis / body combination over two years, but on comparing prices stated in the trade press since 1995 and adjusting for RPI it appears that some types are now less expensive than in 1995 in real terms. For example the price of Wilts & Dorset’s Mercedes Citaros new in 2006 was £130,000, £30K less than the price in real terms for the early Dennis Lance low floor models.
12.1.2 It must be stressed, however, that there is now a much greater variation in the standards of new vehicles – ranging from ‘basic’ to Blazefield’s high quality leather-seated vehicles. Non-standard vehicles also attract a premium price. The electrically-powered vehicles on Nexus’ ‘Quaylink’ demonstration project cost £250,000 each. It does appear that the more standard the product, the better the price – effectively this does reflect the situation in the motor trade.
12.1.3 There is evidence of at least two of the big groups, First and Stagecoach, being able to positively influence vehicle price as a result of placing large group-wide orders for standard group-specification vehicles. From prices quoted in ‘Transit’ for standard Dart SLFs for Stagecoach Merseyside it would seem that these were obtained for a little over £80K each77. Indeed, Lothian Buses queried a significant difference in price offered for similar vehicles to those being delivered to Stagecoach at the same time78. This can be seen as a bus industry equivalent of fleet car purchases where firms obtain a large discount for purchasing fleets of company cars. Conversely, Arriva and Go Ahead appear to continue to order small batches of vehicles of different types for individual subsidiaries.
12.1.4 More importantly the actual vehicles ordered as new buses have changed. On the double deck side the standard over 20 years ago was the Leyland Olympian, which had a (low) step entrance and was functional but was not equipped with the same features as the double deck buses entering service
77 We are, however, wary of prices quoted in the trade press as Stagecoach’s similar Darts for Carlisle appeared to cost £102K! 78 Quoted in ‘Transit’

©The TAS Partnership Limited ▪ November 07
Study of Cost Issues in Transport Operation: Phase One: Understanding the Trends and Drivers in Cost Inflation: Task Note 2: The Bus Industry ▪ 122
today. Today’s double deck buses are low floor, incorporate space for wheelchairs or buggies, have longer, wider access to the top deck and have more comfortable seats. Additionally on the engineering side the engines meet or exceed the latest Euro standards (but at the cost of fuel efficiency, as noted in section 9). Similar upgrades in vehicle specification are evident over the years relating to single deck buses. The Leyland Lynx of 20 years ago cannot compare to today’s low floor models.
12.1.5 Minibuses were ordered in large number in the mid 1980s and new vehicle purchases remained numerous up to the early 1990s although with a trend toward larger and more sophisticated models. At the time some operators, including a few large operators, had converted many of their major services, previously operated with double deck buses, to minibuses on higher frequencies, not always successfully. While this may have made economic sense in some cases at the time (with minibus drivers being paid minimum wages in an era of high unemployment and minibuses costing a fraction of the price for full size buses) it quickly became a less viable policy and consequently many minibuses were fairly rapidly either indirectly or directly replaced with single deck vehicles or midibuses.
12.1.6 The initial van-derived minibuses were very low cost and low quality. These variants of commercial vehicles remain in service today in the community transport sector but have largely disappeared from conventional bus operation except with some smaller operators. Even when minibus operation has continued the vehicles currently used are of much higher quality, with the replacement of second generation minibuses (such as Metroriders or Mercedes Varios) by Optare Solos or Dennis Dart MPDs now being common.
12.1.7 As prices for Optare Solos are currently in the region of £80,000 this is a significant increase on the price of the second generation minibuses, which when new often cost approximately £50,000 or the price under £10,000 paid for the original Ford Transit minibuses, even allowing for inflation over 20 years.
12.1.8 A further factor which has increased the cost of new vehicles is the reduction of seating capacity in order to achieve low floor layouts with wheelchair and buggy spaces. It is not uncommon now to find 11 metre long low floor double decks with a seating capacity much lower than that found in a conventional 9 metre double deck79. Some recent low floor single decks, in particular those which have two doors, have very low seating capacity80 – akin to the level of a conventional midibus. Thus operators are faced with the need for much bigger and more expensive buses to provide the same seating capacity as older vehicles.
79 The lower deck often fares particularly badly, some London specification double decks seat only 17 downstairs, for example. 80 For example, the Crawley Fastway single decks have only 34 seats.

©The TAS Partnership Limited ▪ November 07
Study of Cost Issues in Transport Operation: Phase One: Understanding the Trends and Drivers in Cost Inflation: Task Note 2: The Bus Industry ▪ 123
12.2 Vehicle Depreciation
12.2.1 Depreciation charges will vary for the following reasons:
• Company policy on depreciation.
• Changes in depreciation policy consequent upon changes of ownership.
• The age of the asset base.
• The original cost of the asset base.
• The extent to which fleets and other assets are obtained on operating leases, thus not being held on company balance sheet (a strong trend recently, particularly in London).
12.2.2 As a consequence of these factors, one would have expected depreciation charges to rise over recent years, following heavy investment in new assets, the progressive updating of fleets, and the consequent increase in the original purchase price of assets on company balance sheets. This expectation is borne out by analysis of spending in the Bus Industry Monitor database.
12.2.3 Much of the investment in the late 1990s was a ‘catch up’ against delayed replacement of assets in the pre and post privatisation period (see Figure PP). As a result, the average age of the British fleet by 2004 had moved below the Government target of eight years at 7.1 years, but had grown again to 7.8 years by March 2006 as a result of a fall off in new vehicle deliveries. The reduction in spending – and hence slower growth or stabilisation of depreciation charges – might therefore have been expected. This will be cyclical; the large intake of buses in the late 1990s will all fall due for replacement around 2013, fortunately just as operators are preparing for full DDA compliance.
12.2.4 On the other hand, the Bus Industry Monitor fleet analysis for May 200481 suggested that some 6,100 vehicles in the current fleets were overdue for replacement on the basis of assumed vehicle life. This represented some 16% of the total vehicles in the fleets analysed. Replacement with new on a like for like basis at the time would cost an estimated £800m. In practice, much of this is being dealt with by cascading of vehicles from London, with a consequent reduction in depreciation charges based on the acquisition of a five-year old, low-mileage but heavily worked asset as opposed to a brand new one.
12.2.5 Figure PP below shows the pattern of first licensing of British buses by year since 1980. The negative effects upon new bus deliveries of the uncertainties surrounding deregulation and privatisation are quite clear in the low numbers
81 Bus Industry Monitor 2004 Volume 3, Capital Investment and Fleet Analysis, Table 7

©The TAS Partnership Limited ▪ November 07
Study of Cost Issues in Transport Operation: Phase One: Understanding the Trends and Drivers in Cost Inflation: Task Note 2: The Bus Industry ▪ 124
of new buses delivered in the years both before and after 198682. The peak in deliveries in the last three years is almost certainly due to the ‘London effect’ with large numbers of new vehicles entering service to aim for 100% low-floor operation, although there has been significant investment in other areas – Arriva in the Medway Towns, First in Manchester and Stagecoach in Carlisle all being examples. Figure PP also shows significant numbers of vehicles built before 1990 which are still licensed.
Figure PP: Average Age Profile and Year of Licensing for British Buses
0
1
2
3
4
5
6
7
8
9
10
1980
1981
1982
1983
1984
1985
1986
1987
1988
1989
1990
1991
1992
1993
1994
1995
1996
1997
1998
1999
2000
2001
2002
2003
2004
2005
Nu
mb
er
Reg
iste
red
or
Lic
en
sed
(0
00
's
Total first registered Licensed in 2005
12.2.6 Against this, the prospect of a continuing fall in patronage and increased operating costs might depress profit levels to an extent that investment spending is reduced to the minimum extent compatible with achievement of DDA compliance by the due date or perhaps even below that level. The DfT’s own figures, illustrated in Figure PP above suggest that the fleet will not achieve full accessibility by 2017 unless the rate of new deliveries exceeds the average delivery rate over the six years to 2005. Given the slowing down of the new vehicle market for London, this level of replacement seems unlikely to be sustained over the subsequent twelve years, although there are likely to be further cascades of (low floor) vehicles from London during that period.
12.2.7 The provision of school transport has seen an increase in investment in recent years with the introduction of ‘yellow bus’ schemes using purpose-built new vehicles. The nature of these buses often means that they are unsuited to
82 Many NBC subsidiaries in the run up to privatisation had considerable unspent reserves set aside for new vehicle purchases. In most cases these sums reverted to the government as there was little point in the companies’ buyers purchasing capital.

©The TAS Partnership Limited ▪ November 07
Study of Cost Issues in Transport Operation: Phase One: Understanding the Trends and Drivers in Cost Inflation: Task Note 2: The Bus Industry ▪ 125
other types of work. If the schemes are to continue then a vehicle replacement programme must be considered. The likely sale value of life-expired yellow buses is as yet unknown.
12.3 Coaches
12.3.1 The coach industry faces similar difficulties. A 2005 survey70 of coach operators who send vehicles to London established the age profile illustrated in Figure QQ, which indicate an average coach age of around 8.3 years. This is approximately one year older than the average bus at the time. However, the key here is that this survey involved only CPT members who sent coaches to London. The large number of operators who function purely locally on school work and short-distance private hire using much older vehicles will be omitted from the analysis.
12.3.2 To meet the decreed date of 2020 for full accessibility standards for coaches (see Table 18) is going to be difficult with this age profile, particularly as the number of coaches currently equipped to offer full disabled access is very low – new coaches have only needed to be wheelchair accessible since 2005 and few accessible coaches were built prior to that date. If the age profile of coaches shown persists in 2020, there will be a need to replace 13% of the national coach fleet over and above the normal rate of replacement. All new full size buses built since 2001 have been fully accessible. The coach fleet, therefore, has much work to do to catch up.
Figure QQ: Age Profile of Coaches in 200570
0
5
10
15
20
25
30
<2 yrs 2-4 yrs 5-7 yrs 8-11 yrs 12-15 yrs 16-20 yrs >20 yrs
Age of Vehicle
% o
f Fle
et

©The TAS Partnership Limited ▪ November 07
Study of Cost Issues in Transport Operation: Phase One: Understanding the Trends and Drivers in Cost Inflation: Task Note 2: The Bus Industry ▪ 126
12.4 The Second-Hand Market
12.4.1 Provision for capital expenditure does not only affect the larger groups buying new vehicles, but has a significant impact upon the smaller operator dependent upon contract or school work using secondhand vehicles. There is evidence that some sectors of the secondhand market may suffer adverse trends in prices in future.
12.4.2 Currently, the disposal of mid-life step-entrance double decks from major operators (chiefly London operators and Dublin Bus) has supplied the secondhand market with good quality high-capacity vehicles and has reduced the premium prices which secondhand double decks once attracted. However, these are among the last such vehicles and the trend is likely to revert to premium prices for double decks in the approach to 2017 as the major groups retain their first-generation low floor vehicles. Although there are currently no plans to extend full DDA compliance to school buses, after 2017 non DDA compliant vehicles would be limited solely to ‘closed door’ school operations and could not be used on any other work.
12.4.3 Secondhand low floor vehicles are already attracting a price premium by comparison with their step-entrance equivalents. A price differential of £20,000 between basically similar models is not unusual. A recent edition of ‘Bus & Coach Buyer’ contained two seven-year-old low floor heavyweight single decks at £52,000 each – probably over 60% of their cost new.
12.4.4 A cost increase incurred by the smaller operator (and passed on to their contract holders) is the need to provide bigger vehicles to offer the same seating capacity. Education authorities typically look to 75 or 77-seat double decks and 53-seat single decks to satisfy school transport needs. Yet low floor double decks typically have a seating capacity in the upper sixties and modern coaches even at 12-metres long typically seat only 49. Thus there is an inherent incompatibility between the seating capacity of modern vehicles and that which is sought by education authorities.
12.4.5 One method of overcoming these problems has been to begin a programme of converting mid-life coaches to 70-seat vehicles using 3+2 seating, primarily for the school market. But these conversions also come at a price. One dealer recently advertised an eight-year-old Volvo B10M conversion at £94,950 – or monthly payments of £1,495, which equates to around £94 per schoolday purely for the vehicle purchase.
12.5 Buy or Lease?
12.5.1 Any operator has the option of purchasing or leasing vehicles and finance deals are available enabling operators to acquire vehicles under a hire purchase agreement, particularly appropriate for smaller operators.

©The TAS Partnership Limited ▪ November 07
Study of Cost Issues in Transport Operation: Phase One: Understanding the Trends and Drivers in Cost Inflation: Task Note 2: The Bus Industry ▪ 127
12.5.2 Understandably, the major companies tend to purchase vehicles outright although some vehicles can be leased depending upon available finance arrangements – for example, the Stagecoach Group leased a number of new vehicles in the 1996/7 period.
12.5.3 Previously, leasing deals covered the whole designated vehicle life. Now typically the lease period is much shorter than vehicle life, giving the lessor a return on capital at a much earlier stage. One dealer is currently offering new Optare Solo ‘Slimline’ minibuses for £83,000 new or rental at £289 per week. The rental charge is equivalent to vehicle purchase over 5½ years. The vehicle’s life is probably eight to ten years. This method can result in mid-life vehicles becoming available on the secondhand market.
12.5.4 Dealers or leasing companies can often include an option to buy at the end of the lease period, or ownership of the vehicle may even default to the operator at the end of the lease period (the latter option was favoured by NBC for most vehicles it took on lease).
12.5.5 Smaller operators often simply do not have the cash reserves to fund the purchase of new or secondhand vehicles outright. They are faced with acquisition of vehicles through hire purchase agreements or by vehicle rental. There has been recent growth in the vehicle rental sector. With a maximum contract length of five years, this is often the most viable option for smaller operators to supply new low-floor vehicles for local service contracts.
12.5.6 Finance arrangements come, of course, with an associated cost. A dealer is offering a 70-seat conversion of a Dennis Javelin coach for £54,950 or for 10% deposit and 60 monthly payments of £965. Thus the total cost under finance arrangements is £63,395 or 15.4% higher than the initial purchase price. The charges applied to rates of finance tend to track the base rate for interest, thus future patterns are likely to follow changes in the base rate for lending.
12.6 Motoring Comparisons
12.6.1 In Figure G in section 3.1 we showed how the purchase price for new cars had declined steadily in real terms since 1987. Yet as DfT figures83 show this still leaves the average age of Britain’s cars at almost six years. This appears high given the comparative life expectancy of cars when compared to buses and given the Government’s target of achieving an average bus age of eight years.
12.6.2 Figure RR shows the number of new cars licensed for the first time for every year since 1980. Despite a notable downturn in 1991/1992, new cars registered for the first time reached their highest level ever in 2001 and 2002 and numbers have eased only slightly since then.
83 Vehicle Licensing Statistics 2005 from http://www.dft.gov.uk/stellent/groups/dft_transstats/documents/page/dft_transstats_611684.hcsp

©The TAS Partnership Limited ▪ November 07
Study of Cost Issues in Transport Operation: Phase One: Understanding the Trends and Drivers in Cost Inflation: Task Note 2: The Bus Industry ▪ 128
Figure RR: Average Age Profile and Year of Licensing for British Cars
0
500
1,000
1,500
2,000
2,500
3,000
1980
1981
1982
1983
1984
1985
1986
1987
1988
1989
1990
1991
1992
1993
1994
1995
1996
1997
1998
1999
2000
2001
2002
2003
2004
2005
Nu
mb
er
Reg
iste
red
or
Lic
en
sed
(m
)
Total first registered Licensed in 2005
12.7 Cost Increases in Highway Infrastructure Projects
12.7.1 In recent years the cost of road building projects has increased significantly. Major schemes have seen huge escalation in construction costs, but have not in general received the negative publicity suffered by cost overruns for rail projects. As examples purely from one region – the South West:
• The A354 Weymouth Relief Road, bypassing a highly congested section into Weymouth was projected to cost £46.95m in 2002, which had risen to £100m in 2005.
• The A303 tunnel building project at Stonehenge has seen an initial cost estimate rise from £183m in 2002 to £470m in 2005. The increase is such that the Stonehenge project is in danger of being abandoned.84
• The A30/A303 in the Blackdown Hills, on the Somerset/Devon border has long been the subject of plans to turn two way sections into dual carriageway. The estimated cost is currently £337.9m, and the alternative option, to dual the A358 from Ilminster to Taunton is not favoured by the South West Regional Authority.
84 http://news.bbc.co.uk/2/hi/uk_news/england/wiltshire/4699477.stm

©The TAS Partnership Limited ▪ November 07
Study of Cost Issues in Transport Operation: Phase One: Understanding the Trends and Drivers in Cost Inflation: Task Note 2: The Bus Industry ▪ 129
• Further down the A30, plans to convert the section across Goss Moor to dual carriageway will now cost £69m according to latest estimates from Cornwall County Council.
12.7.2 Table 22 below shows details of various road scheme proposals and associated cost increases.
Table 22: Major Road Schemes and Estimated Cost Increases85
Scheme Originally
Approved Budget (£ million)
Latest Estimated Cost
(£ million)
M25 J12-15 Widening 120 127
A47 Thorney Bypass 27 28
A66 Temple Sowerby and Improvement at Winderwath 39 40
M40/A404 Handy Cross Junction Improvement 14 13
A66 Greta Bridge to Stephen Bank Improvement 9 10
A66 Longnewton Junction 8 12
A57/A628 Mottram - Tintwistle Bypass 103 106
A590 High and Low Newton Bypass 22 35
A2 Bean - Cobham Phase 2 101 120
A2/A282 Dartford Improvement 72 122
St Albans City Centre Improvements 1.8 4
12.7.3 Other than the final scheme listed above, such major schemes are not generally funded by local authorities, nor are they particularly geared to bus priority measures. There is, however, a precedent for a bus-related scheme. The Crawley Fastway project was originally budgeted at £23m but costs overran by some £6m.
12.7.4 There is no reason to doubt that similar percentage overruns apply equally to smaller schemes, such as bus lanes, stops and raised kerb installation. One of the chief areas of uncontrolled expense relates to the cost of moving or linking to utilities, this is an area to which bus infrastructure is particularly prone as much of such work is at or near the kerb. West Sussex County Council reported one bill for work by a utility company increasing by over 100% compared to its original estimate.
12.7.5 This has been a major area of expense related to the installation of high quality bus shelters with lighting and real time information. Connection to the electricity supply can be a disproportionate cost. This partly, but not wholly explains variations in cost reported by the National Audit Office86, of between £2,200 and £8,500 for local authorities to erect and equip a bus shelter. We
85 Sourced from www.roadblock.org.uk 86 www.nao.org/publications/nao_reports/05-06/0506677es.htm

©The TAS Partnership Limited ▪ November 07
Study of Cost Issues in Transport Operation: Phase One: Understanding the Trends and Drivers in Cost Inflation: Task Note 2: The Bus Industry ▪ 130
say partly, because the same report also gave cost variations between £21 and £400 to erect a bus stop pole.
12.7.6 Some local authorities, particularly in urban areas, have tried to ameliorate the issue of inflated costs by installing solar-powered lighting, deleting the need for connection to the electricity supply. Wiltshire County Council has avoided fluctuation in costs by signing a call-off contract for supply of bus shelters and has developed set standards for bus stop design, siting and structure of associated kerbs.
12.7.7 In a more radical approach, Plymouth City Council has signed a deal with advertising firm J C Decaux to sign over all bus shelters to that organisation. As part of the agreement J C Decaux is to invest £2m in new shelters and agreed to maintain specified levels of cleaning and repair in return for exclusive advertising rights.
12.7.8 Real Time Information systems have added a further level of cost for local authorities (and often operators too in terms of equipment fitted on vehicles). Although the start-up costs are often funded from capital grants or capital expenditure, ongoing expenses must come from revenue budgets.

©The TAS Partnership Limited ▪ November 07
Study of Cost Issues in Transport Operation: Phase One: Understanding the Trends and Drivers in Cost Inflation: Task Note 2: The Bus Industry ▪ 131
Cost of Capital 13
CfIT Question 19: What is the cost of capital?
What are investors’ demanding as returns for equity, bonds and other forms of debt? Is the commercialised part of the transport sector able to offer competitive returns?
13.1 Current Investment Climate
13.1.1 In the current investment climate there are many potential choices for investors. Investors could be either the traditional individuals with assets or the increasing number of funds - specific investment funds (which generally group together a number of smaller investors) or alternatively pension funds. The increasing emphasis on private pension provision (whether individual or sponsored by employers) at the expense of state pension provision has also created significant new opportunities for investment.
13.1.2 There is a wide and increasing choice of vehicles for investment from the diverse range of investors. Property is currently among the most popular choices at the moment, due to the high rate of return experienced by this sector in recent years. In addition to individuals purchasing property for their own use, there has been widespread purchase of property for investment, with a view towards short to medium term profit. In some cases this has created reduced investment in traditional asset-creating vehicles such as stocks and bonds.
13.1.3 Nevertheless stocks and bonds are still popular investment choices for individuals and both investment and pension funds. Each type of investment has its risks and rewards and there is normally a link in that the investments with the highest risk potentially bring the greatest potential rewards.
13.1.4 The role of dividends or interest (an annual return on the investment) as opposed to the gain in the price of the investment is more important in the UK than in some other countries. This is likely to be due to historical factors but it remains an important consideration. This consequently has an impact upon almost all PLC companies to produce high dividends per share and consequently also impacts upon the day to day operation of the company where short term profits in some cases could be considered more important than longer term growth.
13.2 Cost and Types of Capital
13.2.1 In the simplest form the cost of capital refers to the cost of acquiring assets other than through reinvestment of profits from normal business activities. For example, the interest rate to purchase new buses may be 7% and this could be considered a cost of capital. However, it is likely that the actual interest

©The TAS Partnership Limited ▪ November 07
Study of Cost Issues in Transport Operation: Phase One: Understanding the Trends and Drivers in Cost Inflation: Task Note 2: The Bus Industry ▪ 132
rate for assets could change, depending upon the type of asset purchased and the size and relative financial position of the company. As is the case for personal finance the lowest rates are likely to be offered to the largest bus operators, with smaller operators and more recently established operators having to pay higher rates to access the same assets. As an example, Stagecoach quotes borrowing arrangements between 0.4% and 0.8% above the Bank of Scotland base lending rate in its Annual Report.
13.2.2 Other forms of capital from commercial sources are likely to include overdraft facilities, which are also charged at variable rates according to the size of the business and the turnover.
13.2.3 As an alternative to using loans to finance capital, commercial transport operators have the option of issuing bonds, which have a fixed annual interest rate and are paid back over a number of years. Bonds are traded on their own market and can go up or down depending on the current performance and the reputation of the company. In the commercial transport sector bonds are only likely to be issued to the largest companies (generally those listed on a market) but do not appear to be a major component of corporate finance for the transport operators that we have examined.
13.2.4 Bus operators which have plans for expansion have considered raising capital through the different markets, mainly the Alternative Investment Market (AIM) and the conventional stock markets as Public Limited Companies (PLCs). Although more geared in size to most bus companies the AIM has not proven to be a popular choice for bus operators, and those who have used this means of raising capital have often not been successful, notably 2 Travel in South Wales. This may have discouraged future investment in bus operators by AIM investors. There have been exceptions, for example Southern Vectis traded successfully on the AIM for a number of years before its acquisition by the Go Ahead group. This partly allowed its expansion into other activities away from its traditional bus-operating business. Tellings Golden Miller also trades on the AIM currently.
13.2.5 The traditional stock market flotation has been used successfully to transform the largest groups into PLCs. This has been undertaken by Arriva, Stagecoach, First, National Express, and Go Ahead. However, in spite of being PLCs some companies retain a significant proportion of shares held by the company founders, who, in some cases, still have effective control of the company.
13.2.6 Although entry to the share market could potentially raise a significant amount of capital (generally into the millions of pounds) it brings its own burdens. Once the company becomes listed there is greatly increased administration as annual reports need to be issued, and the company needs to deal with a myriad of investors, from the very small to large.
13.2.7 More importantly the focus of the company inevitably changes, as the primary goals of the enterprise are focused in three areas:

©The TAS Partnership Limited ▪ November 07
Study of Cost Issues in Transport Operation: Phase One: Understanding the Trends and Drivers in Cost Inflation: Task Note 2: The Bus Industry ▪ 133
• Maintaining profitability at a sufficiently high level.
• Maximising dividends.
• Increasing the share price.
13.2.8 The latter is often the most important as a high share price is seen to prevent hostile takeovers, another potential hazard of being listed on the stock exchange. Go Ahead has already had such an approach.
13.3 Rates of Return
13.3.1 The rate of return expected by investors varies greatly by the type of investment. As noted above, the rates of return are generally linked to the relative security of the investment, with the safest bank account generally having low rates of return (3%) with an almost certain assurance of being able to recover the money.
13.3.2 On the other hand investments that are regarded as slightly more risky potentially have a higher rate of return. For example, most bonds have interest rates in the region of 7% and the rates of return of stocks and alternative investments are never known, but could potentially be very good. On the other hand the companies could go out of business with the consequent loss of most of the capital invested.
13.3.3 Most PLC transport operators seek to make a 15% margin on their commercial activities. In some of these this has become a principal target for the subsidiary companies (or even for each cost centre (depot)) to attain, and trying to meet this target has led to some actions that have reduced the market for public transport.
13.3.4 However, in terms of the goal of operating at a 15% margin this almost never translates into a 12 - 15% return for the investors on an annual basis. Transport companies we have studied generally pay out a quarter of their operating profits in dividends so that the annual return in terms of dividends turns out to be approximately 3% of revenue. As an example of dividend to share price ratio, recent dividends translate into approximately 3% of the current share price for Arriva and 4% for National Express.
13.3.5 In industry generally, profit margins vary. A profit margin of 7%, for example, is considered low, yet when this is the performance of a well known established group this is considered acceptable. At the other end some companies regularly have margins of 22% to 25%. There is, however, continual pressure on the operating subsidiaries to improve margins year-on-year. This is often the cause of political opposition, particularly from PTEs who

©The TAS Partnership Limited ▪ November 07
Study of Cost Issues in Transport Operation: Phase One: Understanding the Trends and Drivers in Cost Inflation: Task Note 2: The Bus Industry ▪ 134
accuse the companies of profiteering87. The PTEs, however, have maintained political opposition to bus deregulation and privatised companies per se from the outset. Local politicians often misunderstand – either wilfully or through ignorance – the nature of, and the need for, enterprises to make a profit.
13.3.6 In this context the goal of 15% for the major bus operating groups appears reasonable, particularly as the five listed groups are relatively new to the stock exchange, having been listed within the last fifteen years. While this is also true of many technology firms, the transport firms lack the glamour of their technology counterparts and therefore there is some pressure on them to consistently produce margins that are considered ‘acceptable’ to financial commentators to justify continued investment.
13.3.7 Transport operators are attractive to some investors due to being cash rich – there is a constant turnover of cash with little variation in level and return on capital employed is high. Also, public transport operators’ revenue in the deregulated commercial world comes either from an instant or advance sale – there is no delay between production and sale. Conversely, however, an unsold seat remains unsold – it cannot be held in store pending an increase in demand.
13.4 Is this Achievable?
13.4.1 The key question for the bus operating groups is whether, in the long term, the 15% margins currently considered necessary to attract and retain investment are achievable.
13.4.2 It could be more advantageous in the longer term to be part of multi sector group which does not specialise as much in any given area. The largest of these currently active in public transport is the French based Veolia, which only has around 17% of its business within the transport sector. However, its profits from transport are less, with only around 7% of these coming from the transport sector. Overall the margin of Veolia last year was 7%, lower than the UK groups. If only its transport activity is considered the margin would be lower again. But largely, Veolia stands little revenue risk; it merely acts as operating agent in a franchised world and the progress of its recently acquired British business in the deregulated world will be moot.
13.4.3 From this example there appears to be a difference in expectations between UK and overseas groups and also between multi sector groups and those which are mainly concerned with transport.
87 An example of this comes from the ‘Sheffield Star’ of 21 June 2006: Liberal Democrats have slammed First for "taking advantage" of passengers in Sheffield. They say the firm raked in a £107 million profit nationally in the last financial year. Lib Dem leader Coun. Paul Scriven said: "The bus users of Sheffield are being held to ransom by FirstBus. These latest above inflation rises, just a few weeks after the last hikes, confirm our view that FirstBus are exploiting their position. Claims of increased costs don't stack up. Nationally they have made £107m, part of which has been paid for by the people of Sheffield. We now know it's profit first, passengers second."

©The TAS Partnership Limited ▪ November 07
Study of Cost Issues in Transport Operation: Phase One: Understanding the Trends and Drivers in Cost Inflation: Task Note 2: The Bus Industry ▪ 135
13.4.4 The expectations for margins and the return on investment demands also appear to be different for smaller groups as well as operators still owned by management, employees or local councils. The range of margins is approximately from 0 to 10% for those still owned by local councils (with one or two larger than this) while for smaller groups the range is again from 0% up to 18%. A sustainable future for any company with a 0% margin must be called into question.
13.4.5 Clearly there is a requirement for reasonable margins for reinvestment and satisfying investors, but the requirement for margins appears to be highest in the UK based PLC model by comparison with any of the other ownership models examined.


©The TAS Partnership Limited ▪ November 07
Study of Cost Issues in Transport Operation: Phase One: Understanding the Trends and Drivers in Cost Inflation: Task Note 2: The Bus Industry ▪ 137
Effect on Financial Outputs within the Various Scenarios
14
CfIT Question 20: What is the effect on financial outputs within the various scenarios?
14.1 Future Modelling
14.1.1 Estimating the effects of various cost changes forms a key part of the next stage of this work, using principles established within the National Bus Model and reported in Task Note 7.


©The TAS Partnership Limited ▪ November 07
Study of Cost Issues in Transport Operation: Phase One: Understanding the Trends and Drivers in Cost Inflation: Task Note 2: The Bus Industry ▪ 139
Effect of Operators Restoring Eroded Margins by more than Cost Recovery Fare Increases
15
CfIT Question 21: What would happen if operators sought to restore eroded margins by more than the cost recovery fare increases?
15.1 Historical Fares Policy
15.1.1 Commercial operators are under increasing cost pressures which can lead and have led to above-inflation fare rises, service frequency reductions and withdrawal of marginal services where the market for bus travel is stagnating or declining. These actions all have a negative impact on bus patronage unless they are met by investment in core services and other fare initiatives.
15.1.2 Historically there were some controls over the level of fares from regulatory authorities. In the regulatory system that was in place between 1930 and 1980 fares needed to be approved as part of the Road Service Licences, with faretables submitted to the Traffic Commissioners for each proposed fare increase.
15.1.3 While operators largely had the freedom to change fares, this had to be justified on each occasion and in some cases the proposed increases were not accepted. However, this system did hinder any move towards simplification of fare structures and new initiatives. The Traffic Commissioners’ control over fares ended in 1980, even though other aspects of local bus service regulation largely continued until 1986.
15.1.4 In urban areas fares were also controlled by local elected officials. Many urban operators in the UK prior to 1968 were owned by local councils, which at that time had significant powers. Fare increases in these areas were subject to the approval of the council and these often were less than would have been the case had there not been political pressure to keep fare increases down. In some cases, consequently, there was de facto acceptance of subsidy to maintain lower fare levels and / or higher levels of service than would have been the case otherwise. This, however, was often inequitable subsidy in that it only applied to local authority undertakings – other operators in the same area generally followed suit on fares but without the accompanying subsidy.
15.1.5 After 1968 public transport in the largest urban areas of England became the responsibility of the Passenger Transport Executives, who were able to use locally-generated tax revenue to improve services as well as subsidise fares. Although initially there was reluctance to use these powers, and the fare policies often varied radically with changes of political control, some areas

©The TAS Partnership Limited ▪ November 07
Study of Cost Issues in Transport Operation: Phase One: Understanding the Trends and Drivers in Cost Inflation: Task Note 2: The Bus Industry ▪ 140
were notably eager to keep fares low in order both to increase mobility and reduce social exclusion as well as to increase ridership. There were many agency agreements between NBC subsidiaries (and others) and PTEs governing fare levels.
15.1.6 One PTE which maintained a low fare policy throughout its existence was South Yorkshire PTE and there was some evidence that these policies were successful in meeting its goals during a period of rapid social and economic changes. However, South Yorkshire’s approach was simple in that it merely left fares and fare structures unaltered until 1986 – there were few other ticketing initiatives.
15.1.7 Other PTEs pursued low fares polices to varying degrees, but not to the same extent as SYPTE, either due to changes in political control or alternatively the reluctance to spend very large sums of money to sustain this at a time of other pressing needs during periods of economic downturns. Nevertheless, all PTEs with the exception of GMPTE in the Manchester area had low fares as a long-term major policy objective during most of their existence and consequently the historic legacy from these remains in some cases when comparing the levels of fares. Even in Manchester, there was a freeze in fare levels from the early 1980s.
15.2 Fares Trends Since 1986
15.2.1 There were two notable trends immediately upon deregulation in 1986 which had an impact upon fares. On one hand, some new, low cost, low fare operators started to operate, mainly in large urban areas, and they tended to drive down fare levels on corridors where they operated. However, this was more than balanced by the need for existing operators (particularly in PTE areas) to increase fares by significant amounts to a level which was commercially viable in order to overcome the loss of local authority support for low fares.
15.2.2 Both PTEs and operators are likely to have been willing to agree the continuation of low fare arrangements, but subsidy to fare levels was expressly forbidden in the 1985 Transport Act. One of the aims of the then Conservative government was to reduce the overall level of subsidy to the industry and removal of the significant levels of subsidy to low fares went much of the way to achieving this.
15.2.3 Significant post deregulation fares increases were most evident in the SYPTE area, but also in other areas where fares had been suppressed, such as Merseyside. However, in many cases some of the PTEs’ fare structures were carried on, though admittedly at a higher fare level - notably in the case of low maximum off peak fares, which were continued in the West Midlands and West Yorkshire.
©The TAS Partnership Limited ▪ November 07
Study of Cost Issues in Transport Operation: Phase One: Understanding the Trends and Drivers in Cost Inflation: Task Note 2: The Bus Industry ▪ 141
15.2.4 The level of increases to single fares after 1986 varied greatly, but there were some definitive trends depending upon the type of operating area. In English PTE areas fares stayed relatively steady after the initial increase between 1987 and 1991. However, there was a 6.6% increase in real terms between 1990 and 1991 followed by 3.6% and 3.2% increases in real terms the following two years. These large increases could be attributed to the end of low cost competition through consolidation in many areas, though these came at a time of economic slowdown which also contributed to passenger loss and also marked the period of the beginning of significant investment in new vehicles by the major groups.
15.2.5 Overall the increase in single fares in real terms in the English PTE areas has been 43.6% between 1987 and 2005. This is the highest of any type of area in Great Britain (but from the lowest base), with the English shire areas recording a 30.6% increase, Scotland an 18.3% increase, and London a 24.3% increase, though the latter reduced in real terms around the turn of the century when the Mayor of London (who personally controls the capital’s fare policy) operated a fares freeze: however, the need to raise capital for investment saw a return to RPI+ fare increases in 2003. The large increase in PTE areas reflects a catch-up process with commercial fare levels. As discussed in section 3.2, the trend has been reversed since 1994/5 with lower fares increases in PTE areas while the shire areas have continued to increase significantly.
15.2.6 However, against this apparently bleak picture of increasing fares the post-deregulation era has witnessed a major switch away from concentration upon sales of single fares to multi-journey tickets, particularly day tickets, at discounted prices.
15.2.7 One of the tenets of the 1985 legislation was that market forces should be left to determine fare levels and, more particularly, that fares should not be kept artificially high in areas of social deprivation in order to subvent fares on services operating in more wealthy areas – seen as cross-subsidy. This has been the least successful of the aims of the 1985 Act – operators have seldom varied from standard farescales and have withdrawn services as uneconomic rather than attempt to raise fares to market levels, although Trent Barton has recently experimented with the latter approach. In section 15.4 we show how this theory was flawed and that large fare increases on marginal services in fact erode the profit margins of such services.
15.2.8 It would therefore appear that the introduction of low cost operators has, unlike (for example) in air fares, not led to sustained longer terms reductions in fares and that any fare reductions upon their entry to the market were short lived. Indeed it is notable how few competing operators have competed on the basis of fare. Admittedly the underlying market trends and the business model for lower cost local bus operators was much different than for other areas in transport but the underlying lack of success of the model was and is notable.

©The TAS Partnership Limited ▪ November 07
Study of Cost Issues in Transport Operation: Phase One: Understanding the Trends and Drivers in Cost Inflation: Task Note 2: The Bus Industry ▪ 142
15.3 Effects of Fare Increases and Other Factors
15.3.1 Between 1987 and 2004 fares increases88 of 30% in real terms were recorded in Great Britain as a whole, with differences in areas as outlined in the previous section. During the same period there was an overall patronage loss of 14%, again with significant variations between regions. The former PTE areas suffered the highest patronage losses (-36%) while London has had a major increase in patronage which masks losses elsewhere, but at a significant cost to London’s Council Tax payers.
15.3.2 Although above inflation fare increases have almost certainly been a contributing factor to the reduction in bus passengers since 1987, it is clear that issues other than fare increases have contributed to the reduction in bus patronage, and these include increasing car ownership outside London – and particularly in the PTE areas, the spread of car oriented shopping and employment developments and the comparative costs of other types of transport.
15.3.3 There has also been a significant demographic shift, with population levels falling in the urban districts as people move further out to suburban areas. In the case of PTE areas this has often led to migration across the PTE boundaries. To give some sample statistics from Tyne & Wear:
• Car ownership has risen by 15% in ten years.
• Population within Tyne & Wear declined by 7% between 1981 and 2001:
But employment within Newcastle City Centre grew by 8%,
Population in South East Northumberland grew by 4%,
And in Chester-le-Street by 4%.
15.3.4 Thus there has been a shift away from metropolitan areas in terms of domicile, but not work. This leads to changes in commuting habits, with more car journeys and fewer bus journeys but of greater average length (and higher fare).
15.3.5 One major factor affecting ridership levels in some Metropolitan counties has been changes to concessionary travel arrangements – traditionally free in PTE areas. Successive rounds of budgetary constraint prior to the nationwide free travel schemes reduced the levels of concession in many areas. This led to sharp drops in the level of concessionary travel. Work carried out by TAS for Stagecoach in 200589 found that declining patronage in Greater Manchester was driven largely by the decline in concessionary travel and set against steadily increasing patronage levels among adult fare payers.
88 We have assumed that this refers to single fares. 89 Figures available on the Stagecoach website

©The TAS Partnership Limited ▪ November 07
Study of Cost Issues in Transport Operation: Phase One: Understanding the Trends and Drivers in Cost Inflation: Task Note 2: The Bus Industry ▪ 143
15.4 TAS Fares Model
15.4.1 In conjunction with our work for the National Bus Model, TAS has developed a fares model based on observed patronage trends, which takes account of journey lengths and changes in elasticity at peak and off peak times. It also predicts short, medium and long term impacts, which help determine the effects beyond the six month to one year timeframe generally examined previously. The fares model was updated in mid 2006 with modelling provided by Andy Skinner of ACS Transport Consultants. Data from a number of published sources was incorporated along with data supplied by operators.
15.4.2 Fares increases in line with general inflation would, over time, have patronage impacts that are neutral, as the effects of the increases are countered by the real term reduction of fares between increases. However, the sustained above inflation increases in recent years in some areas has undone much of the work of bus operators in creating simplified high frequency networks that are attractive to passengers.
15.4.3 In our fare model, a 10% fare increase for a £1, two mile journey at off peak times would lead to a 4% patronage reduction in the short term, reducing the potential yield after the increase from £110 (if there were 100 passengers making this journey) to £105.60. In the medium term (beyond one year) the patronage reduction would be 6% with the yield reducing to £103.40. In the long term the patronage reduction would be 10% and the yield would reduce to £99, negating the revenue raising effects of the fare increase. Longer term effects are difficult to gauge as further fare increases are always likely to happen in the interim.
15.4.4 The effect of fares increases for distances of under two miles are significantly higher, with consequently higher ridership losses as shorter distance passengers use their option to walk instead of use the bus. There is also a slightly higher impact for distances over 4 miles up to around 15 miles, where the real level of fare increase becomes important – passengers may choose to alter travel habits and make shorter journeys, for example. Operators sometimes curb the effects of this by strategic use of day tickets to put a ceiling on the price of a return journey.
15.4.5 The impacts on peak journeys are less than for off peak, as more passengers would be travelling to work through necessity instead of using their option to not travel or to travel less. In the example cited above, peak patronage would reduce by 3% (instead of 4%) in the short term with the long term loss of 7% instead of 10%.
15.4.6 Previous work by TAS has also established that the average fares elasticity of -0.4 does not apply universally and that in local circumstances this value can vary substantially. In some areas we uncovered standard fares elasticities between -0.5 and -0.6 – thus resistance to increases in these areas will be much more marked.

©The TAS Partnership Limited ▪ November 07
Study of Cost Issues in Transport Operation: Phase One: Understanding the Trends and Drivers in Cost Inflation: Task Note 2: The Bus Industry ▪ 144
15.5 The Sheffield Experience
15.5.1 In order to illustrate the point of large above inflation fare increases the example of South Yorkshire can be cited. In 2005 the largest operator raised their fares on three separate occasions, taking the fare that was £1.10 in January 2005 to £1.50 in January 2006. Although data is not yet available on the effect of the most recent increases, bus passengers declined by 14% in South Yorkshire between 2002/3 and 2004/5, a period when the most popular single fare increased by 20%. For the three years prior to 2002/3 bus ridership had been stable or slightly increasing thanks to simplified patterns of service, marketing initiatives, and simplified fare structures.
15.5.2 The percentage increase for the most popular single operator weekly tickets, which are actually used by more passengers in South Yorkshire than adult single tickets, was 25% between 2000 and 2005 and 8.3% between 2002/3 and 2004/5 (compared to 20% for adult singles). While the percentage increase for weekly tickets was lower than for single tickets, it was still slightly above the rate of inflation.
15.5.3 Related to the large fare increases, which were intended to cover increased costs as well as to maintain margins, there have also been service reductions which mainly affected less popular peripheral or marginal services. As examples, the Sheffield inner circle service was completely withdrawn and the Sheffield outer circle service had its frequency reduced. Clearly the passengers lost (in part) to fares increases provided the margin of profit for these services and when passenger numbers dropped, in line with the model, it was no longer viable to continue to operate these services. The net result was that significantly higher numbers of passengers were lost to bus services in the area than otherwise would have been the case.
15.5.4 In this example profit margins may have been maintained or increased, but at the heavy cost of a significantly reduced market. It is clear from this evidence that above inflation fare increases contribute to a long term decline in the public transport market. It is a cycle of decline - large fare increases can directly lead to passenger loss, leading to reductions in services that lead to more passenger loss and further fare increases.
15.6 Is There a Better Way? Alternative Approaches to Fares
15.6.1 The traditional way of paying for bus travel in the UK was through the purchase of a single or return fare on the bus. These fares have historically been based on distance through the use of farestages which are relatively close together, in most cases less than one mile. Prior to the 1970s this was generally the only option for bus fare payment. Even though there had been regular (and generally above-inflation) fare increases prior to this time it took the reorganisation of the industry with the establishment of the National Bus Company and PTEs to bring new ticketing products to the scene.
©The TAS Partnership Limited ▪ November 07
Study of Cost Issues in Transport Operation: Phase One: Understanding the Trends and Drivers in Cost Inflation: Task Note 2: The Bus Industry ▪ 145
15.6.2 The PTEs and later NBC subsidiaries and municipal operators introduced period tickets for their areas. In many cases these were soon followed by day tickets and some of these were valid for fairly large geographic areas. NBC had some group initiatives – the ‘National Wanderbus’ ticket followed by the ‘Explorer’ scheme, aimed at those making longer or multiple journeys. Multi operator tickets also came to be introduced in some shire counties with time, so that by the mid 1980s there was a fairly comprehensive range of tickets available in most urban areas.
15.6.3 Bus deregulation in 1986 brought discontinuity to the range of ticket products, with some previous products being withdrawn and new tickets being introduced. It took several years for the ticket range to restabilise, but the current situation is that almost all sizeable operators offer some form of day and period tickets, but with the price and validity varying widely. Multi operator tickets are generally available in PTE areas and in a number of other areas. The success of day and period tickets as a whole is proven in data, which shows that in most urban areas single tickets are in the minority and are generally a decreasing part of the market.
15.6.4 There are a number of contradictory trends in the area of day and period tickets. Some operators appear to have priced these on the basis of the longest journey users could possibly make, instead of the journeys that most users actually make. This often resulted in day and period tickets being relatively overpriced and unattractive to many users. However, as single fares rise ahead of the cost of multi-journey tickets, so the utility of the latter increases. Other operators, both in the recent past and currently, use a different approach. These operators use lower cost day and weekly tickets as a tool to grow the market as well as to maintain patronage and revenue in an environment that it otherwise hostile.
15.6.5 Most of the low cost weekly tickets were introduced prior to the recent period of cost increases, but where these have been introduced they have largely been maintained at lower levels than elsewhere. Examples of these include the Stagecoach Megariders, which have increased the adult travel market in Manchester and many other locations. These often still remain priced below £10.00 per week (that in Manchester is £9.00) and are oriented towards on-bus purchase, though some longer period tickets are available off-bus. Areas of longer overlapping networks in shire areas generally have higher prices, but almost all towns with an urban network have some sort of Megarider ticket.
15.6.6 Another group which offers lower cost day and period tickets is Go Ahead, and their recently introduced lower cost tickets for Sunderland are a good example of their offerings. A package of service changes designed to revitalise the network was accompanied by a lower cost day ticket, with this being offered at £2.80 compared to previous price of £3.70 covering a wider area. Go North East in Sunderland has also introduced another major fares initiative being used to stimulate market growth, flat fares. In Sunderland the flat fare is currently £1, though this may be for an introductory period.

©The TAS Partnership Limited ▪ November 07
Study of Cost Issues in Transport Operation: Phase One: Understanding the Trends and Drivers in Cost Inflation: Task Note 2: The Bus Industry ▪ 146
15.6.7 Brighton and Hove was the highest profile operator to introduce flat fares, and their flat fare is currently £1.50, which shows that a flat fare is not always at a low level. Flat fares have spread widely in the past five years, and these are now in effect in (among other locations) Edinburgh, Nottingham, Reading, Corby, Chester, London, and North Staffordshire.
15.6.8 Even if the flat fares are not at a low level they are still useful as a marketing tool, with the benefits of simplicity as most users will know what the fare is before boarding the bus – a situation which is not always the case for occasional users on services with graduated fares. A key aspect in implementing flat fares is to balance ‘winners’ and ‘losers’ with fare increases for some and reductions for others. Another key is promotion and marketing, as in Brighton strong promotion produced better results than conventional fares elasticity modelling predicted

©The TAS Partnership Limited ▪ November 07
Study of Cost Issues in Transport Operation: Phase One: Understanding the Trends and Drivers in Cost Inflation: Task Note 2: The Bus Industry ▪ 147
Summary and Conclusions 16
16.1 Scenario Summary
16.1.1 Using our identification of cost trends under various headings, we can go forward in the next stage of work to estimate likely future increases in cost, barring unforeseen events which have a major impact upon a particular aspect.
16.1.2 Labour Costs are the key driver in operating costs, representing almost 70% of all costs in the industry. Thus the direction of wage awards and the effect of other on-costs on top of wages have the most important impact upon total cost. We have identified quite clearly that wage costs in London are on a wholly different trajectory to those in the rest of the UK and this leads us to conclude that there is a need for two separate models for London and the rest.
16.1.3 We have updated our estimate for fuel price growth acknowledging the fall in fuel price since early 2006 but there remains an underlying cost increase trend significantly above RPI and a trend for poorer fuel consumption in newer vehicles. Our analysis indicates the likely simplified cost increase model, summarised in Table 23 below:
Table 23: Bus Industry Cost Projections Based on Identified Trends
Item Predicted Annual Cost Change
Labour Costs – London RPI + 3.5%
Labour Costs – Rest of UK RPI + 1.790%
Fuel RPI + 3%
Depreciation RPI + 1%
Materials Costs RPI
Fixed Costs RPI + 1.5%
- Other Items RPI + 2%91
90 Allows for reduction in paid hours per week and resultant increase in staff numbers. 91 Allows for increases in motor and EL insurance and on-costs to wages