3.1.1 consumer durable industry – an …shodhganga.inflibnet.ac.in/bitstream/10603/40636/4/iii...
TRANSCRIPT
75
CHAPTER – III
3.1.1 CONSUMER DURABLE INDUSTRY – AN OVERVIEW
India in its 62 years of journey has seen manifold increase in the income of its
denizens (Rs. 38,084 as on 2010) and this has led to paradigm shift in the purchasing
behaviour of the people here. There is a discernible shift in the consumer’s preference
in favour of higher end, technologically superior branded products, the demand being
spurred by increasing consumer awareness and preference for new models. This shift
is also because of the increase in manufacture of branded products and narrowing
down of price between branded and non-branded goods. Competition has forced the
companies to offer efficient after sales service and support and this, in turn, has
swayed customer preference for branded products. Post liberalization there has been
inundation of goods transcending the borders and the customer has a wider choice,
breaking the shackles of the consumers regarding limitations of choices. Indian
consumer durables market used to be dominated by a few domestic players like
Godrej, Allwyn, Kelvinator, and Voltas. But post-liberalization many foreign
companies have entered into India, dethroning the Indian players and dominating the
market. The major categories in the market are CTVs, refrigerators, air-conditioners
and washing machines. The rural market is growing faster than the urban markets,
although the penetration level in rural area is much lower. The CTV segment is
expected to be the largest contributing segment to the overall growth of the industry.
The rising income levels, double-income families and increasing consumer awareness
are the main growth drivers of this industry. In addition to them the young nature of
population and easy finance options are also fuelling the market and its dynamics.
Consumers today are more indulgent in market place than their predecessors. There
76
has been shift in the definition of needs and wants. For example a mobile phone is
more of a need today then a want. Westernization has influenced the psyche of the
Indian customers to a degree. This report is an attempt to reflect the changes in the
consumer buying behaviour in the Indian Market especially in home appliances
buying.
Durable goods are those which don‘t wear out quickly, yielding utility
over time rather than at once. The consumer durables industry can be broadly
classified into two segments: Consumer Electronics and Consumer Appliances.
Consumer Appliances can be further categorized into Brown Goods and White
Goods.
Consumer Electronics are Mobile Phones, Televisions, MP3 Players, DVD
Players, VCD Players, etc.,
White goods are Refrigerators, Washing Machines, Air-conditioners,
Speakers and Audio Equipments, etc.,
Kitchen Appliances or Brown Goods are Mixers, Grinders, Microwave
Ovens, Iron Box, Electric Fans, Cooking Range, Chimneys , etc.,
The rural consumer durables markets’ annual growth rate is 30 per cent,
according to a study by an industry body. The market will grow up to 45 per cent in
rural and semi-urban India by 2011, due to improved income and better living
standards among rural people. The total size of the consumer durables market stands
at US$ 6.72 billion and will reach US$ 11.2 billion by 2015. Mobile phones, LED
televisions and music systems, which include fancy items such as the iPod, are some
major growth drivers. Lighting solutions company BPL Techno Vision has launched
its rechargeable light emitting diode (LED) lantern 'BPL Chirag' for the domestic
77
rural market. The product has been launched in Uttar Pradesh in the first phase due to
its large geography and rural household base.
In terms of Purchasing Power Parity (PPP), India is the 4th largest economy in
the world and is expected to overtake Japan in the near future to become the 3rd
largest. Indian consumer goods market is expected to reach $400 billion by 2010.
India has the youngest population amongst the major countries. There are a lot of
young people in India in different income categories. Nearly two- thirds of its
population is below the age of 35, and nearly 50 % is below 25. There are 56million
people in middle class, who are earning US$ 4,400- US$ 21,800 a year. And there are
6million rich households in India. The upper-middle and high-income households in
urban areas are expected to grow to 38.2 million in 2007 as against 14.6 million in
2000.Rural sector offers huge scope for consumer durables industry, as it accounts for
70% of the Indian population. Rural areas have the penetration level of only 2% and
0.5% for refrigerators and washing machines respectively. The urban market and the
rural market are growing at the annual rates of 7%-10%and 25% respectively. The
rural market is growing faster than the urban market. The urban market has now
largely become a product replacement market. The bottom line is that Indian market is
changing rapidly and is showing unprecedented business opportunity.
The Indian consumer durables industry has witnessed a considerable
change in the past couple of years. The market size (value) of the consumer
durables industry has seen an exponential growth in the past few years. The
$27.38 billion electronics and Home Appliances Industry in India could become a
$ 40 billion Industry by 2012, growing at a CAGR of 15-20%, provided there is
support from the government, said a joint study conducted by ASSOCHAM and
Ernst & Young. The study titled 'Electronics and Appliances Manufacturing -
78
the India Opportunity" said the Industry has growth by 7.1% over the previous
year in rupee terms.
‘’Considering that 2009 was an unusually good year for the industry,
companies are hopeful that a better demand would continue to bolster durables sales
in the new year too. 2009 was good for these companies because of low input costs,
better inventory management, and the stimulus package, pay revision of central
government employees and stable prices, which spurred growth. Samsung India also
expects 100% growth in the LCD category said by Ravinder Zutshi, Deputy
Managing Director, Samsung India. The company expects a 30% growth this year.
Every category of durables is already growing in double-digits. Even still cameras as
a category has grown''1.
3.1.2 STRENGTH OF THE INDIAN CONSUMER DURABLE SECTOR
During FY08, volume share of the single largest consumer durable was colour
TVs at 34%, followed by refrigerators and air conditioners at 19% and 15%
respectively. Washing machines and other assorted consumer durables captured a
share in the total volume by 6% and 26% respectively.
1. Rise in disposable income
The demand for consumer electronics has been rising with the increase in
disposable income coupled with more and more consumers falling under the
double income families. The growing Indian middle class is an attraction for
companies who are out there to woo them.
1 Namrata Singh & Amrita Nair-Ghaswalla,”Consumer durable makers pin hope on better 2010”, The
Times of India, Mumbai, January 12, 2010.
79
2. Availability of newer variants of a product
Consumers are spoilt for choice when it comes to choosing products. Newer
variants of a product will help a company in getting the attention of consumers
who look for innovation in products.
3. Product pricing
The consumer durables industry is highly price sensitive, making price the
determining factor in increasing volumes, at least for lower range consumers.
For middle and upper range consumers, it is the brand name, technology and
product features that are important.
4. Availability of financing schemes
Availability of credit and the structure of the loan determine the affordability
of the product. Sale of a particular product is determined by the cost of credit
as much as the flexibility of the scheme.
5. Rise in the share of organized retail
According to a working paper released by the Indian Council for Research on
International Economic Relations (ICRIER), organized retail which
constituted a mere 6 % of the retail sector in FY08.
6. Innovative advertising and brand promotion
Sales promotion measures such as discounts, free gifts and exchange offers
help a company in distinguishing itself from others.
7. Festive season sales
Demand for colour TVs usually pick up during the festive seasons. As a result
most companies come out with offers during this period to cash in on the
festive mood. This period will continue to be the growth driver for consumer
durable companies.
80
3.1.3 OBSTACLES OF INDIAN CONSUMER DURABLES SECTOR
1. Global companies
The domestic consumer durables sector faces threat from newer companies,
especially from global ones who have technologically advanced products to
offer.
2. Competition
Presence of a large number of players in the domestic consumer durables
industry leads to competition and rivalry among companies. Threat from
rivalry and competition poses a threat to domestic companies.
3. Potential markets remaining yet untapped
A large segment of the domestic market, mostly the rural market is yet to be
tapped. Tapping this yet untapped and unorganised market is a major
challenge for the Indian consumer durables sector.
4. Substitute products/services
The domestic consumer durables industry is plagued by threats from
substitute products. Easy accessibility to theatres/multiplexes, especially in
urban areas has turned off the viewer ship from TV to a large extent. With the
advent of a horde of FM radio stations, radio sets have now substituted TVs.
5. Availability of choice
The availability of a wide product line on account of most products being
homogeneous, poses a threat for companies operating in the consumer
durables sector. Customers have the choice of both domestically produced and
imported goods, with similar features.
81
3.1.4 INDIA’S CONSUMER MARKET
India is the world's 12th largest consumer market. By 2025, it is projected to
be ahead of Germany, the fifth largest, according to a recent McKinsey survey. The
biggest strength of Indian markets lies in the size, not in individual spending. With the
rise in income, over 291 million people will move from desperate poverty to a more
sustainable life, and India’s middle class will increase incredibly by over ten times
from its current size of 50 million to 583 million people.
India’s consumer market is riding the crest of the country’s economic boom.
Driven by a young population with access to disposable incomes and easy finance
options, the consumer market has been throwing up staggering figures. The Indian
durables market, with a market size of US$ 27.38 billion in 2008–09, has grown by
7.1% over the previous year.
India officially classifies its population in five groups, based on annual
household income (based on year 1995-96 indices). These groups are: Lower Income;
three subgroups of Middle Income; and Higher Income. Household income in the top
20 boom cities in India is projected to grow at 10 per cent annually over the next eight
years, which is likely to increase consumer spending on durables. With the emergence
of concepts such as quick and easy loan, zero equated monthly installment (EMI)
charges, loan through credit card, loan over phone, it has become easy for Indian
consumers to afford more expensive consumer goods.
Even discounting the purchase power parity factor, income classifications do
not serve as an effective indicator of ownership and consumption trends in the
economy. Accordingly, the National Council for Applied Economic Research
(NCAER), India’s premier economic research institution, has released an alternative
classification system based on consumption indicators, which is more relevant for
82
ascertaining consumption patterns of various classes of goods. There are five classes
of consumer households, ranging from the destitute to the highly affluent, which
differ considerably in their consumption behavior and ownership patterns across
various categories of goods. These classes exist in urban as well as rural households
both, and consumption trends may differ significantly between similar income
households in urban and rural areas.
The rapid economic growth is increasing and enhancing employment and
business opportunities and in turn increasing disposable incomes. Middle class,
defined as households with disposable incomes from Rs 200,000 to 1,000,000 a year
comprises about 50 million people, roughly 5% of the population at present. By 2025
the size of middle class will increase to about 583 million people, or 41% of the
population. Extreme rural poverty has declined from 94% in 1985 to 61% in 2005 and
is projected to drop to 26% by 2025. Affluent class, defined as earnings above Rs
1,000,000 a year will increase from 0.2% of the population at present to 2% of the
population by 2025. Affluent class’s share of national private consumption will
increase from 7% at present to 20% in 2025.
3.1.5 PERFORMANCE OF CONSUMER DURABLE GOODS IN INDIA
In the past 10 years, the global market has witnessed a surge in demand as
economies such as Brazil, Mexico, India and China have opened up and begun rapid
development, welcoming globalization with élan. The consumer durables industry has
always exhibited impressive growth despite strong competition and constant price
cutting, and the first contraction since the 2001 dot-com bust has been due to the
global recession. Given the strong correlation between demand for durables (both new
and replacements) and income, the industry naturally suffered during the 2008-2009
period. However, projections for current year going forward are very optimistic, as
83
consumers resume spending, and producers launch new enticing variants to grab new
customers. Leading players include Sony Corporation, Toshiba Corporation,
Whirlpool Corporation and Panasonic Corporation. Developing countries such as
India and China have largely been shielded from the backlash of the recession, as
consumers continued to buy basic appliances. In fact, China has been ranked the
second-biggest market in the world for consumer electronics. Despite the recession,
their strong domestic economy and growing high-income population have buoyed
demand leading to aggressive market growth. There is growing interest for new age
products such as LCD-TVs and DVD players. Meanwhile, the penetration of the
basic, largest dollar items such as ovens, washing machines and refrigerators is also
increasing. India too, has witnessed a similar phenomenon, with the urban consumer
durables market growing at almost 10 %p.a., and the rural durables market growing at
25% p.a. Some high-growth categories within this segment include mobile phones,
TVs and music systems.
The Indian consumer durables industry has witnessed a considerable change in
the past couple of years. Changing lifestyle, higher disposable income coupled with
greater affordability and a surge in advertising has been instrumental in bringing
about a sea change in the consumer behaviour pattern. In addition, change in policy,
such as the WTO FTA in 2005 resulted in zero customs duty on imports of all telecom
equipment, thereby improving the pricing and affordability of imported goods.
The biggest attraction for MNCs is the growing Indian middle class. This
market is characterized with low penetration levels. MNCs hold an edge over their
Indian counterparts in terms of superior technology combined with a steady flow of
capital, while domestic companies compete on the basis of their well-acknowledged
brands, an extensive distribution network and an insight in local market conditions.
84
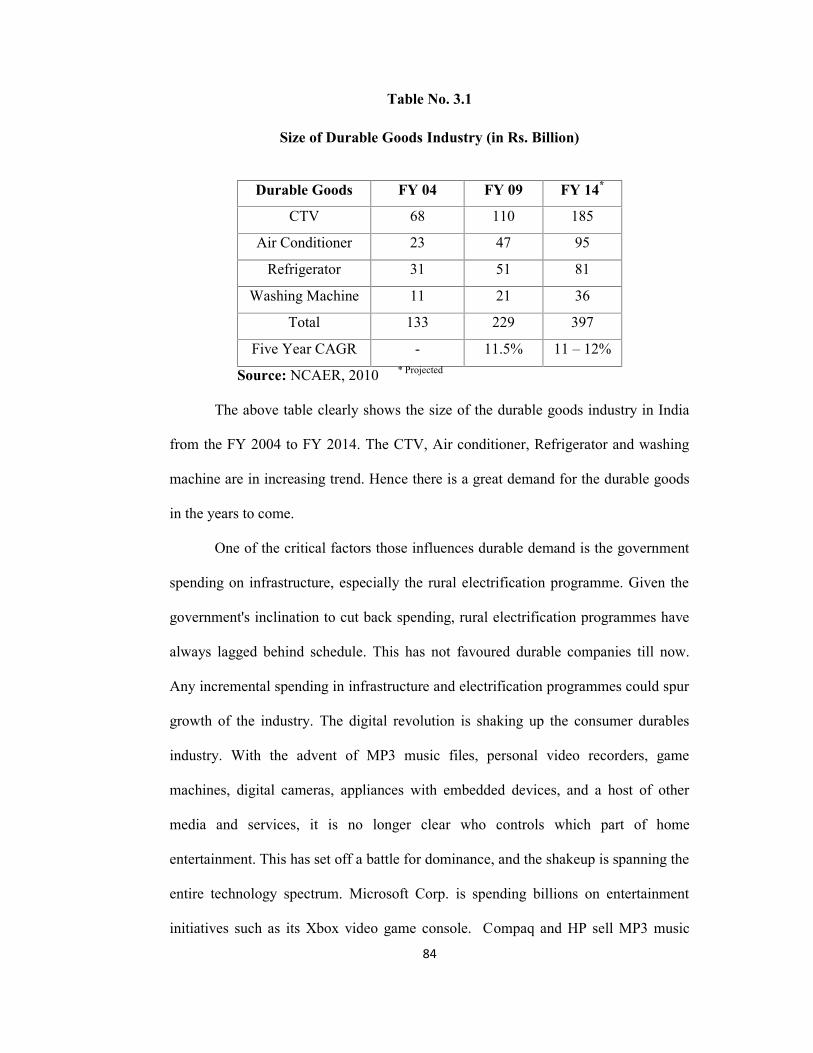
Table No. 3.1
Size of Durable Goods Industry (in Rs. Billion)
Durable Goods FY 04 FY 09 FY 14*
CTV 68 110 185
Air Conditioner 23 47 95
Refrigerator 31 51 81
Washing Machine 11 21 36
Total 133 229 397
Five Year CAGR - 11.5% 11 – 12%
Source: NCAER, 2010 * Projected
The above table clearly shows the size of the durable goods industry in India
from the FY 2004 to FY 2014. The CTV, Air conditioner, Refrigerator and washing
machine are in increasing trend. Hence there is a great demand for the durable goods
in the years to come.
One of the critical factors those influences durable demand is the government
spending on infrastructure, especially the rural electrification programme. Given the
government's inclination to cut back spending, rural electrification programmes have
always lagged behind schedule. This has not favoured durable companies till now.
Any incremental spending in infrastructure and electrification programmes could spur
growth of the industry. The digital revolution is shaking up the consumer durables
industry. With the advent of MP3 music files, personal video recorders, game
machines, digital cameras, appliances with embedded devices, and a host of other
media and services, it is no longer clear who controls which part of home
entertainment. This has set off a battle for dominance, and the shakeup is spanning the
entire technology spectrum. Microsoft Corp. is spending billions on entertainment
initiatives such as its Xbox video game console. Compaq and HP sell MP3 music
85
players that plug into home-stereo systems. Apple Computer is positioning its new
iMac as a digital-entertainment device. Sony is building Vaio computers that focus on
integrating multimedia applications.
Philips sells stereos that hook into a high-speed Internet connection to play
music from the Web. More startups are trying to carve out profitable niches in digital
music, video, and home networking. The industry is witnessing a number of strategic
alliances, to develop a range of capabilities - electronic hardware, software and
entertainment content. As more consumers grow comfortable with technology,
companies need to build simpler devices that offer more entertainment and
convenience. These new machines need to work together readily, and should be as
easy to set up and use as a telephone or a television. Consumerization of technology
could be a major phenomenon over the next 5 to 10 years. This could hasten industry
consolidation, as healthy companies gain market share by buying out weaker ones at
attractive prices. Apart from steady income gains, consumer financing has become a
major driver in the consumer durables industry. In the case of more expensive
consumer goods, such as refrigerators, washing machines, colour televisions and
personal computers, retailers are joining forces with banks and finance companies to
market their goods more aggressively. Among department stores, other factors that
will support rising sales include a strong emphasis on retail technology, loyalty
schemes, private labels and the subletting of floor space in larger stores to smaller
retailers selling a variety of products and services, such as music and coffee.
Rising disposable income and declining prices of durables have resulted in
increased volumes. An increase in disposable income is aided by an increase in the
number of both double-income and nuclear families. Production in the consumer
electronics industry has been estimated at US$ 6.7 billion in 2009–2010. The segment
86
registered a growth of 18 per cent in 2009–2010 from US$ 5.5 billion in the previous
year. The consumer electronics segment contributes about 27 per cent to the total
hardware production in the country. Air conditioners (including industrial and office
conditioners) constituted 38 per cent of the consumer appliances market, followed by
refrigerators at 14 per cent, electric fans at 7.5 per cent, washing appliances at 7 per
cent and sewing machines at 5 per cent.
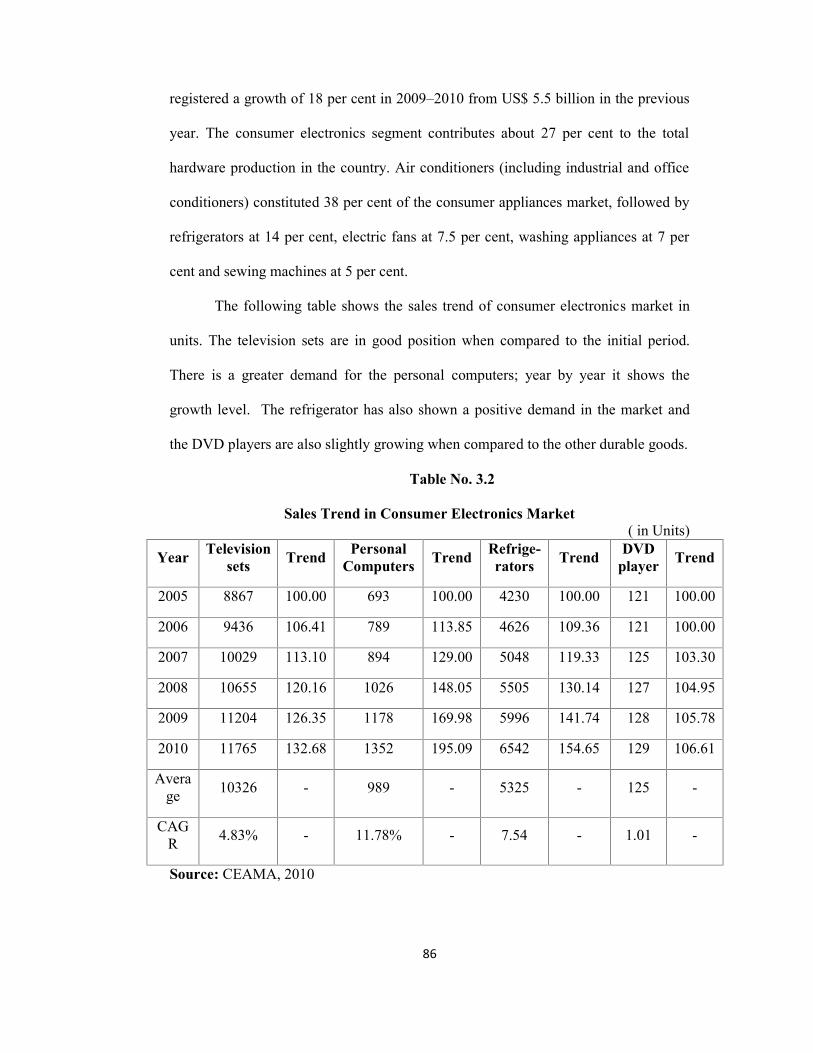
The following table shows the sales trend of consumer electronics market in
units. The television sets are in good position when compared to the initial period.
There is a greater demand for the personal computers; year by year it shows the
growth level. The refrigerator has also shown a positive demand in the market and
the DVD players are also slightly growing when compared to the other durable goods.
Table No. 3.2
Sales Trend in Consumer Electronics Market( in Units)
Year Televisionsets Trend Personal
Computers Trend Refrige-rators Trend DVD
player Trend
2005 8867 100.00 693 100.00 4230 100.00 121 100.00
2006 9436 106.41 789 113.85 4626 109.36 121 100.00
2007 10029 113.10 894 129.00 5048 119.33 125 103.30
2008 10655 120.16 1026 148.05 5505 130.14 127 104.95
2009 11204 126.35 1178 169.98 5996 141.74 128 105.78
2010 11765 132.68 1352 195.09 6542 154.65 129 106.61
Average 10326 - 989 - 5325 - 125 -
CAGR 4.83% - 11.78% - 7.54 - 1.01 -
Source: CEAMA, 2010
87
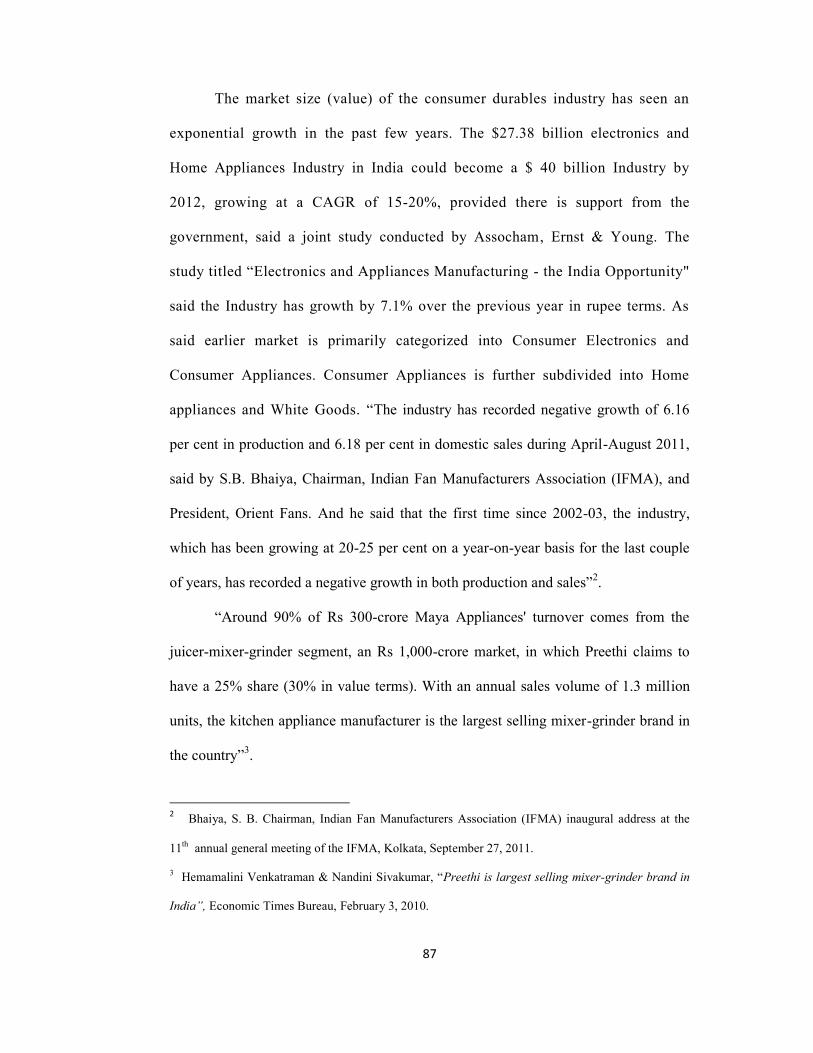
The market size (value) of the consumer durables industry has seen an
exponential growth in the past few years. The $27.38 billion electronics and
Home Appliances Industry in India could become a $ 40 billion Industry by
2012, growing at a CAGR of 15-20%, provided there is support from the
government, said a joint study conducted by Assocham, Ernst & Young. The
study titled “Electronics and Appliances Manufacturing - the India Opportunity"
said the Industry has growth by 7.1% over the previous year in rupee terms. As
said earlier market is primarily categorized into Consumer Electronics and
Consumer Appliances. Consumer Appliances is further subdivided into Home
appliances and White Goods. “The industry has recorded negative growth of 6.16
per cent in production and 6.18 per cent in domestic sales during April-August 2011,
said by S.B. Bhaiya, Chairman, Indian Fan Manufacturers Association (IFMA), and
President, Orient Fans. And he said that the first time since 2002-03, the industry,
which has been growing at 20-25 per cent on a year-on-year basis for the last couple
of years, has recorded a negative growth in both production and sales”2.
“Around 90% of Rs 300-crore Maya Appliances' turnover comes from the
juicer-mixer-grinder segment, an Rs 1,000-crore market, in which Preethi claims to
have a 25% share (30% in value terms). With an annual sales volume of 1.3 million
units, the kitchen appliance manufacturer is the largest selling mixer-grinder brand in
the country”3.
2 Bhaiya, S. B. Chairman, Indian Fan Manufacturers Association (IFMA) inaugural address at the
11th annual general meeting of the IFMA, Kolkata, September 27, 2011.
3 Hemamalini Venkatraman & Nandini Sivakumar, “Preethi is largest selling mixer-grinder brand in
India”, Economic Times Bureau, February 3, 2010.
88
The growth of consumer durables slowed to 1% in June 2011, as compared to
the 3.8% and 5.2% growth recorded in April 2011 and May 2011, respectively. The
low growth recorded by this sector in June 2011 was partly led by an adverse base
effect, with a robust 21.2% growth recorded in June 2010.
The pace of growth of consumer durables declined sharply to 3.3% in Q1
2011-12 from 15.2% in Q4, 2010-11, despite an easing of the base effect. Although
the base effect is likely to ease further in the coming months, consumer durables are
likely to display low growth reflecting the impact of persistently high inflation and
rising interest rates on the demand for such products.
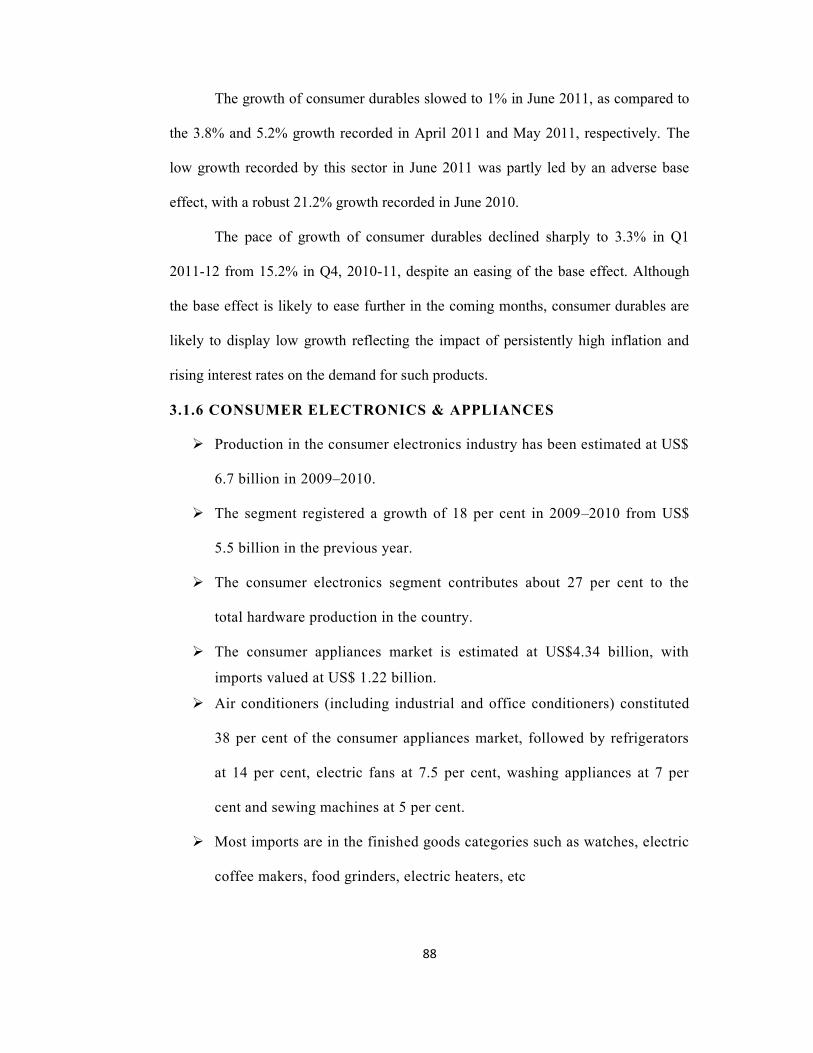
3.1.6 CONSUMER ELECTRONICS & APPLIANCES
Production in the consumer electronics industry has been estimated at US$
6.7 billion in 2009–2010.
The segment registered a growth of 18 per cent in 2009–2010 from US$
5.5 billion in the previous year.
The consumer electronics segment contributes about 27 per cent to the
total hardware production in the country.
The consumer appliances market is estimated at US$4.34 billion, with
imports valued at US$ 1.22 billion.
Air conditioners (including industrial and office conditioners) constituted
38 per cent of the consumer appliances market, followed by refrigerators
at 14 per cent, electric fans at 7.5 per cent, washing appliances at 7 per
cent and sewing machines at 5 per cent.
Most imports are in the finished goods categories such as watches, electric
coffee makers, food grinders, electric heaters, etc
89
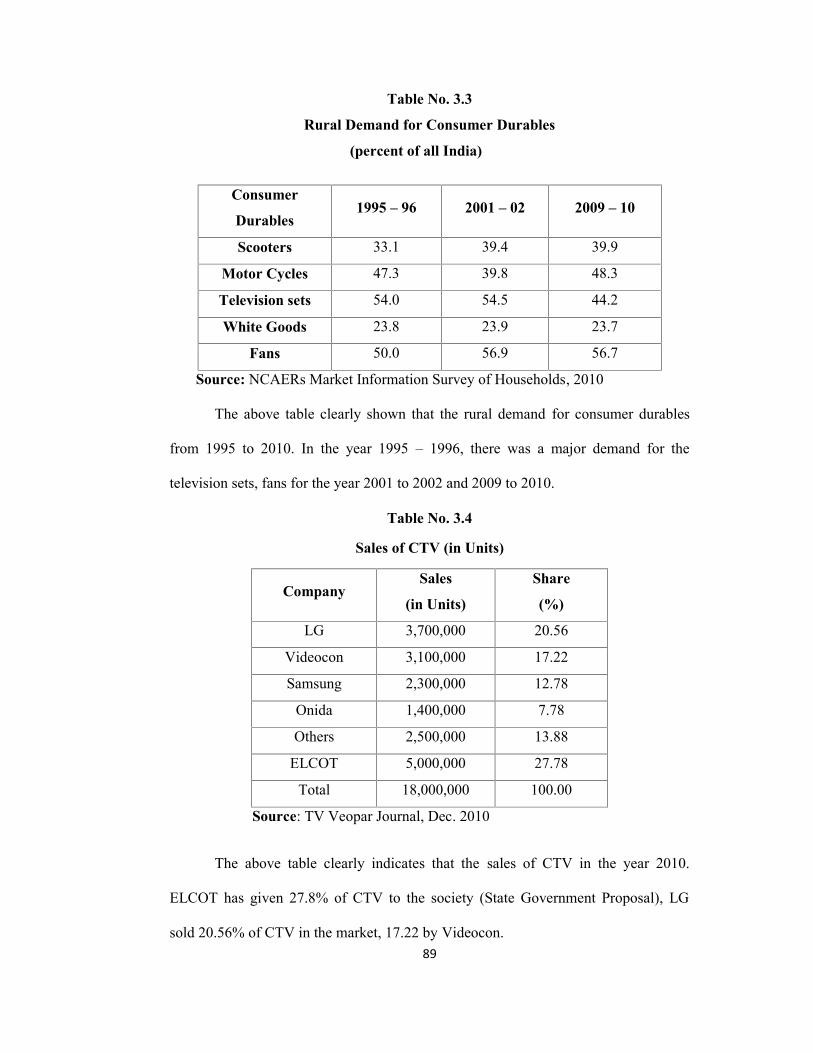
Table No. 3.3
Rural Demand for Consumer Durables
(percent of all India)
Consumer
Durables1995 – 96 2001 – 02 2009 – 10
Scooters 33.1 39.4 39.9
Motor Cycles 47.3 39.8 48.3
Television sets 54.0 54.5 44.2
White Goods 23.8 23.9 23.7
Fans 50.0 56.9 56.7
Source: NCAERs Market Information Survey of Households, 2010
The above table clearly shown that the rural demand for consumer durables
from 1995 to 2010. In the year 1995 – 1996, there was a major demand for the
television sets, fans for the year 2001 to 2002 and 2009 to 2010.
Table No. 3.4
Sales of CTV (in Units)
CompanySales
(in Units)
Share
(%)
LG 3,700,000 20.56
Videocon 3,100,000 17.22
Samsung 2,300,000 12.78
Onida 1,400,000 7.78
Others 2,500,000 13.88
ELCOT 5,000,000 27.78
Total 18,000,000 100.00
Source: TV Veopar Journal, Dec. 2010
The above table clearly indicates that the sales of CTV in the year 2010.
ELCOT has given 27.8% of CTV to the society (State Government Proposal), LG
sold 20.56% of CTV in the market, 17.22 by Videocon.
90
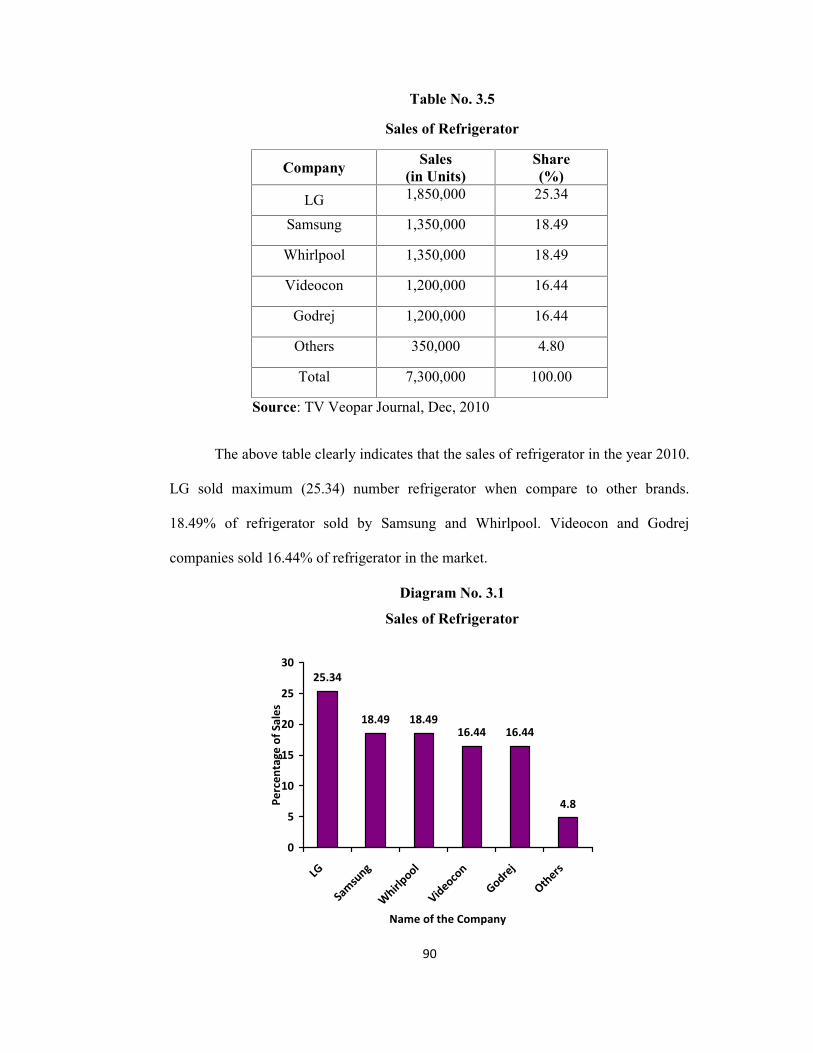
Table No. 3.5
Sales of Refrigerator
Company Sales(in Units)
Share(%)
LG 1,850,000 25.34
Samsung 1,350,000 18.49
Whirlpool 1,350,000 18.49
Videocon 1,200,000 16.44
Godrej 1,200,000 16.44
Others 350,000 4.80
Total 7,300,000 100.00
Source: TV Veopar Journal, Dec, 2010
The above table clearly indicates that the sales of refrigerator in the year 2010.
LG sold maximum (25.34) number refrigerator when compare to other brands.
18.49% of refrigerator sold by Samsung and Whirlpool. Videocon and Godrej
companies sold 16.44% of refrigerator in the market.
Diagram No. 3.1
Sales of Refrigerator
25.34
18.49 18.4916.44 16.44
4.8
0
5
10
15
20
25
30
LG
Samsu
ng
Whirlp
ool
Videocon
Godrej
Others
Name of the Company
Perc
enta
ge o
f Sal
es
91
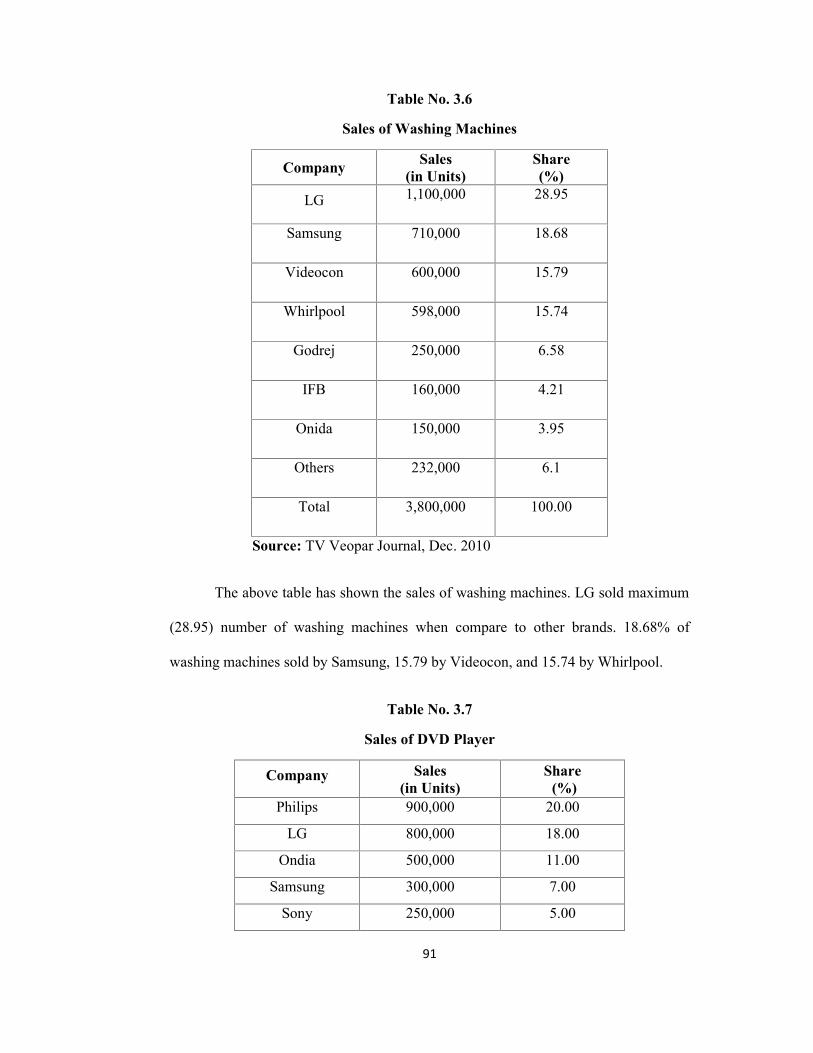
Table No. 3.6
Sales of Washing Machines
Company Sales(in Units)
Share(%)
LG 1,100,000 28.95
Samsung 710,000 18.68
Videocon 600,000 15.79
Whirlpool 598,000 15.74
Godrej 250,000 6.58
IFB 160,000 4.21
Onida 150,000 3.95
Others 232,000 6.1
Total 3,800,000 100.00
Source: TV Veopar Journal, Dec. 2010
The above table has shown the sales of washing machines. LG sold maximum
(28.95) number of washing machines when compare to other brands. 18.68% of
washing machines sold by Samsung, 15.79 by Videocon, and 15.74 by Whirlpool.
Table No. 3.7
Sales of DVD Player
Company Sales(in Units)
Share(%)
Philips 900,000 20.00
LG 800,000 18.00
Ondia 500,000 11.00
Samsung 300,000 7.00
Sony 250,000 5.00
92
Modern Retail 225,000 5.00
Videocon 200,000 4.50
Oscar 200,000 4.50
Intex 150,000 3.0
Mitashi 150,000 3.00
Panasonic 150,000 3.0
Moser Baer 150,000 3.0
Others 525,000 12.5
Total 4,500,000 100.00
Source: TV Veopar Journal, Dec. 2010
The above table clearly indicates the sales of DVD players. The data are
referred only from the organized market. Philips sold 20% of DVD players in the
market. 18% by LG, 11% by Onida, 7% by Samsung.
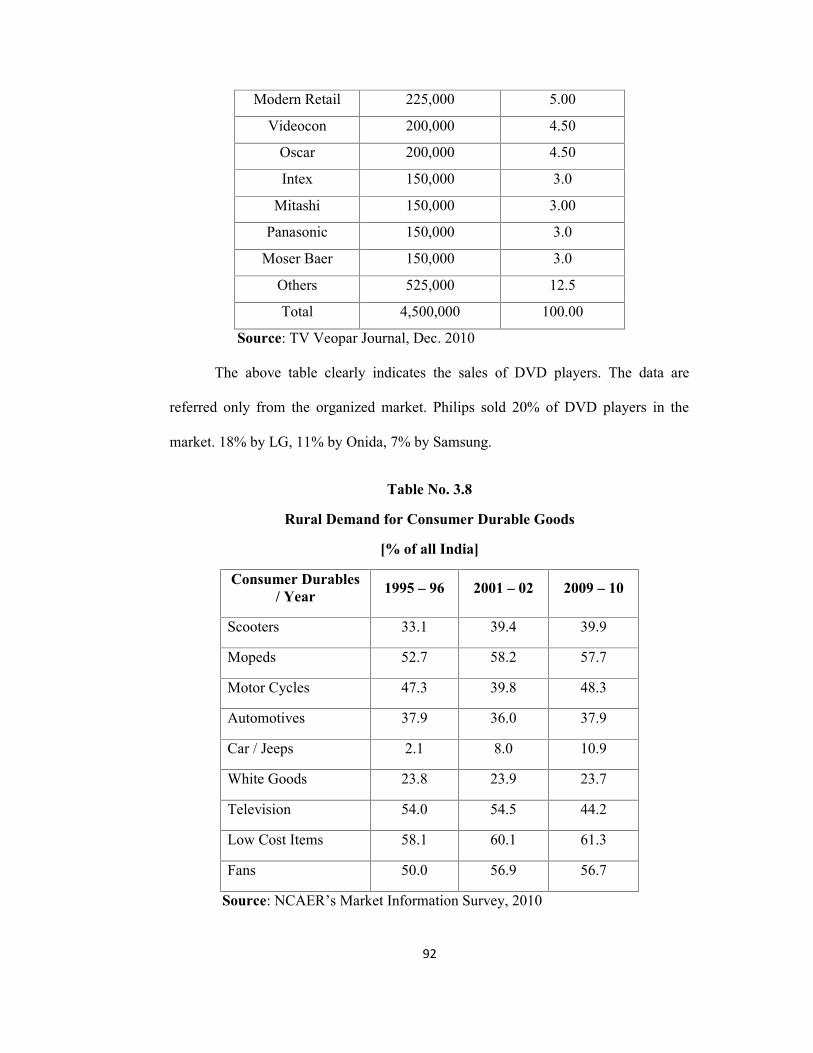
Table No. 3.8
Rural Demand for Consumer Durable Goods
[% of all India]
Consumer Durables/ Year 1995 – 96 2001 – 02 2009 – 10
Scooters 33.1 39.4 39.9
Mopeds 52.7 58.2 57.7
Motor Cycles 47.3 39.8 48.3
Automotives 37.9 36.0 37.9
Car / Jeeps 2.1 8.0 10.9
White Goods 23.8 23.9 23.7
Television 54.0 54.5 44.2
Low Cost Items 58.1 60.1 61.3
Fans 50.0 56.9 56.7
Source: NCAER’s Market Information Survey, 2010
93
The above table clearly indicates that the rural demand for consumer durable
goods in India from 1995 to 1996 and 2009 to 2010. There is a positive side for the
durable goods industries except one or two companies because the growth rate was
different when compare to the previous years.
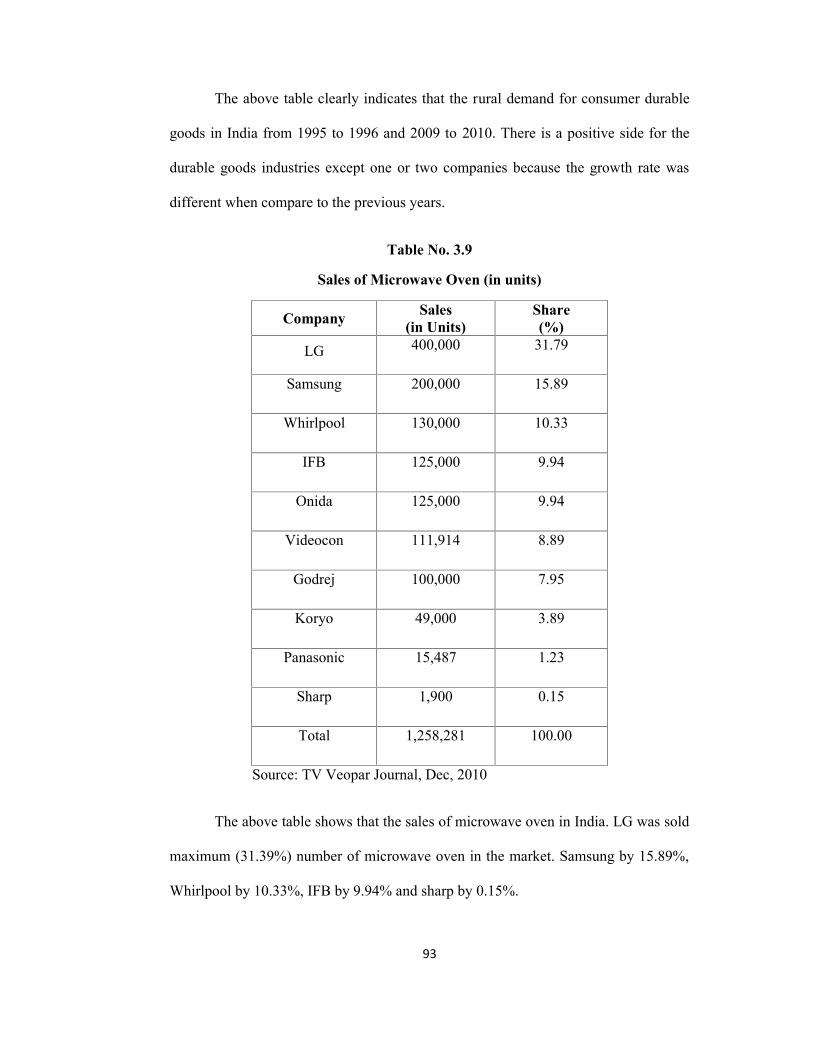
Table No. 3.9
Sales of Microwave Oven (in units)
Company Sales(in Units)
Share(%)
LG 400,000 31.79
Samsung 200,000 15.89
Whirlpool 130,000 10.33
IFB 125,000 9.94
Onida 125,000 9.94
Videocon 111,914 8.89
Godrej 100,000 7.95
Koryo 49,000 3.89
Panasonic 15,487 1.23
Sharp 1,900 0.15
Total 1,258,281 100.00
Source: TV Veopar Journal, Dec, 2010
The above table shows that the sales of microwave oven in India. LG was sold
maximum (31.39%) number of microwave oven in the market. Samsung by 15.89%,
Whirlpool by 10.33%, IFB by 9.94% and sharp by 0.15%.
94
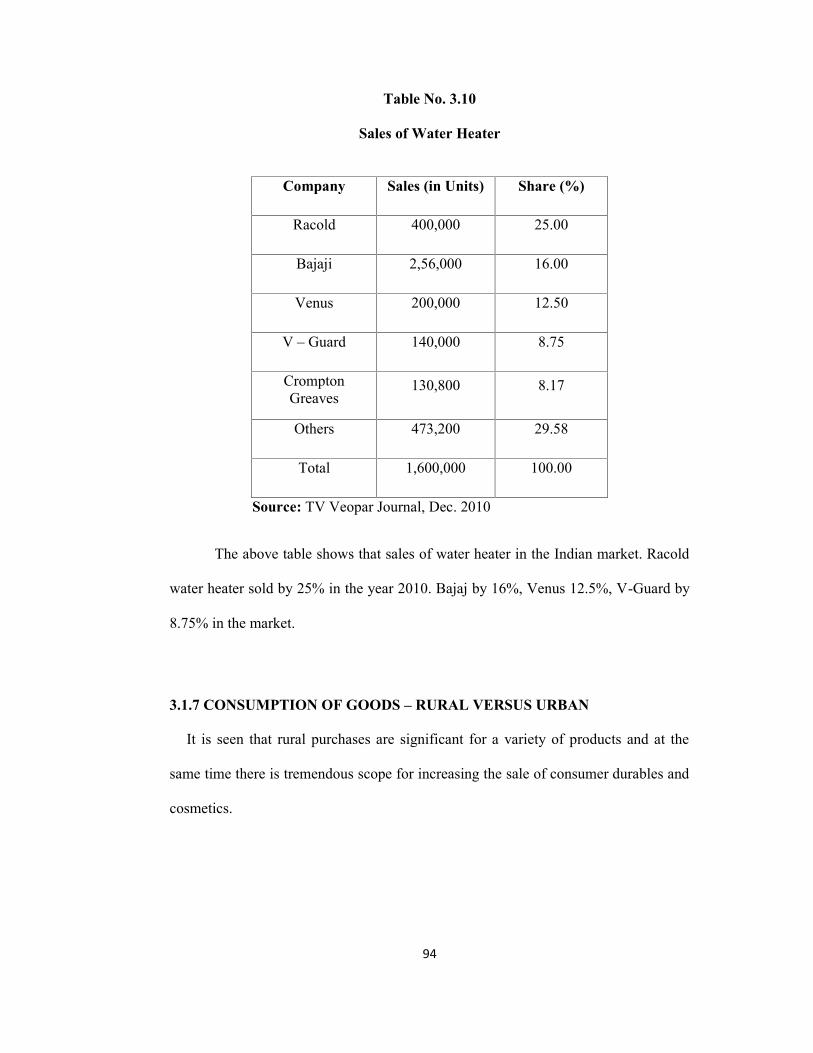
Table No. 3.10
Sales of Water Heater
Company Sales (in Units) Share (%)
Racold 400,000 25.00
Bajaji 2,56,000 16.00
Venus 200,000 12.50
V – Guard 140,000 8.75
CromptonGreaves
130,800 8.17
Others 473,200 29.58
Total 1,600,000 100.00
Source: TV Veopar Journal, Dec. 2010
The above table shows that sales of water heater in the Indian market. Racold
water heater sold by 25% in the year 2010. Bajaj by 16%, Venus 12.5%, V-Guard by
8.75% in the market.
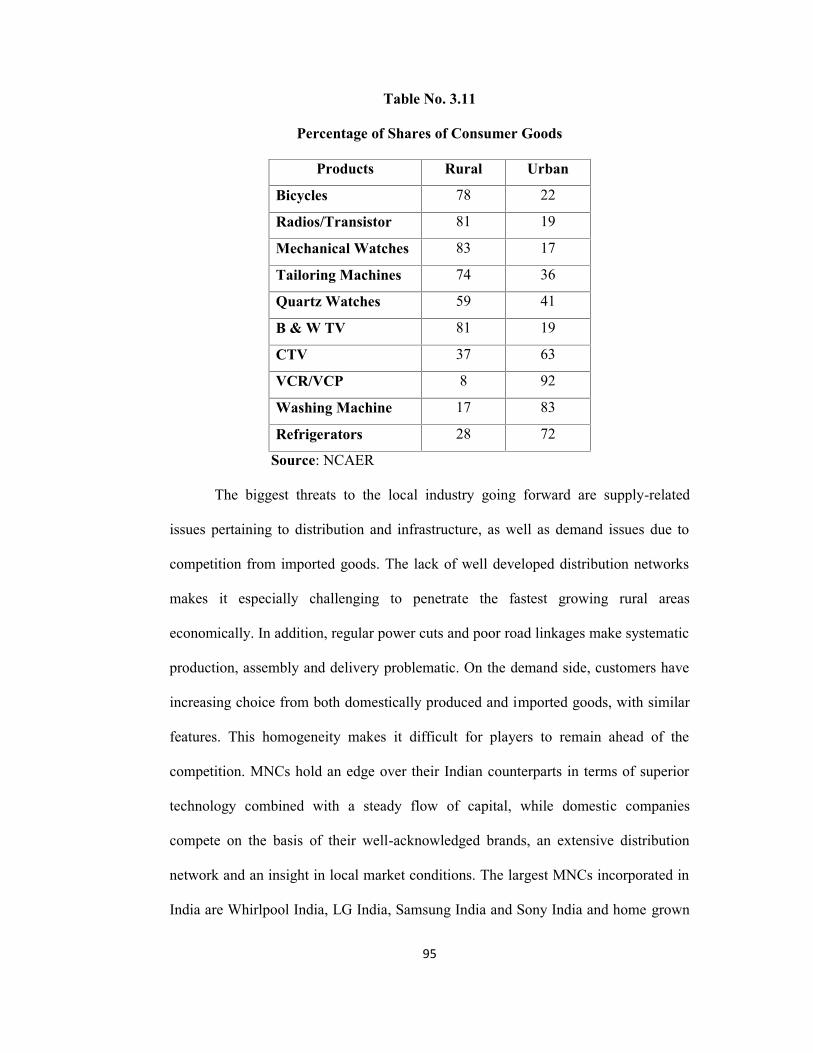
3.1.7 CONSUMPTION OF GOODS – RURAL VERSUS URBAN
It is seen that rural purchases are significant for a variety of products and at the
same time there is tremendous scope for increasing the sale of consumer durables and
cosmetics.
95
Table No. 3.11
Percentage of Shares of Consumer Goods
Products Rural Urban
Bicycles 78 22
Radios/Transistor 81 19
Mechanical Watches 83 17
Tailoring Machines 74 36
Quartz Watches 59 41
B & W TV 81 19
CTV 37 63
VCR/VCP 8 92
Washing Machine 17 83
Refrigerators 28 72
Source: NCAER
The biggest threats to the local industry going forward are supply-related
issues pertaining to distribution and infrastructure, as well as demand issues due to
competition from imported goods. The lack of well developed distribution networks
makes it especially challenging to penetrate the fastest growing rural areas
economically. In addition, regular power cuts and poor road linkages make systematic
production, assembly and delivery problematic. On the demand side, customers have
increasing choice from both domestically produced and imported goods, with similar
features. This homogeneity makes it difficult for players to remain ahead of the
competition. MNCs hold an edge over their Indian counterparts in terms of superior
technology combined with a steady flow of capital, while domestic companies
compete on the basis of their well-acknowledged brands, an extensive distribution
network and an insight in local market conditions. The largest MNCs incorporated in
India are Whirlpool India, LG India, Samsung India and Sony India and home grown
96
brands are Videocon, Godrej Industries and IFB. ” LG, Samsung, Godrej, Videocon
and Akai all missed their 2011 revenue targets for refrigerators, washing machines
and televisions by up to 15%, after a disastrous October-December quarter when sales
fell by up to 30% year-on-year, company executives said. They plan to focus on
premium segments, which are less impacted than mass-market products, this year”4.
3.1.8 FUTURE PROSPECTS FOR THE DURABLE INDUSTRY
Overall, the industry’s future remains robust, and interested applicants will
benefit from a holistic learning experience; Many of the research, sales, marketing
and advertising related roles will necessitate a good on-the-job learning of target
audiences, who may well be a totally new segment, based in never-before visited
Class II and III towns. In addition, those with technical backgrounds will be able to
leverage their knowledge and experience to constantly develop and innovate the
product variants. With more MNCs growing their Indian businesses, there is great
potential to also learn best-in-class systems and management skills. Eric Briganza,
President, Haier India Operations, said that “the company can expect around 50 per
cent growth over last year. September and October months are crucial for the
company. From the two months, company expect to achieve sales of Rs 200-250
crore," 5
4 Writankar Mukherjee, “Durable makers like LG, Samsung, Godrej miss 2011 sales targets due to
high input costs, weak rupee”, Economic Times Bureau, January 11, 2012.5 Eric Briganza, Consumer durables firms Samsung, Panasonic, LG and others look to cash in on
festive season, PTI, September 18, 2011.
97
3.2 PROFILE OF THE RESEARCH AREA
3.2.1BRIEF HISTORY OF NAMAKKAL DISTRICT
Namakkal District is a newly formed district from Salem District. It is
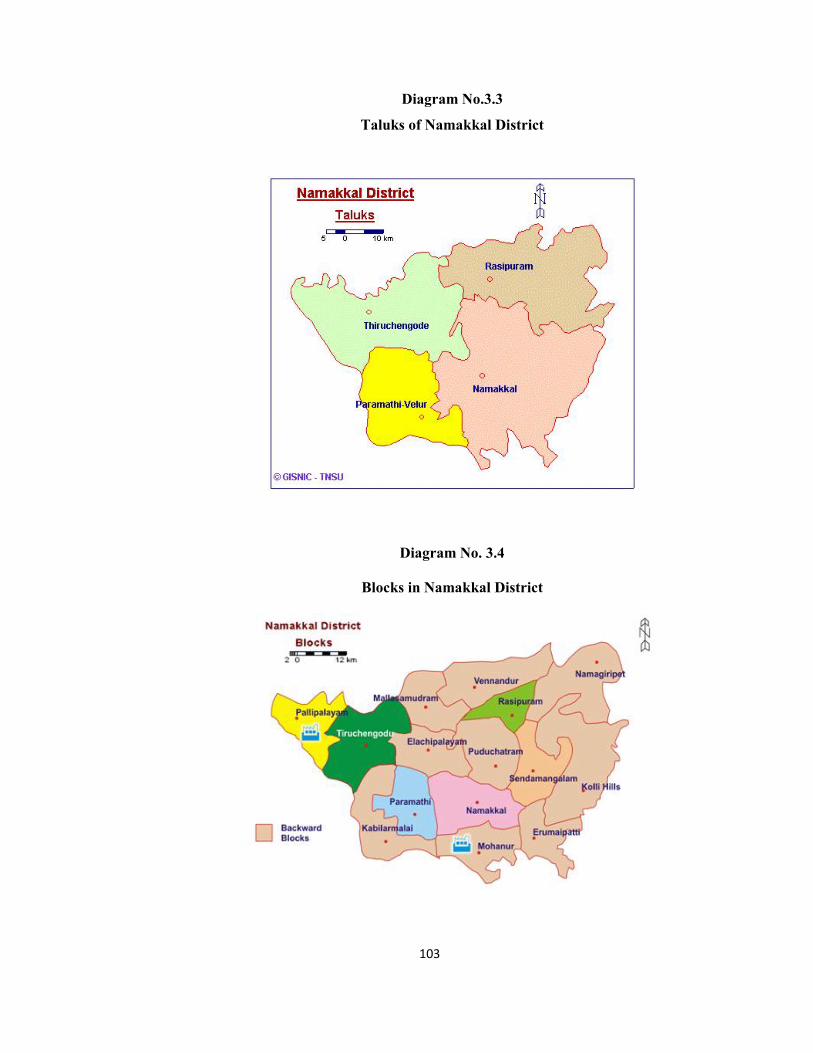
functioning from 01. 01. 1997. It consists of 4 Taluks namely Namakkal, Rasipuram,
Tiruchengode and Paramathi Velur. The district is bounded by salem on the north,
Karur on the south, Trichy and Salem on the east and Erode on the West. Namakkal is
the headquarters of Namakkal district in Tamil Nadu. Namakkal is nearby Kolli hills
and part of the Eastern Ghats. Kolli Hills is the most attractive destination in
Namakkal district. Cauvery River flows through the Namakkal district. The economy
of the district is primarily agricultural.
Namakkal is also called as "Namagiri", which is the name of the rock
formation at the center of the town. The Geographical area of the district is 3363, 35
K.m. This lies between 11.00 and 11.360 North Latitute and 77.280 and 78.300 East
Longitude. For Administrative purposes the district has been divided into 2 Revenue
Divisions, 4 Taluks, 30 Revenue firkas and 454 Revenue Villages. For local
arrangements, the district has been divided into 5 Municipalities, 15
Panchayats Unions, 19 Town Panchayats and 348 Village Panchayats.
The Northern portion of Namakkal is mountainous and the southern areas are
plains. The Chief rivers run through the district are Cauvery, Aiyaru, Karipottan Aaru
and Thirumanimutharu. The Cauvery flows south and south west hugging the
border. Kolli hills, famous tourist place in the district which is governed by 16
Village Panchayats are called’ Nadu with an area of 371.03 Sq Kms. And 1300
Mtrs above Sea level. In kolli hills the Malaiyalis are the prehistoric tribals. ‘Valvil
Ori’ the king of Kadai Yelu Vallal was ruled this hilly area. The famous Siva temple
98
Arappaleeswarar was originally a retreat of the jain Monks prior to its Hinduism. The
famous Water Falls namely, ‘Agash Ganga’ situated near the Temple.
Namakkal finds a place of importance in the map of India because it produces
major part of Eggs and sent to all over other parts of our country, and is also called
“Poultry Town” as it contains quite a number of poultry Farms and now called as
“Egg City”. There are Lorries, Trailers and L.P.G. Tanker Lorries are in Namakkal
district. More than 150 Lorry body building workshops and with a number of
subsidiary industries of auto body works are operating since 1960’s. Therefore it is
called as ‘Transport City ’. The formation of Railway route Salem to Karur is soon to
be completed end of this year 2011 which will held this district in economically. The
famous Tamil Poet” Namakkal Kavingnar Ramalingam Pillai” was born in this
district. In the memorize of the poet the state government established an arts and
science college for women.
Rasipuram is another important taluk in Namakkal District. The Chief industry
of the town is weaving. Puttunoolkarar who belongs in Sourastra Community lives in
large numbers in this town together with kaikolar. They are weaving Cotton Cloth and
silk Sarees. Another important aspect in the taluk is the Sago production. Nearly 176
Sago factories are located in and around the Rasipuram Taluk. Sago and Starch
production in this area are exported to other countries; Ghee production is also
famous in Rasipuram Taluk.
Tiruchengode is a town of cultural and historical importance. In the 19 th
Century, it was the Home of the Tamil Academy called ‘Pulavar Sangam’. Nearly 37
spinning mills and more than 10.000 Power looms are functioning in this area. One
Sugar mill and one Paper mill were functioning under Private Sector. Tiruchengode is
famous for Rig Vehicles More than 2,000 Vehicles were engaged in digging of bore
99
wells all over India. The Large number of power loom and handloom industries were
functioning in this Taluk., Arthanareeswarar temple in Trichengode is one of the
Pilgrimage center.
The famous Cauvery River flows in Paramathi Taluk. It helps more
irrigation of lands in Paramathi and Mohanur Blocks. The Mohanur Co- Operative
Sugar Mills is also situated in Paramathi Taluk in Mohanur Block.
3.2.2 DEMOGRAPHIC PROFILE OF THE DISTRICT
Population
As per 2001 census, the total population of the district is 14, 93,462 out of
which 7, 59,551 are males and 7, 33,911 are females.
Rural and Urban Population
Nearly 9,48,230 persons are living in rural areas which accounts for 63.5% of
the total population, and 545232 persons are living in Urban areas ie 36.5% of the
total population.
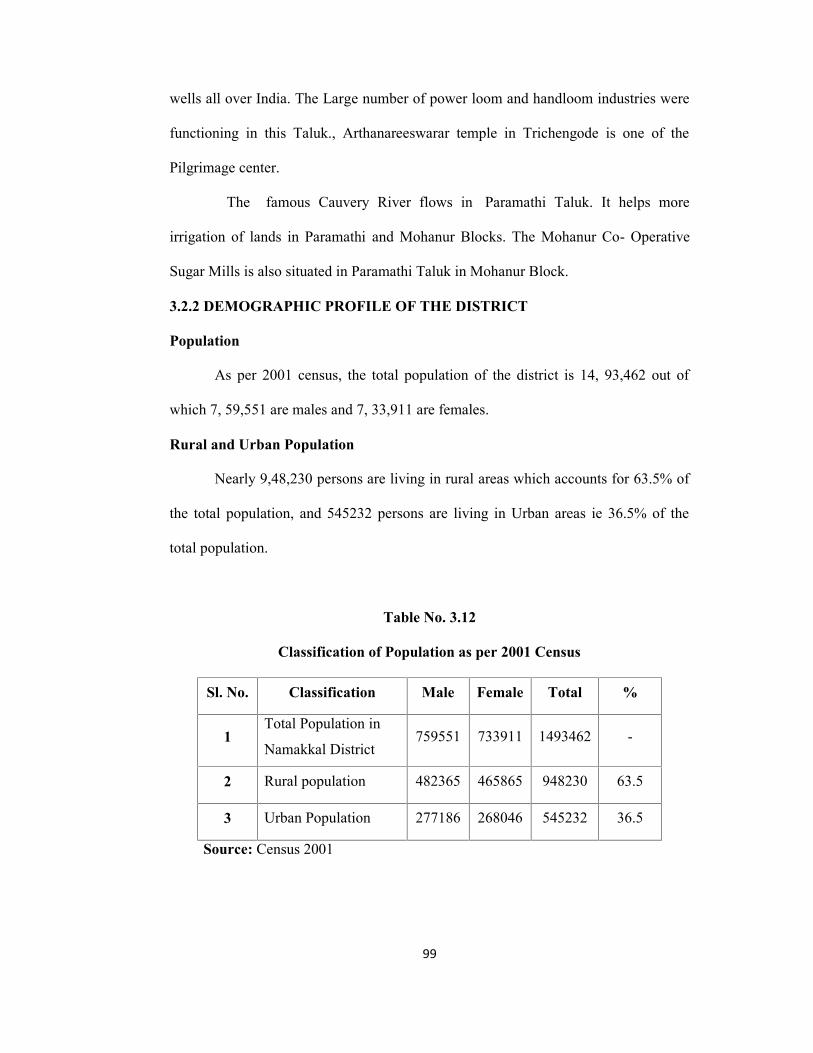
Table No. 3.12
Classification of Population as per 2001 Census
Sl. No. Classification Male Female Total %
1Total Population in
Namakkal District759551 733911 1493462 -
2 Rural population 482365 465865 948230 63.5
3 Urban Population 277186 268046 545232 36.5
Source: Census 2001
100
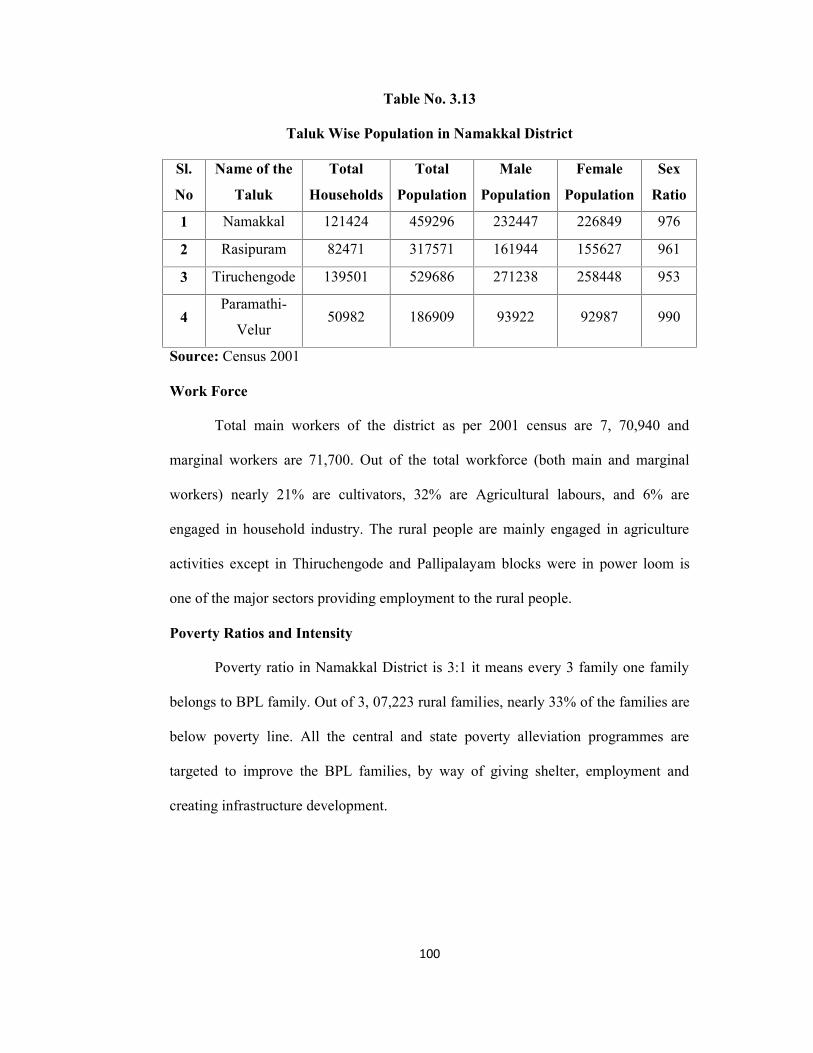
Table No. 3.13
Taluk Wise Population in Namakkal District
Sl.
No
Name of the
Taluk
Total
Households
Total
Population
Male
Population
Female
Population
Sex
Ratio
1 Namakkal 121424 459296 232447 226849 976
2 Rasipuram 82471 317571 161944 155627 961
3 Tiruchengode 139501 529686 271238 258448 953
4Paramathi-
Velur50982 186909 93922 92987 990
Source: Census 2001
Work Force
Total main workers of the district as per 2001 census are 7, 70,940 and
marginal workers are 71,700. Out of the total workforce (both main and marginal
workers) nearly 21% are cultivators, 32% are Agricultural labours, and 6% are
engaged in household industry. The rural people are mainly engaged in agriculture
activities except in Thiruchengode and Pallipalayam blocks were in power loom is
one of the major sectors providing employment to the rural people.
Poverty Ratios and Intensity
Poverty ratio in Namakkal District is 3:1 it means every 3 family one family
belongs to BPL family. Out of 3, 07,223 rural families, nearly 33% of the families are
below poverty line. All the central and state poverty alleviation programmes are
targeted to improve the BPL families, by way of giving shelter, employment and
creating infrastructure development.
101
3.2.3 ECONOMIC PROFILE
Area under Principal Crops Cultivated
Principal crops cultivated in Namakkal District are Paddy, Cholam,
Groundnut, Cotton, Sugarcane, Tapioca, Onion and Pulses.
Animal Husbandry and Fisheries
As per the 17th Quinquinnial Livestock census the total cattle population for
the districts is 3, 96,064, sheep 1, 40,233 and goat is 3, 78,885. Nearly 600 poultry
forms functioning in this district having 2.5 crore birds producing 1.25 crore eggs per
day. Nearly one lakh people getting employment directly and indirectly from this
poultry forms.
Mining & Forestry Based Activities
Bauxite, Limestone, Quartz and Feldspar are the major minerals taken from
the mining units in the district. Nearly 1, 16,226 M.T. of Bauxite, 26,312 MTs of
Limestone and 89,601 MTs of granite taken up during the year 2006-07. Nearly 13%
of the total Geographical area is under Reserve forest which is in Kolli Hills block.
Eucalyptus, Bamboos, Silver oak is the major trees growing in the forest area.
Rural Industries and Other Manufacturing Units
There are 79 weavers society functioning in the district. Nearly 4,340 families
engaged in handloom weaving. More than 10,000 powers looms functioning in
Tiruchengode and Pallipalayam Block. 21 handicraft production centres engaged in
cloth, soap, leather goods, shoes and Honey production. 477 small scale industries
functioning in the district.
Service and other Activities
There are approximately 75 Nationalized Banks, 31 Commercial Banks, 32
Co-operative Banks, 164 Primary Agricultural Co-operative Banks, 151 other Co-
102
operative Societies are functioning in the district. Besides, Life Insurance Corporation
of India established 5 branches, 3 United India Insurance branches, 8 other Insurance
Companies are in the district.
Employment Status
As per the Census report 2001, the Employment Status of the people in the
district under different sector shows that 4,01,617 peoples are engaged in
Agriculture, 42,859 peoples are running Animal Husbandry , 22, 164 peoples are
working in mining and forestry, 50, 538 peoples are operating rural industries, and
3,25,462 peoples are engaged in services and other activities.
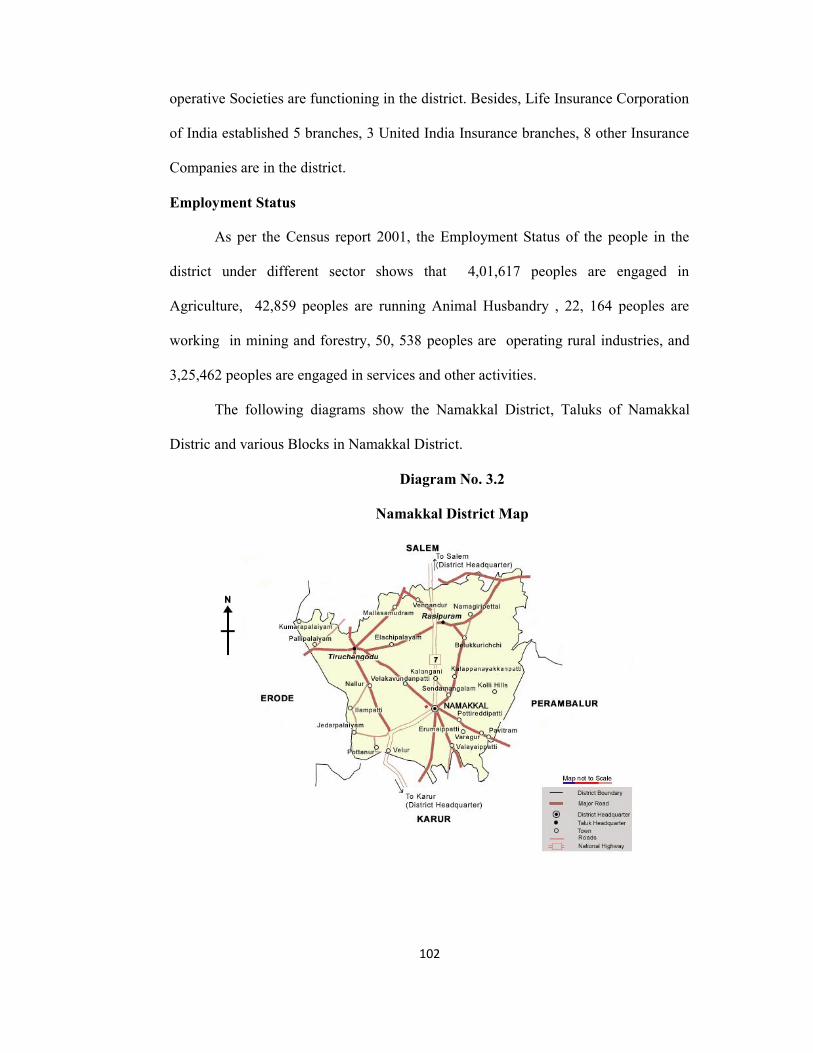
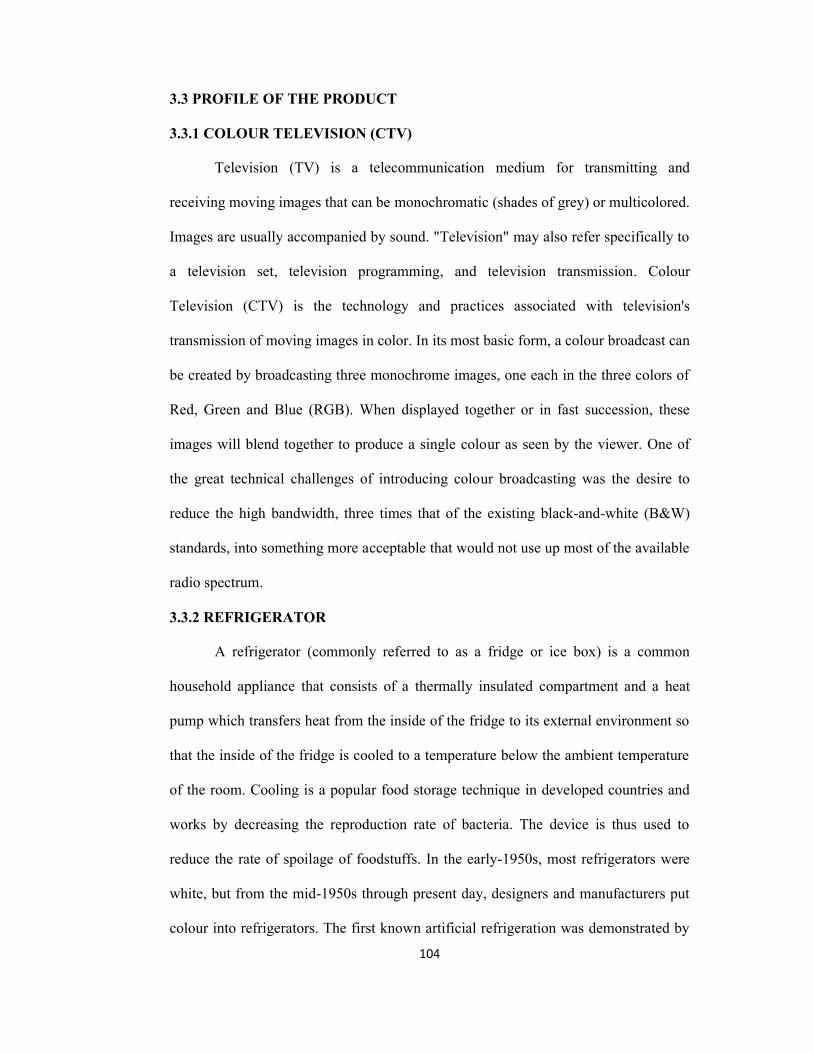
The following diagrams show the Namakkal District, Taluks of Namakkal
Distric and various Blocks in Namakkal District.
Diagram No. 3.2
Namakkal District Map
103
Diagram No.3.3
Taluks of Namakkal District
Diagram No. 3.4
Blocks in Namakkal District
104
3.3 PROFILE OF THE PRODUCT
3.3.1 COLOUR TELEVISION (CTV)
Television (TV) is a telecommunication medium for transmitting and
receiving moving images that can be monochromatic (shades of grey) or multicolored.
Images are usually accompanied by sound. "Television" may also refer specifically to
a television set, television programming, and television transmission. Colour
Television (CTV) is the technology and practices associated with television's
transmission of moving images in color. In its most basic form, a colour broadcast can
be created by broadcasting three monochrome images, one each in the three colors of
Red, Green and Blue (RGB). When displayed together or in fast succession, these
images will blend together to produce a single colour as seen by the viewer. One of
the great technical challenges of introducing colour broadcasting was the desire to
reduce the high bandwidth, three times that of the existing black-and-white (B&W)
standards, into something more acceptable that would not use up most of the available
radio spectrum.
3.3.2 REFRIGERATOR
A refrigerator (commonly referred to as a fridge or ice box) is a common
household appliance that consists of a thermally insulated compartment and a heat
pump which transfers heat from the inside of the fridge to its external environment so
that the inside of the fridge is cooled to a temperature below the ambient temperature
of the room. Cooling is a popular food storage technique in developed countries and
works by decreasing the reproduction rate of bacteria. The device is thus used to
reduce the rate of spoilage of foodstuffs. In the early-1950s, most refrigerators were
white, but from the mid-1950s through present day, designers and manufacturers put
colour into refrigerators. The first known artificial refrigeration was demonstrated by
105
William Cullen at the University of Glasgow in 1748. A refrigerator maintains a
temperature a few degrees above the freezing point of water. Optimum temperature
range for perishable food storage is 3 to 5 °C (37 to 41 °F).
3.3.3 FAN
A ceiling fan is a device suspended from the ceiling of a room, which employs
hub-mounted rotating paddles to circulate air. The first ceiling fans appeared in the
early 1860s and 1870s, in the United States. At that time, they were not powered by
any form of electric motor. Instead, a stream of running water was used, in
conjunction with a turbine, to drive a system of belts which would turn the blades of
two-blade fan units. The electrically-powered ceiling fan was invented in 1882 by
Philip Diehl (pronounced the same as "deal"). Diehl had engineered the electric motor
used in the first Singer sewing machines, and in 1882 adapted that motor for use in a
ceiling-mounted fan. "The Diehl Electric Fan", as it was known, operated like a
common modern-day ceiling fan; each fan had its own self-contained motor unit,
eliminating the need for costly and bulky belt systems.
3.3.4 MIXER
A mixer is a kitchen appliance intended for mixing, folding, beating, and
whipping food ingredients. Mixers come in two major variations, hand mixers and
stand mixers. The first electric mixer was invented by Herbert Johnston in 1908 and
sold by the Kitchen Aid division of the Hobart Manufacturing Company. Mixers
should not be confused with blenders. Blenders contain sharp blades and typically
operate at higher speeds that chop, liquefy, or otherwise break down larger food
items. A mixer is a much slower device without sharpened blades.
106
3.3.5 GRINDER
A wet grinder is a grinder used with water. Wet grinders have a wide
application in industry, workshops, and commercial and domestic kitchens throughout
Africa and Asia. Kitchen wet grinders are very popular tools in the South Indian
kitchen and are used to make paste out of soaked cereals and lentils. The earlier form
of wet grinder, called attu kal, used mechanical energy in which the user had to rotate
the top stone, called kullavi, to grind the medium. The electric-powered wet grinder
was invented by Mr. Sabapathi of Coimbatore. By this invention, the powered wet
grinders have both the top and the base stone rotating. These electric models were
first introduced in restaurants, and later moved into homes. The Indian government is
planning to get Geographical Indication for Coimbatore wet grinders.