31. arsenic removal - uk - 090606
TRANSCRIPT

Arsenic Removal from Drinking Water
May 2006

May 2006 Dissertation
David Laird 2 Civil & Environmental Engineering
Stage 4
Abstract
The use of rice husk ash (RHA) as an absorbent for Arsenic is examined in this report. RHA is a
commercially available waste product, created from the burning of rice husks to generate electricity. This
study centres around the effect of contact times, pH and RHA dose on the removal efficiency on Arsenic
by the RHA. Recommendations are made on the optimum conditions in which to use RHA and these
figures are related to practical use in Bangladesh. Further studies are conducted into the removal of the
RHA after absorption has occurred; these involve the use of a handmade ceramic filter. From these
studies, RHA is found to be a suitable absorbent which is particularly suited to use in low technology
environment in conjunction with a ceramic filter. Experimental results obtained show a reduction in
Arsenic concentration from over 350 µg/l to less than 10 µg/l in 24 hours when RHA is combined with a
ceramic filter. The use of ceramic filters and RHA is discussed in the context of ‘appropriate technology’
for the developing world.

May 2006 Dissertation
David Laird 3 Civil & Environmental Engineering
Stage 4
Abbreviations
AA Activated Alumina
AAS Atomic Absorption Spectrometry
ANOVA Analysis of Variance Method
As Arsenic
ASV Anodic Stripping Voltammetry
BGS British Geological Survey
BS British Standard
EC European Community
EPA Environmental Protection Agency (United States of America)
GFAAS Graphite Furnace Atomic Absorption Spectrometry
HGAAS Hydride Generator Atomic Absorption Spectrometry
HGAFS Atomic Fluorescence Spectrometry with Hydride System
HPC High Performance Concrete
IARC International Agency for Research on Cancer
ICP-AES Inductively Coupled Plasma: Atomic Emission Spectrometry
ICP-MS Inductively Coupled Plasma: Mass Spectrometry
ICP-OES Inductively Coupled Plasma: Optical Emission Spectrometry
IX Ion Exchange
MSDS Material Safety Data Sheets
NERC Natural Environment Research Council
NTP National Toxicity Program
OSHA Occupational Safety and Health Administration
RHA Rice Husk Ash
SDDC Silver Diethyldithiocarbamate Spectrometric Method
UNICEF United Nations International Children's Emergency Fund
WHO World Health Organisation

May 2006 Dissertation
David Laird 4 Civil & Environmental Engineering
Stage 4
Table of Contents
1. INTRODUCTION............................................................................................................................. 7
1.1 AIMS ................................................................................................................................................ 7 1.2 OBJECTIVES ..................................................................................................................................... 7
2. LITERATURE REVIEW .................................................................................................................... 8
2.1 ARSENIC........................................................................................................................................... 8 2.1.1 Global Situation ...................................................................................................................... 8 2.1.2 Chemical Background........................................................................................................... 10
2.2 DETECTION OF ARSENIC THROUGH LABORATORY METHODS....................................................... 11 2.2.1 Introduction........................................................................................................................... 11 2.2.2 Atomic Absorption Spectrometry (AAS) ............................................................................... 11 2.2.3 Inductively Coupled Plasma: Optical Emission Spectrometry............................................ 12 2.2.4 Inductively Coupled Plasma: Atomic Emission Spectrometry (ICP-AES).......................... 12 2.2.5 Inductively Coupled Plasma: Mass Spectrometry (ICP-MS) .............................................. 12 2.2.6 Atomic Fluorescence Spectrometry with Hydride Gas (HGAFS) ....................................... 12 2.2.7 Anodic Stripping Voltammetry (ASV)................................................................................... 12 2.2.8 Silver Diethyldithiocarbamate Spectrometric Method (SDDC) .......................................... 13
2.3 FIELD TESTING METHODS FOR DETECTING ARSENIC ................................................................... 13 2.4 CURRENT METHODS OF ARSENIC REMOVAL FROM DRINKING WATER ........................................... 14
2.4.1 Summary................................................................................................................................ 14 2.4.2 Activated Alumina (AA) ........................................................................................................ 14 2.4.3 Coagulation / co-precipitation ............................................................................................. 14 2.4.4 Lime softening ....................................................................................................................... 14 2.4.5 Reverse osmosis .................................................................................................................... 14 2.4.6 Ion exchange (IX).................................................................................................................. 15 2.4.7 Activated carbon ................................................................................................................... 15
2.5 ARSENIC CONTAMINATION IN BANGLADESH ................................................................................ 15 2.6 ACTIVATED CARBON ..................................................................................................................... 16
2.6.1 Sorption Theory .................................................................................................................... 17 2.6.2 Sorption with Activated Carbon ........................................................................................... 19
2.7 ARSENIC RESIDUAL DISPOSAL METHODS ..................................................................................... 20 2.8 LEGAL JUDGEMENT ON BANGLADESH ARSENIC VICTIMS ............................................................ 20 2.9 RICE HUSK ASH ............................................................................................................................. 20
2.9.1 Background ........................................................................................................................... 20 2.9.2 Physical Properties............................................................................................................... 21 2.9.3 Health hazards from crystalline and amorphous silica. ...................................................... 22
2.10 ADDENDUM TO INTRODUCTION..................................................................................................... 23 2.4.8 Absorption with Silica........................................................................................................... 23

May 2006 Dissertation
David Laird 5 Civil & Environmental Engineering
Stage 4
2.7 ARSENIC RESIDUAL DISPOSAL METHODS ..................................................................................... 23
3. METHODOLOGY.............................................................................................................................. 24
3.1 RATIONALE .................................................................................................................................... 24 3.2 EXPERIMENTAL PROCEDURE ......................................................................................................... 24
3.2.1 Experiment 1 ......................................................................................................................... 24 3.2.2 Experiment 2 ......................................................................................................................... 25 3.2.3 Experiment 3 ......................................................................................................................... 26
3.3 FILTER DESIGN & CONSTRUCTION................................................................................................ 26 3.4 LIMITATIONS / CONSIDERATIONS / ASSUMPTIONS ........................................................................ 27
3.4.1 Main Variables...................................................................................................................... 27 3.4.2 Testing Methods Considered ................................................................................................ 27 3.4.3 Selected Methods .................................................................................................................. 28
3.5 DETECTION OF ARSENIC ................................................................................................................ 28 3.6 STATISTICAL DATA ANALYSIS METHODS..................................................................................... 29 3.7 HEALTH & SAFETY CONSIDERATIONS .......................................................................................... 29 3.8 ADDENDUM TO METHODOLOGY.................................................................................................... 30
General .................................................................................................................................................. 30 Experiment 1 - pH ................................................................................................................................. 30 Experiment 2 - RHA Concentration...................................................................................................... 31 Filter Design & Construction ............................................................................................................... 31
4. RESULTS & DISCUSSION .............................................................................................................. 32
4.1 RHA CONCENTRATION.................................................................................................................. 32 4.2 EFFECT OF INITIAL PH ................................................................................................................... 35 4.3 CERAMIC FILTER AS A REMOVAL METHOD .................................................................................. 38
5. CONCLUSIONS ................................................................................................................................. 40
6. RECOMMENDATIONS.................................................................................................................... 42
7. REFERENCES.................................................................................................................................... 43
APPENDIX I................................................................................................................................................ 46
APPENDIX II .............................................................................................................................................. 55
APPENDIX III............................................................................................................................................. 57
APPENDIX IV............................................................................................................................................. 59

May 2006 Dissertation
David Laird 6 Civil & Environmental Engineering
Stage 4
Table of Figures
FIGURE 1: ARSENIC IN THE USA (RYKER 2001).............................................................................................. 9 FIGURE 2: ARSENIC IN BANGLADESH (MCARTHUR 2000) .............................................................................. 9 FIGURE 3: PH / EH PLOT OF ARSENIC SPECULATION (BGS 2003)................................................................. 11 FIGURE 4: EFFECT OF RHA CONCENTRATION ON ARSENIC REMOVAL EFFICIENCY..................................... 34 FIGURE 5: EFFECT OF INITIAL PH ON ARSENIC REMOVAL EFFICIENCY ........................................................ 37
Table of Tables
TABLE 1: ARSENIC SPECIES AND POSSIBLE MOLECULES .............................................................................. 10 TABLE 2: EU LANDFILL DIRECTIVE ARSENIC LIMITS (BS EN 12457 – 3).................................................... 20 TABLE 3: CHEMICAL COMPOSITION OF RICE HUSK ASH (ARAYAPRANEE, NA-RANONG ET AL. 2005)........ 22 TABLE 4: RHA REMOVAL EFFICIENCY BY MASS.......................................................................................... 33 TABLE 5: REMOVAL EFFICIENCIES WITH VARYING PH.................................................................................. 35
Table of Equations
EQUATION 1: THE FREUNDLICH EQUATION................................................................................................... 18 EQUATION 2: THE FREUNDLICH ISOTHERM ................................................................................................... 18 EQUATION 3: THE LANGMUIR EQUATION...................................................................................................... 18

May 2006 Dissertation
David Laird 7 Civil & Environmental Engineering
Stage 4
1. Introduction
1.1 Aims
The project has two main aims:
1. Firstly to investigate and evaluate the effectiveness of RHA as a removal medium for Arsenic.
2. Secondly should the RHA prove to be effective, to construct a filter package suitable for point of
use systems that will retain the RHA and Arsenic during the water treatment process.
1.2 Objectives
1. Conduct a literature review in to all relevant material. This will include research into all current
uses for RHA and the Arsenic situation in Bangladesh.
2. Prepare a detailed methodology for an experimental procedure and analysis that will allow the
aims of the project to be fulfilled.
3. Familiarise myself with RHA and ensure that is able to be used in the way the methodology has
set out.
4. Evaluate the effectiveness of RHA on Arsenic removal through initial testing to determine
suitable testing concentrations.
5. Determine the most effective pH at which to run the RHA concentration experiments.
6. Determine the optimum RHA concentration.
7. Design and build a point of use filter system suitable for use in Bangladesh.

May 2006 Dissertation
David Laird 8 Civil & Environmental Engineering
Stage 4
2. Literature review
2.1 Arsenic
2.1.1 Global Situation
Arsenic contamination of groundwater abstracted for drinking water is global problem. It is only recently
that the scope of the problem has been fully realised. The causes of this poisoning vary from the drinking
of naturally contaminated water (Bangladesh, India, USA, China, Taiwan and Vietnam) to the use of
Arsenic rich coal (China) to mining activities (Japan and Malaysia). (TraceDetect 2005) The visible
effects of Arsenic poisoning are normally delayed due to the small doses involved, and it may take many
years or even decades for the full scale of the problem to be fully recognised. Indeed this is what has
occurred in Bangladesh, the problem emerged in 1980’s and effects were first seen in the 1990’s.
The nature of the problem in the Western USA is similar to Bangladesh; the abstracted groundwater is
contaminated with doses of Arsenic that are damaging to human health. The main difference between
these two situations is the average dose is lower in the USA. The U.S. Environmental Protection Agency,
estimates that 75 % of homes in the Western states are supplied with water that exceeds the WHO
standard of 10 µg/l. (Ryker 2001)
As knowledge of the toxic effects grew, the standard regarding Arsenic in drinking became more
stringent. In 1993, the WHO provisionally reduced its guideline value from 50 µg/l to 10 µg/l. (BGS
2003) Following this the EPA, the EC, and the Japanese also reduced their permitted levels to 10 µg/l.
Bangladesh is considered by many experts to be the country worst affected by Arsenic poisoning.
Millions of people drink contaminated drinking water every day containing concentrations of Arsenic in
excess of the recommended safe level. This problem is exacerbated by the lack of investment in providing
solutions to this vast problem.
Figure 1 and Figure 2 show the extent of the problem, with large proportions of the population in
Bangladesh exceeding the country’s 50 µg/l limit.

May 2006 Dissertation
David Laird 9 Civil & Environmental Engineering
Stage 4
Figure 1: Arsenic in the USA (Ryker 2001)
Figure 2: Arsenic in Bangladesh (McArthur 2000)
May 2006 Dissertation
David Laird 10 Civil & Environmental Engineering
Stage 4
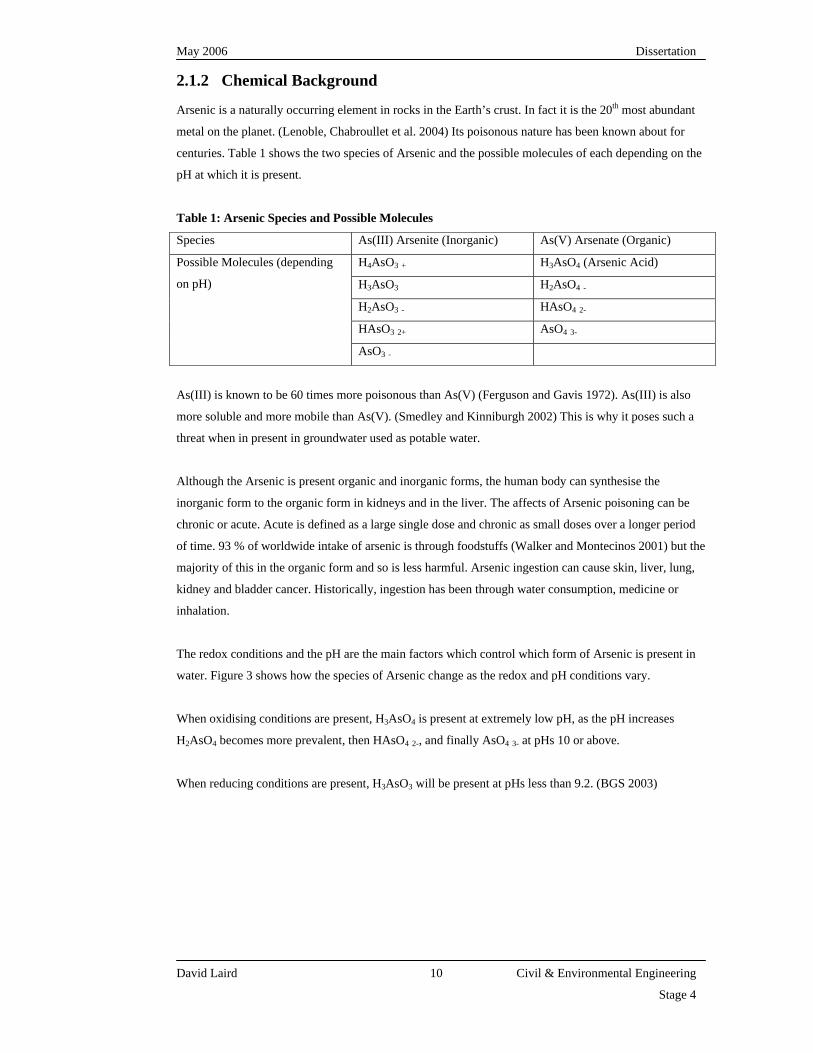
2.1.2 Chemical Background
Arsenic is a naturally occurring element in rocks in the Earth’s crust. In fact it is the 20th most abundant
metal on the planet. (Lenoble, Chabroullet et al. 2004) Its poisonous nature has been known about for
centuries. Table 1 shows the two species of Arsenic and the possible molecules of each depending on the
pH at which it is present.
Table 1: Arsenic Species and Possible Molecules
Species As(III) Arsenite (Inorganic) As(V) Arsenate (Organic)
H4AsO3 + H3AsO4 (Arsenic Acid)
H3AsO3 H2AsO4 -
H2AsO3 - HAsO4 2-
HAsO3 2+ AsO4 3-
Possible Molecules (depending
on pH)
AsO3 -
As(III) is known to be 60 times more poisonous than As(V) (Ferguson and Gavis 1972). As(III) is also
more soluble and more mobile than As(V). (Smedley and Kinniburgh 2002) This is why it poses such a
threat when in present in groundwater used as potable water.
Although the Arsenic is present organic and inorganic forms, the human body can synthesise the
inorganic form to the organic form in kidneys and in the liver. The affects of Arsenic poisoning can be
chronic or acute. Acute is defined as a large single dose and chronic as small doses over a longer period
of time. 93 % of worldwide intake of arsenic is through foodstuffs (Walker and Montecinos 2001) but the
majority of this in the organic form and so is less harmful. Arsenic ingestion can cause skin, liver, lung,
kidney and bladder cancer. Historically, ingestion has been through water consumption, medicine or
inhalation.
The redox conditions and the pH are the main factors which control which form of Arsenic is present in
water. Figure 3 shows how the species of Arsenic change as the redox and pH conditions vary.
When oxidising conditions are present, H3AsO4 is present at extremely low pH, as the pH increases
H2AsO4 becomes more prevalent, then HAsO4 2-, and finally AsO4 3- at pHs 10 or above.
When reducing conditions are present, H3AsO3 will be present at pHs less than 9.2. (BGS 2003)

May 2006 Dissertation
David Laird 11 Civil & Environmental Engineering
Stage 4
Figure 3: pH / Eh Plot of Arsenic Speculation (BGS 2003)
2.2 Detection of Arsenic through Laboratory Methods
2.2.1 Introduction
Arsenic cannot be measured directly; so in laboratory methods the excited Arsenic ions emit light and the
wavelength and quantity of this light is analysed.
2.2.2 Atomic Absorption Spectrometry (AAS)
Atomic Absorption Spectrometry (AAS) is the most common laboratory based method and is possible in
two forms; the Hydride Gas System (HGAAS) and the Graphite Furnace (GFAAS) system. (Rasmussen
and Andersen 2001) states that: “The HGAAS technique is based on the atomic absorption measurement
of arsenic generated by thermal decomposition of As(III) hydride. As(III) is reduced to gaseous As(III)
hydride by reaction with sodium tetrahydroborate in a hydrochloric acid.”
“In GFAAS a discrete sample volume is injected into a graphite tube, which is heated stepwise to
dry and remove the main part of the matrix and finally to atomise arsenic, which is then measured in the
spectral light from the cathode lamp”(Rasmussen and Andersen 2001).

May 2006 Dissertation
David Laird 12 Civil & Environmental Engineering
Stage 4
2.2.3 Inductively Coupled Plasma: Optical Emission Spectrometry
ICP-OES is widely used because of its ability to analyse a single sample for up to 60 elements, normally
in less than one minute. The machine used the plasma stream to split the sample into its constituent
elements. They are then excited and the wavelength of the light they emit corresponds to a given element.
Set up is quick before the test run and there is normally less interference than in Atomic Absorption
Spectrometry.
2.2.4 Inductively Coupled Plasma: Atomic Emission Spectrometry (ICP-
AES)
“The liquid sample is transported as an aerosol to an argon plasma at 6000-8000 K, where arsenic is
atomised and where a radio frequency inductively coupled plasma produces element-specific emission
spectra.”(Rasmussen and Andersen 2001) Detection limits of 35 - 50 µg/l are quoted for arsenic by the
instrument Manufacturers (Rasmussen and Andersen 2001) This would make them unsuitable testing
samples of treated water in the laboratory as concentrations will hopefully less than 10 µg/l if the process
sampled is successful.
2.2.5 Inductively Coupled Plasma: Mass Spectrometry (ICP-MS)
With this method the sample is placed in an inert gas based plasma. It is necessary to create an extremely
high temperature in order to generate the necessary plasma. Any ions that are created in this process are
analysed by a mass spectrometer. This system is good for samples containing more than one element, as
the ions are separated on their mass to charge characteristics. “In general, detection limits of between 0.02
µg/l and 1 µg/l are quoted.”(Rasmussen and Andersen 2001)
2.2.6 Atomic Fluorescence Spectrometry with Hydride Gas (HGAFS)
This method relies the treatment of the sample with hydrochloric acid, potassium iodide and ascorbic acid
to ensure reduction of As(V) to As(III). Sodium tetrahydroborate is added to the sample to create Arsenic
rich gas needed for detection. The generated hydride arsine is transported by the use of Argon gas to the
flame used for atomisation. The flame is created through the combustion of hydrogen. The arsine hydride
atoms are then detected by atomic fluorescence spectrometry.
2.2.7 Anodic Stripping Voltammetry (ASV)
Arsenic ions in solution are plated onto negatively charged metallic plated electrode. This concentrates
the Arsenic on the anode; the solution is also stirred to help with the deposition. After the deposition has
occurred the potential is reversed and peaks can be detected where Arsenic ions are deposited. The height
of the peak directly relates the concentration of Arsenic present in solution. The disadvantages of this
method are standard solutions must be used to calibrate the machine and inferences limit the detection
capacity.

May 2006 Dissertation
David Laird 13 Civil & Environmental Engineering
Stage 4
2.2.8 Silver Diethyldithiocarbamate Spectrometric Method (SDDC)
The SDDC method is widely used because of it relative simplicity. Arsine gas is produced by reacting the
sample with sodium borohydride. The arsine gas is then absorbed by the silver diethyldithiocarbamate
and spectrometry is used to measure the colour of the solution. Advantages with is method are that it can
detect and measure both As(III) and As(V) together. Disadvantages are that no methyl arsenic compounds
can be present in the sample.
2.3 Field Testing Methods for Detecting Arsenic
Accurate laboratory measurement of Arsenic present in samples is an expensive process which requires
complex and expensive machines. Often there is a need to measure Arsenic concentrations rapidly and
cheaply in field, especially in developing countries. Field based kits can only reliably detect very high
concentrations of Arsenic; it is not possible to accurately quantify the presence of Arsenic. Whilst this is
adequate when high concentrations are present, it is not suitable if Arsenic is present in lower
concentrations.
The Gutzeit Method for the detection of Arsenic is the most commonly used field testing method. It was
first developed in 1891 to detect the presence of Arsenic in solution. Sanger and Black improved the
method in 1907 to the following method. As the Arsenic present in the sample is reduced by Zinc and
acid, Arsine (AsH3) and hydrogen is produced. This gas reacts with lead acetate paper and to eliminate
any hydrogen sulphide present. It then reacts with mercuric bromide. The mercuric bromide is in the form
of a paper. Should Arsenic be present it will produce a yellowish spot. If a calibration scale is known, an
estimate can be made of the Arsenic in the original sample. The yellow compound produced is light
sensitive and the test must therefore be performed out of sunlight. Also by using blue light the yellowish
spot can be compared to a colour chart more accurately.
This method lacks sensitivity and is hard to reproduce consistently. Although this basic method has
remained virtually unchanged for one hundred years, some improvements have been made. A large
number of kits pass the gas stream through a lead salt filter. This removes the need for an oxidising
reagent before the gas is generated.
Similar improvements include replacing the hydrochloric acid with sulfamic acid. This is a solid and is
easier to handle. If the rate of the reaction needs to be increased, sodium tetrahydroborate (NaBH4) can be
used as the reducing agent, this will decrease the time taken for the whole process to less than ten
minutes.
May 2006 Dissertation
David Laird 14 Civil & Environmental Engineering
Stage 4
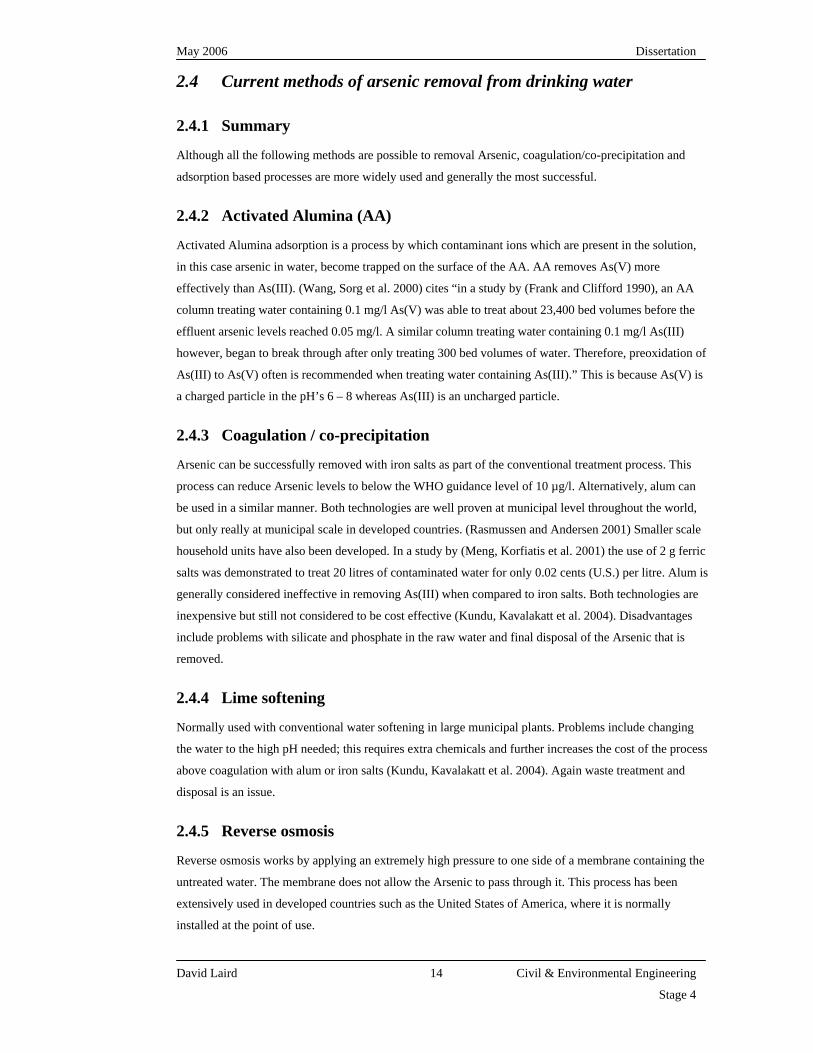
2.4 Current methods of arsenic removal from drinking water
2.4.1 Summary
Although all the following methods are possible to removal Arsenic, coagulation/co-precipitation and
adsorption based processes are more widely used and generally the most successful.
2.4.2 Activated Alumina (AA)
Activated Alumina adsorption is a process by which contaminant ions which are present in the solution,
in this case arsenic in water, become trapped on the surface of the AA. AA removes As(V) more
effectively than As(III). (Wang, Sorg et al. 2000) cites “in a study by (Frank and Clifford 1990), an AA
column treating water containing 0.1 mg/l As(V) was able to treat about 23,400 bed volumes before the
effluent arsenic levels reached 0.05 mg/l. A similar column treating water containing 0.1 mg/l As(III)
however, began to break through after only treating 300 bed volumes of water. Therefore, preoxidation of
As(III) to As(V) often is recommended when treating water containing As(III).” This is because As(V) is
a charged particle in the pH’s 6 – 8 whereas As(III) is an uncharged particle.
2.4.3 Coagulation / co-precipitation
Arsenic can be successfully removed with iron salts as part of the conventional treatment process. This
process can reduce Arsenic levels to below the WHO guidance level of 10 µg/l. Alternatively, alum can
be used in a similar manner. Both technologies are well proven at municipal level throughout the world,
but only really at municipal scale in developed countries. (Rasmussen and Andersen 2001) Smaller scale
household units have also been developed. In a study by (Meng, Korfiatis et al. 2001) the use of 2 g ferric
salts was demonstrated to treat 20 litres of contaminated water for only 0.02 cents (U.S.) per litre. Alum is
generally considered ineffective in removing As(III) when compared to iron salts. Both technologies are
inexpensive but still not considered to be cost effective (Kundu, Kavalakatt et al. 2004). Disadvantages
include problems with silicate and phosphate in the raw water and final disposal of the Arsenic that is
removed.
2.4.4 Lime softening
Normally used with conventional water softening in large municipal plants. Problems include changing
the water to the high pH needed; this requires extra chemicals and further increases the cost of the process
above coagulation with alum or iron salts (Kundu, Kavalakatt et al. 2004). Again waste treatment and
disposal is an issue.
2.4.5 Reverse osmosis
Reverse osmosis works by applying an extremely high pressure to one side of a membrane containing the
untreated water. The membrane does not allow the Arsenic to pass through it. This process has been
extensively used in developed countries such as the United States of America, where it is normally
installed at the point of use.

May 2006 Dissertation
David Laird 15 Civil & Environmental Engineering
Stage 4
2.4.6 Ion exchange (IX)
The ion exchange process works by exchanging ions on its resin material for the contaminate ions in the
water to be treated. The ions exchanged must be of a similar charge to those of the resin material.
Normally in resin forms, and piloted in industrialised countries is considered to be highly effective in the
removal of As(V) but ineffective in the removal As(III) (Rasmussen and Andersen 2001) This is again
because As(III) occurs in the form of an uncharged particle below pH 9.0. It is considered moderately
expensive and so it is limited to smaller scale use.
2.4.7 Activated carbon
Carbon based adsorption has been used successfully for decades in the U.S. to remove Arsenic from
abstracted groundwater. This process operates at municipal plant level and removal rates of 99% have
been reported. (Bianchelli 2003) This rate of removal is achieved through the careful selection of media
to match the water’s characteristics and optimisation of the inputted water’s chemistry.
This excellent removal rate is only feasible in a developed country, the technology and the skills
necessary to operate such plants do not readily exist in developed countries. However in a low technology
setting carbon based media does have the greatest potential to deliver. Activated carbon is discussed in
more detail in Section 2.6.
2.5 Arsenic Contamination in Bangladesh
The nature of the problem in Bangladesh is the high concentrations of Arsenic that is dissolved/present in
the groundwater that is extracted for use as drinking water without any further treatment.
Millions of shallow hand pumped tube wells were unknowing sunk by various agencies including
UNICEF in the 1980’s in a measure to reduce the infant mortality rate in Bangladesh through the supply
of high quality water. It is thought that at the time the scientists that sunk the tube wells did not test the
sampled water for the presence of Arsenic.
This arsenic is present because of three factors. Firstly, there is a source of Arsenic present in the aquifer.
Secondly, the Arsenic is able to be mobilised from these rocks through chemical processes and thirdly,
there is a transport mechanism available to remove the water from the aquifer. This Arsenic is present in
the deposited sediment that has been eroded over thousands of years from Arsenic bearing stratum.
Opinions vary on the method of mobilisation of the Arsenic from the ground to the water. Presently there
are two viable hypotheses. The first hypothesis is the ‘reduction of iron oxide theory’ proposed by (Das,
Samanta et al. 1996) and the other is the ‘pyrite oxidation’ theory’ proposed by (Bagla and Kaiser 1996).
The iron oxide reduction theory proposes that the Arsenic rich sediment is buried to such a great a depth
that the atmosphere is considered anaerobic. The groundwater present at this depth is then considered to
be strongly reducing thus mobilising the Arsenic through the processes of dissolution and desorption.

May 2006 Dissertation
David Laird 16 Civil & Environmental Engineering
Stage 4
(Ravenscroft, McArthur et al. 2001) has speculated that this the main method that Arsenic enters the
drinking water in the Bengal Basin of Bangladesh and West Bengal (India).
The pyrite oxidation theory combined with ‘drawdown’ proposes that the wide scale abstraction of water
during the dry season significantly lowers the water table. As the water level falls the water is replaced by
air, the oxygen in the air oxidises arsenopyrite. As the water table then rises the Arsenic is released.
Arsenic concentrations in the water extracted from the shallow tube wells can be as high as 200 µg/l –
500 µg/l. The WHO guideline for Arsenic in drinking water was reduced in 1993 from 50 µg/l to 10 µg/l,
but many less economically developed countries, including Bangladesh, have kept their standard at 50
µg/l due to lack of money available to treat water that does not comply with the new more stringent
standards. In Bangladesh this problem is magnified due to the fact that water sourced from boreholes is
considered preferable to water from surface sources. This is because many surface water supplies are
heavily contaminated with pathogens that cause disease, such as cholera and dysentery.
These doses have led to estimates of chronic Arsenic poisoning to vary from 25 million (Jiang 2001) to
over 100 million people. (Bagla and Kaiser 1996) Other estimates indicate that 200,000 – 270,000 will
die from cancer this year in Bangladesh. (Smith and Smith 2004)
2.6 Activated Carbon
The history of activated carbon dates back over 2 millennia. However it has only been used widely since
the start of the 20th century. Even then it was only available in its powdered form. Its first use was to
whiten sugar granules and for the treatment of water. During World War One, granular activated carbon
was developed to counter the threat posed by mustard gas. Since then it has been used for air and water
treatment. What makes activated carbon so useful for air and water treatment is its large surface, one
gram of activated carbon can have a surface area of 500 to 1400 m2 (Baksi, Biswas et al. 2003). Nut
shells, coal, softwood and lignite are the main raw materials for commercially produced activated carbon
though other materials can be successfully used, for example peat. Activated carbon works primarily
through the process of adsorption and absorption. This works by the particle to be adsorbed being
attracted to the activated carbon by Van der Waal's forces. Because this process is a physical one, it is a
reversible one. This means that the regeneration of activated carbon is possible.
Activated carbon is normally compared on four separate categories: total surface area, carbon density,
particle size distribution, and adsorptive capacity. Through the evaluation of all these factors the
adsorption rate and capacity can be determined.
Total surface area is measured in square meters per gram, as previously stated it normally varies between
500 – 1400 m2 per gram. Because the process of determining the total surface area involves the sorption
of butane gas on the particle, the adsorptive capacity the carbon will be reduced if adsorbing large
molecules.

May 2006 Dissertation
David Laird 17 Civil & Environmental Engineering
Stage 4
The carbon density is the weight of a given amount of carbon. This is done by packing the carbon into a
100 ml graduated tube using a vibrating feeder to guarantee maximum packing efficiency. The higher
density normally indicates the activated carbon is a higher quality.
The particle sizes for activated carbon are measured to produce a particle size distribution. Typically, the
smaller the particle, the faster the rate of adsorption. (Perrich 1981) This particle size distribution governs
the use of the activated carbon, for example too small a particle may be washed away during a plant’s
normal operation. Particle size is one of the main factors that govern the adsorption rate. The pore size
distribution / pore volume ratio is another factor which can be compared.
The adsorptive capacity is the ability of the particle to adsorb a certain molecule. In order to objectively
compare different types and sizes of activated carbon, the iodine number is used to describe the ability to
adsorb smaller particles. The iodine number is defined as the number of milligrams of iodine adsorbed by
one gram of carbon when the iodine concentration in the residual is 0.02 normal. (Perrich 1981)
Typically, water treatment carbons have iodine numbers ranging from 600 to 1100. (Perrich 1981)
Commonly this parameter is used to estimate the degree of exhaustion of the carbon when in use. Care
must be take when use this estimation as chemical interactions can affect the capacity of the carbon.
The Molasses Number is a method that measures the decolourisation of a molasses solution when it is
filtered through a standard activated carbon set. The Molasses Number is used to describe the ability to
adsorb large particles. Generally the higher number the higher degree of activation.
The Hardness / Abrasion Number is a measure of activated carbon’s resistance to degradation. It is
measured by use of the Ro-Tap machine, in which steel ball bearings accelerate the attrition caused by
normal use. The higher the Abrasion Number the higher the carbon’s ability to maintain its physical
integrity, this is important as the less carbon that needs to be replaced – the lower the plant’s running
costs.
2.6.1 Sorption Theory
Sorption is normally the term used to describe the processes of adsorption and absorption. Adsorption is
the process when the contaminant in solution is attracted the surface of the sorbent. Absorption is process
by which the attracted solute is diffused into the interior of the sorbent. When this applied to the sorption
process the adsorption occurs through Van der Waal's forces. Van der Waal's forces are intermolecular
attractions due to the polarisation of molecules involved
These forms of sorption processes are physical and because of this, particles can attach in layers around
the particle. The physical attraction decreases as the distance from the particle increases, much like the
nature of gravitational forces. When carbon is activated, the surface is given more energy and so is able to
attract more molecules.

May 2006 Dissertation
David Laird 18 Civil & Environmental Engineering
Stage 4
Sorption rate depends on the rate of the three main stages of sorption. The transfer of the solute to the
layer of liquid surrounding the particle is normally increased by passing the bulk liquid continually past
the sorbent. The transfer across the surface of the particle is normally the rate limiting factor as the
adsorption on to the internal pores is very fast. (Perrich 1981)
Isotherms are normally used to model the adsorption process. Isotherms compare the concentrations of
the solute in the bulk liquid and in the sorbent material. The Freundlich adsorption isotherm is the most
widely used method of describing adsorption processes in aqueous systems. The following equations are
taken from (Faust and Aly 1987). The Freundlich equation is expressed as:
neKC
mx /1=
Equation 1: The Freundlich Equation
Where x = the amount of solute adsorbed, m = the weight of absorbent, Ce = the solute equilibrium
concentration, and K and 1/n constants characteristic of the system. To express the data graphically the
equation is expressed as:
eCn
Kmx log1loglog +=
Equation 2: The Freundlich Isotherm
Steep slopes i.e. 1/n close to 1, indicate a high adsorptive capacity at high equilibrium concentrations that
rapidly diminishes at lower equilibrium concentrations covered by the isotherm. (Faust and Aly 1987)
One drawback with isotherm is it does not consider that there are a finite amount of sites available for
adsorption.
With this limitation in mind, the Langmuir isotherm was created. The Langmuir equation is expressed as:
e
em
bCbCXX
+=
1
Equation 3: The Langmuir Equation
Where: X = x/m, the amount of solute adsorbed, x, per unit weight of adsorbent, m; Ce = equilibrium
concentration of the solute; Xm = amount of solute adsorbed per unit weight of adsorbent required for
monolayer coverage of the surface, also called the monolayer capacity; and b = a constant related to the
heat of adsorption.
May 2006 Dissertation
David Laird 19 Civil & Environmental Engineering
Stage 4
Although equations do exist to predict and modelling isotherms, it is extremely difficult to model real
world experiments with isotherms to there being so may variables to consider. Laboratory pilot plants and
data are normally the most accurate way to determine adsorption.
2.6.2 Sorption with Activated Carbon
Sorption is a complex process to model even with only one solute present. However with a basic
knowledge of sorption theory, rules can be developed regarding activated carbon sorption.
(Perrich 1981) lists the factors affecting adsorption capacity as:
• Surface area of activated carbon
• Pore size of carbon
• Solubility of solute in aqueous solution
• pH
• Temperature
The size of particle has a marginal affect on the capacity, as the internal surface area is many times bigger
than the external surface. (Perrich 1981) states that crushing GAC only increases its total surface area by
1%.
It also must be noted that solubility is inversely proportion to the ability to be adsorbed. (Wagner 1981)
stated that: “a given carbon filter reduced a test solution of 1000 mg/L methanol (% solubility infinite) by
only 3.6 % methanol, while a solution with the same concentration of Benzene (0.07 % solubility) was
reduced by 95 %.”
(Perrich 1981) lists the factors affecting adsorption rate as:
• Size of activated carbon particle
• Concentration of solute in solution
• Temperature of solution
The rate limiting factor for adsorption is diffusion. So the variables that can affect diffusion have a large
effect on adsorption. The factors that affect diffusion are the concentration gradient and the temperature.
So by increasing the concentration gradient, the rate of adsorption will increase up to a certain level. In
the real world applications, where the concentration and temperature of the influent can not easily be
altered, the size of carbon particle is reduced in order to increase adsorption rate. Increasing the
temperature may increase the diffusion rate, but may reduce the adsorption rate. These two factors
normally offset one another.

May 2006 Dissertation
David Laird 20 Civil & Environmental Engineering
Stage 4
2.7 Arsenic Residual Disposal Methods
The disposal of Arsenic, either from water treatment sludge or conventional chemical sources is not
straight forward. Above certain limits, defined below, Arsenic is classed as a hazardous waste and must
be disposed in specially designed hazardous waste landfill. Due to recent changes in the EU Landfill
Directive (1999) hazardous waste will only be accepted into a hazardous landfill if it can comply with the
Waste Acceptance Criteria (WAC). These WAC became fully active on the 16th July 2005. Although it
must be recognised that these limits are not relevant to the current situation in Bangladesh. (European
Parliament 1999; British Standards 2002)
Table 2: EU Landfill Directive Arsenic Limits (BS EN 12457 – 3)
Inert Waste Landfill Stable Non-Reactive Hazardous
Waste in Non-Hazardous
Landfill
Hazardous Waste Landfill
0.5mg/kg 2mg/kg 25mg/kg
2.8 Legal Judgement on Bangladesh Arsenic Victims
In recent years, one case has been lodged by those affected by Arsenic poisoning against those they deem
to be responsible. In October 2001 a group of Bangladeshi villagers threatened to sue the British
Geological Survey’s (BGS) parent body Natural Environment Research Council (NERC) for negligence.
The plaintiffs claimed to be suffering from chronic Arsenic poisoning and claimed for damages.
In May 2003 the High Court Judge gave the go ahead for the trial. The court case judged whether the
BGS was negligent when it was operating Bangladesh in 1991. The BGS was contracted by the British
Overseas Development Administration to improve boreholes in regions of Bangladesh. BGS claims that it
understood that these boreholes were used for irrigation and fish farming and not for drinking. Arsenic
was assumed not to be present and so was not tested for. This case was considered groundbreaking at the
time as a successful result would have lead to thousands of similar suits.
Then in February 2004 the Court of Appeal in London denied the claim to go to full trial. The Court of
Appeal said the defence evidence was overwhelming. The plaintiffs are currently pursing the case to the
House of Lords.
2.9 Rice Husk Ash
2.9.1 Background
Rice husk is primarily an agricultural waste / by-product created in the processing / milling of rice for
consumption. This waste is commonly use as a fuel source in the production of electricity. For every 1000
kg of paddy milled, about 220 kg (22 %) of husk is produced, and when this husk is burnt in the boilers,
about 55 kg (25 %) of RHA is generated. This RHA normally contains around 85 % - 90 % amorphous
silica. In India about 20 million tonnes of RHA is produced annually. (Singhania 2005)

May 2006 Dissertation
David Laird 21 Civil & Environmental Engineering
Stage 4
Currently RHA’s main use lies in construction industry as an admixture in High Performance Concrete
(HPC). The highly pozzolanic nature of RHA, due to the fineness of the material, improves the strength
and durability, so it is particularly suited for use in marine environments and factory floors. It also has
significant environmental and cost benefits, by the reducing the amount of cement powder needed. Other
uses of RHA are as a constituent of fertiliser, glaze for pottery and flame resistant paints. (Singhania
2005)
Although applications of rice husk ash in water treatment have been limited so far, the absorption of lead
and mercury have been studied. (Feng, Lin et al. 2004) concluded that “rice husk ash is a suitable
absorbent of lead and mercury ions from aqueous water and the Bangham equation can be used to express
the mechanism of absorption.” Further to this (Feng, Lin et al. 2004) also stated that “the finer the rice
husk ash particles used, the higher the pH of the solution…the more lead and mercury are absorbed by
rice husk ash.”
2.9.2 Physical Properties
Typical constituents can be seen in Table 3.
The typical mean particle size can vary between 36.6 µm (Arayapranee, Na-Ranong et al. 2005) and
25µm (Singhania 2005) During the formation of RHA the form of silica present is dependant on the
temperature and duration of combustion.(Nehdi, Duquette et al. 2003).
Opinions vary on exactly how to maximise the silica content. (Mehta 1979) has stated that an oven
temperature of less than 500 °C for long periods of time can create amorphous silica. Similarly
temperatures of up to 680 °C for 1 minute can achieve the same result. (Chopra, Ahluwalia et al. 1981)
agrees with this and comments that up to 700 °C all silica is in amorphous form. (Yeoh 1979) challenges
this and states that: “RHA can remain in the amorphous form at combustion temperatures of up to 900°C
if the combustion time is less than 1 h, while crystalline silica is produced at 1000 °C with combustion
time greater than 5 minutes.” However, such thermal treatment of the silica in the husk results in
structural transformations that influence both the pozzolanic activity of the ash and its grindability.
(Singhania 2005)

May 2006 Dissertation
David Laird 22 Civil & Environmental Engineering
Stage 4
Table 3: Chemical Composition of Rice Husk Ash (Arayapranee, Na-Ranong et al. 2005)
Component %
Loss on ignition at 800°C 4.00
Moisture content 4.98
Silica (SiO2) 92.1
Alumina (Al2O3) 0.51
Iron oxide (Fe2O3) 0.40
Calcium oxide (CaO) 0.55
Magnesium oxide (MgO) nd
Sodium oxide (Na2O) nd
Potassium oxide (K2O) 1.53
Titanium dioxide (TiO2) 0.02
Manganese oxide(MnO) 0.08
Phosphorus pentaoxide (P2O5) 0.36
Sulphur trioxide (SO3) 0.12
2.9.3 Health hazards from crystalline and amorphous silica.
Crystalline Silica
Crystalline silica has been classified as a known carcinogen. Exposure can cause silicosis and lung
cancer. The National Institute for Occupational Safety and Health has a recommended exposure limit (in
air) of 0.05 mg/m3.
Amorphous Silica
Low potential as a carcinogen, not classified as one by: NTP, IARC or OSHA. But normally both forms
of silica occur together so it is best to assume that any silica is crystalline.

May 2006 Dissertation
David Laird 23 Civil & Environmental Engineering
Stage 4
2.10 Addendum to Introduction
2.4.8 Absorption with Silica
This section is an addendum to Section 2.4 Current methods of arsenic removal from drinking water
The use of Silica to absorb heavy metal pollution is considered a relatively modern technology compared
with, for example ion exchange. Silica is readily available in the form of rocks and mineral oxides. The
potential of silica as an absorbent has should great potential in the developing world because of it is
“fairly uniform in its chemical and physical properties” (Katsumata, Kaneco et al. 2003) This means that
it can be easily manufactured anywhere and still retain the original qualities.
Silica can also be regenerated by the stripping the heavy metals from they with an acid solution.
(Katsumata, Kaneco et al. 2003) stated that in their experiments they observed that after 20 cycles the
product remained stable and the removal rate was virtually unchanged. Silica it similar to RHA, in that it
has a high specific surface area, 680 m2/g was quoted by (Katsumata, Kaneco et al. 2003). It was also
noted that pH’s above 3 offer the best removal efficiencies for Chromium (VI), Cadmium (II), Copper (II)
and Lead (II). It was also noted that removal efficiencies reduced from 90 % to 50 % as the metal
concentration was increased from 100 ppm to 1000 ppm respectively.
As RHA is approximately 92.1 % Silica oxide similar results can be expected to activated alumina.
2.7 Arsenic Residual Disposal Methods
This section is an addendum to Section 2.7 Arsenic Residual Disposal Methods.
Arsenic contained in water treatment sludge has been investigated by (Meng, Korfiatis et al. 2001). It was
found that contaminated sludge contained approximately 66 times more Arsenic than the soil surrounding
a contaminated well. (1194 mg/kg against 18 mg/kg). It was also estimated that a family will produce 2.5
kg of this sludge each year. Meng goes on to state that the sludge leachate contained 3 times less Arsenic
than the soil leachate, thus with careful disposal, the contamination of the surrounding area can be
minimised. Options for this include disposal in restricted areas and use as a construction material.
May 2006 Dissertation
David Laird 24 Civil & Environmental Engineering
Stage 4
3. Methodology
3.1 Rationale
The removal of Arsenic from the samples will be carried out with two main variables: pH and RHA
concentration. Through the variation of these parameters, an optimum condition will be calculated; this
will allow the first aim to be fulfilled. In order to meet the second aim, a filter package suitable for point
of use will be designed and constructed.
3.2 Experimental Procedure
3.2.1 Experiment 1
Introduction
Experiment 1 is designed to confirm RHA’s ability to adsorb Arsenic.
Method
1. Pipette out 1ml of standard 1000mg/l Arsenic solution into a beaker
2. Measure out approximately 1000ml of distilled water using a 100ml measuring cylinder and add to a
1litre container
3. Add 99ml of distilled water from the 1litre container with 10ml pipette to beaker (solution now
10000µg/l As)
4. Using a 5ml pipette remove 5ml of solution from beaker and add to a test tube
5. Use digital pH to measure pH and record
6. Weigh out 1g of RHA on mass balance
7. Add 1g of RHA to test tube containing diluted Arsenic solution
8. Place plug on test tube and gently shake until both materials have fully mixed
9. Place the test tube in a test tube rack for 10 minutes
10. After these 10 minutes immediately place test tube in the centrifuge to separate the two materials
11. Mark up test tube and analyse for Arsenic content in ICP-OES (possible pH adjust with nitric acid)
12. Use a 5ml pipette to remove 10ml from the beaker and add to a new beaker (beaker 2)
13. Remove 90ml of distilled water using a 5ml pipette from the 1litre container and add to beaker 2
(solution now 1000µg/l As)
14. Repeat steps 4 through 11
Comments / Considerations
By adding the RHA to the diluted Arsenic solution, it removes the need to retain the RHA in a filter
during the experiments, thus decreasing the time taken to set-up the testing equipment. As any dilutions
will increase the pH of the solution and any pH adjustment may cause the Arsenic to precipitate out of the

May 2006 Dissertation
David Laird 25 Civil & Environmental Engineering
Stage 4
solution, therefore any pH adjustment will be made as close as possible to the time when the sample is
needed.
3.2.2 Experiment 2
Introduction
Experiment 2 is designed to evaluate the effect of pH on Arsenic removal with RHA. For this experiment
the initial Arsenic concentration will be 300µg/l.
Method
1. Pipette out 6ml of standard 1000mg/l Arsenic solution into a beaker
2. Measure out approximately 300ml of Ouseburn water using a 100ml measuring cylinder and add to a
1litre container
3. Add 94ml of Ouseburn water from the 1litre container with 10ml pipette to beaker (solution now
60000µg/l As)
4. Pipette out 1ml out of beaker in to beaker 2
5. Add 199ml of Ouseburn water from the 1litre container with 10ml pipette to beaker 2(solution now
300µg/l As)
6. Divide the 200ml solution into 4 equal quantities of 50ml and place each in a clearly labelled beaker
7. Each of the four beakers will have their pH’s adjusted to either 6, 7,8,9
8. Add hydrochloric acid or sodium hydroxide to adjust pH. Use digital pH meter as guide.
9. Use mass balance to measure 5 No.10g of RHA
10. Add one measured quantity of RHA the pH 6 beaker, cover and gently mix
11. Pipette out a 5ml sample in to a new test tube with a 5ml pipette after 1 minute.
12. Immediately place the sample in the centrifuge.
13. Continue to remove and separate samples at 2, 5, 10, 20, 30, 45, 60 minutes
14. Mark up test tube and analyse for Arsenic content in ICP-OES (possible pH adjust with nitric acid)
15. Repeat for pH’s 7, 8 and 9
Comments / Considerations
The use of Ouseburn water will buffer any pH changes during experiment due to carbonates present.

May 2006 Dissertation
David Laird 26 Civil & Environmental Engineering
Stage 4
3.2.3 Experiment 3
Introduction
Experiment 3 is designed to evaluate the effect of RHA concentration on Arsenic removal. For this
experiment the initial Arsenic concentration will be 300µg/l.
Method
1. Pipette out 6ml of standard 1000mg/l Arsenic solution into a beaker
2. Measure out approximately 300ml of Ouseburn water using a 100ml measuring cylinder and add to a
1litre container
3. Add 94ml of Ouseburn water from the 1litre container with 10ml pipette to beaker (solution now
60000µg/l As)
4. Pipette out 1ml out of beaker in to beaker 2
5. Add 199ml of Ouseburn water from the 1litre container with 10ml pipette to beaker 2(solution now
300µg/l As)
6. Divide the 200ml solution into 4 equal quantities of 50ml and place each in a clearly labelled beaker
7. Each of the four beakers will have their pH’s adjusted to 7
8. Add hydrochloric acid or sodium hydroxide to adjust pH. Use digital pH meter as guide.
9. Use mass balance to measure 1g, 5g, 10g, 20g of RHA
10. Add the 1g quantity of RHA to the first beaker, cover and gently mix
11. Pipette out a 5ml sample in to a new test tube with a 5ml pipette after 1 minute.
12. Immediately place the sample in the centrifuge.
13. Continue to remove and separate samples at 2, 5, 10, 20, 30, 45, 60 minutes
14. Mark up test tube and analyse for Arsenic content in ICP-OES (possible pH adjust with nitric acid)
15. Repeat for 5g, 10g, 20g
Comments / Considerations
The use of Ouseburn water will buffer any pH changes during experiment due to carbonates present.
3.3 Filter Design & Construction
Introduction
After evaluating the effective of RHA on Arsenic removal, to fulfil the second aim, it is planned to design
a point of use filter package suitable for use in developing countries such as Bangladesh.
Method
After the first aim is completed there will be a small amount of RHA left. To make best use of the
remaining amount, a scaled down RHA / ceramic filter will be constructed. A small plastic column
approximately 25mm in diameter and 150mm in length will be attached to a piece of ceramic material so
one end of the column is blocked. The remaining RHA will be placed in the column and batches of water
containing Arsenic will be poured through the column and the throughput collected and analysed in the

May 2006 Dissertation
David Laird 27 Civil & Environmental Engineering
Stage 4
same way as Experiments 1-3. It is expected due to the pore size of the ceramic and the particle size of
the RHA, the flow rate through the filter will reduce and stop as the pores in the ceramic material become
blocked with RHA.
3.4 Limitations / Considerations / Assumptions
There is a limited supply of RHA available so the selection of correct methods and parameters are
important. The Arsenic solutions needed for the experiments will be achieved by the dilution of a
standard 1000mg/l Arsenic solution. This the simplest and most accurate way of creating repeatable
Arsenic concentrations in the laboratory. Arsenic solution is normally stored in Nitric acid to keep the
Arsenic in solution. The pH of this solution is approximately 3. This is important as any dilutions will
increase the pH of the solution and any pH adjustment may cause the Arsenic to precipitate out of the
solution, therefore any pH adjustment will be made as close as possible to the time when the sample is
needed. The typical Arsenic concentration in groundwater in Bangladesh has been assumed at 300µg/l.
This will form the standard starting value that will be used in the following experiments.
3.4.1 Main Variables
The main variables will be:
• Time of contact between RHA and Arsenic.
• pH of Arsenic solution
• RHA / Arsenic Ratio
The temperature of sample and air temperature will also be recorded as this may influence the reaction
rate.
3.4.2 Testing Methods Considered
Interaction of RHA and Arsenic
Feasible Options available:
• Dynamic column study, 15, 30 minutes, flow rate etc
• Pour through, simulating point of use application
• Add RHA and stir for set time, like coagulation
With removal of a 5ml sample from batch reactor every 1, 2, or 5 minutes.
RHA removal from Sample
Feasible Options available:
• Coagulation with alum
• Micro / Ultra Filtration
• Centrifuge

May 2006 Dissertation
David Laird 28 Civil & Environmental Engineering
Stage 4
3.4.3 Selected Methods
Interaction of RHA and Arsenic
RHA addition to the sample has been selected because it can be tailored to evaluate if the RHA works in
principle then evaluate its effectiveness in subsequent experiments. This removes the need to retain the
RHA in a filter during the experiments, thus decreasing the time taken to set-up the testing equipment.
This method has been chosen as it simple to set up, easily repeatable, minimises the resources needed and
could closely simulate one possible point of use application. By emulating the intended use as closely as
possible, any additional factors that would not be considered in an alternative methodology will be
removed.
RHA removal from Sample
It is necessary to remove the RHA from the samples as the RHA will contain Arsenic and detected by the
ICP-OES. The centrifuge will be used to separate the RHA and the sample as it is available in laboratory,
quick and effective. Although this is not available normally at the point of use in developing countries,
further scope for work could involve investigation of a protein and alum as a point of use coagulant.
Milk and gelatine are possibilities. Of course, this process may remove Arsenic on its own and this would
have to be investigated.
3.5 Detection of Arsenic
It will be necessary to measure any possible reduction in the quantity of Arsenic in the samples after
treatment. To do this an ICP-OES machine will be used. This machine has been selected as it is readily
available during the timescale of the planned experiments, is simple to operate, and has detection limits
appropriate for this series of experiments. The ICP-OES can measure and record the presence of both
species of Arsenic.
The minimum sample size that is necessary to be able to analyse the sample is 5 ml. It is also advisable to
add 5 % Nitric acid to sample before it is analysed to keep the Arsenic in solution.
The operators of the ICP-OES are confident that Arsenic levels as low as 0.05 mg/l (50 µg/l) of Arsenic
can be reliably and consistently detected in the samples. Although this is the current drinking water
standard for Bangladesh, it is above the WHO standard of 10 µg/l (0.01 mg/l). This is not thought to be
problem as the experiments will probably not achieve this level of removal, due to the limited supply of
RHA. Although is does occur further analysis is always possible in a different machine if necessary.
In this respect HGAAS would have more useful due to the lower detection limits, but ICP-OES is
available and extremely quick and easy to use.

May 2006 Dissertation
David Laird 29 Civil & Environmental Engineering
Stage 4
3.6 Statistical Data Analysis Methods
In order to interpret if any changes in Arsenic content in the samples are due to increased RHA content or
a different sample pH, some form of statistical analysis must be used. By repeating the test say, 5 times, 5
sets of data will be available to be analysed. The analysis of variance method (ANOVA) will be used in
Microsoft Excel. This method is used to determine if any observed change of results is due to random
chance or not, or it can be used to say to a 95 % confidence level that A (and / or B) influenced the result
C.
There are two types of ANOVA commonly used:
• Simple, which is the effect of A on C
• Multiple, which is the effect of A and B on C
ANOVA has been selected because it allows for unbalanced sampling schemes, this maybe useful if any
error in the ICP-OES machine analysing one the samples. Data sets can be as small as 3 or 4 observations.
It is a robust method that can be easily adapted and is present as part of the standard analysis tools in
Microsoft Excel. The main disadvantage it is a complex method but through the use of Microsoft Excel it
will be simplified.
Isotherms will not be used, as they are very complex to calculate and this experiment method creates too
many variables to easily model.
3.7 Health & Safety Considerations
The scope of this project involves working with substances which are hazardous to human health. In order
to minimise exposure to this substances, MSDS have been used to construct suitable risk assessments.
Material Safety Data Sheets are attached in Appendix I
Risk Assessments are attached in Appendix II.
COSHH Forms are attached in Appendix III.

May 2006 Dissertation
David Laird 30 Civil & Environmental Engineering
Stage 4
3.8 Addendum to Methodology
The following section replaces:
3.2.1 Experiment 1
3.2.2 Experiment 2
3.2.3 Experiment 3
3.3 Filter Design & Construction
General
1. Using a mass balance weigh out 32.6 mg of Sodium Hydrogen Arsenate
2. Add to 500 ml of distilled water in a Duran bottle
3. This solution is of a concentration of 30,000 µg/l As
Experiment 1 - pH
1. Using a 1 ml pipette remove 1 ml of 30000 µg/l As solution and add to a 250 ml beaker
2. Measure out 100ml of distilled water and add to the 250 ml beaker (As solution now 300 µg/l)
3. Using digital pH meter as guide adjust the pH to 6 using either hydrochloric acid or sodium
hydroxide
4. Divide the As solution into two equal quantities of 50ml
5. Use a mass balance to measure out 1 g of RHA
6. Add the RHA to one of the beakers (the other is a control)
7. After 10 minutes pipette out 10 ml out of each beaker using a 10 ml pipette and place in a centrifuge
for 5 minutes on 2500 rpm
8. When finished, pipette out 5 ml of the supernatant in each sample and place into a clearly marked test
tube
9. Add 0.5 ml of 5% Nitric acid to each test tube
10. Repeat process at 20 minutes
11. Repeat procedure for pH’s 7, 8 and 9

May 2006 Dissertation
David Laird 31 Civil & Environmental Engineering
Stage 4
Experiment 2 - RHA Concentration
1. Using a 1 ml pipette remove 1 ml of 30000 µg/l As solution and add to a 250 ml beaker
2. Measure out 100ml of distilled water and add to the 250 ml beaker (As solution now 300 µg/l)
3. Use a mass balance to measure out 0.25 g of RHA
4. After 1 minute pipette out 10 ml out of each beaker using a 10 ml pipette and place in a centrifuge for
5 minutes on 2500 rpm
5. When finished, pipette out 5 ml of the supernatant in each sample and place into a clearly marked test
tube
6. Add 0.5 ml of 5% Nitric acid to each test tube
7. Repeat process at 2, 5, 10, 20 and 30 minutes
8. Repeat procedure for RHA masses of 0.5, 1 and 2 grams
9. Create a control sample in the same manner (but do not add RHA)
Filter Design & Construction
A ceramic filter designed and built during a thesis will be used evaluate whether a ceramic can remove
the RHA by direct filtration. After the first set of experiments there will be a sufficient quantity of RHA
to allow this to be done.
1. Using a 5 ml pipette remove 5 ml of 30000 µg/l As solution and add to a 500 ml beaker
2. Measure out 500 ml of distilled water and add to the 500 ml beaker (As solution now 300 µg/l)
3. Use a mass balance to measure out 0.25 g of RHA
4. Add RHA to beaker containing As solution and stir
5. Pour the contents of the beaker into the ceramic filter with a collection vessel underneath
6. After 24 hours remove a 10 ml sample of the filtrate with a 10 ml pipette and place into a clearly
marked test tube
7. Add 0.5 ml of 5% Nitric acid to each test tube
8. Take the remaining filtrate and use the turbidimeter to determine the turbidity of the sample
9. Measure out 100ml of distilled water and add to a 250 ml beaker
10. Use a mass balance to measure out 0.5 g of RHA
11. Add RHA to beaker containing the water and stir
12. Use the turbidimeter to determine the turbidity of the sample, stirring the sample immediately before
the measurement is taken

May 2006 Dissertation
David Laird 32 Civil & Environmental Engineering
Stage 4
4. Results & Discussion In general, in sections 4.1 and 4.2, RHA’s effectiveness was evaluated though the changing of one
parameter whilst the other two variables remained constant. This was done through the timed batch
sampling of a larger ‘reactor’.
4.1 RHA Concentration
The effect of RHA concentration on the removal of Arsenic from water samples was examined in order to
identify the optimum dosing amount for a given Arsenic concentration. These results are shown in Figure
4.
In general, by increasing the mass of RHA added, a greater the percentage removal of Arsenic from the
challenge water is observed. Due to sampling constraints, a full sampling regime (1, 2, 5, 10, 20 and 30
minutes) was only conducted for 0.5 g of RHA per 100ml of challenge water. When the other results are
examined it can be seen that although increasing the amount of RHA added does generally increase the
amount of Arsenic absorbed, but it should be noted that the relationship between them is not directly
proportional, i.e. doubling the amount of RHA does not double the removal of Arsenic over the same time
period. From the profile of the other results, it can also be assumed that the other samples would follow a
similar trend line if all the samples were analysed.
The trend line of the results for 0.5 gram per 100 ml of challenge water show rapid removal within the
first minute of contact. Then equilibrium conditions between 2 and 10 minutes followed by a fall at 20
minutes (i.e. Arsenic being released back into the water) and an increase in removal to 30 minutes. The
readings for 2 grams per 100 ml do not show the largest value for removal at 10 minutes. This does not
match the general trend stated above, as the expected reading would be nearer 29 % @ 10 minutes than
the measured 19.1 %. As the 20 minute result for 2 grams shows the greatest removal, the 10 minute
result is due to an error during sampling and does not represent the true reading at this time.
The most rapid removal rate occurs during the first 1 minute of contact, is because of the large surface
area of RHA, The Arsenic removed from solution during this first minute, will not be absorbed into the
RHA particle but will be attached to the outside of the RHA particle due to the charging of the particles.
So the 1 minute removal rate can be explained though the equalisation of initial charges that are present
on the metal ions and the RHA. The increase in Arsenic concentration at 20 minutes is present in all
samples taken; this has two possible explanations: the sample was stirred before this sample was taken.
This may have disturbed the Arsenic particles and removed them from the surface of the RHA particle.
Alternatively, the removal of the Arsenic may have changed the chemistry present and caused Arsenic to
be released from the RHA. The decrease in Arsenic concentration at 30 minutes is consistent with the re-
adsorption of the Arsenic.

May 2006 Dissertation
David Laird 33 Civil & Environmental Engineering
Stage 4
The optimum removal concentration can be expressed as highest mg of Arsenic removed against grams of
RHA. This is the same method used when isotherms are calculated, although isotherms will not be used,
it does provide a useful indication into the most efficient amount to add to the challenge water. This will
be done by taking the average of the two mg of Arsenic removed against grams of RHA readings (10 and
20 minutes). These results can be seen in Table 4.
Table 4: RHA Removal Efficiency by Mass
RHA dose per 100 ml of challenge water (grams) Milligrams As removed / grams of RHA
0.25 0.012
0.5 0.007
1.0 0.004
2.0 0.001
It can be seen from Table 4 that the most efficient mass for removal is 0.25 grams. A lesser mass may
prove more to a more efficient use of RHA, but when the largest removal of Arsenic is required then
reducing the dose is not a viable option in a developing country.
Whilst it should be recognised that, in a developing country the measuring of precise quantities of RHA
to be used would be very unlikely and would most likely be estimated. There would also be the
temptation, if RHA was cheaply available, for excess amounts of RHA to be added to the water.
In a longer term study, over 72 hours a noticeable reduction in the removal rate would be expected due to
the initial removal of Arsenic from solution. This would not be due to reduced absorption capacity but
due a reduction in Arsenic available to be absorbed.

May 2006 Dissertation
David Laird 34 Civil & Environmental Engineering
Stage 4
Figure 4: Effect of RHA Concentration on Arsenic Removal Efficiency
Insert full page graph of RHA Concentration

May 2006 Dissertation
David Laird 35 Civil & Environmental Engineering
Stage 4
4.2 Effect of Initial pH
The effect of pH on the removal of Arsenic was investigated because water in Bangladesh can be present
at various pH’s due to reduction processes in water bearing strata. Therefore a range of pH’s from 6 – 9
was investigated. The results can be seen in Figure 5.
As the pH increases, the removal efficiency of Arsenic from the sample tended to increase. The exact
figures for percentage removal at 10 and 20 minutes can be seen in Table 5. The results for pH8 have
been disregarded because both the RHA and control result were lower than any other results and do not
match the pattern that they form. This probably is due to a sampling error in the laboratory. These results
also show the sample increase in Arsenic concentration in the water at 20 minutes, the same sampling
procedure was used as the RHA concentration experiments.
Table 5: Removal Efficiencies with varying pH
Percentage removal at
10 minutes
Percentage removal at
20 minutes
Average percentage
removal
pH6 12.8 7.5 10.2
pH7 15.7 9.7 12.7
pH8 NA NA NA
pH9 16.3 13.7 15
This agrees with (Feng, Lin et al. 2004) who noted that the removal of Lead and Mercury with RHA
increased at higher initial pH’s. These results however, do not concur with (Huang and Fu 1984) work
into the removal of As(V) with activated carbon. They state that the optimum pH’s for As(V) lay between
4 and 5. Their study also concluded that efficiency of removal also increased with an increasing
proportion of carbon was composed of ash. If the same conclusion could be drawn with RHA then there
may be some benefit from increasing the temperature of combustion, thus increasing the ash content of
the RHA. This could form the basis for any further investigation.
Whilst it is important to investigate the effects of pH on the removal efficiency of Arsenic, it must be
remembered this technology is being proposed to be used in a developing country setting. If the water to
be treated is not the same as the optimum pH then there is very little that the household operator of the
unit can do. Whilst this does not devalue this part of the experiment, it is an important point to consider
when using the product in a low technology setting.
In this experiment the metal concentration in the sample water was kept relatively constant. In a study by
(Pattanayak, Mondal et al. 2000) using carbon based absorbents, it was stated that: “the maximum metal
uptakes were found when the initial metal concentration was 157 ppm” (compared to 737 ppm) Also they
stated that: “For an intermediate metal concentration (490 ppm), the metal uptakes remained essentially
invariant throughout the entire pH range employed in this study. With the exception of one data point in

May 2006 Dissertation
David Laird 36 Civil & Environmental Engineering
Stage 4
each case, the metal uptakes remained essentially unchanged when the initial pH of the solution was
varied for the experiments in which the initial metal concentrations were 157 and 737 ppm.”
Whilst these Arsenic concentration values are 1000 times greater than the ones used in this study, the
statement is still valid. The maximum removal efficiency may occur at a much higher or lower Arsenic
concentration, but the impact of this statement can be minimised as the test is designed to evaluate RHA’s
effectiveness in Bangladeshi groundwater conditions. The second statement is more valid and can only be
proven by further testing.

May 2006 Dissertation
David Laird 37 Civil & Environmental Engineering
Stage 4
Figure 5: Effect of Initial pH on Arsenic Removal Efficiency
Insert full page graph of initial pH

May 2006 Dissertation
David Laird 38 Civil & Environmental Engineering
Stage 4
4.3 Ceramic Filter as a Removal Method
The experiment used an existing ceramic filter produced for Dr. M. Simpson during his thesis work in
2004. The ceramic filter had been proven to remove Arsenic when used with a simple carbon source such
as charcoal. In this experiment, 500 ml of challenge water containing 362 µg/l of Arsenic was dosed with
2.5 grams of RHA and left for 24 hours to filter.
The Arsenic in the filtrate was reduced to below the detectable limits of the ICP-OES. The quoted
accuracy of the ICP-OES is down to 50 µg/l. The machine can detect Arsenic to below this levels but the
accuracy of detection are not guaranteed. The quality of detection with the machine used is highly
dependant on the quality of the standards used, with special emphasis being placed on the blank (standard
containing no Arsenic). The laboratories own standards and blank were used in order to maximise the
accuracy of the sampling and remove any error that may occur by making the standards myself. Though
the use of these standards, accurate detection down to 10 µg/l As can be expected.
When the RHA was added, turbidity was measured at 480 NTU using a turbidimeter. The measured
turbidity of the filtrate was 1.7 NTU. This equates to a 99.65 % reduction in turbidity. (Simpson 2004)
states a similar a reduction in turbidity of 99.99 % using ground charcoal as a removal medium. The
observed increase in turbidity in the filtrate is due to the smaller particle size of RHA compared with the
ground charcoal used in the previous study.
(Simpson 2004) stated that the addition of ground charcoal reduced the flow rate by 3 % compared with
the control. The addition of the RHA to the same ceramic filter reduced the flow rate by approximately
1/3rd. this is because if RHA’s particle size distribution. This is because RHA has a greater potential to
reduce the flow through the ceramic filter by blocking pores within the filter. Indeed, this reduction in
performance is further compounded by RHA’s tendency to settle when left undisturbed. When you
consider the shape of the ceramic filter, a circular shape which tapers in towards the bottom, it means that
the majority of the internal surface area within the ceramic filter is composed of the sides. Therefore more
challenge water is likely to pass through the sides than the bottom of the filter because the sides are likely
not be blocked by RHA particles and the there is a greater area available. During the experiments the first
sign of water permeating though the ceramic filter this was observed at the points along the sides of the
filter.
The observed reduction in flow rate is not really acceptable when providing the sole means to remove
Arsenic from drinking water in a developing country. Therefore the further development of a means to
separate RHA from the water is needed. The main problem is the small particle size of the RHA. Whilst
increasing the particle size would seem an easy answer, this would reduce the surface area of the material
and reduce its capacity to absorb Arsenic and this would be more prohibitive than reduced flow itself.
Alternative solutions can be seen in the Recommendations section.

May 2006 Dissertation
David Laird 39 Civil & Environmental Engineering
Stage 4
Sludge disposal issues exist with all forms of adsorption based removal. Depending on how long the unit
has been operating, the dose of absorbent and the level of heavy metal concentration, the absorbent
maybe may tens of times more contaminated than the water it filtered during its lifetime. This spent
absorbent must be disposed of carefully in order not to contaminate any sensitive areas, such as areas
used to cultivate food and graze cattle.
Although RHA is a waste product, the question remains of viability of the product. The product can only
be truly sustainable if money is made from the production and distribution of the RHA. It must be
recognised that the strict quality control and exact particle size are not the key to making this product
successful, a proven pilot project and local stakeholder involvement. Health issues associated with
breathing in the RHA dust can not be discounted in its evaluation. Although the health benefits generated
from removing large concentration of Arsenic from drinking water will far outweigh the health risks from
handling the dust.

May 2006 Dissertation
David Laird 40 Civil & Environmental Engineering
Stage 4
5. Conclusions In this section conclusions are drawn against the objectives set in Section 1.2. The experiments outlined
in the Methodology section have been broadly successful in meeting the aims of the project. In hindsight
the scope could have been extended and alternative methods to integrate RHA into a filter system could
have been investigated in detail.
• Conduct a literature review in to all relevant material. This will include research into all current uses
for RHA and the Arsenic situation in Bangladesh.
o Research was conducted into RHA and it was established that it has previously been used to
remove Lead and Mercury from water samples, from this study it seemed likely that it could
be applied to other heavy metals.
o Currently, the main use for RHA is as a concrete admixture.
o RHA is found to be a suitable adsorbent for the adsorption of Arsenic from aqueous water.
o The situation in Bangladesh is very grave and the seriousness can not be underestimated and
there is need for an ‘appropriate technology’ solution to the problem.
• Prepare a detailed methodology for an experimental procedure and analysis that will allow the aims
of the project to be fulfilled.
o A procedure was developed to quantify the most effective conditions at which RHA could
absorb Arsenic. Though conducting the literature review it was concluded that the main
parameters that should be varied were RHA dose, pH and contact time.
o An initial Arsenic concentration of 200 – 300 µg/l was set because this is the most common
range of values that have been reported in Bangladesh.
• Determine the most effective pH at which to run the RHA concentration experiments.
o RHA appears to work most efficiently when the initial pH of the challenge water is as high
as possible. The samples were only tested to pH9 because this the highest pH value that is
commonly found in Bangladeshi groundwater.
o If the pH could be artificially increased prior to treatment, with a home-grown product and
then returned to the original pH, then increasing the pH for treatment would be deemed
beneficial.

May 2006 Dissertation
David Laird 41 Civil & Environmental Engineering
Stage 4
• Determine the optimum RHA concentration.
o In terms of using the mass of RHA most effectively then the lowest tested value (0.25 grams
per 100 ml of challenge water) proved most effective. In reality however, it was recognised
that the total percentage removal is more important when removing highly toxic metal than
optimising the amount of RHA to be used. This study failed to determine the time when the
RHA could be considered saturated with absorbed Arsenic.
• Design and build a point of use filter system suitable for use in Bangladesh.
o When RHA is combined with existing ceramic filter technology almost complete Arsenic
removal was observed in the sample water.
o During this test the flow rate was reduced by approximately 1/3rd due to the small particle
size of the RHA. This could be overcome by increasing the internal surface area of the filter
or a redesign of possible ways to use RHA with ceramic filter.
o This study recommends the use of primary settlement to minimise the quantity of RHA in
the water prior to treatment in a ceramic filter.

May 2006 Dissertation
David Laird 42 Civil & Environmental Engineering
Stage 4
6. Recommendations In order to resolve the problem of reduced flow through the filter, I have considered alternative processes
to the direct filtration stated above. Ceramic filtration does have its advantages, including an excellent
removal rate from bacteria and this advantage should be retained in any alternative solution developed.
The solution to the clogging would seem to lie in a method that could remove the majority of the RHA
before it was introduced into the ceramic filter.
In order to achieve this it is proposed to use a two stage process which can naturally settle or coagulate
the majority of RHA in the first stage then transfer the water to the conventional ceramic filter for further
treatment. The main advantage of the method is it will prolong the life of the filter unit, normally the
filters can only be rejuvenated by being heated to just below their firing temperature. This is not easily
achievable in a developing country (unless the local producer offers this service).
Options for this will now be outlined. In the first tank, the RHA could be reacted and stirred and then
could be allowed to settle to the bottom of a 20 litre container and a tap located an appropriate height to
avoid disturbing the settled RHA could transfer the supernatant to ceramic filtration unit. This method has
the advantages of extended ceramic filter life and less need to expose the underside of the filter to
pathogens during any cleaning operation. Disadvantages with this method are the materials involved in
constructing the unit are greater than a conventional ceramic filter unit containing a charcoal based carbon
source.
Alternatively, RHA could be incorporated into a treatment tablet similar to those investigated by (Ngai,
Poole et al. 2004) for MIT. It would form an ideal replacement for the charcoal contained in the tablets.
Also (Ngai, Poole et al. 2004) again for MIT designed a three bucket (Gagri) system. The middle bucket
contains charcoal and fine sand; this is where the addition of RHA could prove beneficial.
May 2006 Dissertation
David Laird 43 Civil & Environmental Engineering
Stage 4
7. References Arayapranee, W., N. Na-Ranong, et al. (2005). "Application of rice husk ash as fillers in the natural
rubber industry." Journal of Applied Polymer Science 98(1): 34-41.
Bagla, P. and J. Kaiser (1996). "Epidemiology - India's spreading health crisis draws global arsenic
experts." Science 274(5285): 174-175.
Baksi, S., S. Biswas, et al. (2003). Activated Carbon from Bamboo - Technology Development towards
Commercialisation.
BGS (2003). Source and behaviour of arsenic in natural waters.
http://www.who.int/water_sanitation_health/dwq/arsenicun1.pdf.
Bianchelli, T. (2003). Arsenic removal from drinking water. New York, Nova Science Publishers.
British Standards (2002). "BS EN 12457-3: 2002. Characterisation of waste - Leaching - Compliance test
for leaching of granular waste materials and sludges." British Standard.
Chopra, S. K., S. C. Ahluwalia, et al. (1981). Technology and manufacture of rice-husk ash masonry
(RHAM) cement. Proceedings of ESCAP/RCTT Workshop on Rice-Husk Ash Cement, New Delhi.
Das, D., G. Samanta, et al. (1996). "Arsenic in groundwater in six districts of West Bengal, India."
Environmental Geochemistry and Health 18(1): 5-15.
European Parliament (1999). "EU Landfill Directive." Offical Journal of The European Communities.
Faust, S. D. and O. M. Aly (1987). Adsorption Processes for Water Treatment. Boston, Massachusetts,
Butterworth Publishers.
Feng, Q. G., Q. Y. Lin, et al. (2004). "Adsorption of lead and mercury by rice husk ash." Journal of
Colloid and Interface Science 278(1): 1-8.
Ferguson, J. F. and J. Gavis (1972). "Review of Arsenic Cycle in Natural Waters." Water Research 6(11):
1259-1267.
Frank, P. and D. Clifford (1990). "Project Summary: Arsenic (III) Oxidation and Removal from Drinking
Water." EPA/600/S-2-86/021.
Huang, C. P. and P. L. K. Fu (1984). "Treatment of Arsenic Containing Water by the Activated Carbon
Process." Journal Water Pollution Control Federation 56(3): 233-242.

May 2006 Dissertation
David Laird 44 Civil & Environmental Engineering
Stage 4
Jiang, J. Q. (2001). "Removing arsenic from groundwater for the developing world - a review." Water
Science and Technology 44(6): 89-98.
Katsumata, H., S. Kaneco, et al. (2003). "Removal of heavy metals in rinsing wastewater from plating
factory by adsorption with economical viable materials." Journal of Environmental Management 69(2):
187-191.
Kundu, S., S. S. Kavalakatt, et al. (2004). "Removal of arsenic using hardened paste of Portland cement:
batch adsorption and column study." Water Research 38(17): 3780-3790.
Lenoble, V., C. Chabroullet, et al. (2004). "Dynamic arsenic removal on a MnO2-loaded resin." Journal
of Colloid and Interface Science 280(1): 62-67.
McArthur, J. M., Ravenscroft P., Safiullah S. and Thirlwall M.F. (2000). Arsenic in groundwater: testing
pollution mechanisms for sedimentary aquifers in Bangladesh., Water Resources Research,
http://bicn.com/acic/.
Mehta, P. K. (1979). The chemistry and technology of cements made from rice-husk ash.
UNIDO/ESCAP/RCTT Workshop on Rice-Husk Ash Cement, Peshawar, Pakistan, Regional Centre for
Technology Transfer, Banghalore, India.
Meng, Z. G., G. P. Korfiatis, et al. (2001). "Treatment of arsenic in Bangladesh well water using a
household co-precipitation and filtration system." Water Research 35(12): 2805-2810.
Nehdi, M., J. Duquette, et al. (2003). "Performance of rice husk ash produced using a new technology as
a mineral admixture in concrete." Cement and Concrete Research 33(8): 1203-1210.
Ngai, T., B. Poole, et al. (2004). Arsenic Removal, MIT.
Pattanayak, J., K. Mondal, et al. (2000). "A parametric evaluation of the removal of As(V) and As(III) by
carbon-based adsorbents." Carbon 38(4): 589-596.
Perrich, J. R. (1981). "Activated Carbon Adsorption for Wastewater Treatment." 45.
Rasmussen, L. and K. J. Andersen (2001). "ENVIRONMENTAL HEALTH AND HUMAN
EXPOSURE ASSESSMENT." WHO Document.
Ravenscroft, P., J. M. McArthur, et al. (2001). In Chappell, W. R., Abernathy, C. O. and Calderon, R. L.,
eds.,

May 2006 Dissertation
David Laird 45 Civil & Environmental Engineering
Stage 4
Arsenic exposure and health effects IV. Oxford, Elsevier.
Ryker, S. (2001). 75th Percentile of Arsenic Concentration, U.S. Geological Survey,
http://water.usgs.gov/nawqa/trace/pubs/geo_v46n11/fig2.html.
Ryker, S. J. (2001). "Mapping Arsenic in Groundwater." Geotimes 46(no.11): p.34-36.
Simpson, M. (2004). An Investigation into the Production and Performance of Low-Technology Ceramic
Filters for Point-of-Use Drinking Water Treatment. School of Civil Engineering and Geosciences,
University of Newcastle.
Singhania, N. P. (2005). Rice Husk Ash, http://www.ricehuskash.com/details.htm.
Smedley, P. L. and D. G. Kinniburgh (2002). "A review of the source, behaviour and distribution of
arsenic in natural waters." Applied Geochemistry 17(5): pp. 517-568.
Smith, A. H. and M. M. H. Smith (2004). "Arsenic drinking water regulations in developing countries
with extensive exposure." Toxicology 1980(1-3): pp. 39-44.
TraceDetect, I. (2005). Measuring Arsenic In Groundwater. Water / Wastewater. I. TraceDetect. Seattle,
TraceDetect, Inc.
Wagner, N. J., and R.J. Jula (1981). "Activated Carbon Adsorption for Wastewater Treatment." Activated
Carbon Adsorption: pp. 41-60.
Walker, M. and C. Montecinos (2001). Arsenic In Drinking Water: Issues Associated With Revsing The
Standard. Nevada Cooperative Extension, University of Nevada.
Wang, L., T. Sorg, et al. (2000). Arsenic Removal by Full Scale Ion Exchange and
Activated Alumina Treatment Systems. AWWA Inorganic Contaminants
Workshop, Albuquerque, New Mexico.
Yeoh, A. K., Bidin R., Chong C.N., Tay C.Y. (1979). The relationship between temperature and duration
of burning of rice-husk in the development of amorphous rice-husk ash silica. UNIDO/ESCAP/RCTT,
Follow-up Meeting on Rice-Husk Ash Cement, Alor Setar, Malaysia.

May 2006 Dissertation
David Laird 46 Civil & Environmental Engineering
Stage 4
Appendix I

May 2006 Dissertation
David Laird 47 Civil & Environmental Engineering
Stage 4

May 2006 Dissertation
David Laird 48 Civil & Environmental Engineering
Stage 4

May 2006 Dissertation
David Laird 49 Civil & Environmental Engineering
Stage 4

May 2006 Dissertation
David Laird 50 Civil & Environmental Engineering
Stage 4

May 2006 Dissertation
David Laird 51 Civil & Environmental Engineering
Stage 4

May 2006 Dissertation
David Laird 52 Civil & Environmental Engineering
Stage 4

May 2006 Dissertation
David Laird 53 Civil & Environmental Engineering
Stage 4

May 2006 Dissertation
David Laird 54 Civil & Environmental Engineering
Stage 4

May 2006 Dissertation
David Laird 55 Civil & Environmental Engineering
Stage 4
Appendix II

May 2006 Dissertation
David Laird 56 Civil & Environmental Engineering
Stage 4

May 2006 Dissertation
David Laird 57 Civil & Environmental Engineering
Stage 4
Appendix III

May 2006 Dissertation
David Laird 58 Civil & Environmental Engineering
Stage 4

May 2006 Dissertation
David Laird 59 Civil & Environmental Engineering
Stage 4
Appendix IV