30th annual cash management services surveyfile/30th_annual_cash_management_services_survey.pdf2...
TRANSCRIPT

30th Annual Cash Management Services Survey2013 executive summary

130th Annual Cash Management Services Survey: 2013 executive summary
Table of contents
30th Annual Cash Management Services Survey

2
This year marked the 30th anniversary of the EY Cash Management Services (CMS) Survey. We distributed the questionnaire in late January to the previous survey participants and other top 100 bank holding companies that actively market treasury services to wholesale customers in the United States. Survey participation is generally limited to commercial banks, but we invite thrifts to respond when we become aware that they provide treasury services. We also ask a small number of non-bank lockbox providers to participate in the survey to help us understand how outsourcing impacts bank lockbox volume.
The 2013 CMS Survey collected data from 49 financial institutions, up from 45 in 2012. Participants included 43 of the 2012 respondents, plus 6 additional banks. Bank of Hawaii, Cadence Bank, First Niagara Financial Group and Susquehanna Bancshares, Inc., were first-time respondents in 2013, while First Banks Inc. and Wintrust Financial returned to the survey after multiyear absences. The 2013 participants included 19 of the top 20 financial institutions (measured by assets) invited to respond and 40 of the top 50. The 2013 participant list contains virtually all of the nationally recognized cash management providers.
The targeted financial institutions were segmented into three peer groups based on their US assets. The 19 largest responding institutions were assigned to the first peer group (Peer 1). The next 21 banks, in asset order, were placed in the second group (Peer 2). The final nine banks, with assets less than US$14.6 billion, were assigned to the third group (Peer 3).
Introduction
2013 bank peer group profile
Peer 1
Assets: More than US$85 billion
Respondents: 19
Peer 2
Assets: US$14.6 billion to US$85 billion
Respondents: 21
Peer 3
Assets: Less than US$14.6 billion
Respondents: 9
30th Annual Cash Management Services Survey: 2013 executive summary

3
2013 participant list by peer group
Peer group 1
More than US$85.0 billion in assetsBank of America CorporationBank of New York Mellon CorporationBB&T CorporationBMO Harris Bank, N.A.Capital One, N.A.Citibank, N.A.Fifth Third BancorpHSBC Bank USAJPMorgan Chase & Co.KeyCorpPNC Financial Services Group, Inc.RBS Citizens Financial Group Regions Financial CorporationSovereign BancorpSunTrust Banks, Inc.TD Bank, N.A.Union BankU.S. BancorpWells Fargo and Company
Peer group 2
US$14.6 billion to US$85.0 billion in assetsAssociated BankBank of the WestBBVA CompassBOK Financial CorporationCity National Corporation Comerica IncorporatedCommerce Bancshares, Inc.Cullen/Frost Bankers, Inc.Deutsche BankFirst Citizens BanksharesFirst Horizon National CorporationFirst National Bank of OmahaFirst Niagara Financial GroupHancock Holding CompanyHuntington BancsharesM&T Bank CorporationSusquehanna Bancshares, Inc.Synovus Financial CorporationWebster Financial ServicesWintrust FinancialZions Bancorporation
Peer group 3
Less than US$14.6 billion in assetsBank of HawaiiCadence BankEastern BankFirst Banks, Inc.First Midwest BankIberiabank CorporationMB Financial, Inc.Northwest Bancshares, Inc.PrivateBancorp, Inc.
Non-banks
Fiserv, Inc.TransCentra, Inc.Xerox
330th Annual Cash Management Services Survey: 2013 executive summary

430th Annual Cash Management Services Survey: 2013 executive summary
Faster growthCash management fee-equivalent revenue grew by 3.0% in 2012. This was double the 1.5% increase recorded for 2011 and close to the 3.5% growth predicted by the respondents in the 2012 survey. All but one product line measured by the survey reported higher growth in 2012 relative to 2011. The sole exception was automated clearing house (ACH) which did, however, repeat its previous year’s 4% growth. Purchasing cards and wire transfer continued to play the leading roles in revenue generation, contributing the vast majority of the increase measured. Wire transfer revenue growth was pervasive, with all three peer groups citing impressive gains. Similarly, purchasing card revenue growth was not limited to the top 20 banks: many Peer 2 banks offering purchasing cards reported double-digit percentage increases in 2012.
0%
2%
4%
6%
8%
3.0% 3.0%
0.5%
3.0%
2005 2006 20072004 20092008 2010 2011 2012 2013 estimate
6.0%5.5%
4.0%
1.5%
0.5%0%
Product highlightsIn total, eight products reported some revenue growth in 2012, up from six in 2011. In addition to purchasing cards, ACH and wire transfer, three other products reported growth in both 2011 and 2012 − electronic data interchange (EDI), information reporting and account reconciliation. Meanwhile, after minor revenue losses in 2011, wholesale and retail lockbox both managed small gains in 2012. There was even some positive news among the products still in decline. Although the demand deposit accounts (DDA) category, check clearing and controlled disbursement all reported continuing revenue erosion in 2012, their rates of decline were at least a little lower than in 2011. As we noted in last year’s report, higher revenue growth rates are easier to attain when paper-based losses have a diminished impact on the aggregate total.
Summary of key findings
Fee-equivalent cash management revenue growth

530th Annual Cash Management Services Survey: 2013 executive summary
Growth from small businessPrior to 2009, the small business customer segment routinely accounted for 20% or more of measured cash management revenue. By 2011, however, small business revenue had fallen to a low of 17%. Now, perhaps as a sign of the gradual economic recovery, small business revenue has once again returned to a more typical level, generating 20% of 2012 revenue. We believe that the revenue boost from small businesses contributed to the stronger growth seen among the local and regional banks in Peers 2 and 3. Banks outside the top 20 grew 4% in 2012.
Economic worries impact 2013 forecast After revenue climbed 3% in 2012, the respondents’ forecast for another 3% increase in 2013 seemed to lack ambition. However, if we revisit the dominant economic events in early 2013, when these predictions were made, the reason for a cautious forecast becomes clear. We believe that fears about the impact of higher payroll taxes and sequestration gave the participants pause. This combination seemed bound to reduce economic growth and, as a result, cause some collateral damage to the payments business. But happily, the economy appears to have had sufficient momentum to overcome these obstacles, and we have avoided falling back into recession. Given current economic conditions, we believe the forecast for 3% growth in 2013 is likely to be exceeded.
Trade services revenue declinesThe 2013 trade services survey received data from 22 banks, including responses from 13 members of Peer 1 and 9 banks in Peer 2. Twenty banks provided comparable revenue numbers for 2011 and 2012, allowing us to calculate a revenue growth rate. Measured trade services revenue declined by 2.5% in 2012. The decline was broadly based, with nearly three-quarters reporting a drop in revenue relative to 2011. The total fee-equivalent trade services revenue measured for 2012 was US$3.36 billion. For more details, read the trade services chapter.
Given current economic conditions, we believe the forecast for 3% growth in 2013 is likely to be exceeded.
Summary of key findings

630th Annual Cash Management Services Survey: 2013 executive summary
Revenue growth rate doublesThe cash management revenue growth rate advanced in 2012, rising to 3%. While 3% growth was slightly below the previous year’s respondent forecast for a 3.5% increase, it represented a marked improvement over the 1.5% growth measured for 2011. Cash management revenue growth is highly dependent upon growth in the overall economy since additional economic activity spawns more transactions and payments. Consistent with the gradual economic recovery in the United States, the cash management business is displaying more vitality.
Cautious forecast for 2013The survey participants predicted another year of 3% revenue growth for 2013. Given the upward trajectory of the cash management business and the respondents’ recent history of ambitious forecasts, we were a little surprised by how low the bar was set for 2013. Perhaps this prediction is best viewed in the context of the time when it was produced. Although the US economy had recorded many successive quarters of growth, early in 2012 two new roadblocks threatened continued improvement, and by some estimates, would derail the economy into another recession. The expiration of reduced social security taxes lowered most consumers’ buying power by 2% while sequestration was set to significantly pare government expenditures. This combination was certain to reduce economic growth and thus have some impact on the payments business. Fortunately, the economy appears to have had enough steam to overcome these impediments, and talk of another imminent recession has largely evaporated.
Given current economic conditions, we believe the forecast for 3% growth in 2013 will be exceeded. When forecasting cash management revenue growth, we rely on a model that predicts likely outcomes based on recent performance, the general economic climate and the current phase of each product’s life cycle. While we continue to anticipate revenue erosion in many paper-based products, the potential for stronger overall growth is evident if the economy continues to improve, as many economists expect. Achieving 3.5% growth in 2013, or even a 4.0% increase, seems plausible. If wire transfer and purchasing cards repeated their strong 2012 performance in 2013 and losses from paper disbursements continued to taper off, the overall growth rate could easily top the 3% forecast.
Little variation in growth ratesThe CMS Survey endeavors to measure revenue growth on a “same-bank” basis (i.e., discounting revenue gains associated with acquiring other banks) by collecting equivalent revenue for the last two completed calendar years. The top five cash
Cash management revenue
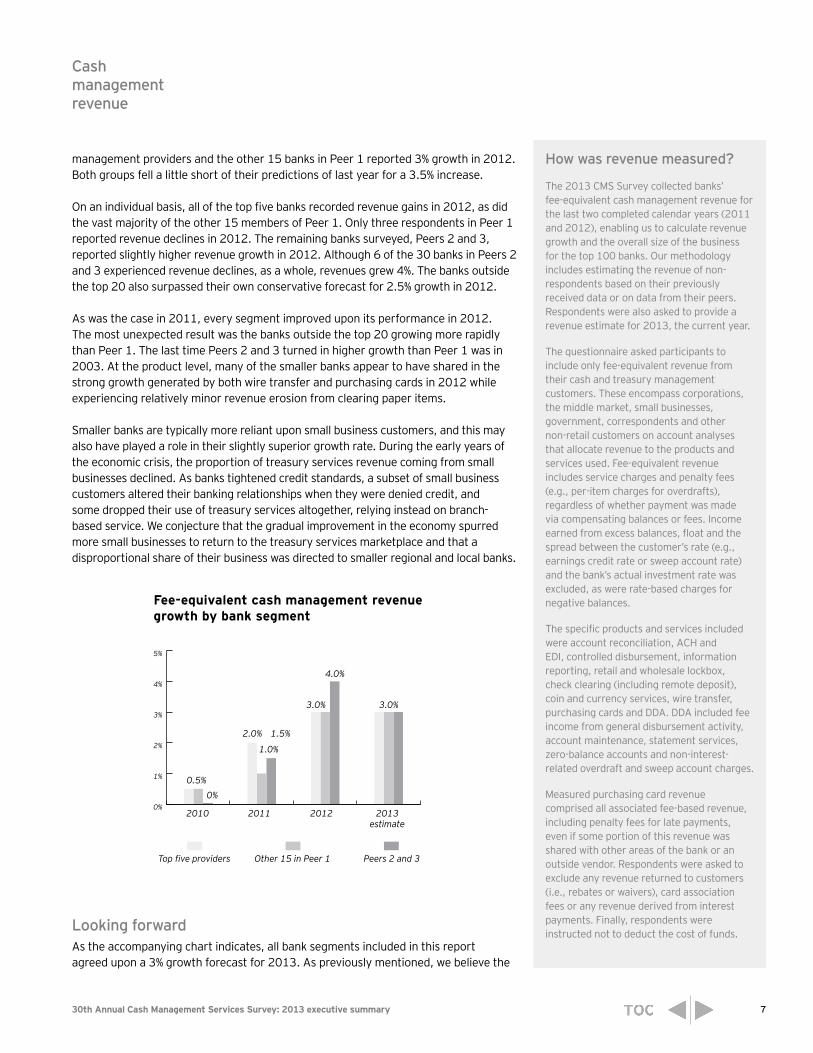
On an individual basis, all of the top five banks recorded revenue gains in 2012, as did the vast majority of the other 15 members of Peer 1.
730th Annual Cash Management Services Survey: 2013 executive summary
management providers and the other 15 banks in Peer 1 reported 3% growth in 2012. Both groups fell a little short of their predictions of last year for a 3.5% increase.
On an individual basis, all of the top five banks recorded revenue gains in 2012, as did the vast majority of the other 15 members of Peer 1. Only three respondents in Peer 1 reported revenue declines in 2012. The remaining banks surveyed, Peers 2 and 3, reported slightly higher revenue growth in 2012. Although 6 of the 30 banks in Peers 2 and 3 experienced revenue declines, as a whole, revenues grew 4%. The banks outside the top 20 also surpassed their own conservative forecast for 2.5% growth in 2012.
As was the case in 2011, every segment improved upon its performance in 2012. The most unexpected result was the banks outside the top 20 growing more rapidly than Peer 1. The last time Peers 2 and 3 turned in higher growth than Peer 1 was in 2003. At the product level, many of the smaller banks appear to have shared in the strong growth generated by both wire transfer and purchasing cards in 2012 while experiencing relatively minor revenue erosion from clearing paper items.
Smaller banks are typically more reliant upon small business customers, and this may also have played a role in their slightly superior growth rate. During the early years of the economic crisis, the proportion of treasury services revenue coming from small businesses declined. As banks tightened credit standards, a subset of small business customers altered their banking relationships when they were denied credit, and some dropped their use of treasury services altogether, relying instead on branch-based service. We conjecture that the gradual improvement in the economy spurred more small businesses to return to the treasury services marketplace and that a disproportional share of their business was directed to smaller regional and local banks.
0%
1%
2%
3%
4%
5%
0.5%
1.0%
1.5%
3.0% 3.0%
4.0%
2.0%
0%
2010 2011 2012 2013estimate
Top five providers Other 15 in Peer 1 Peers 2 and 3
Fee-equivalent cash management revenue growth by bank segment
Looking forwardAs the accompanying chart indicates, all bank segments included in this report agreed upon a 3% growth forecast for 2013. As previously mentioned, we believe the
How was revenue measured?
The 2013 CMS Survey collected banks’ fee-equivalent cash management revenue for the last two completed calendar years (2011 and 2012), enabling us to calculate revenue growth and the overall size of the business for the top 100 banks. Our methodology includes estimating the revenue of non-respondents based on their previously received data or on data from their peers. Respondents were also asked to provide a revenue estimate for 2013, the current year.
The questionnaire asked participants to include only fee-equivalent revenue from their cash and treasury management customers. These encompass corporations, the middle market, small businesses, government, correspondents and other non-retail customers on account analyses that allocate revenue to the products and services used. Fee-equivalent revenue includes service charges and penalty fees (e.g., per-item charges for overdrafts), regardless of whether payment was made via compensating balances or fees. Income earned from excess balances, float and the spread between the customer’s rate (e.g., earnings credit rate or sweep account rate) and the bank’s actual investment rate was excluded, as were rate-based charges for negative balances.
The specific products and services included were account reconciliation, ACH and EDI, controlled disbursement, information reporting, retail and wholesale lockbox, check clearing (including remote deposit), coin and currency services, wire transfer, purchasing cards and DDA. DDA included fee income from general disbursement activity, account maintenance, statement services, zero-balance accounts and non-interest-related overdraft and sweep account charges.
Measured purchasing card revenue comprised all associated fee-based revenue, including penalty fees for late payments, even if some portion of this revenue was shared with other areas of the bank or an outside vendor. Respondents were asked to exclude any revenue returned to customers (i.e., rebates or waivers), card association fees or any revenue derived from interest payments. Finally, respondents were instructed not to deduct the cost of funds.
Cash management revenue

830th Annual Cash Management Services Survey: 2013 executive summary
economic uncertainty in early 2013 was responsible for the bank respondents’ tepid forecast. Now, in light of the sustained recovery and the improving revenue mix in the cash management business, we expect to see a somewhat higher growth rate realized in 2013.
2012 fee-equivalent revenue of US$16.75 billionThe 2013 CMS Survey asked respondent banks to record their fee-equivalent cash management revenue from the last two completed calendar years, 2011 and 2012, along with an estimate for 2013. This allowed respondents to adjust their previously reported totals for 2011 to reflect recent mergers, acquisitions or changes in methodology. Fee-equivalent revenue for the top 100 banks was measured at US$16.25 billion in 2011, and with the 3% increase in 2012, revenue reached US$16.75 billion. If the respondent forecast for 3% growth in 2013 is realized, total fee-equivalent revenue will be about US$17.25 billion.
Share of revenue by bank segmentThe top five cash management banks accounted for 62% of the revenue measured in 2012, unchanged from 2011. The share of the other 15 banks in Peer 1 decreased slightly from 26% to 25%, while the share for Peers 2 and 3 grew from 12% in 2011 to 13% in 2012. Changes in market share among the survey’s bank segments are influenced by several factors, including distinct revenue growth rates, changes in group membership (due to changes in asset rank and mergers and acquisitions) and restatements of revenue numbers.
More revenue from small businessThe CMS Survey asked respondents to indicate what portion of their cash management revenue came from each of the five pre-listed customer groups. In the accompanying table, the total was created by weighting each group’s revenue distribution by its percentage of total revenue.
Large Middle Small Financial Government corporate market business institution andnonprofit
Top 5 30% 24% 15% 15% 16%
Next 15 21% 37% 22% 10% 10%
Peers 2 & 3 13% 35% 42% 3% 7%
Total 26% 29% 20% 12% 13%
In total, the respondents reported that 26% of their 2012 revenue came from large corporations, defined as firms having more than US$250 million in annual sales. The middle market (firms with US$50 million to US$250 million in sales) continued to be the biggest segment, contributing 29%, while small business (firms with less than US$50 million in sales) accounted for 20%. Financial institutions (other banks, thrifts and credit unions) and the government and nonprofit sector were the smallest segments, responsible for 12% and 13%, respectively, of 2012 revenue.
Cash management revenue
Top5 providers
62.0%
Peers2 and 313.0%
Other 15 providers
in Peer 125.0%
Share of 2012 fee-equivalent revenue
Share of 2012 fee-equivalent revenue by customer segment

930th Annual Cash Management Services Survey: 2013 executive summary
Compared with the results for 2011, there were two noteworthy changes. The share of revenue from the small business segment increased from 17% to 20% while revenue from financial institutions dropped from 14% to 12%. The rise in small business revenue was seen in all segments but was most pronounced in Peers 2 and 3, where the contribution of those clients jumped from a 35% to a 42% share. The percentage of revenue coming from other financial institutions was unchanged at 15% for the top five providers, but the next 15 banks reported the share of their income coming from correspondents as falling from 15% to 10%. Peers 2 and 3 stated that only 3% of their revenue came from financial institutions in 2012, unchanged from 2011. Some respondents provide approximate numbers, so while we believe the results reflect actual shifts in sources of revenue, the magnitude of these changes may be understated or overstated in any given year.
Balance-based fees replace FDIC chargesFollowing the lead of the FDIC, banks have stopped assessing an explicit FDIC charge and have transitioned to a balance-based fee, sometimes referred to as a deposit administration or deposit assessment fee. Forty of the 49 banks surveyed answered the question on how many basis points they were assessing wholesale depositors for this fee. The larger banks typically charged higher balance assessment fees. Peer 1 reported a median assessment of 13.4 basis points while the Peer 2 median fee was 12.0 basis points. The smaller banks in Peer 3 reported a median charge of 10.0 basis points.
Lowest rate Median rate Highest rate
Peer 1 8.9 bps 13.4 bps 20.0 bps
Peer 2 5.4 bps 12.0 bps 16.9 bps
Peer 3 7.7 bps 10.0 bps 16.0 bps
Revenue growth by product lineEight of the 12 product areas measured by the survey reported revenue growth in 2012, improving upon the 2011 results, when only six products generated revenue gains. Purchasing cards (P Card) continued to be the growth leader with a 14% increase, followed by wire transfer (Wire) with 6.5% growth. ACH and EDI revenue grew at an equal rate, each rising 4%, while information reporting (Info.) increased by 3.5%. The three remaining products in positive territory were wholesale lockbox (WLBX) and account reconciliation (ARP), each with 1% growth, and retail lockbox (RLBX) up 0.5%.
Cash management revenue
Deposit fees assessed to wholesale balances (in basis points)

1030th Annual Cash Management Services Survey: 2013 executive summary
-8%
-4%
0%
4%
8%
12%
16%14.0%
P Card
1.0%
3.5%4.0%
6.5%
Wire Info.
1.0%
C&C
0.5%
DDA
0%
ARP
-2.0%
ACH/EDI WLBX
-4.0%
RLBX
-5.5%
CheckCDA
Coin and currency (C&C) revenue was unchanged relative to 2011, while DDA revenue fell by 2%. Revenue losses were also recorded in controlled disbursement (CDA), down 4.0%, and check clearing (Check), down 5.5%. While these last three product areas have suffered from multiple years of declining revenue, the good news was that their rates of decline have lessened.
Share of 2012 revenue by product The accompanying pie chart illustrates the fee-equivalent revenue contributions of the product lines included in the CMS Survey. The three largest slices were DDA with 19.5%, wire transfer, contributing 18.0%, and purchasing card with 16.5% of measured revenue. Information reporting and wholesale lockbox each generated 9.5% of revenue and ACH and EDI combined to add 8.0%. Coin and currency produced 6.5% and check clearing provided 5.5% of revenue in 2012. The three smallest contributors were account reconciliation with 3.5%, retail lockbox with 2.0% and finally, controlled disbursement with 1.5%.
As was the case in 2011, purchasing cards and wire transfer increased their share of measured fee-equivalent revenue. Purchasing card revenue expanded from a 15.0% share in 2011 to 16.5% in 2012. Wire transfer increased its share from 17.5% to 18.0%. DDA and check clearing both experienced revenue erosion and lost share. DDA’s share of revenue declined from 21% to 19.5% while check clearing fell from 6.5% in 2011 to 5.5% in 2012.
The CMS Survey collects domestic cash management revenue, with the exception of the cross-border components of wire transfer, ACH, EDI and remote capture. Wire transfer revenue includes all revenue associated with same-day US dollar transfers between US and foreign locations and within the US (excluding revenue from transfers between two non-US locations). Small portions of ACH, EDI and remote deposit revenues were from cross-border transactions.
Cash management revenue
Revenue growth rates for cash management products during 2012
DDA
C&C6.5%
WireInfo.
ACH/EDI
P Card
Check5.5%
WLBX9.5%
RLBX2.0%
ARP3.5%
CDA1.5%
19.5%
18.0%9.5%
8.0%
16.5%
2012 cash management revenue by product
1130th Annual Cash Management Services Survey: 2013 executive summary
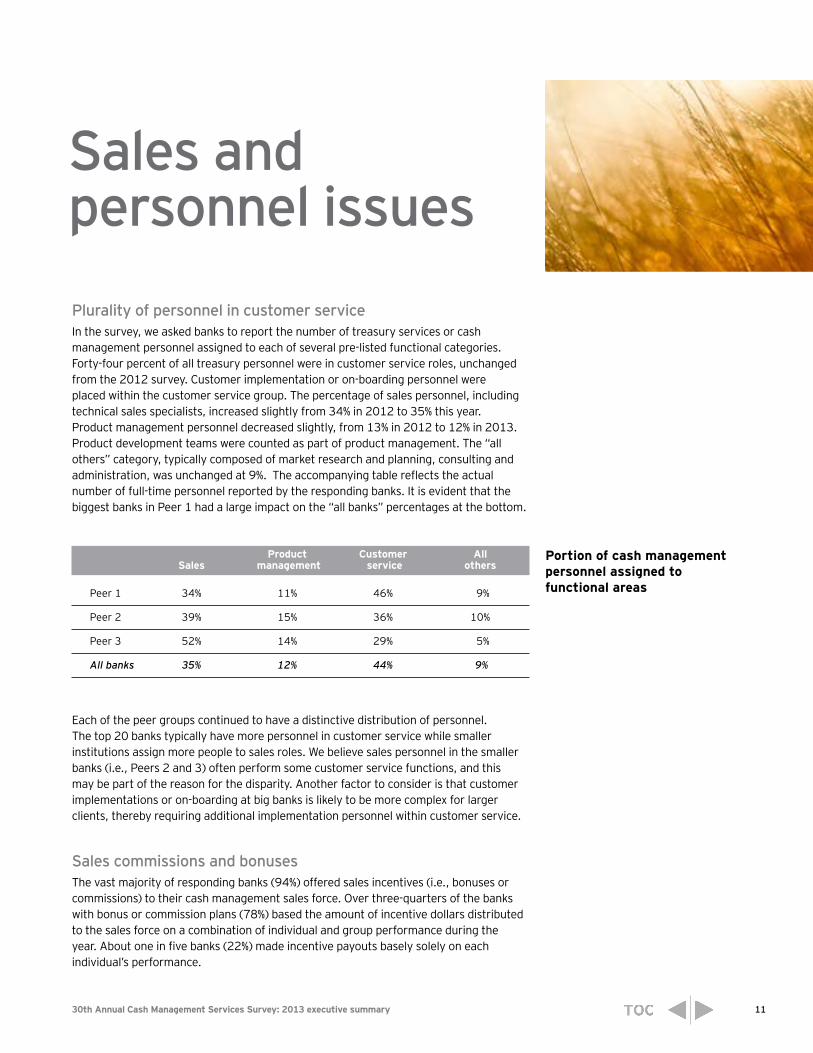
Plurality of personnel in customer service In the survey, we asked banks to report the number of treasury services or cash management personnel assigned to each of several pre-listed functional categories. Forty-four percent of all treasury personnel were in customer service roles, unchanged from the 2012 survey. Customer implementation or on-boarding personnel were placed within the customer service group. The percentage of sales personnel, including technical sales specialists, increased slightly from 34% in 2012 to 35% this year. Product management personnel decreased slightly, from 13% in 2012 to 12% in 2013. Product development teams were counted as part of product management. The “all others” category, typically composed of market research and planning, consulting and administration, was unchanged at 9%. The accompanying table reflects the actual number of full-time personnel reported by the responding banks. It is evident that the biggest banks in Peer 1 had a large impact on the “all banks” percentages at the bottom.
Product Customer All Sales management service others
Peer 1 34% 11% 46% 9%
Peer 2 39% 15% 36% 10%
Peer 3 52% 14% 29% 5%
All banks 35% 12% 44% 9%
Each of the peer groups continued to have a distinctive distribution of personnel. The top 20 banks typically have more personnel in customer service while smaller institutions assign more people to sales roles. We believe sales personnel in the smaller banks (i.e., Peers 2 and 3) often perform some customer service functions, and this may be part of the reason for the disparity. Another factor to consider is that customer implementations or on-boarding at big banks is likely to be more complex for larger clients, thereby requiring additional implementation personnel within customer service.
Sales commissions and bonusesThe vast majority of responding banks (94%) offered sales incentives (i.e., bonuses or commissions) to their cash management sales force. Over three-quarters of the banks with bonus or commission plans (78%) based the amount of incentive dollars distributed to the sales force on a combination of individual and group performance during the year. About one in five banks (22%) made incentive payouts basely solely on each individual’s performance.
Sales and personnel issues
Portion of cash management personnel assigned to functional areas

1230th Annual Cash Management Services Survey: 2013 executive summary
On average, salary contributed 80% of total compensation and incentive pay accounted for the remaining 20%, down slightly from 21% in the 2012 survey. Among respondents with incentive plans, bonus plans were three times more prevalent than commission plans.
Measuring the impact of customer defectionWe asked the bank respondents if they regularly measured the impact of customer defection, and approximately what percentage of cash management revenue was lost because of customer defection in the previous year. Fifteen banks — nine in Peer 1, four in Peer 2 and two in Peer 3 — said they regularly collected data to calculate customer-defection rates. This was up from 14 banks in the 2012 survey. The average annual revenue loss due to customer defection was 3.5% in Peer 1, 3.7% in Peer 2 and 5% in Peer 3. We note that although the number of banks collecting and providing defection numbers was low, the variation in the responses was small, giving us some confidence in the results even with the limited sample.
Electronic bank account management (eBAM)We added several new questions to the 2012 survey to gauge the progress banks were making in offering electronic bank account management (eBAM) tools to their wholesale customers. Four banks said they currently offered an eBAM solution, and one more planned to begin offering eBAM sometime later in 2013. Another 10 banks said they were either investigating or considering adding an eBAM solution sometime in the near future.
All four banks currently providing eBAM services said their offering included the ability to open and close bank accounts and handle signer maintenance. Three banks said their eBAM solution was web-based and an equal number provided this service host-to-host. Three of the four reported that their eBAM solution used ISO 20022 standard messaging.
Sales and personnel issues

1330th Annual Cash Management Services Survey: 2013 executive summary
Trade services
Fifth annual survey We launched the trade services survey as an addendum to our regular cash management research back in 2009. The trade services survey questionnaire is distributed to the same banks that receive the CMS Survey. This year, we collected responses from 22 banks, up from 21 in 2012. The table below lists the 13 participants in Peer 1 (banks with more than US$85.0 billion in assets) and the 9 respondents in Peer 2 (banks with US$14.6 billion to US$85.0 billion in assets).
Peer 1 Peer 2
Bank of America Corporation BBVA Compass
Capital One Financial Corp. City National Corporation
Citibank, N.A. Comerica Incorporated
Fifth Third Bancorp Commerce Bancshares, Inc.
JPMorgan Chase & Co. Cullen/Frost Bankers, Inc.
KeyCorp First Citizens Bancshares
PNC Financial Services Group, Inc. First National Bank of Omaha
RBS Citizens Financial Group M&T Bank Corporation
Sovereign Bancorp, Inc. Webster Financial Services
SunTrust Banks, Inc.
Union Bank
U.S. Bancorp
Wells Fargo and Company
US$3.36 billion in trade services revenueWe asked the respondents to record their organizations’ total fee-based revenue from trade services performed in 2012, excluding any waivers or rebates returned to customers. The questionnaire instructed respondents to include only fee income from trade services booked in the US and performed for wholesale customers. Twenty-one of the 22 participants provided a revenue number. The total US-booked fee-based revenue measured was US$3.36 billion. This total represents only the fee-based revenue reported by the respondents and is not an attempt to take into account the revenue of non-respondents.
The top five banks, in terms of fee-based trade services revenue, accounted for 82% of the total. The identity of the top five trade services banks and their share of total
Trade survey respondents by peer group

1430th Annual Cash Management Services Survey: 2013 executive summary
measured revenue were unchanged from the 2012 survey. These five are also the top five cash management players although ranking order differs.
Revenue declined by 2.5% in 2012Twenty of the 22 survey respondents provided comparable revenue numbers for 2011 and 2012, enabling us to measure change. These 20 banks included the top five trade services providers, 7 other banks in Peer 1 and 8 banks in Peer 2. The resulting comparison showed a revenue decline of 2.5% in 2012. As the accompanying chart indicates, 2012 was the first year that we measured lower trade services revenue. Revenue growth had been steadily diminishing and the results for 2012 continued that trend.
-10%
0%
10%
20%
30%
2009
25.0%
2010
15.0%
2011 2012
3.0%-2.5%
Fewer transactionsWe compared the annual number of transactions and the total dollar value of transactions among the respondents that participated in both the 2012 and 2013 surveys. There was a small but broadly-based 2% decline in the overall number of trade services transactions. About three-quarters of the banks providing data for both years reported fewer transactions. We also captured a 6.5% drop in the dollar value of trade transactions during this period. Nearly two-thirds of the banks providing data reported a decrease in the value of their trade transactions.
Share of revenue from standby letters of credit unchangedData from previous trade services surveys have established that standby letters of credit (LCs) are a principal source of revenue within trade services. To quantify their importance, we asked for a breakout of revenue derived from standby LCs. In 2012, standby LC revenue totaled US$2.82 billion, or 84% of the total fee-based revenue collected for trade services. This was equal to standby LCs’ 84% share of revenue measured during 2011.
Trade servicesRevenue growth rates
Trade services

1530th Annual Cash Management Services Survey: 2013 executive summary
Revenue from customer segments To provide insight into the relative importance of various customer segments, we asked for the approximate percentage of trade services revenue that came from each of five pre-listed groups in the previous year. Since the top five banks produced 82% of measured revenue, we weighted the data to reflect that concentration. As a result, the largest players heavily influenced the numbers that follow. Large corporate customers were the biggest source of trade services revenue, providing 53% of the fee-based revenue in 2012, while middle-market clients contributed 27%. Small business clients and other financial institutions each accounted for 7%, and the government and nonprofit sector provided 6% of revenue.
To reflect the broad spectrum of banks responding to this survey, we have also calculated the distribution of revenue by customer type excluding the top five players. Without the top five trade banks, middle-market customers were the biggest source of revenue, providing 50% of fee-based income, while large corporate customers contributed 32%. Small business clients accounted for 10%, other financial institutions added 6% and the government and nonprofit sector contributed only 2% of revenue.
More offshore processingNine respondents (41%) said they currently processed US-booked trade transactions offshore, up from seven banks (33%) in the 2012 survey. Another two banks reported they were considering offshore processing. The four biggest trade players processed an average of 78% of their transaction volume offshore. This was up from the 74% they processed in the 2012 survey. The mean percentage of transactions processed offshore among all nine banks was 51%.
Trade services

1630th Annual Cash Management Services Survey: 2013 executive summary
Background and methodologyThe Cash Management Services Survey is a survey of the US cash management business performed annually by the EY Cash Management practice. We mailed the 2013 CMS Survey questionnaire in January 2013 to the top 100 US commercial bank holding companies that offer and actively market cash management or treasury services to their wholesale customers. A few thrifts that provide commercial cash management services and a handful of non-bank lockbox vendors were also sent the questionnaire.
We collected annual fee-equivalent revenue from the financial institutions and requested volume, product feature and pricing data from all respondents. For some product areas, we also requested the number of accounts and, in the case of sweep accounts, average daily balances. When prices were collected, we generally used a market-basket approach, obtaining the total fee for the group of charge codes required to perform an application. The survey gathered information on the cash management products and services listed below.
Account reconciliation Information reporting Automated clearing house Payroll cards Check clearing Purchasing cards Coin and currency Retail lockbox Controlled disbursement Sweep accounts Demand deposit accounts Wholesale lockbox Electronic data interchange Wire transfer
Upon receipt of the completed questionnaires, the EY Cash Management practice reviewed the data in comparison with prior years’ responses and other participants’ answers. Many participants were contacted to obtain clarifications. After this review, responses were entered into the CMS database.
The 2013 questionnaire requested 2011 and 2012 total fee-equivalent revenue, as well as revenue by product, to enable us to create estimates for the top 100 banks. Our process included approximating the revenue of non-respondents based on their asset size or prior data they may have submitted. We also calculated the respondents’ forecast for the current year by using their estimated 2013 revenue. Volume and pricing trend analyses were performed by comparing prior-year and current-year data among banks that responded in both 2012 and 2013. This process was made possible by the continued participation of most major banks over many years.

1730th Annual Cash Management Services Survey: 2013 executive summary
For more informationAll 2013 CMS Survey respondents received a more complete participant report in consideration of their participation and assistance. Participating organizations may also purchase a ranking report. In addition to the CMS Survey, the EY Cash Management practice assists financial institutions in reducing their non-earning assets and enhancing revenue. The practice also helps corporations establish, maintain and improve their cash management systems. For more information on the CMS Survey or our Cash Management practice’s capabilities, please visit our website, www.ey.com, or contact:
New YorkCMS Survey Director Larry Forman, CCM +1 212 773 1111 [email protected]
Kansas CityExecutive Director Cash Management Alan Zimmerman, CCM +1 816 480 5317 [email protected]
CMS Survey ranking reportThe CMS Survey ranking report provides an organization’s national rank among the participants for most of the cash management services included in the survey. Product ranks, typically based on transaction volumes, and percentage of market share are presented, along with the total volume for all respondents. The top 10 volumes collected for each product category are listed in the report, and the names of the top 10 providers are printed alphabetically. The ranking report is helpful in evaluating market position across products. Banks may cite their EY rankings in marketing material and in responses to RFPs.
The price for the 2013 CMS Survey ranking report is US$32,000. Ranking data from the 2013 trade services survey is also available for an additional US$3,000 when purchased in conjunction with the 2013 CMS Survey ranking report, or for US$5,000 when purchased separately. For more information about cash management market research and the ranking report, contact Larry Forman at +1 212 773 1111 or by e-mail at [email protected].

EY | Assurance | Tax | Transactions | Advisory
About EYEY is a global leader in assurance, tax, transaction and advisoryservices. The insights and quality services we deliver help build trust andconfidence in the capital markets and in economies the world over. Wedevelop outstanding leaders who team to deliver on our promises to allof our stakeholders. In so doing, we play a critical role in building a betterworking world for our people, for our clients and for our communities.
EY refers to the global organization, and may refer to one or more, ofthe member firms of Ernst & Young Global Limited, each of which is aseparate legal entity. Ernst & Young Global Limited, a UK company limitedby guarantee, does not provide services to clients. For more informationabout our organization, please visit ey.com.
Ernst & Young LLP is a client-serving member firm of Ernst & Young Global Limited operating in the US.
EY is a leader in serving the global financial services marketplace Nearly 35,000 EY financial services professionals around the world provide integrated assurance, tax, transaction and advisory services to our asset management, banking, capital markets and insurance clients. In the Americas, EY is the only public accounting organization with a separate business unit dedicated to the financial services marketplace. Created in 2000, the Americas Financial Services Office today includes more than 4,000 professionals at member firms in over 50 locations throughout the US, the Caribbean and Latin America.
EY professionals in our financial services practices worldwide align with key global industry groups, including EY’s Global Asset Management Center, Global Banking & Capital Markets Center, Global Insurance Center and Global Private Equity Center, which act as hubs for sharing industry-focused knowledge on current and emerging trends and regulations in order to help our clients address key issues. Our practitioners span many disciplines and provide a well-rounded understanding of business issues and challenges, as well as integrated services to our clients.
With a global presence and industry-focused advice, EY’s financial services professionals provide high-quality assurance, tax, transaction and advisory services, including operations, process improvement, risk and technology, to financial services companies worldwide.
© 2013 Ernst & Young LLP. All Rights Reserved.
SCORE No. CK07521307-1101768 BSCED None
This material has been prepared for general informational purposes only and is not intended to be relied upon as accounting, tax, or other professional advice. Please refer to your advisors for specific advice.
ey.com