>30jaar> 30 jaar op de beurs - vfb - vfb - vfb · · 2015-04-30geosea deme blue energy...
TRANSCRIPT

> 30 JAAR> 30 JAAR OP DE BEURS
TOM BAMELIS – CFOAPRIL 25 2015APRIL 25, 2015

June 20, 1984: IPO AvH
2
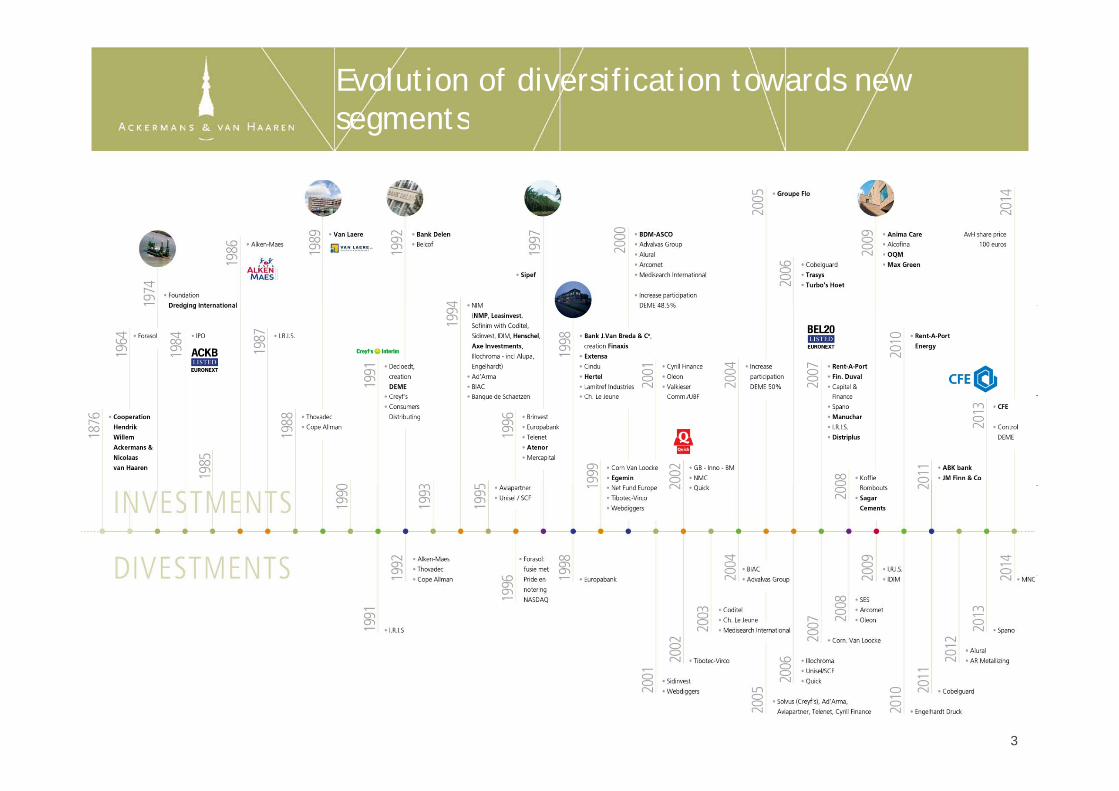
Evolution of diversification towards new segmentssegments
3
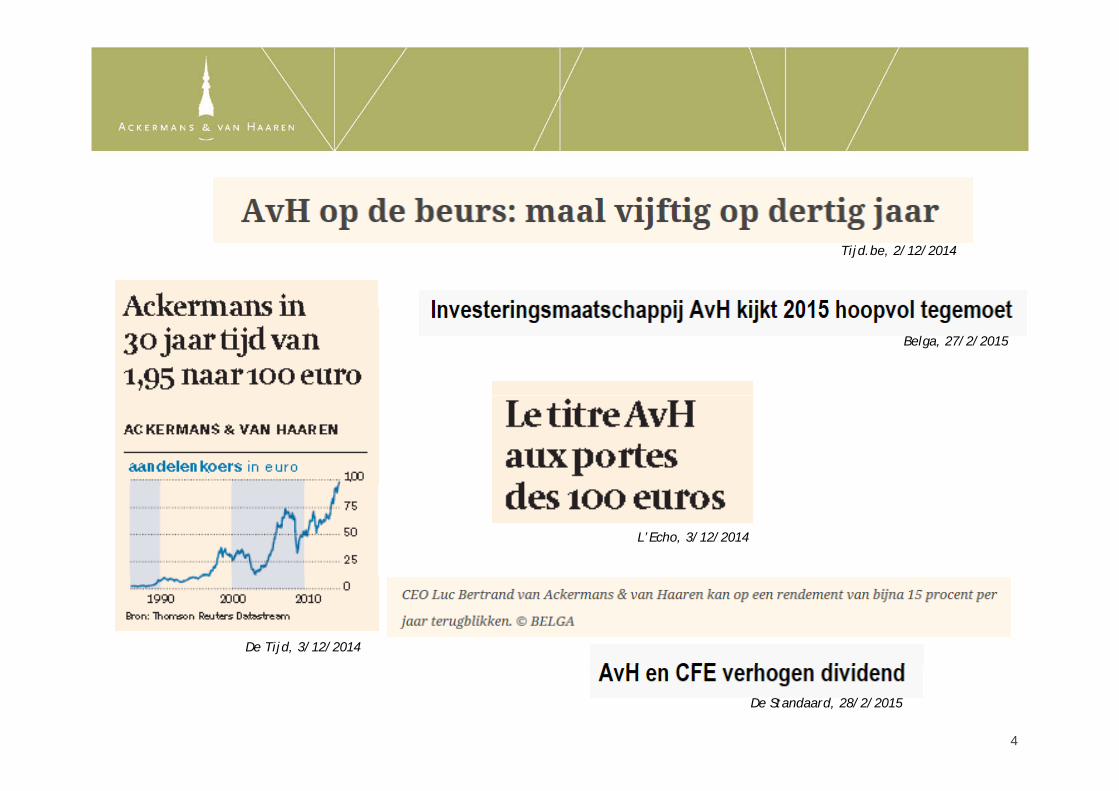
Tijd.be, 2/12/2014
Belga, 27/2/2015
L’Echo, 3/12/2014
De Tijd, 3/12/2014
44
De Standaard, 28/2/2015
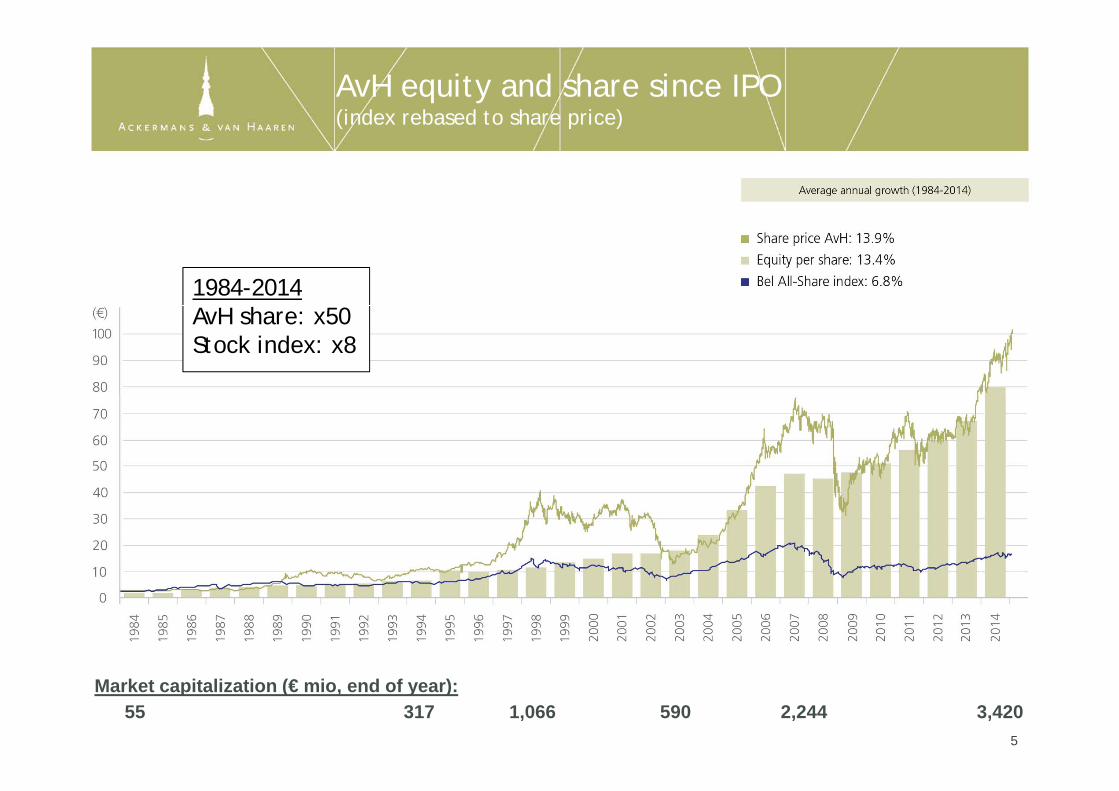
AvH equity and share since IPO(index rebased to share price)( p )
1984-2014AvH share: x50Stock index: x8
5
Market capitalization (€ mio, end of year):55 317 2,2445901,066 3,420

Evolution of AvH equity and share price since IPOsince IPO
CAGR (1984 2014) CAGR (1984 2014)CAGR (1984‐2014) Equity per share 13.4% Equity per share incl. dividend 14.2%
CAGR (1984‐2014) Share price 13.9% Share price incl. dividend 14.5%
6
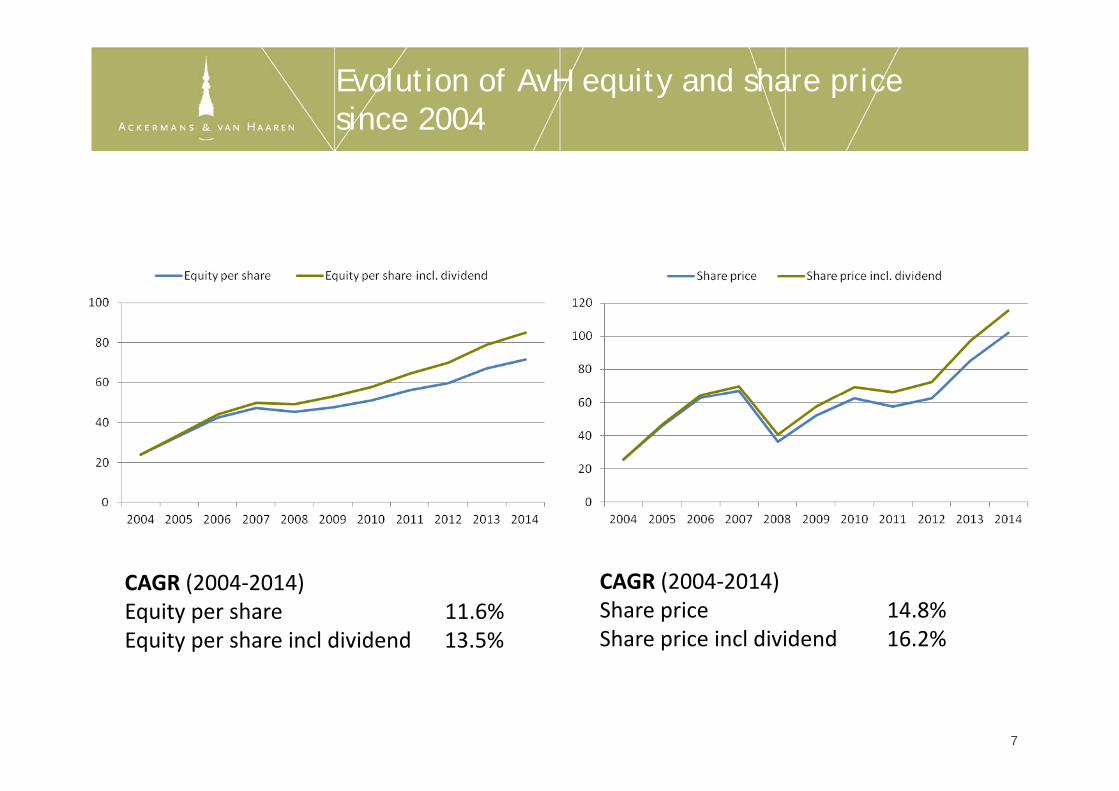
Evolution of AvH equity and share price since 2004since 2004
CAGR (2004 2014) CAGR (2004 2014)CAGR (2004‐2014) Equity per share 11.6% Equity per share incl dividend 13.5%
CAGR (2004‐2014) Share price 14.8% Share price incl dividend 16.2%
7

Value creation in Belgium
8
Source: Value Square, Fundamentele waardecreatie Belgische beursgenoteerde bedrijven 2003-2013
8
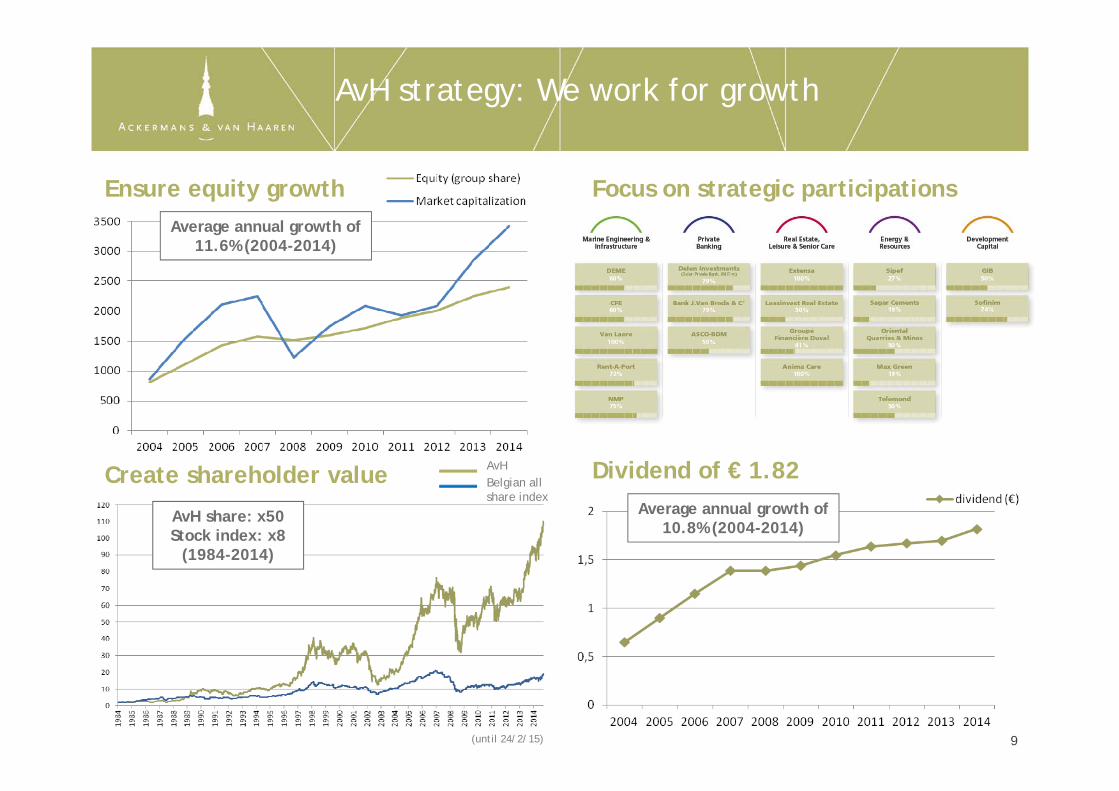
AvH strategy: We work for growth
Focus on strategic participationsEnsure equity growthAverage annual growth of
11.6% (2004-2014)
Create shareholder value Dividend of € 1.82AvHBelgian all
AvH share: x50Stock index: x8
(1984-2014)
Belgian all share index
Average annual growth of 10.8% (2004-2014)
9(until 24/2/15) 9
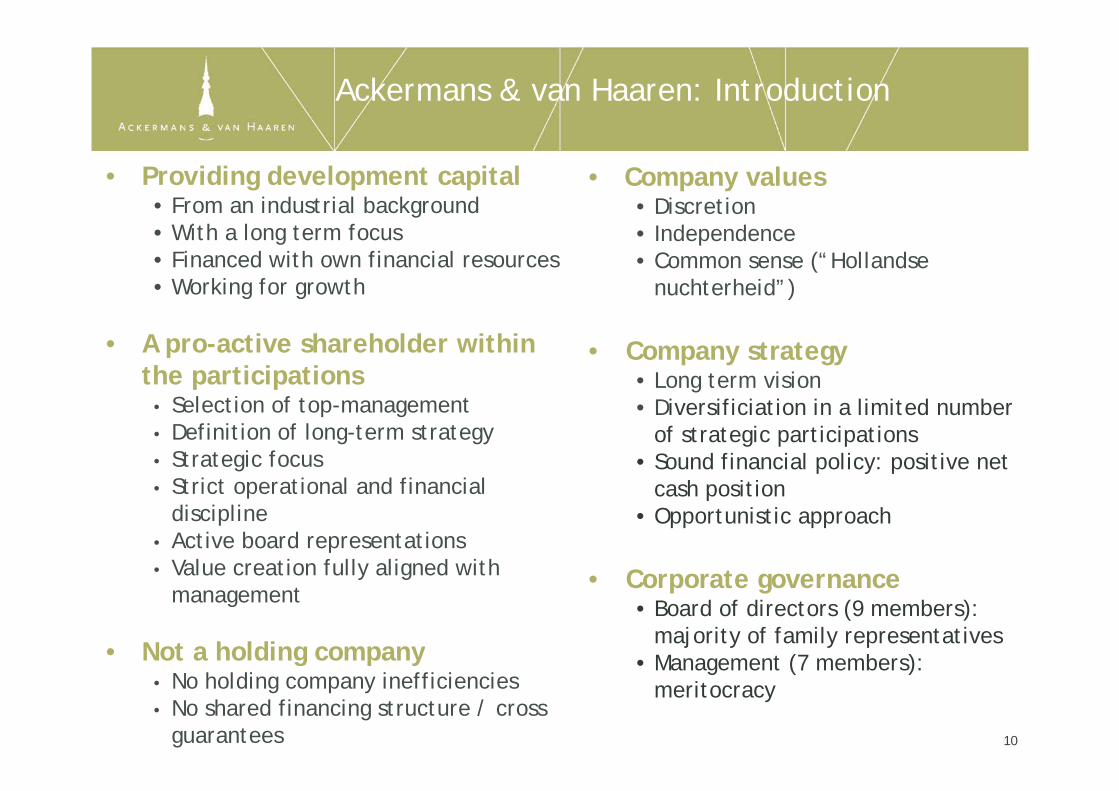
Ackermans & van Haaren: Introduction
• Providing development capital• From an industrial background
• Company values• Discretiong
• With a long term focus• Financed with own financial resources• Working for growth
• Independence• Common sense (“Hollandse
nuchterheid”)
• A pro-active shareholder within the participations
• Company strategy• Long term vision
• Selection of top-management• Definition of long-term strategy• Strategic focus
Strict operational and financial
• Diversificiation in a limited number of strategic participations
• Sound financial policy: positive net cash position• Strict operational and financial
discipline• Active board representations• Value creation fully aligned with
cash position• Opportunistic approach
Corporate governanceValue creation fully aligned with management
• Not a holding company
• Corporate governance• Board of directors (9 members):
majority of family representatives• Management (7 members): g p y
• No holding company inefficiencies• No shared financing structure / cross
guarantees 10
• Management (7 members): meritocracy
11
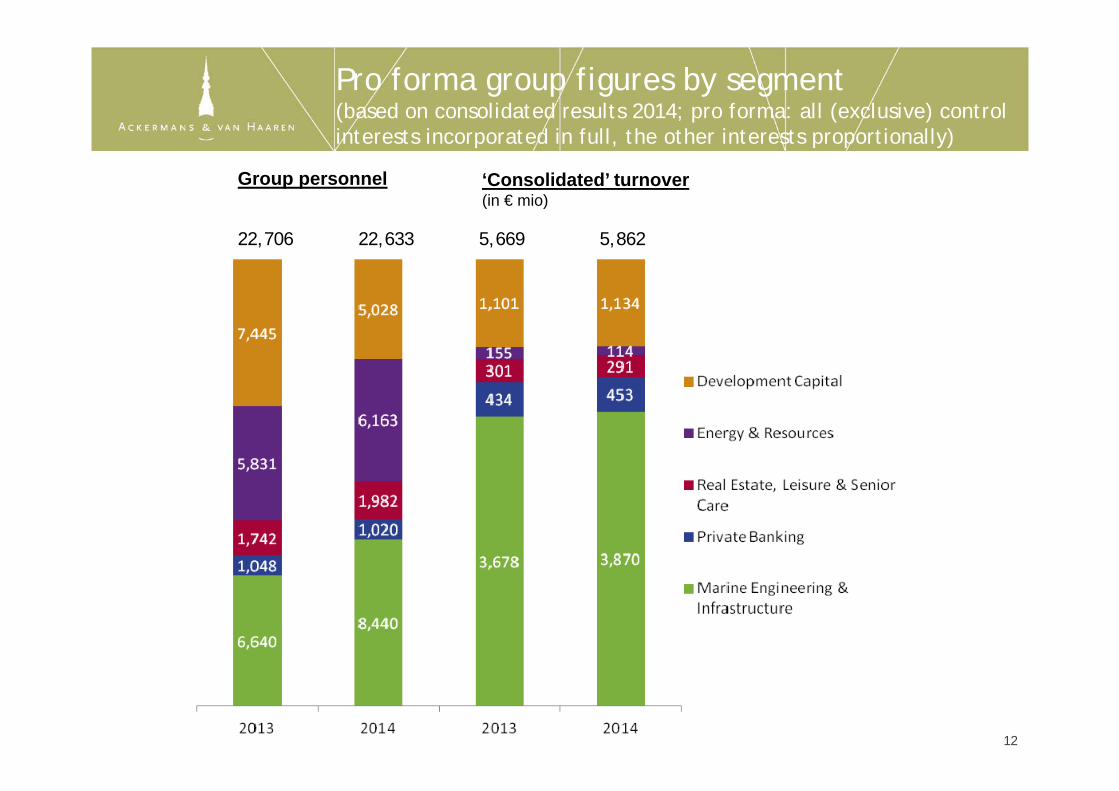
Pro forma group figures by segment(based on consolidated results 2014; pro forma: all (exclusive) control interests incorporated in full, the other interests proportionally)
Group personnel ‘Consolidated’ turnover(in € mio)
22,633 5,86222,706 5,669
12
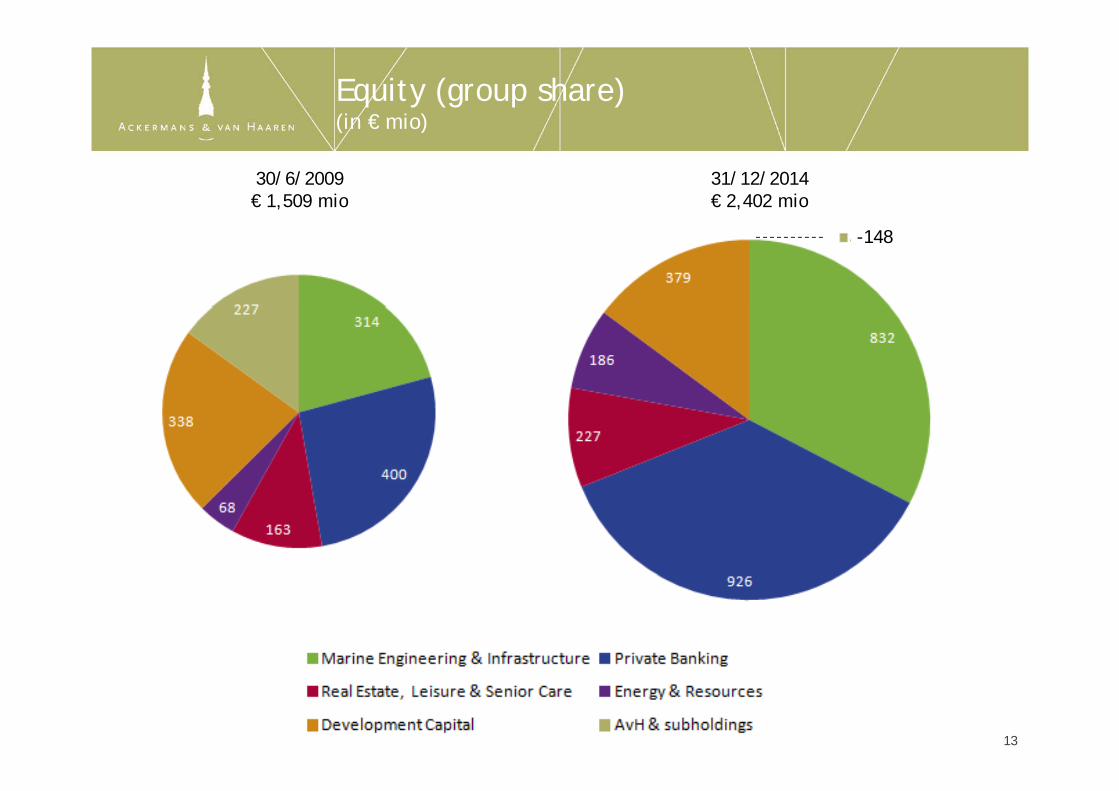
Equity (group share)(in € mio)(in € mio)
30/6/2009€ 1,509 mio
31/12/2014€ 2,402 mio
-148
13

Consolidated group result
(in € mio) 2014 2013 2012(2) 2011 2010( )
Marine Engineering & Infrastructure 106.2 59.7 51.7 54.6 58.7Private Banking 91.4 84.5 71.5 88.1 63.6Private Banking 91.4 84.5 71.5 88.1 63.6Real Estate, Leisure & Senior Care 14.7 15.8 3.6 4.5 8.6Energy & Resources 19.5 8.7 16.4 19.0 16.5Development Capital -6 7 -6 6 5 9 8 6 13 3Development Capital -6.7 -6.6 5.9 8.6 13.3
Result from participations 225.1 162.1 149.1 174.8 160.7C it l g i d l t it l 15 4 29 5 22 7 0 9 0 3Capital gains development capital -15.4 29.5 22.7 -0.9 -0.3Result from participations (incl. capital gains) 209.7 191.6 171.8 173.9 160.4
AvH & subholdings -7.1 -7.2 -3.9 -0.9 -0.1
Other non-recurrent result 12.5 109.5(1) -0.6 4.5 0.5Consolidated group result 215.1 293.9(1) 167.3 177.5 160.8
(1) Incl. € 109.4 mio result on the “remeasurement” of AvH’s existing 50% stake in DEME when taking full control over DEME in December 2013
(2) Restated financial statements 2012 (IAS19)14
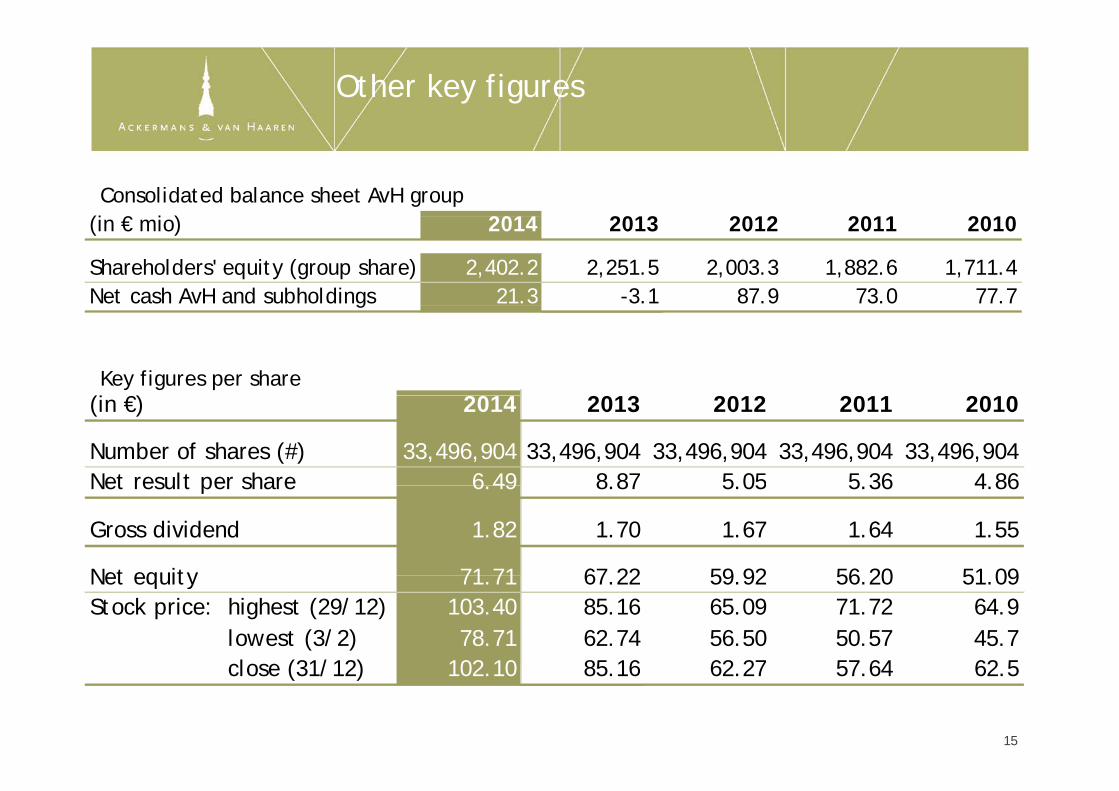
Other key figures
(i € i ) 2014 2013 2012 2011 2010Consolidated balance sheet AvH group
(in € mio) 2014 2013 2012 2011 2010
Shareholders' equity (group share) 2,402.2 2,251.5 2,003.3 1,882.6 1,711.4Net cash AvH and subholdings 21.3 -3.1 87.9 73.0 77.7g
(i €) 2014 2013 2012 2011 2010Key figures per share
(in €) 2014 2013 2012 2011 2010
Number of shares (#) 33,496,904 33,496,904 33,496,904 33,496,904 33,496,904Net result per share 6 49 8 87 5 05 5 36 4 86Net result per share 6.49 8.87 5.05 5.36 4.86
Gross dividend 1.82 1.70 1.67 1.64 1.55
Net equity 71 71 67 22 59 92 56 20 51 09Net equity 71.71 67.22 59.92 56.20 51.09Stock price: highest (29/12) 103.40 85.16 65.09 71.72 64.9 lowest (3/2) 78.71 62.74 56.50 50.57 45.7 close (31/12) 102 10 85 16 62 27 57 64 62 5 close (31/12) 102.10 85.16 62.27 57.64 62.5
15
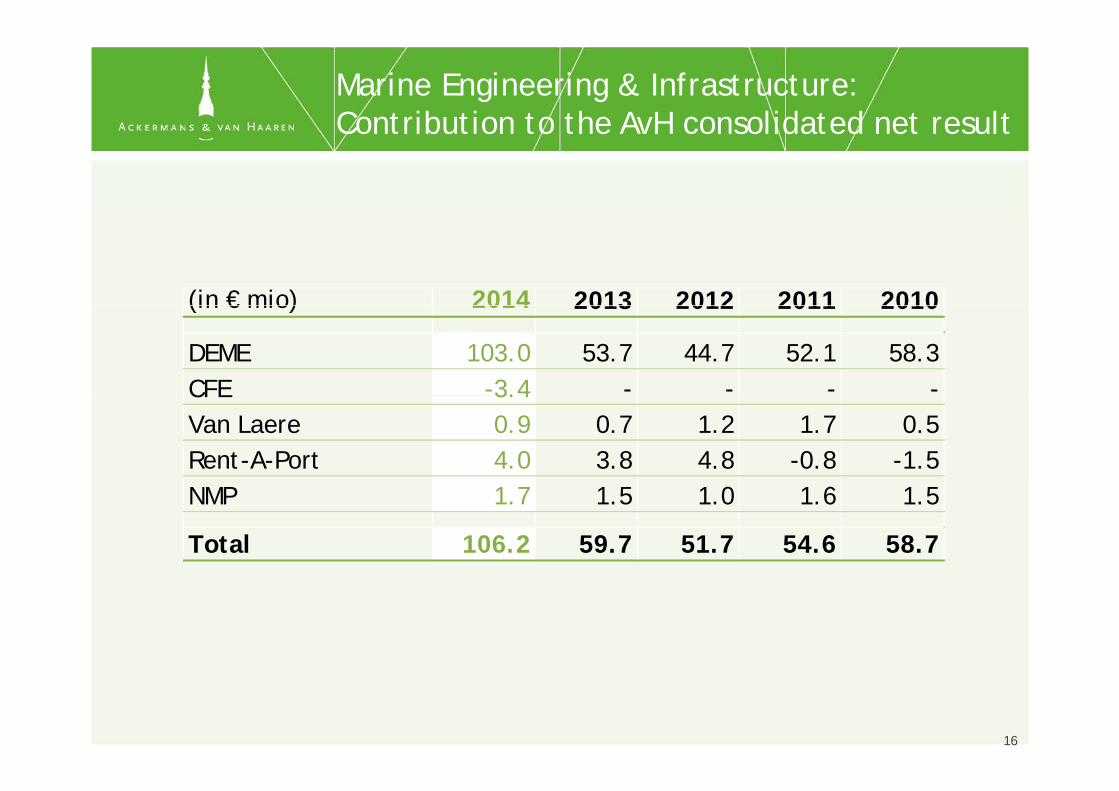
Marine Engineering & Infrastructure: Contribution to the AvH consolidated net resultContribution to the AvH consolidated net result
(in € mio) 2014 2013 2012 2011 2010(in € mio) 2014 2013 2012 2011 2010
DEME 103.0 53.7 44.7 52.1 58.3CFE -3.4 - - - -CFE 3.4Van Laere 0.9 0.7 1.2 1.7 0.5Rent-A-Port 4.0 3.8 4.8 -0.8 -1.5NMP 1.7 1.5 1.0 1.6 1.5
Total 106.2 59.7 51.7 54.6 58.7
16

Marine Engineering & Infrastructure
• One of the largest and most diversified dredging and marine DEME
CFE
One of the largest and most diversified dredging and marine engineering companies in the world
DEME
• An industrial group active in Contracting, Real Estate CFE
VAN LAERE • General contractor of large residential, office and civil
g p g,Development, Public-Private Partnership and Concessions
construction projects; focus on PPS projects and parkings• 2014: Increase of turnover to € 167 mio• Order book at € 176 mio
• Specialised in port development and logistics• 2014: Lower net result, as 2014 is transition year for Dinh Vu
(Vi t )
RENT-A-PORT
NMP • Operator of pipelines for chemicals2014: Results in line with expectations
(Vietnam)
• 2014: Results in line with expectations
17
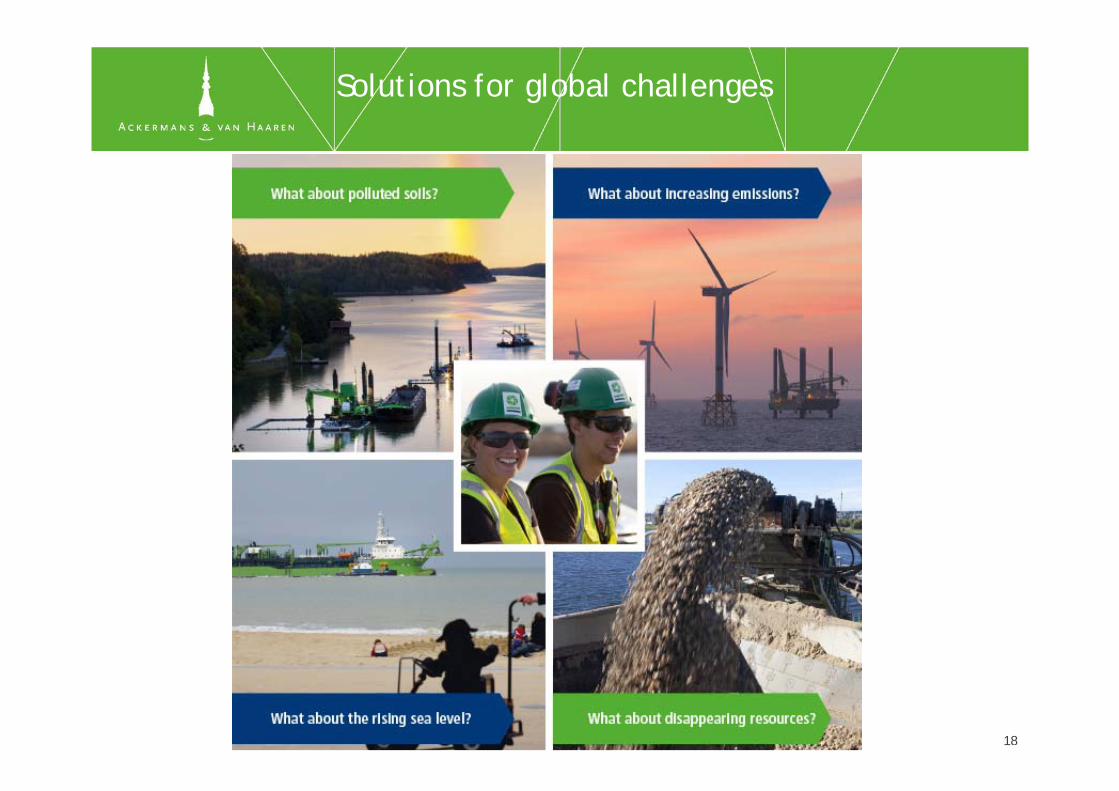
Solutions for global challenges
1818

DEME: long term track record of long term shareholding and entrepreneurial growthshareholding and entrepreneurial growth
(in 000 euro) Turnover Equity
2.000.000
2.500.000
1.000.000
1.500.000
‐
500.000
1990 1992 1994 1996 1998 2000 2002 2004 2006 2008 2010 2012 20141974 1990 1992 1994 1996 1998 2000 2002 2004 2006 2008 2010 2012 201497
ScaldisDBM Creation DEME
Holding G SCTOWCreation Dredging
International (AvH Tideway
DEC
(Building Materials)
Holding(Acquisition Decloedt)
GeoSea DEME Blue EnergyOceanflore
International (AvH + CFE dredging) Power@Sea
Tideway
AvH 39.5% AvH 48.5% AvH 50% AvH 60.4%
Consolidation Partnership
AvH 45%
Control
1919
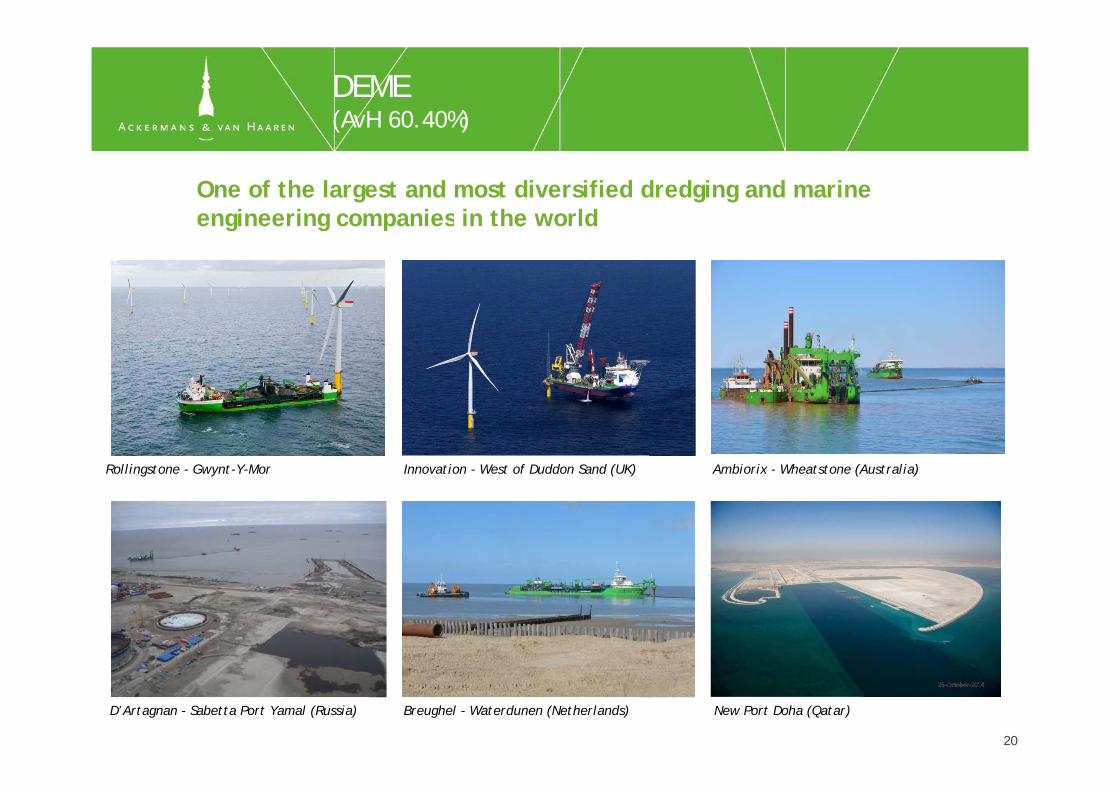
DEME(AvH 60.40%)
One of the largest and most diversified dredging and marine engineering companies in the world
(AvH 60.40%)
engineering companies in the world
Rollingstone - Gwynt-Y-Mor Innovation - West of Duddon Sand (UK) Ambiorix - Wheatstone (Australia)
20
Breughel - Waterdunen (Netherlands) New Port Doha (Qatar)D’Artagnan - Sabetta Port Yamal (Russia)
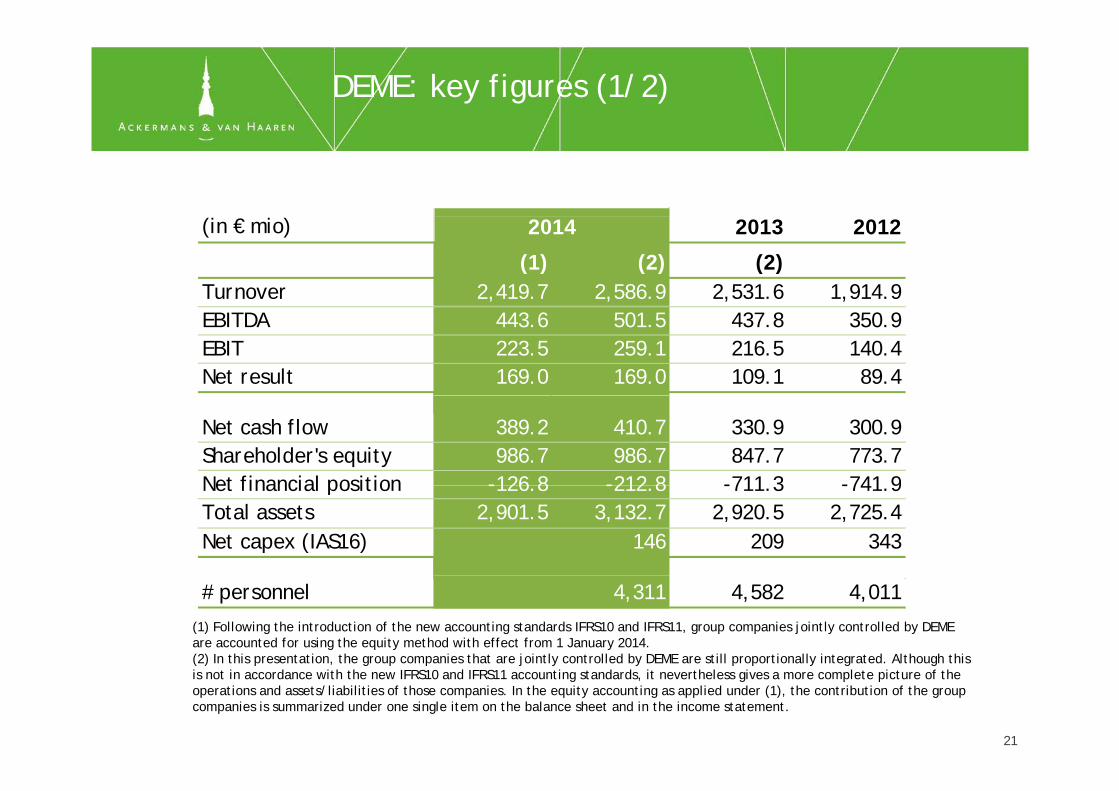
DEME: key figures (1/2)
(in € mio) 2013 2012
(1) (2) (2)Turnover 2,419.7 2,586.9 2,531.6 1,914.9
2014
EBITDA 443.6 501.5 437.8 350.9EBIT 223.5 259.1 216.5 140.4Net result 169.0 169.0 109.1 89.4
Net cash flow 389.2 410.7 330.9 300.9Shareholder's equity 986.7 986.7 847.7 773.7Net financial position -126 8 -212 8 -711 3 -741 9Net financial position -126.8 -212.8 -711.3 -741.9Total assets 2,901.5 3,132.7 2,920.5 2,725.4Net capex (IAS16) 146 209 343
# personnel 4,311 4,582 4,011
(1) Following the introduction of the new accounting standards IFRS10 and IFRS11, group companies jointly controlled by DEME are accounted for using the equity method with effect from 1 January 2014.(2) In this presentation, the group companies that are jointly controlled by DEME are still proportionally integrated. Although this ( ) p , g p p j y y p p y g gis not in accordance with the new IFRS10 and IFRS11 accounting standards, it nevertheless gives a more complete picture of the operations and assets/liabilities of those companies. In the equity accounting as applied under (1), the contribution of the group companies is summarized under one single item on the balance sheet and in the income statement.
21
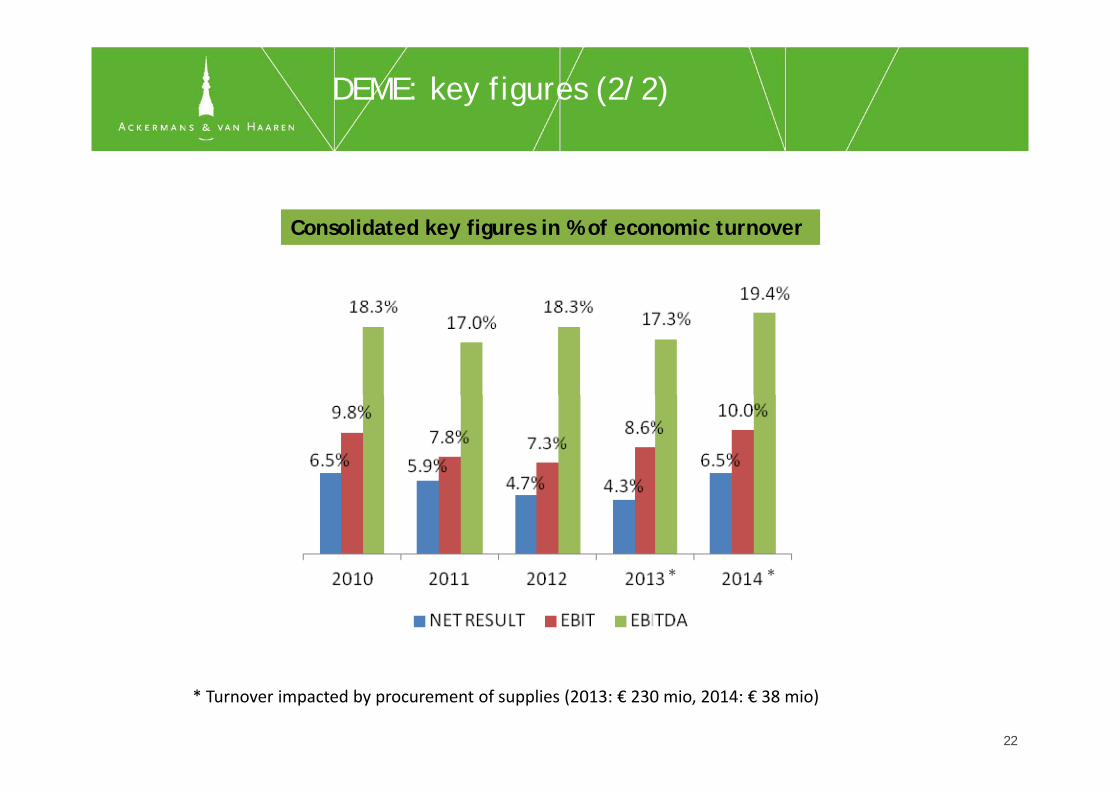
DEME: key figures (2/2)
Consolidated key figures in % of economic turnover
** ** *
* Turnover impacted by procurement of supplies (2013: € 230 mio, 2014: € 38 mio)
22

DEME: breakdown of economic turnover
Per region
2013 2014
Per activity
2013 2014
Per type of customer
2013 2014
23

DEME: order book (€ mio)(€ mio)
Other 33%
Middle East + IndiaAsia
Europe
7%14%
26%
O d b k 2014 i i d hi h l l € 2 420 i ( 3 049 i d f 2013)
Benelux20%
Order book 2014 maintained at a high level: € 2,420 mio (vs 3,049 mio end of 2013), with orders across different regions and activities• Construction of approach channel and harbour basis of service port for new LNG terminal
in Yamal (Russia)in Yamal (Russia)• Deepening and widening of Suez canal (Egypt): contract of € 421 mio (DEME 75%)• Offshore wind farms Gode Wind (2013) and Nordsee One (Germany)
E l 2015 i d f l l f € 1 600 i M i i • Early 2015, new contracts signed for a total value of € 1,600 mio. Most important one is Tuas project in Singapore: construction of 8.6 km quay wall, reclamation of 300 ha new land and dredging of fairways over period of 6 years
24
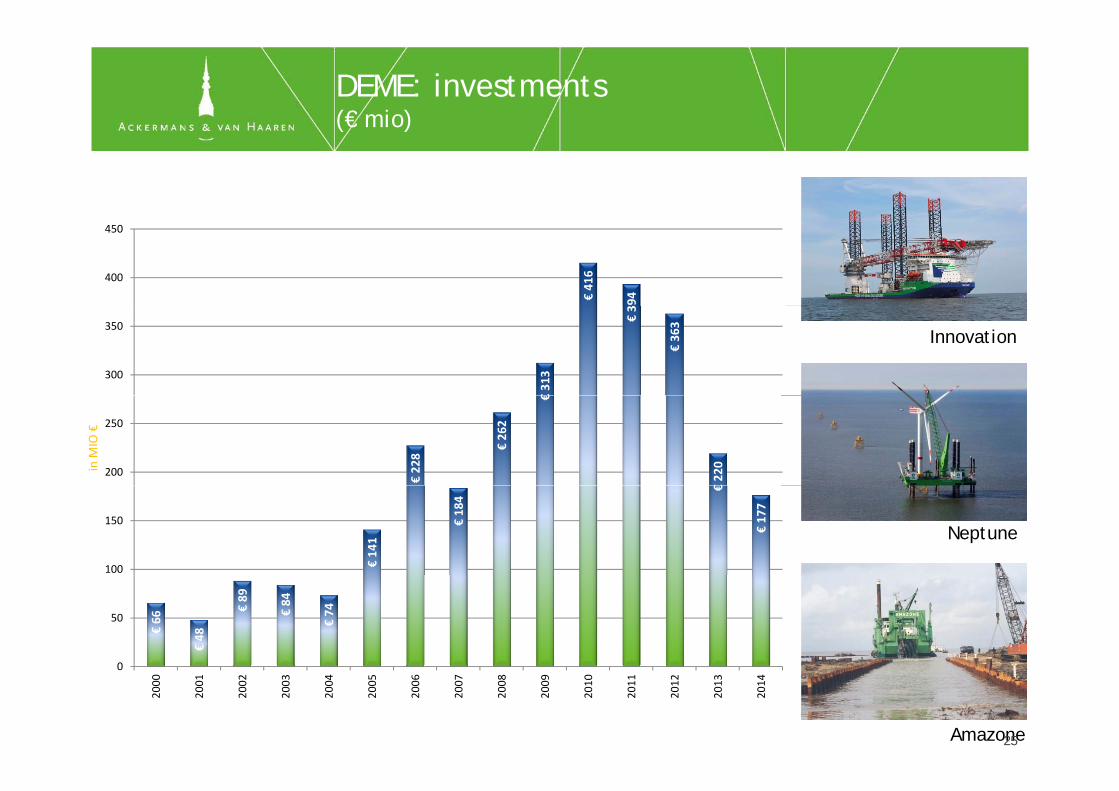
DEME: investments(€ mio)(€ mio)
€416
94
400
450
Innovation
€313
€3
€363
300
350
€228
€262
€
€220
200
250
in M
IO €
Neptune
€141
€184
€
€177
100
150
€66
€48
€89
€84
€74
0
50
Amazone25
0
2000
2001
2002
2003
2004
2005
2006
2007
2008
2009
2010
2011
2012
2013
2014
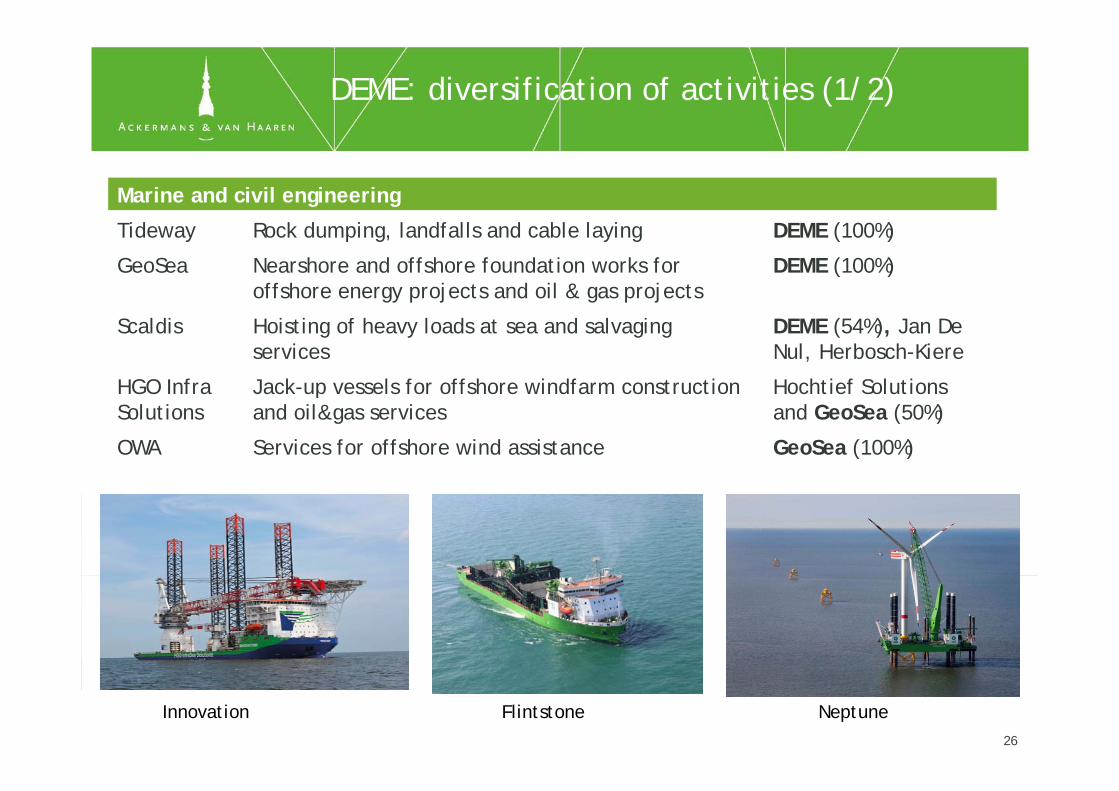
DEME: diversification of activities (1/2)
Marine and civil engineering
Tideway Rock dumping, landfalls and cable laying DEME (100%)
GeoSea Nearshore and offshore foundation works for offshore energy projects and oil & gas projects
DEME (100%)
Scaldis Hoisting of heavy loads at sea and salvaging services
DEME (54%), Jan De Nul, Herbosch-Kiere
HGO Infra Jack-up vessels for offshore windfarm construction Hochtief Solutions Solutions
pand oil&gas services and GeoSea (50%)
OWA Services for offshore wind assistance GeoSea (100%)
Innovation Flintstone Neptune26
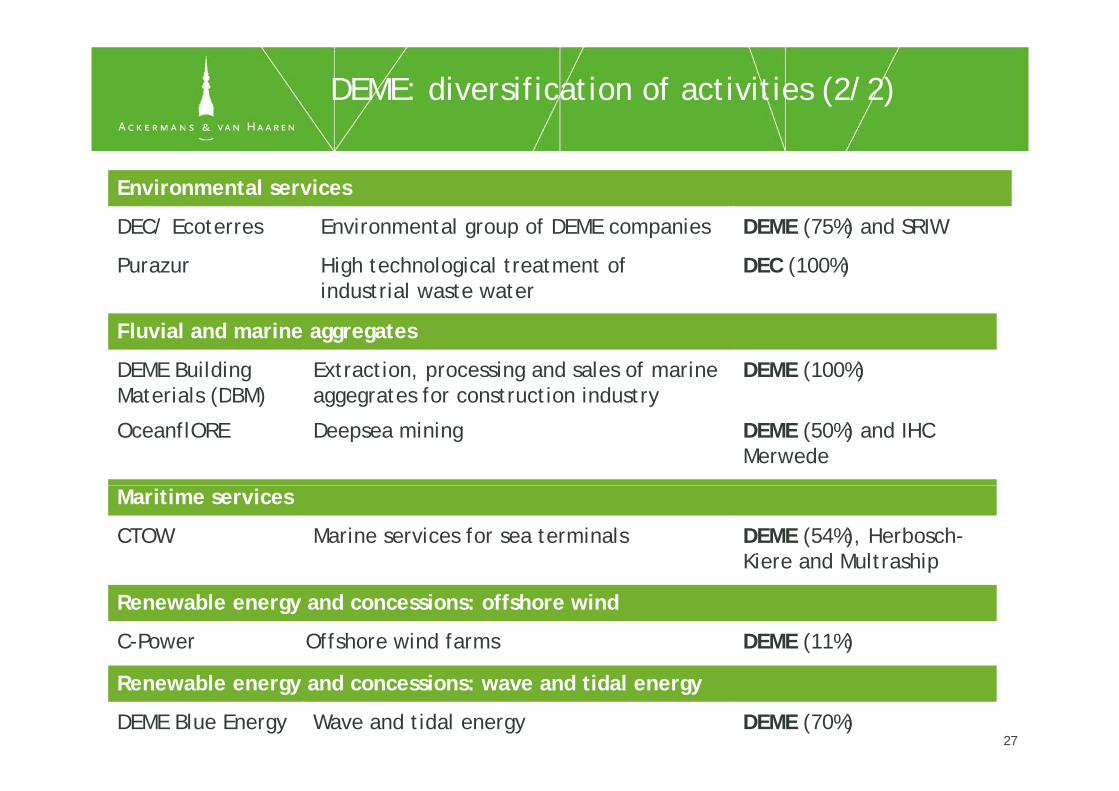
DEME: diversification of activities (2/2)
Environmental services
DEC/ Ecoterres Environmental group of DEME companies DEME (75%) and SRIW
Purazur High technological treatment of industrial waste water
DEC (100%)
Fluvial and marine aggregates
DEME Building Materials (DBM)
Extraction, processing and sales of marine aggegrates for construction industry
DEME (100%)Materials (DBM) aggegrates for construction industry
OceanflORE Deepsea mining DEME (50%) and IHC Merwede
Maritime services
CTOW Marine services for sea terminals DEME (54%), Herbosch-Kiere and Multraship
Renewable energy and concessions: offshore wind
C-Power Offshore wind farms DEME (11%)
Renewable energy and concessions: wave and tidal energy
DEME Blue Energy Wave and tidal energy DEME (70%)27

Vlaamse Baaien (Flanders Bays)
• A comprehensive plan (11 projects) that combines a long-term vision for sustainablecoastal protection with proposals for short-term actioncoastal protection with proposals for short term action
• Fosters an integrated, flexible development of the Belgian coast and Scheldt mouth
• Changes threats (climate change) into opportunities:• restoring attractiveness of an overbuilt coast• generating green and blue energy production• harmoniously expanding urbanisation tourism and harbour activitiesharmoniously expanding urbanisation, tourism and harbour activities
28

Energy storage atoll
29
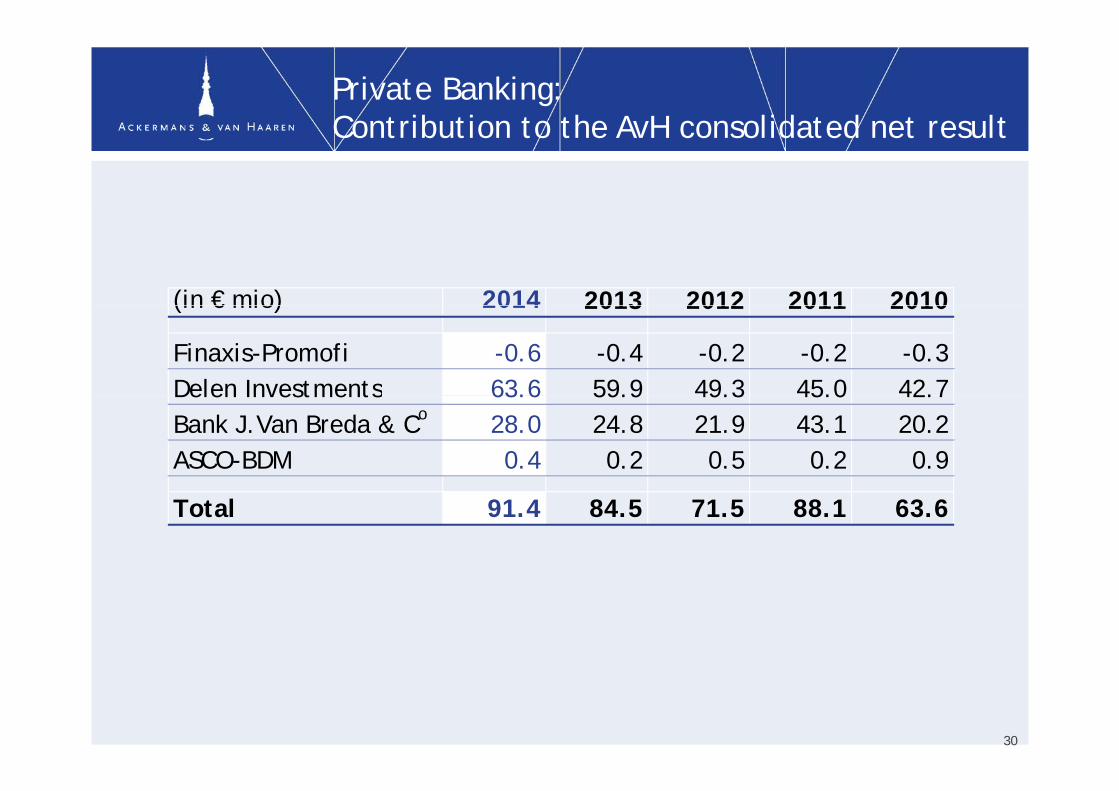
Private Banking: Contribution to the AvH consolidated net resultContribution to the AvH consolidated net result
(in € mio) 2014 2013 2012 2011 2010(in € mio) 2014 2013 2012 2011 2010
Finaxis-Promofi -0.6 -0.4 -0.2 -0.2 -0.3Delen Investments 63.6 59.9 49.3 45.0 42.7Delen Investments 63.6 59.9 49.3 45.0 42.7Bank J.Van Breda & Co 28.0 24.8 21.9 43.1 20.2ASCO-BDM 0.4 0.2 0.5 0.2 0.9
Total 91.4 84.5 71.5 88.1 63.6
30
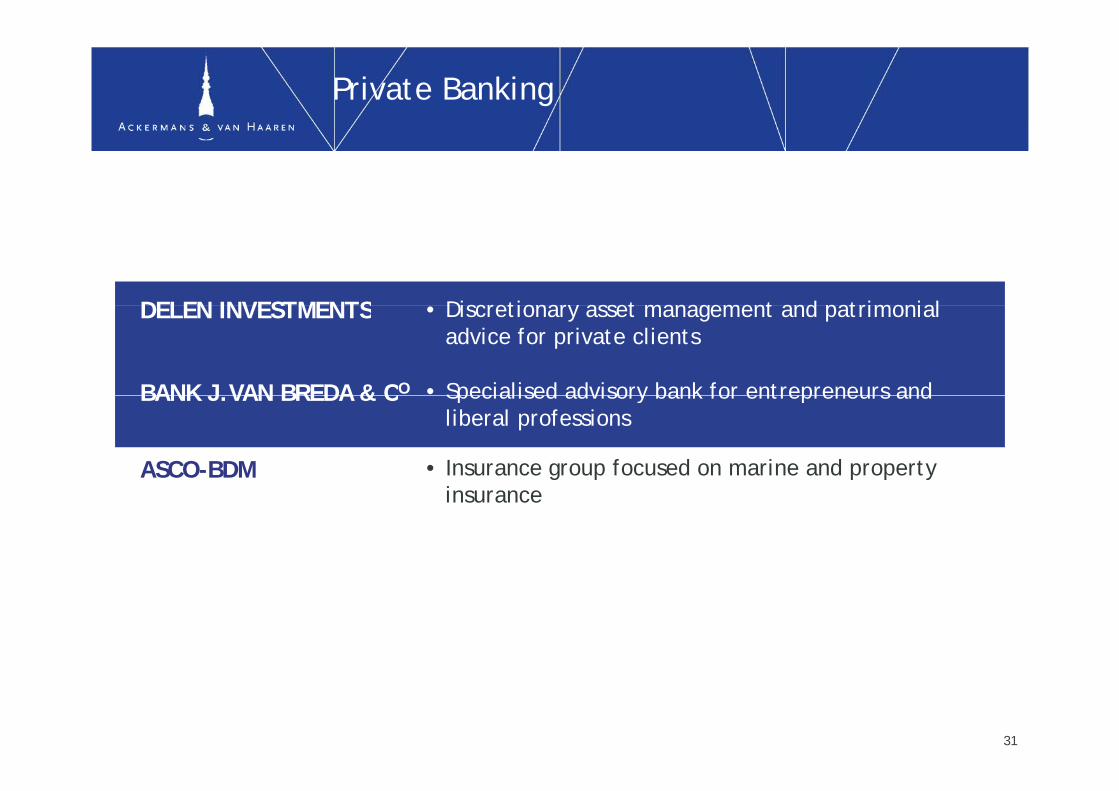
Private Banking
DELEN INVESTMENTS Discretionary asset management and patrimonial DELEN INVESTMENTS
• Specialised advisory bank for entrepreneurs and
• Discretionary asset management and patrimonial advice for private clients
BANK J VAN BREDA & CO Specialised advisory bank for entrepreneurs and liberal professions
BANK J.VAN BREDA & C
• Insurance group focused on marine and property ASCO-BDMinsurance
31

Delen Investments: funds under management(AvH 78.75%)(AvH 78.75%)
Private banking and wealth management. Focused on discretionary g g yasset management for private clients, in Belgium and UK
AuM CAGR 2005-2014:
JM Finn
17.9%
Capfi
1992
32
1992

Assets under management
(in € mio) 2014 2013 2012
Total assets under management
Delen Investments 32,866 29,536 25,855 Delen Private Bank 22,808 20,210 17,884 JM Finn & Co 10,058 9,326 7,971
Van Breda: bancassurance products 1,567 1,507 1,496Van Breda: AuM at Delen* 3,603 3,036 2,504Van Breda: client deposits 3,815 3,683 3,424(*) Already included in Delen Private Bank AuM
33
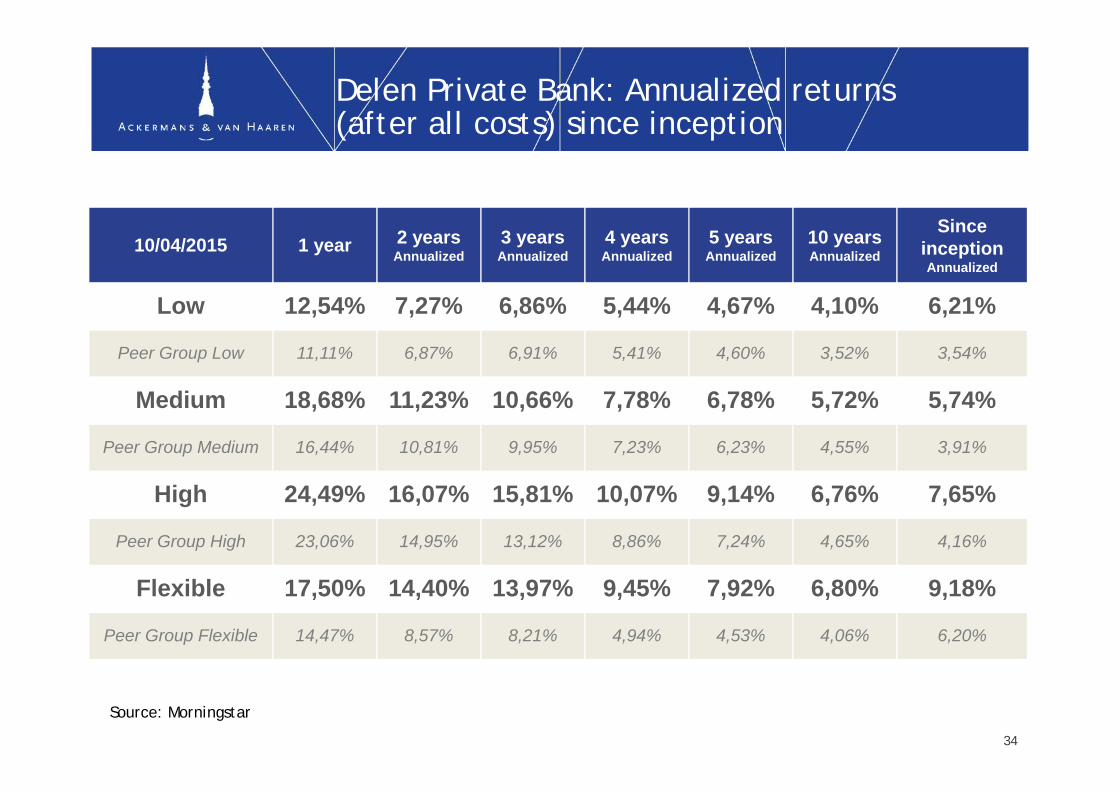
Delen Private Bank: Annualized returns (after all costs) since inception(after all costs) since inception
10/04/2015 1 year 2 years Annualized
3 years Annualized
4 years Annualized
5 years Annualized
10 years Annualized
Since inception Annualized
Low 12 54% 7 27% 6 86% 5 44% 4 67% 4 10% 6 21%Low 12,54% 7,27% 6,86% 5,44% 4,67% 4,10% 6,21%
Peer Group Low 11,11% 6,87% 6,91% 5,41% 4,60% 3,52% 3,54%
Medium 18 68% 11 23% 10 66% 7 78% 6 78% 5 72% 5 74%Medium 18,68% 11,23% 10,66% 7,78% 6,78% 5,72% 5,74%
Peer Group Medium 16,44% 10,81% 9,95% 7,23% 6,23% 4,55% 3,91%
Hi h 24 49% 16 07% 15 81% 10 07% 9 14% 6 76% 7 65%High 24,49% 16,07% 15,81% 10,07% 9,14% 6,76% 7,65%
Peer Group High 23,06% 14,95% 13,12% 8,86% 7,24% 4,65% 4,16%
Flexible 17,50% 14,40% 13,97% 9,45% 7,92% 6,80% 9,18%
Peer Group Flexible 14,47% 8,57% 8,21% 4,94% 4,53% 4,06% 6,20%
Source: Morningstar
3434
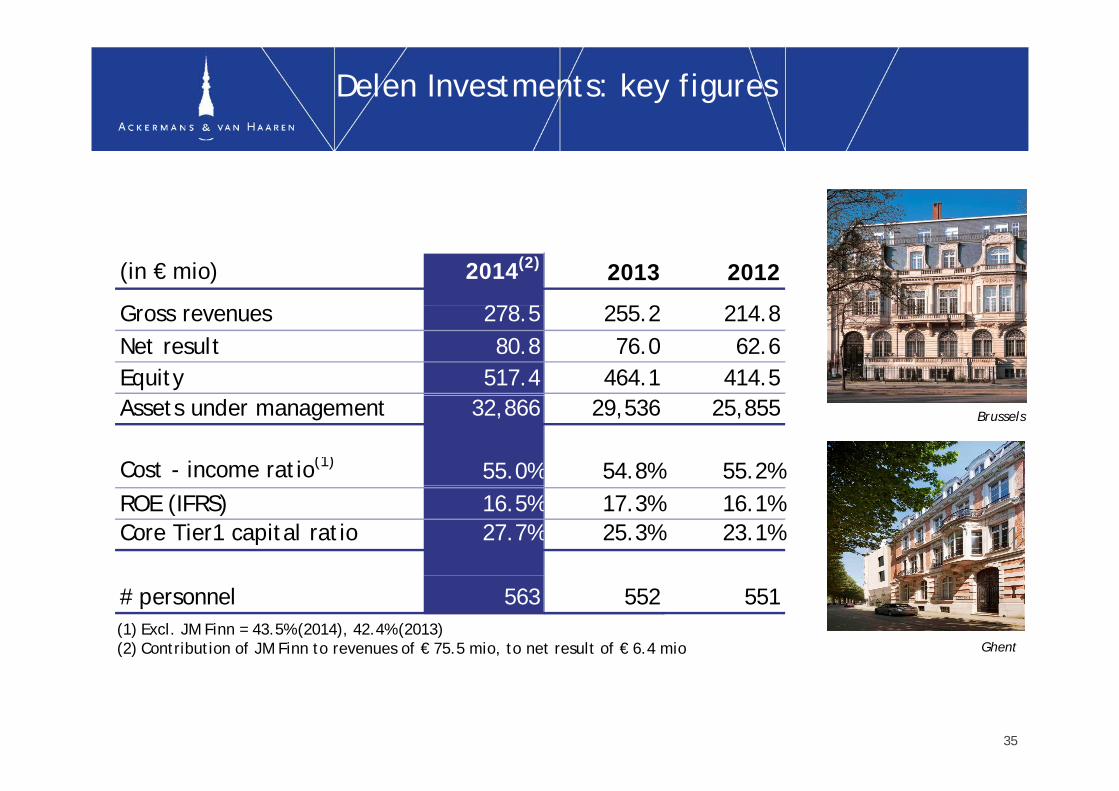
Delen Investments: key figures
(in € mio) 2014(2) 2013 2012
G 278 5 255 2 214 8Gross revenues 278.5 255.2 214.8Net result 80.8 76.0 62.6Equity 517.4 464.1 414.5Assets under management 32,866 29,536 25,855
Cost - income ratio(1) 55.0% 54.8% 55.2%
Brussels
ROE (IFRS) 16.5% 17.3% 16.1%Core Tier1 capital ratio 27.7% 25.3% 23.1%
# personnel 563 552 551(1) Excl. JM Finn = 43.5% (2014), 42.4% (2013)(2) Contribution of JM Finn to revenues of € 75.5 mio, to net result of € 6.4 mio Ghent
35
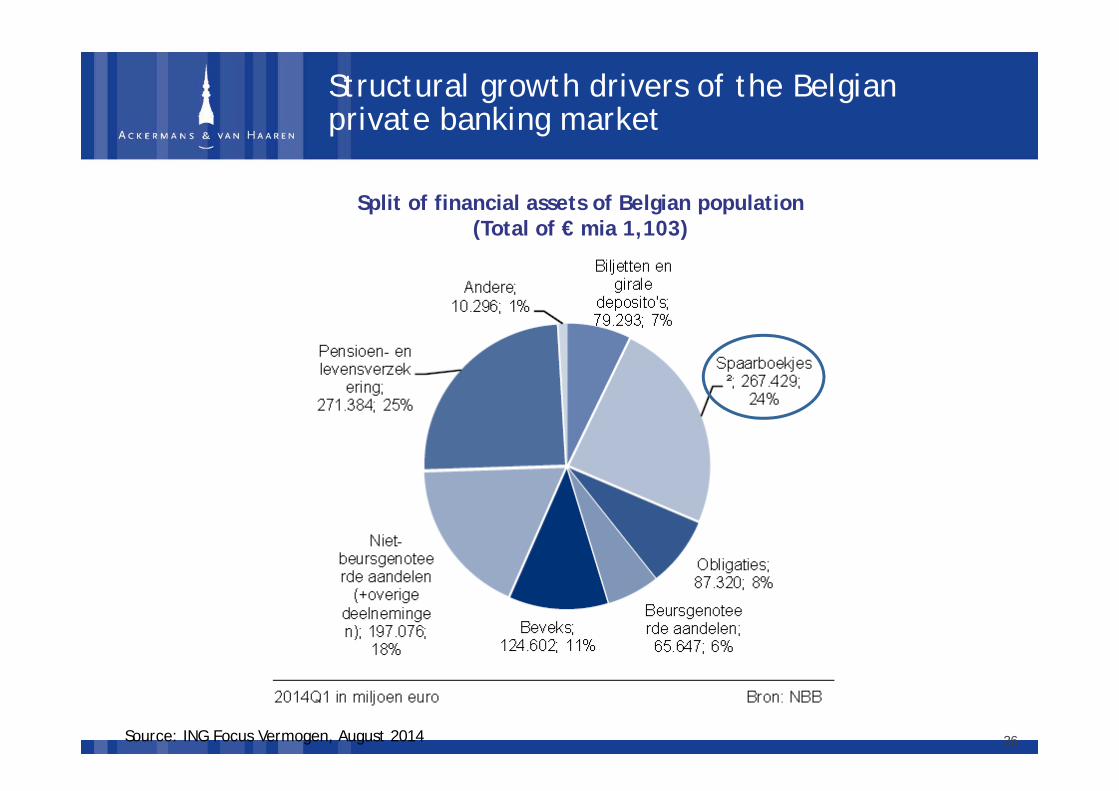
Structural growth drivers of the Belgian private banking marketprivate banking market
Split of financial assets of Belgian population (Total of € mia 1,103)
Source: ING Focus Vermogen, August 2014 36

Bank J.Van Breda & C°: client assets(AvH 78 75%)(AvH 78.75%)
Relationship bank focused on private as well as professional needs p p pfor entrepreneurs and liberal professions
Total deposits & fundsCAGR 2005-2014: 12.2%
37
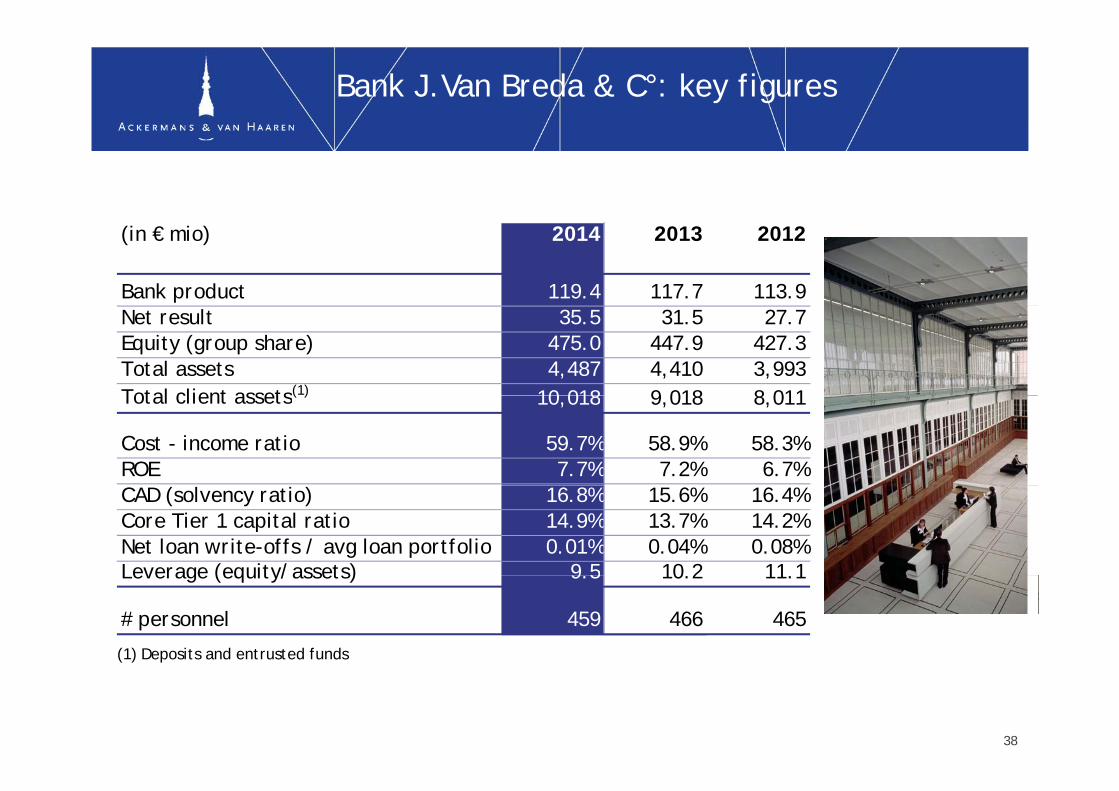
Bank J.Van Breda & C°: key figures
(in € mio) 2014 2013 2012
Bank product 119.4 117.7 113.9Net result 35.5 31.5 27.7Equity (group share) 475.0 447.9 427.3Total assets 4,487 4,410 3,993Total client assets(1) 10 018 9 018 8 011Total client assets( ) 10,018 9,018 8,011
Cost - income ratio 59.7% 58.9% 58.3%ROE 7.7% 7.2% 6.7%CAD (solvency ratio) 16.8% 15.6% 16.4%Core Tier 1 capital ratio 14.9% 13.7% 14.2%Net loan write-offs / avg loan portfolio 0.01% 0.04% 0.08%Leverage (equity/assets) 9 5 10 2 11 1Leverage (equity/assets) 9.5 10.2 11.1
# personnel 459 466 465
(1) Deposits and entrusted funds
38

Real Estate, Leisure & Senior Care: Contribution to the AvH consolidated net resultContribution to the AvH consolidated net result
(in € mio) 2014 2013 2012 2011 2010(in € mio) 2014 2013 2012 2011 2010
Leasinvest Real Estate 10.3 8.7 6.5 4.2 5.0Extensa 3.4 4.5 -5.3 -2.8 1.2Extensa 3.4 4.5 5.3 2.8 1.2Groupe Financière Duval 0.5 2.0 1.8 2.6 1.4Anima Care 0.5 0.6 0.6 0.4 0.0Cobelguard 0.1 1.0
Total 14.7 15.8 3.6 4.5 8.6
39

Real Estate, Leisure & Senior Care
LEASINVEST REAL ESTATE • Public regulated real estate comany for retail, offices and logistics in Luxembourg Belgium and Switzerland
EXTENSA • Real estate and land development in Belgium and Luxembourg
and logistics in Luxembourg, Belgium and Switzerland
FINANCIERE DUVAL • Real estate group with activities in real estate promotion, tourism (Odalys: 118,000 beds, 350 sites) and golf (NGF: 47 golf sites of which 20 in Paris)
• 2014 negatively impacted by lower real estate activities • 2014 negatively impacted by lower real estate activities and impact of VAT increase on tourism; Disposal of parking activities Park’A
• 2015: Sale of Residalya to AvH. AvH will swap first part 2015: Sale of Residalya to AvH. AvH will swap first part (20.57%) of stake in Fin. Duval with stake of 37.2% in Patrimoine & Santé (RE assets of Residalya)
ANIMA CARE • Health & senior care sector in Belgiumg• 2014: Increase of turnover driven by portfolio
expansion, start up costs linked to opening of new buildings
• Total portfolio of more than 1,300 beds and service flats (965 beds and 120 service flats in operation)
40RESIDALYA • Senior care sector in France

Leasinvest Real Estate(AvH 30%)(AvH 30%)
Public regulated real estate company for retail, offices and logistics in Luxembourg Belgium and Switzerlandin Luxembourg, Belgium and Switzerland
Hornbach (Luxembourg) Knauf Pommerloch (Luxembourg)Avenue Monterey (Luxembourg)
41
Yverdon-les-Bains (Switzerland) Pré Neuf Villeneuve (Switzerland) Littoral Park Etoy (Switzerland)

Leasinvest Real Estate: key figures
Real estate portfolio
(in € mio) 2014 2013 2012Operational result 38.6 34.2 29.0Net result 32 6 26 9 20 5
Retail
Offices
Logistics/semi-industral
portfolio
Net result 32.6 26.9 20.5Net equity 336.4 335.3 256.0
Portfolio real estate (fair value) 756.3 718.2 617.8 45%
20%
g
o t ol o eal estate ( a value) 56.3 8. 6 .8Rental yield (%) 7.23 7.31 7.30Occupancy rate (%) 96.2 96.9 94.9Net debt ratio (%)(1) 54.3 53.5 56.2
35%
( )
Per share (€) Net asset value 68.10 67.90 63.80
5%
Luxembourg Belgium
Switzerland
(1) Total net debt: € 406 mio (2013), € 407 mio (1H14)
Stock price - closing 91.61 73.60 67.10 High/Low 93.90/73.10 82.45/65.10 69.58/61.50
Dividend 4.55 4.50 4.40
59%36%
42

Extensa Group(AvH 100%)(AvH 100%)
Real estate developer with focus on residential and mixed projects in Belgium and LuxembourgBelgium and Luxembourg
Tour&Taxis (Brussel) Brussels Environment (Tour&Taxis) De Meander (Tour&Taxis) (artist impression)
43
Cloche d’Or (Luxembourg) (artist impression) Cloche d’Or (Luxembourg) (artist impression) Trnava (Slowakia)

Anima Care(AvH 100%)(AvH 100%)
Anima Care focuses on high quality senior care residences in Belgium ( l it ti d l t t )(exploitation and real estate)
(in € mio) 2014 2013 2012 2011 2010Turnover 37 9 27 4 20 5 15 4 8 8 Azur Soins et SantéTurnover 37.9 27.4 20.5 15.4 8.8EBITDA 5.4 3.4 2.4 2.1 1.2Net result 0.5 0.6 0.6 0.4 0.0
Shareholder's equity 35.7 32.4 21.2 12.0 9.9Net financial position -60.2 -40.8 -15.2 -13.7 -8.4
Zonnesteen (Zemst)
Highlights 2014• Increase of turnover driven by portfolio expansion with new built residences: Zemst (93
beds, 24 service flats) and Haut-Ittre (127 beds, 36 service flats)
Zonnesteen (Zemst)
beds, 24 service flats) and Haut Ittre (127 beds, 36 service flats) • Net result impacted by startup losses from opening of new residences• Total portfolio of more than 1,300 beds and service flats (of which 965 beds and 120
service flats in operation), spread over 10 senior care residencesA ij id i K l (143 b d 63 i fl 25 l i d • Aquamarijn residence in Kasterlee (143 beds, 63 service flats, 25 places in day care centre) opening spring 2015
44
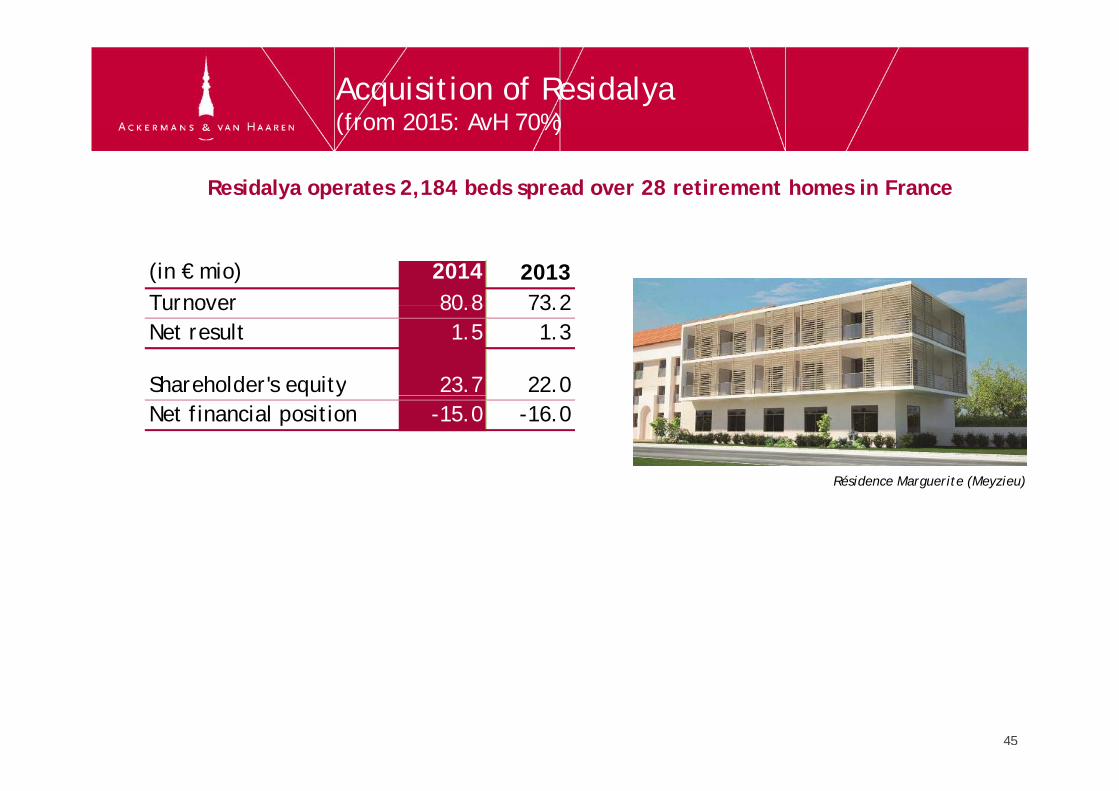
Acquisition of Residalya(from 2015: AvH 70%)(from 2015: AvH 70%)
Residalya operates 2,184 beds spread over 28 retirement homes in France
(in € mio) 2014 2013Turnover 80 8 73 2Turnover 80.8 73.2Net result 1.5 1.3
Shareholder's equity 23.7 22.0q yNet financial position -15.0 -16.0
Résidence Marguerite (Meyzieu)Résidence Marguerite (Meyzieu)
4545

From real estate leasing over real estate development to real estate servicesdevelopment to real estate services
Extensa
it140
160 (€ mio)
equity
100
120
140
40
60
80
‐
20
40
AvH 100% Acquisition -Creation of LRE AvH 60% AvH 100% Extensa(real estate development)
(investment trust)-Acquisition Brixton(real estate management)
AvH 60%(equipment & real estate leasing)
Diversification into ‘Real estate services’:
Groupe Duval (41%) France (real estate exploitation & services)
Anima Care (100%)Senior care facilities & services
46
Residalya (70%)Senior care in France
46

Energy & Resources: Contribution to the AvH consolidated net resultContribution to the AvH consolidated net result
(in € mio) 2014 2013 2012 2011 2010(in € mio) 2014 2013 2012 2011 2010
Sipef 11.4 11.2 14.1 16.9 14.3Sagar Cements 6.0 -0.4 0.3 1.3 0.0Sagar Cements 6.0 0.4 0.3 1.3 0.0Telemond 1.8 3.0 1.0 -0.1 0.9Other 0.3 -5.1 1.0 0.9 1.3
Total 19.5 8.7 16.4 19.0 16.5
47
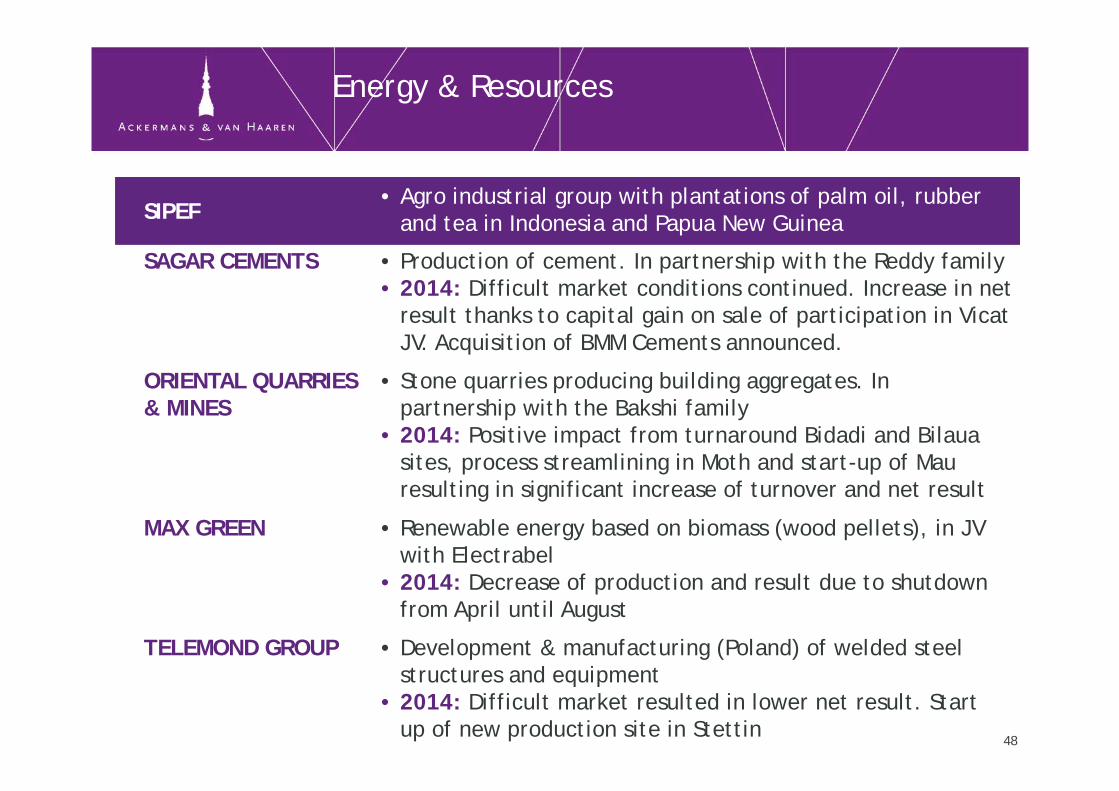
Energy & Resources
SIPEF• Agro industrial group with plantations of palm oil, rubber
d t i I d i d P N G i SIPEF and tea in Indonesia and Papua New Guinea
• Production of cement. In partnership with the Reddy family• 2014: Difficult market conditions continued. Increase in net
SAGAR CEMENTS
result thanks to capital gain on sale of participation in Vicat JV. Acquisition of BMM Cements announced.
ORIENTAL QUARRIES • Stone quarries producing building aggregates. In & MINES partnership with the Bakshi family
• 2014: Positive impact from turnaround Bidadi and Bilaua sites, process streamlining in Moth and start-up of Mau resulting in significant increase of turnover and net resultresulting in significant increase of turnover and net result
MAX GREEN • Renewable energy based on biomass (wood pellets), in JV with Electrabel2014 D f d ti d lt d t h td • 2014: Decrease of production and result due to shutdown from April until August
• Development & manufacturing (Poland) of welded steel TELEMOND GROUPstructures and equipment
• 2014: Difficult market resulted in lower net result. Start up of new production site in Stettin
48
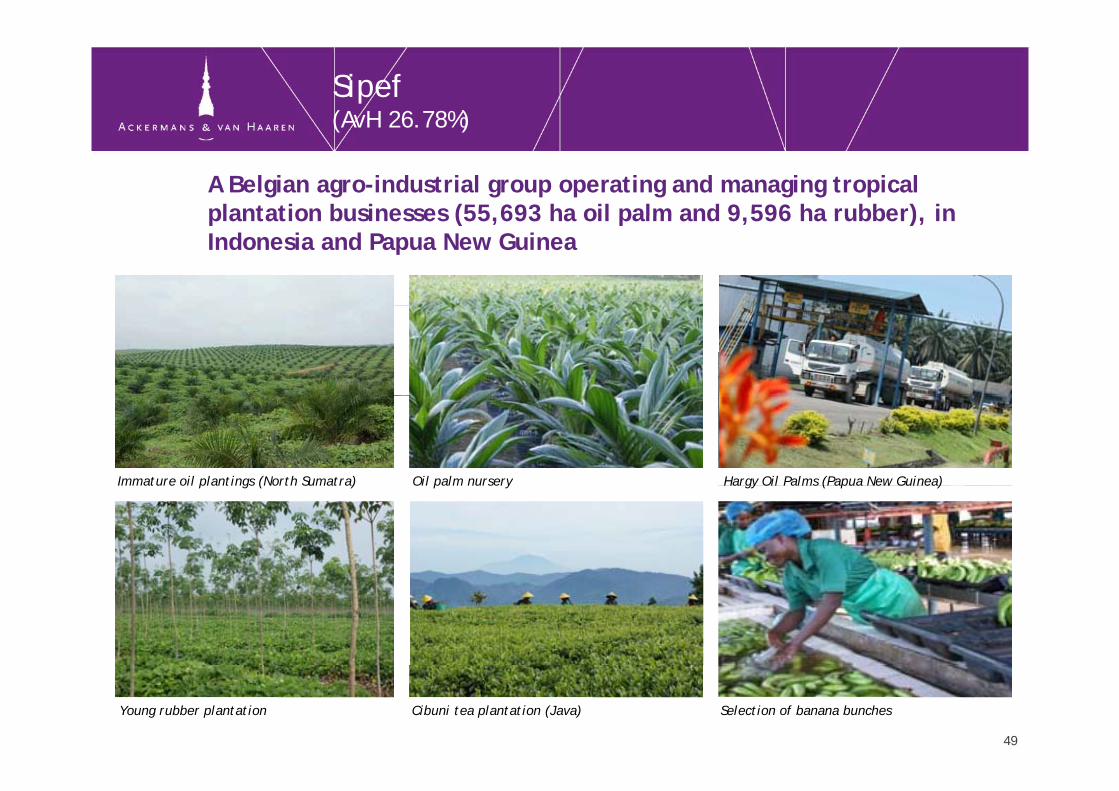
Sipef(AvH 26.78%)(AvH 26.78%)
A Belgian agro-industrial group operating and managing tropical plantation businesses (55 693 ha oil palm and 9 596 ha rubber) in plantation businesses (55,693 ha oil palm and 9,596 ha rubber), in Indonesia and Papua New Guinea
Immature oil plantings (North Sumatra) Oil palm nursery Hargy Oil Palms (Papua New Guinea)Immature oil plantings (North Sumatra) Oil palm nursery Hargy Oil Palms (Papua New Guinea)
49
Selection of banana bunchesYoung rubber plantation Cibuni tea plantation (Java)
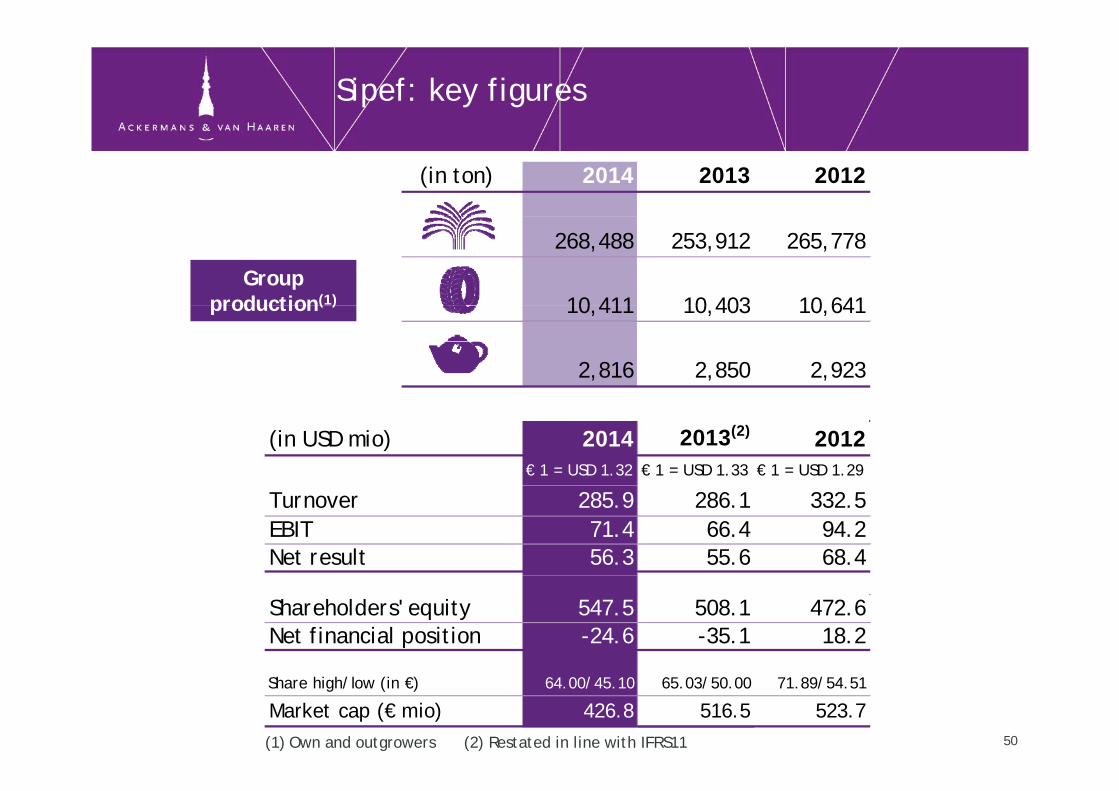
Sipef: key figures
(in ton) 2014 2013 2012
268,488 253,912 265,778
10 411 10 403 10 641Group
production(1) 10,411 10,403 10,641
2,816 2,850 2,923
production( )
(in USD mio) 2014 2013(2) 2012€ 1 = USD 1.32 € 1 = USD 1.33 € 1 = USD 1.29
Turnover 285.9 286.1 332.5EBIT 71.4 66.4 94.2Net result 56.3 55.6 68.4
Shareholders' equity 547.5 508.1 472.6Net financial position -24.6 -35.1 18.2
(1) Own and outgrowers
Share high/low (in €) 64.00/45.10 65.03/50.00 71.89/54.51
Market cap (€ mio) 426.8 516.5 523.750(2) Restated in line with IFRS11
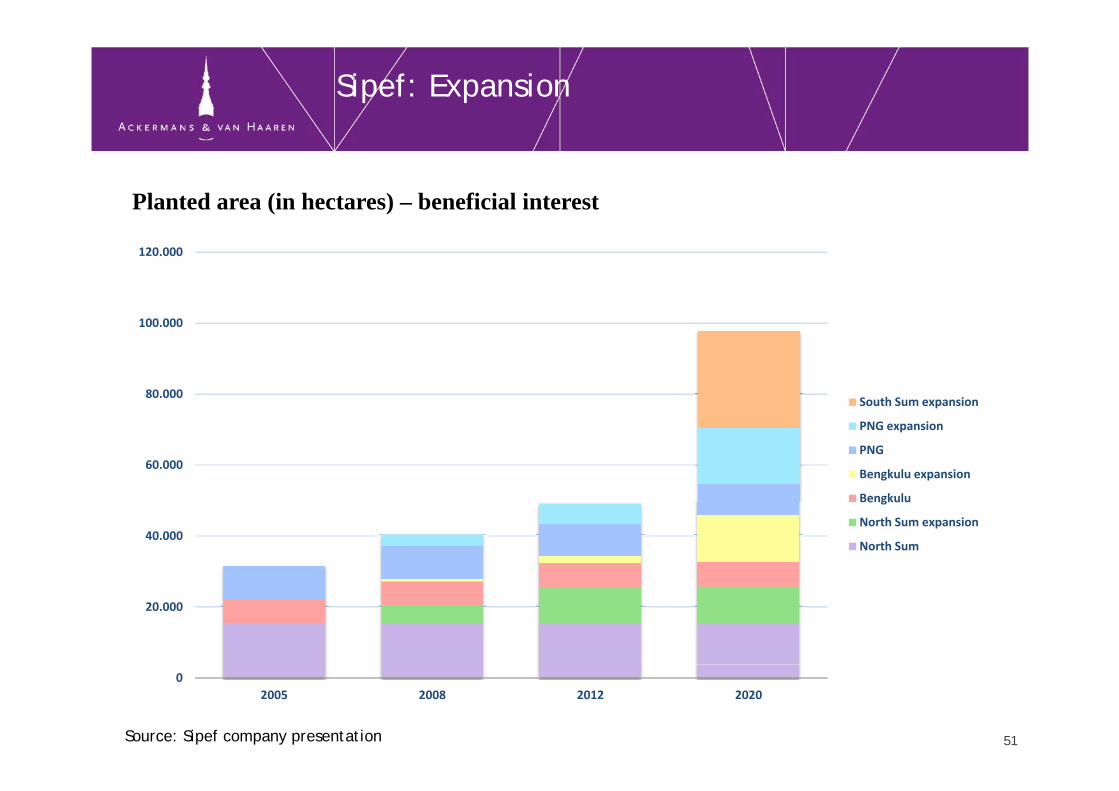
Sipef: Expansion
Planted area (in hectares) – beneficial interest
120.000
80 000
100.000
60.000
80.000South Sum expansion
PNG expansion
PNG
Bengkulu expansion
40.000
Bengkulu
North Sum expansion
North Sum
20.000
02005 2008 2012 2020
Source: Sipef company presentation 51

5252

Development Capital: Contribution to the AvH consolidated net resultContribution to the AvH consolidated net result
(in € mio) 2014 2013 2012 2011 2010
Sofinim -2.9 -2.8 -1.3 -0.8 -0.5Contribution participations Sofinim 3.0 -6.3 4.3 6.3 10.6C ib i i i i GIB 6 8 2 5 2 9 3 1 3 2Contribution participations GIB -6.8 2.5 2.9 3.1 3.2
Development capital -6.7 -6.6 5.9 8.6 13.3
Capital gains/ impairments -15.4 29.5 22.7 -0.9 -0.3
Total (including capital gains) -22.1 22.9 28.6 7.7 13.0
53

Development Capital
Atenor: Brasseries de Neudorf (Luxembourg) Egemin: Handling Automation Corelio: Mediahuis
HertelDistriplus: Planet Parfum (Antwerp) Euro Media Group
54Turbo’s Hoet Groep Manuchar Trasys

Development Capital: adjusted net asset valueasset value
(in € mio) 2014 2013 2012 2011 2010
Sofinim 492.1 493.2 466.4 437.3 437.1
Unrealised capital gain Atenor 10.8 8.2 6.2 1.5 7.3p gShare price Atenor (in €) 40.00 34.25 32.05 24.21 33.54
Market value Groupe Flo / Trasys 5.8 10.0 8.4 12.9 24.0Sh i G Fl (i €) 2 50 3 00 3 00 3 56 4 89Share price Groupe Flo (in €) 2.50 3.00 3.00 3.56 4.89
Total Development Capital 508.7 511.4 481.0 451.7 468.5
55
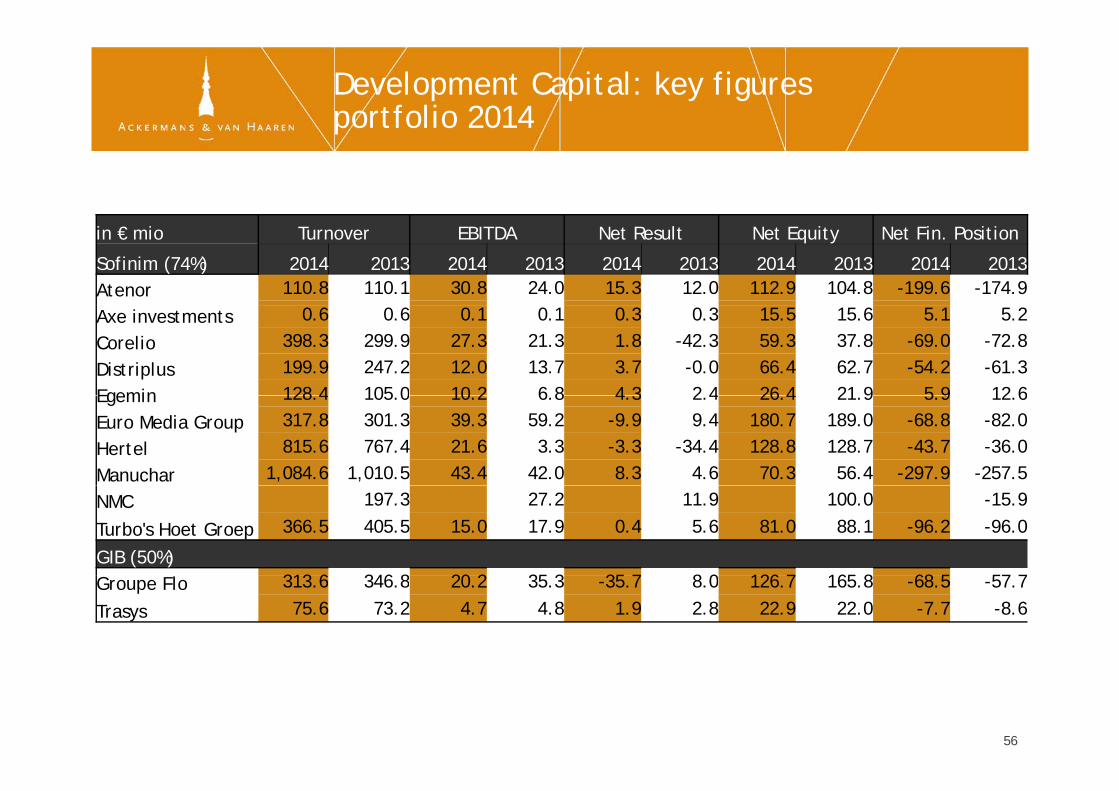
Development Capital: key figures portfolio 2014portfolio 2014
in € mio Turnover EBITDA Net Result Net Equity Net Fin. Position
Sofinim (74%) 2014 2013 2014 2013 2014 2013 2014 2013 2014 2013Atenor 110.8 110.1 30.8 24.0 15.3 12.0 112.9 104.8 -199.6 -174.9
Axe investments 0.6 0.6 0.1 0.1 0.3 0.3 15.5 15.6 5.1 5.2
Corelio 398.3 299.9 27.3 21.3 1.8 -42.3 59.3 37.8 -69.0 -72.8
Distriplus 199.9 247.2 12.0 13.7 3.7 -0.0 66.4 62.7 -54.2 -61.3
Egemin 128 4 105 0 10 2 6 8 4 3 2 4 26 4 21 9 5 9 12 6Egemin 128.4 105.0 10.2 6.8 4.3 2.4 26.4 21.9 5.9 12.6
Euro Media Group 317.8 301.3 39.3 59.2 -9.9 9.4 180.7 189.0 -68.8 -82.0
Hertel 815.6 767.4 21.6 3.3 -3.3 -34.4 128.8 128.7 -43.7 -36.0
Manuchar 1,084.6 1,010.5 43.4 42.0 8.3 4.6 70.3 56.4 -297.9 -257.5
NMC 197.3 27.2 11.9 100.0 -15.9
Turbo's Hoet Groep 366.5 405.5 15.0 17.9 0.4 5.6 81.0 88.1 -96.2 -96.0
GIB (50%)313 6 346 8 20 2 35 3 35 7 8 0 126 7 165 8 68 5 57 7Groupe Flo 313.6 346.8 20.2 35.3 -35.7 8.0 126.7 165.8 -68.5 -57.7
Trasys 75.6 73.2 4.7 4.8 1.9 2.8 22.9 22.0 -7.7 -8.6
56
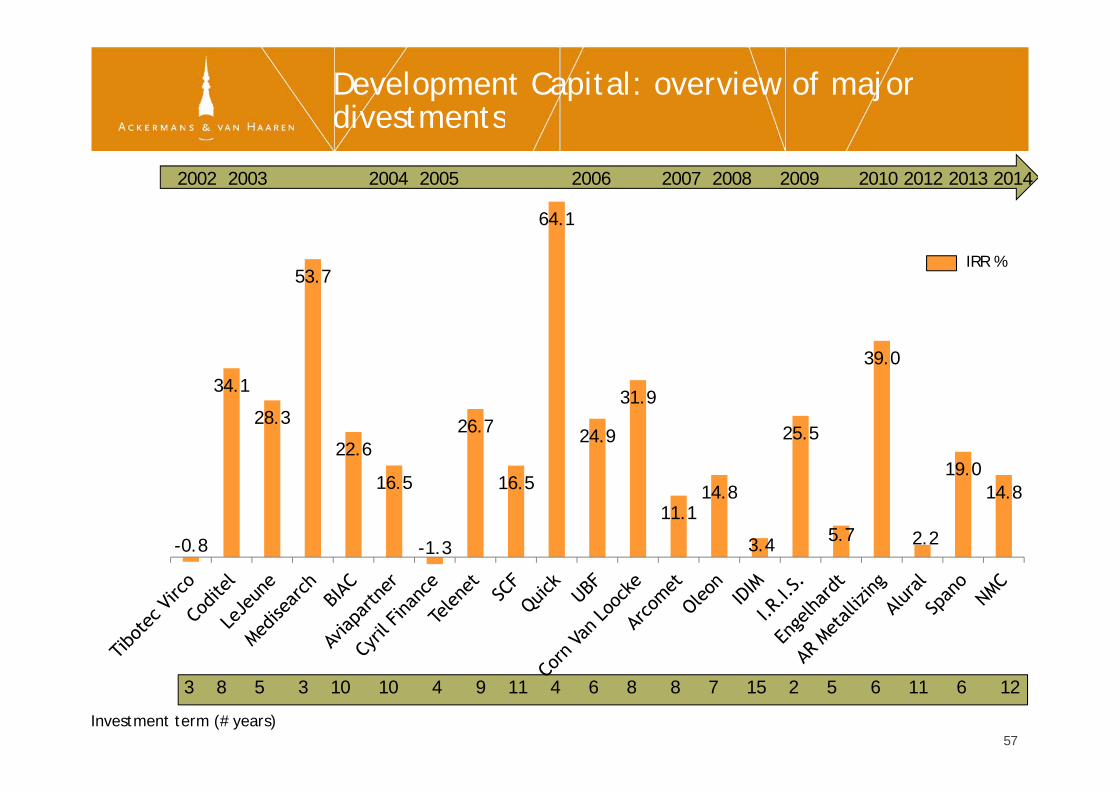
Development Capital: overview of major divestmentsdivestments
64 1
2002 2003 2004 2005 2006 2007 2008 2009 2010 2012 2013 2014
53.7
64.1
IRR %
34.131 9
39.0
28.3
22.6
16 5
26.7
16 5
24.9
31.9
14 8
25.5
19.014 8
-0.8
16.5
-1.3
16.5
11.114.8
3.4 5.7 2.2
14.8
3 8 5 3 10 10 4 9 11 4 6 8 8 7 15 2 5 6 11 6 12
Investment term (# years)57
Outlook 2015
‘AvH made a positive start to 2015 with some AvH made a positive start to 2015 with some significant transactions such as the acquisition of 100% of the Tour&Taxis site the restructuring of 100% of the Tour&Taxis site, the restructuring of the shareholding of Holding Groupe Duval, where the acquisition of Residalya has given AvHwhere the acquisition of Residalya has given AvHaccess to the French retirement home market, and above all the 1 6 billion euros worth of new and above all the 1.6 billion euros worth of new orders won by DEME.
The board of directors is confident for the year 2015 ’ 2015.
58
For further questions or additional information, please consult our website: www.avh.be
Contact:Luc BertrandCh i f th E ti C ittChairman of the Executive Committee
Jan SuykensMember of the Executive Committee
Tom BamelisMember of the Executive Committee
T +32 3 231 87 79E [email protected]
59