30 september 2015 swiss life investment foundation bonds
TRANSCRIPT

Indexed performance and performances
Monthly performance
Performance 1M 3M 1Y 3Y 5Y 10Y p.a. since p.a. p.a. p.a. 30.09.01 Investment Group (in %) -0.13 1.04 4.63 2.67 3.32 3.21 3.68 Benchmark (in %) -0.05 1.08 4.97 2.61 3.19 3.20 3.76 YTD 2014 2013 2012 2011 2010 2009 Investment Group (in %) 2.11 8.25 -2.35 3.20 6.51 3.53 5.68 Benchmark (in %) 2.32 8.20 -2.64 2.65 6.90 3.64 4.69
Investment Group Benchmark
30 September 2015
Swiss Life Investment Foundation Bonds CHF Domestic
Investment strategy
Investments in CHF bonds from borro-wers domiciled in Switzerland
Active securities selection, duration management and yield curve positioning
Debtor limitation: 10% (exception: mortgage bond institutions 25%, no federal limit)
Average rating: at least A+ Implementation via investment in Swiss
Life iFunds (CH) Bond Swiss Francs Domestic (CHF)
Investment Group Benchmark
Product information
Swiss security number 1239071 ISIN CH0012390719 LEI 549300MHXLKUXBO8KC66 Bloomberg Ticker SWAOBIN SW Benchmark SBI Domestic AAA - BBB TR Currency CHF Launch date 30.09.2001 Initial subscription price 100.00 End of financial year 30.09. Issuing/Redemption daily Deadline 14.30 Asset Manager according to Best Select Invest Plus® * Swiss Life Asset Management Ltd Monitoring of asset managers PPCmetrics supports the ongoing monitoring of asset managers and the evaluation of the investment results Price listings Bloomberg: ASSL www.swisslife.ch/anlagestiftung Total expense ratio TERKGAST ** - ex ante 0.27% - ex post as at 30.09.2015 0.27% Issuing/Redemption commission none Distribution policy Profit retention * The selection of managers who Swiss Life Asset
Management Ltd permanently monitors and supports through the process in accordance with objective criteria and best institutional practice
** The total expense ratio TERKGAST includes all costs with the exception of transaction costs and trans-action-related taxes
Statistical information (annualised)
since 1Y 3Y 5Y 10Y 30.09.01 Volatility Investment Group (in %) 3.32 2.99 2.72 2.90 2.89 Volatility Benchmark (in %) 3.21 3.00 2.82 3.05 3.01 Tracking Error ex post (in %) 0.28 0.30 0.33 0.52 0.48 Tracking Error ex ante (in %) 0.30 Information Ratio -1.19 0.19 0.41 0.01 -0.17 Sharpe Ratio 1.53 0.94 1.22 0.84 1.00 Correlation 1.00 1.00 0.99 0.99 0.99 Beta 1.03 0.99 0.96 0.94 0.95 Jensen-Alpha -0.49 0.08 0.26 0.15 0.07 Maximum Drawdown (in %) -3.48 -3.68 -3.68 -4.60 -5.22 Recovery Period (years) n.a. 0.62 0.62 1.06 1.09
Key figures
31.12.2014 30.09.2015 Assets in CHF (m) 338.9 336.9 Net asset value per entitlement in CHF 162.35 165.77
Maturity structure
0 – 3 years
3 – 5 years
5 – 7 years
7-10 years
> 10 years
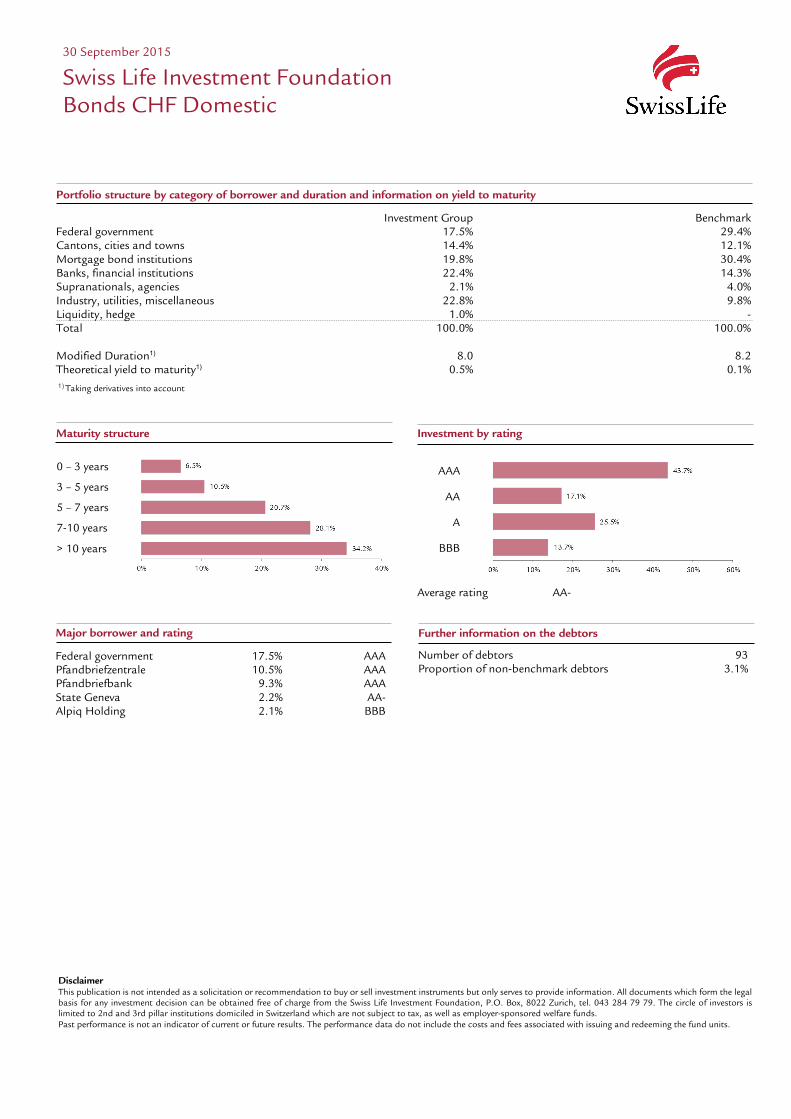
Portfolio structure by category of borrower and duration and information on yield to maturity
Investment Group Benchmark Federal government 17.5% 29.4% Cantons, cities and towns 14.4% 12.1% Mortgage bond institutions 19.8% 30.4% Banks, financial institutions 22.4% 14.3% Supranationals, agencies 2.1% 4.0% Industry, utilities, miscellaneous 22.8% 9.8% Liquidity, hedge 1.0% - Total 100.0% 100.0% Modified Duration1) 8.0 8.2 Theoretical yield to maturity1) 0.5% 0.1% 1) Taking derivatives into account
Disclaimer This publication is not intended as a solicitation or recommendation to buy or sell investment instruments but only serves to provide information. All documents which form the legal basis for any investment decision can be obtained free of charge from the Swiss Life Investment Foundation, P.O. Box, 8022 Zurich, tel. 043 284 79 79. The circle of investors is limited to 2nd and 3rd pillar institutions domiciled in Switzerland which are not subject to tax, as well as employer-sponsored welfare funds. Past performance is not an indicator of current or future results. The performance data do not include the costs and fees associated with issuing and redeeming the fund units.
Major borrower and rating
Federal government 17.5% AAA Pfandbriefzentrale 10.5% AAA Pfandbriefbank 9.3% AAA State Geneva 2.2% AA- Alpiq Holding 2.1% BBB
30 September 2015
Swiss Life Investment Foundation Bonds CHF Domestic
Investment by rating
AAA
AA
A
BBB
Average rating AA-
Further information on the debtors
Number of debtors 93 Proportion of non-benchmark debtors 3.1%
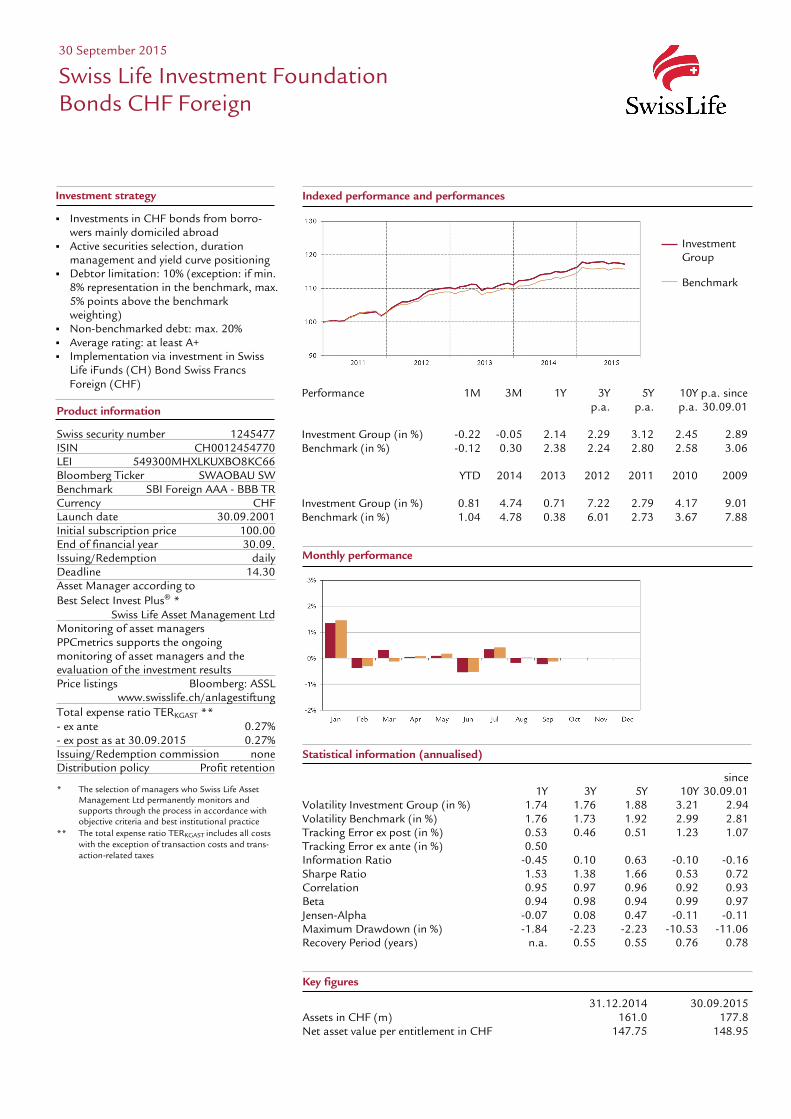
Indexed performance and performances
Performance 1M 3M 1Y 3Y 5Y 10Y p.a. since p.a. p.a. p.a. 30.09.01 Investment Group (in %) -0.22 -0.05 2.14 2.29 3.12 2.45 2.89 Benchmark (in %) -0.12 0.30 2.38 2.24 2.80 2.58 3.06 YTD 2014 2013 2012 2011 2010 2009 Investment Group (in %) 0.81 4.74 0.71 7.22 2.79 4.17 9.01 Benchmark (in %) 1.04 4.78 0.38 6.01 2.73 3.67 7.88
30 September 2015
Swiss Life Investment Foundation Bonds CHF Foreign
Investment strategy
Investments in CHF bonds from borro-wers mainly domiciled abroad
Active securities selection, duration management and yield curve positioning
Debtor limitation: 10% (exception: if min. 8% representation in the benchmark, max. 5% points above the benchmark weighting)
Non-benchmarked debt: max. 20% Average rating: at least A+ Implementation via investment in Swiss
Life iFunds (CH) Bond Swiss Francs Foreign (CHF)
Investment Group Benchmark
Investment Group Benchmark
Monthly performance
Product information
Swiss security number 1245477 ISIN CH0012454770 LEI 549300MHXLKUXBO8KC66 Bloomberg Ticker SWAOBAU SW Benchmark SBI Foreign AAA - BBB TR Currency CHF Launch date 30.09.2001 Initial subscription price 100.00 End of financial year 30.09. Issuing/Redemption daily Deadline 14.30 Asset Manager according to Best Select Invest Plus® * Swiss Life Asset Management Ltd Monitoring of asset managers PPCmetrics supports the ongoing monitoring of asset managers and the evaluation of the investment results Price listings Bloomberg: ASSL www.swisslife.ch/anlagestiftung Total expense ratio TERKGAST ** - ex ante 0.27% - ex post as at 30.09.2015 0.27% Issuing/Redemption commission none Distribution policy Profit retention * The selection of managers who Swiss Life Asset
Management Ltd permanently monitors and supports through the process in accordance with objective criteria and best institutional practice
** The total expense ratio TERKGAST includes all costs with the exception of transaction costs and trans-action-related taxes
Statistical information (annualised)
since 1Y 3Y 5Y 10Y 30.09.01 Volatility Investment Group (in %) 1.74 1.76 1.88 3.21 2.94 Volatility Benchmark (in %) 1.76 1.73 1.92 2.99 2.81 Tracking Error ex post (in %) 0.53 0.46 0.51 1.23 1.07 Tracking Error ex ante (in %) 0.50 Information Ratio -0.45 0.10 0.63 -0.10 -0.16 Sharpe Ratio 1.53 1.38 1.66 0.53 0.72 Correlation 0.95 0.97 0.96 0.92 0.93 Beta 0.94 0.98 0.94 0.99 0.97 Jensen-Alpha -0.07 0.08 0.47 -0.11 -0.11 Maximum Drawdown (in %) -1.84 -2.23 -2.23 -10.53 -11.06 Recovery Period (years) n.a. 0.55 0.55 0.76 0.78
Key figures
31.12.2014 30.09.2015 Assets in CHF (m) 161.0 177.8 Net asset value per entitlement in CHF 147.75 148.95
Maturity structure
0 – 3 years
3 – 5 years
5 – 7 years
7-10 years
> 10 years
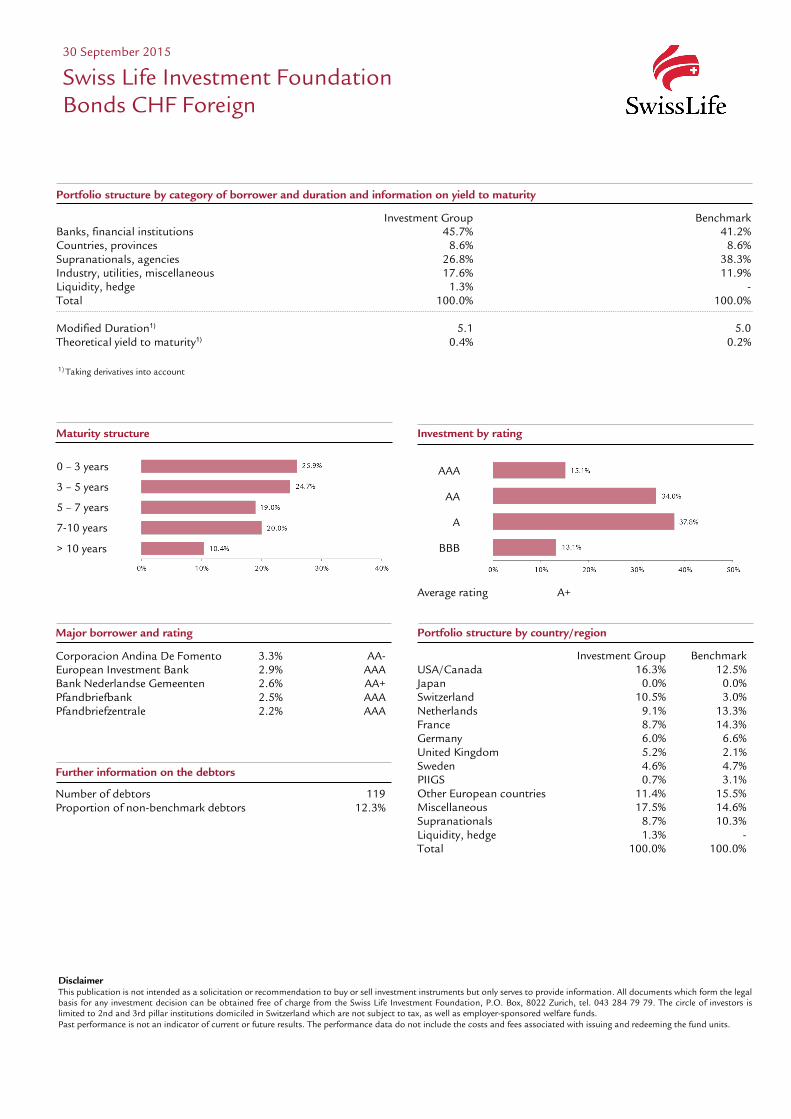
Portfolio structure by country/region
Investment Group Benchmark USA/Canada 16.3% 12.5% Japan 0.0% 0.0% Switzerland 10.5% 3.0% Netherlands 9.1% 13.3% France 8.7% 14.3% Germany 6.0% 6.6% United Kingdom 5.2% 2.1% Sweden 4.6% 4.7% PIIGS 0.7% 3.1% Other European countries 11.4% 15.5% Miscellaneous 17.5% 14.6% Supranationals 8.7% 10.3% Liquidity, hedge 1.3% - Total 100.0% 100.0%
Portfolio structure by category of borrower and duration and information on yield to maturity
Investment Group Benchmark Banks, financial institutions 45.7% 41.2% Countries, provinces 8.6% 8.6% Supranationals, agencies 26.8% 38.3% Industry, utilities, miscellaneous 17.6% 11.9% Liquidity, hedge 1.3% - Total 100.0% 100.0% Modified Duration1) 5.1 5.0 Theoretical yield to maturity1) 0.4% 0.2%
1) Taking derivatives into account
Disclaimer This publication is not intended as a solicitation or recommendation to buy or sell investment instruments but only serves to provide information. All documents which form the legal basis for any investment decision can be obtained free of charge from the Swiss Life Investment Foundation, P.O. Box, 8022 Zurich, tel. 043 284 79 79. The circle of investors is limited to 2nd and 3rd pillar institutions domiciled in Switzerland which are not subject to tax, as well as employer-sponsored welfare funds. Past performance is not an indicator of current or future results. The performance data do not include the costs and fees associated with issuing and redeeming the fund units.
Major borrower and rating
Corporacion Andina De Fomento 3.3% AA- European Investment Bank 2.9% AAA Bank Nederlandse Gemeenten 2.6% AA+ Pfandbriefbank 2.5% AAA Pfandbriefzentrale 2.2% AAA
30 September 2015
Swiss Life Investment Foundation Bonds CHF Foreign
Investment by rating
AAA
AA
A
BBB
Average rating A+
Further information on the debtors
Number of debtors 119 Proportion of non-benchmark debtors 12.3%

Indexed performance and performances
Performance 1M 3M 1Y 3Y 5Y 10Y p.a. since p.a. p.a. p.a. 30.09.01 Investment Group (in %) -0.15 0.30 0.38 2.06 2.44 1.59 1.61 Benchmark (in %) 0.53 0.99 1.73 2.54 2.19 1.83 1.73 YTD 2014 2013 2012 2011 2010 2009 Investment Group (in %) -1.64 7.66 -0.93 8.42 5.53 -4.71 4.39 Benchmark (in %) -0.48 7.61 -0.33 6.47 4.65 -5.20 -0.41
30 September 2015
Swiss Life Investment Foundation Bonds Global (CHF hedged)
Investment strategy
Investments in foreign-currency bonds from borrowers domiciled in Switzerland or abroad (since 1.1.2011 CHF hedged)
Active bond selection, duration manage-ment and yield curve positioning
Debtor limitation: 10% (exception: if min. 8% representation in the benchmark, max. 5% points above the benchmark weighting)
Non-benchmarked debt: max. 10% Average rating: at least A Implementation via investment in Swiss
Life iFunds (CH) Bond Global Government+ (CHF hedged) and Swiss Life iFunds (CH) Bond Global Corporates (CHF hedged)
Investment Group Benchmark
Monthly performance
Investment Group Benchmark
Product information
Swiss security number 1245479 ISIN CH0012454796 LEI 549300MHXLKUXBO8KC66 Bloomberg Ticker SWAOBFG SW Benchmark * 40% Barclays Gl. Agg. Corp. 60% Barclays Gl. Agg. Treas. ex CH (Indices CHF hedged) Currency CHF Launch date 30.09.2001 Initial subscription price 100.00 End of financial year 30.09. Issuing/Redemption daily Deadline 14.30 Asset Manager according to Best Select Invest Plus® ** Swiss Life Asset Management Ltd Monitoring of asset managers PPCmetrics supports the ongoing monitoring of asset managers and the evaluation of the investment results Price listing Bloomberg: ASSL www.swisslife.ch/anlagestiftung Total expense ratio TERKGAST *** - ex ante 0.46% - ex post as at 30.09.2015 0.46% Issuing/redemption commission none Distribution policy Profit retention * To 30.06.12 60% Citigroup WGBI, ex CH (CHF
hedged) ** The selection of managers who Swiss Life Asset
Management Ltd permanently monitors and supports through the process in accordance with objective criteria and best institutional practice
*** The total expense ratio TERKGAST includes all costs with the exception of transaction costs and trans-action-related taxes
Statistical information (annualised)
since 1Y 3Y 5Y 10Y 30.09.01 Volatility Investment Group (in %) 3.54 3.28 4.40 6.32 5.99 Volatility Benchmark (in %) 3.47 2.99 4.06 6.29 6.18 Tracking Error ex post (in %) 0.78 0.81 0.96 1.82 1.76 Tracking Error ex ante (in %) 0.90 Information Ratio -1.73 -0.59 0.25 -0.13 -0.07 Sharpe Ratio 0.26 0.67 0.56 0.14 0.14 Correlation 0.98 0.97 0.98 0.96 0.96 Beta 1.00 1.07 1.06 0.96 0.93 Jensen-Alpha -1.33 -0.65 0.11 -0.19 -0.05 Maximum Drawdown (in %) -4.23 -4.96 -10.14 -14.34 -14.34 Recovery Period (years) n.a. 0.85 1.39 2.15 2.15
Key figures
31.12.2014 30.09.2015 Assets in CHF (m) 102.3 110.0 Net asset value per entitlement in CHF 127.10 125.02

Maturity structure
0 – 3 years
3 – 5 years
5 – 7 years
7-10 years
> 10 years
Portfolio structure by country/region
Investment Group Benchmark USA/Canada 38.7% 40.8% Japan 9.7% 17.5% United Kingdom 9.2% 8.5% PIIGS 5.2% 7.8% Miscellaneous 8.0% 7.1% France 3.9% 6.3% Germany 5.1% 4.7% Other European countries 7.0% 3.4% Netherlands 2.8% 2.3% Switzerland 1.8% 0.9% Sweden 1.9% 0.7% Supranationals 1.8% - Liquidity, hedge 4.9% - Total 100.0% 100.0%
Portfolio structure by category of borrower
Investment Group Benchmark Industry 27.3% 20.9% Utilities 2.0% 3.1% Banks, financial institutions 16.3% 16.0% Government, provinces, agencies 47.6% 60.0% Supranationals 1.8% 0.0% Liquidity 6.4% - Currency hedging -1.4% - Total 100.0% 100.0%
Duration and information on yield to maturity
Investment Group Benchmark Percentage Duration Percentage Duration USD 48.2% 6.2 43.3% 6.0 EUR 27.9% 6.6 25.0% 6.2 JPY 9.8% 5.0 17.0% 6.4 GBP 7.9% 8.3 7.6% 9.4 Miscellaneous 6.2% 0.6 7.1% 5.3 Total 100.0% 100.0% Modified Duration1) 6.2 6.8 Theoretical yield to maturity1) 2.2% 1.8%
1) before currency hedging, taking derivatives into account
Disclaimer This publication is not intended as a solicitation or recommendation to buy or sell investment instruments but only serves to provide information. All documents which form the legal basis for any investment decision can be obtained free of charge from the Swiss Life Investment Foundation, P.O. Box, 8022 Zurich, tel. 043 284 79 79. The circle of investors is limited to 2nd and 3rd pillar institutions domiciled in Switzerland which are not subject to tax, as well as employer-sponsored welfare funds. Past performance is not an indicator of current or future results. The performance data do not include the costs and fees associated with issuing and redeeming the fund units.
Major borrower and rating
United States Treasury Note/Bond 12.9% AA+ Japan 8.8% A+ United Kingdom 3.8% AA+ Bundesrepublik Deutschland 1.8% AAA Kingdom of Spain 1.8% BBB
30 September 2015
Swiss Life Investment Foundation Bonds Global (CHF hedged)
Investment by rating
AAA
AA
A
BBB
Average rating A
Further information on the debtors
Number of debtors 244 Proportion of non-benchmark debtors 6.5%
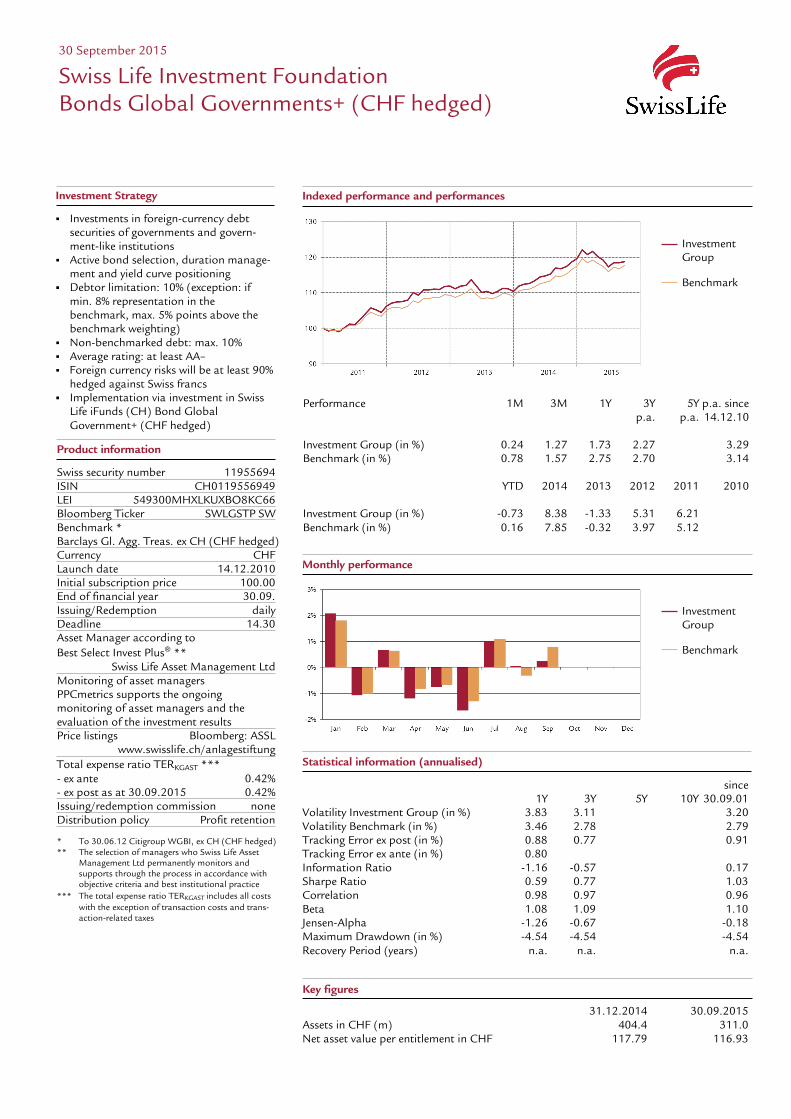
Performance 1M 3M 1Y 3Y 5Y p.a. since p.a. p.a. 14.12.10 Investment Group (in %) 0.24 1.27 1.73 2.27 3.29 Benchmark (in %) 0.78 1.57 2.75 2.70 3.14 YTD 2014 2013 2012 2011 2010 Investment Group (in %) -0.73 8.38 -1.33 5.31 6.21 Benchmark (in %) 0.16 7.85 -0.32 3.97 5.12
Indexed performance and performances
30 September 2015
Swiss Life Investment Foundation Bonds Global Governments+ (CHF hedged)
Investment Strategy
Investments in foreign-currency debt securities of governments and govern-ment-like institutions
Active bond selection, duration manage-ment and yield curve positioning
Debtor limitation: 10% (exception: if min. 8% representation in the benchmark, max. 5% points above the benchmark weighting)
Non-benchmarked debt: max. 10% Average rating: at least AA– Foreign currency risks will be at least 90%
hedged against Swiss francs Implementation via investment in Swiss
Life iFunds (CH) Bond Global Government+ (CHF hedged)
Investment Group Benchmark
Monthly performance
Investment Group Benchmark
Product information
Swiss security number 11955694 ISIN CH0119556949 LEI 549300MHXLKUXBO8KC66 Bloomberg Ticker SWLGSTP SW Benchmark * Barclays Gl. Agg. Treas. ex CH (CHF hedged) Currency CHF Launch date 14.12.2010 Initial subscription price 100.00 End of financial year 30.09. Issuing/Redemption daily Deadline 14.30 Asset Manager according to Best Select Invest Plus® ** Swiss Life Asset Management Ltd Monitoring of asset managers PPCmetrics supports the ongoing monitoring of asset managers and the evaluation of the investment results Price listings Bloomberg: ASSL www.swisslife.ch/anlagestiftung Total expense ratio TERKGAST *** - ex ante 0.42% - ex post as at 30.09.2015 0.42% Issuing/redemption commission none Distribution policy Profit retention * To 30.06.12 Citigroup WGBI, ex CH (CHF hedged) ** The selection of managers who Swiss Life Asset
Management Ltd permanently monitors and supports through the process in accordance with objective criteria and best institutional practice
*** The total expense ratio TERKGAST includes all costs with the exception of transaction costs and trans-action-related taxes
Statistical information (annualised)
since 1Y 3Y 5Y 10Y 30.09.01 Volatility Investment Group (in %) 3.83 3.11 3.20 Volatility Benchmark (in %) 3.46 2.78 2.79 Tracking Error ex post (in %) 0.88 0.77 0.91 Tracking Error ex ante (in %) 0.80 Information Ratio -1.16 -0.57 0.17 Sharpe Ratio 0.59 0.77 1.03 Correlation 0.98 0.97 0.96 Beta 1.08 1.09 1.10 Jensen-Alpha -1.26 -0.67 -0.18 Maximum Drawdown (in %) -4.54 -4.54 -4.54 Recovery Period (years) n.a. n.a. n.a.
Key figures
31.12.2014 30.09.2015 Assets in CHF (m) 404.4 311.0 Net asset value per entitlement in CHF 117.79 116.93
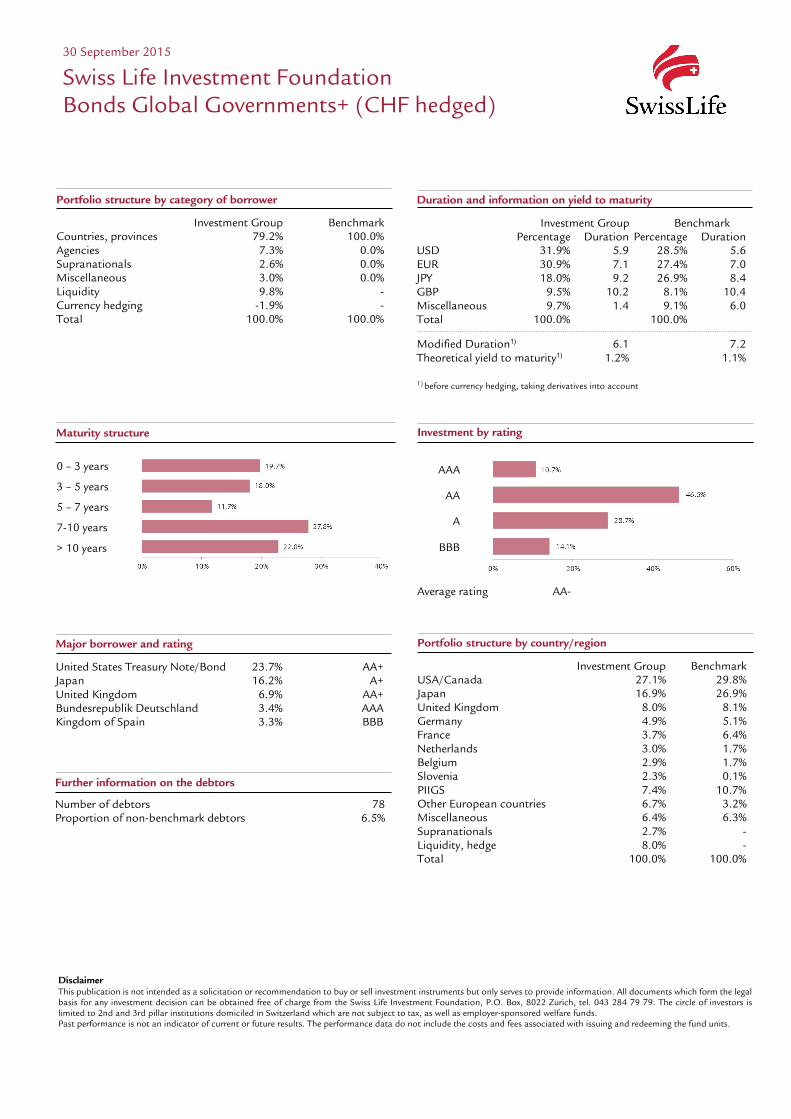
Maturity structure
0 – 3 years
3 – 5 years
5 – 7 years
7-10 years
> 10 years
Portfolio structure by country/region
Investment Group Benchmark USA/Canada 27.1% 29.8% Japan 16.9% 26.9% United Kingdom 8.0% 8.1% Germany 4.9% 5.1% France 3.7% 6.4% Netherlands 3.0% 1.7% Belgium 2.9% 1.7% Slovenia 2.3% 0.1% PIIGS 7.4% 10.7% Other European countries 6.7% 3.2% Miscellaneous 6.4% 6.3% Supranationals 2.7% - Liquidity, hedge 8.0% - Total 100.0% 100.0%
Portfolio structure by category of borrower
Investment Group Benchmark Countries, provinces 79.2% 100.0% Agencies 7.3% 0.0% Supranationals 2.6% 0.0% Miscellaneous 3.0% 0.0% Liquidity 9.8% - Currency hedging -1.9% - Total 100.0% 100.0%
Duration and information on yield to maturity
Investment Group Benchmark Percentage Duration Percentage Duration USD 31.9% 5.9 28.5% 5.6 EUR 30.9% 7.1 27.4% 7.0 JPY 18.0% 9.2 26.9% 8.4 GBP 9.5% 10.2 8.1% 10.4 Miscellaneous 9.7% 1.4 9.1% 6.0 Total 100.0% 100.0% Modified Duration1) 6.1 7.2 Theoretical yield to maturity1) 1.2% 1.1%
1) before currency hedging, taking derivatives into account
Disclaimer This publication is not intended as a solicitation or recommendation to buy or sell investment instruments but only serves to provide information. All documents which form the legal basis for any investment decision can be obtained free of charge from the Swiss Life Investment Foundation, P.O. Box, 8022 Zurich, tel. 043 284 79 79. The circle of investors is limited to 2nd and 3rd pillar institutions domiciled in Switzerland which are not subject to tax, as well as employer-sponsored welfare funds. Past performance is not an indicator of current or future results. The performance data do not include the costs and fees associated with issuing and redeeming the fund units.
Major borrower and rating
United States Treasury Note/Bond 23.7% AA+ Japan 16.2% A+ United Kingdom 6.9% AA+ Bundesrepublik Deutschland 3.4% AAA Kingdom of Spain 3.3% BBB
30 September 2015
Swiss Life Investment Foundation Bonds Global Governments+ (CHF hedged)
Investment by rating
AAA
AA
A
BBB
Average rating AA-
Further information on the debtors
Number of debtors 78 Proportion of non-benchmark debtors 6.5%
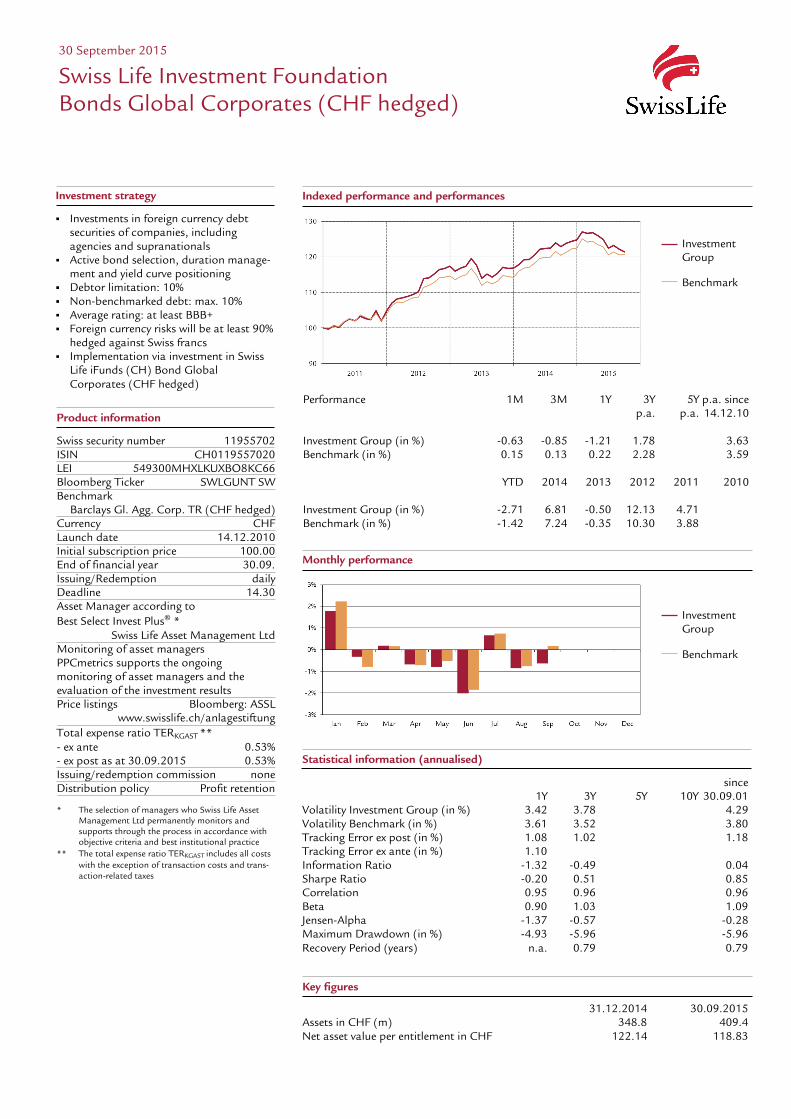
Performance 1M 3M 1Y 3Y 5Y p.a. since p.a. p.a. 14.12.10 Investment Group (in %) -0.63 -0.85 -1.21 1.78 3.63 Benchmark (in %) 0.15 0.13 0.22 2.28 3.59 YTD 2014 2013 2012 2011 2010 Investment Group (in %) -2.71 6.81 -0.50 12.13 4.71 Benchmark (in %) -1.42 7.24 -0.35 10.30 3.88
Indexed performance and performances
Monthly performance
Investment Group Benchmark
30 September 2015
Swiss Life Investment Foundation Bonds Global Corporates (CHF hedged)
Investment strategy
Investments in foreign currency debt securities of companies, including agencies and supranationals
Active bond selection, duration manage-ment and yield curve positioning
Debtor limitation: 10% Non-benchmarked debt: max. 10% Average rating: at least BBB+ Foreign currency risks will be at least 90%
hedged against Swiss francs Implementation via investment in Swiss
Life iFunds (CH) Bond Global Corporates (CHF hedged)
Investment Group Benchmark
Product information
Swiss security number 11955702 ISIN CH0119557020 LEI 549300MHXLKUXBO8KC66 Bloomberg Ticker SWLGUNT SW Benchmark Barclays Gl. Agg. Corp. TR (CHF hedged) Currency CHF Launch date 14.12.2010 Initial subscription price 100.00 End of financial year 30.09. Issuing/Redemption daily Deadline 14.30 Asset Manager according to Best Select Invest Plus® * Swiss Life Asset Management Ltd Monitoring of asset managers PPCmetrics supports the ongoing monitoring of asset managers and the evaluation of the investment results Price listings Bloomberg: ASSL www.swisslife.ch/anlagestiftung Total expense ratio TERKGAST ** - ex ante 0.53% - ex post as at 30.09.2015 0.53% Issuing/redemption commission none Distribution policy Profit retention * The selection of managers who Swiss Life Asset
Management Ltd permanently monitors and supports through the process in accordance with objective criteria and best institutional practice
** The total expense ratio TERKGAST includes all costs with the exception of transaction costs and trans-action-related taxes
Statistical information (annualised)
since 1Y 3Y 5Y 10Y 30.09.01 Volatility Investment Group (in %) 3.42 3.78 4.29 Volatility Benchmark (in %) 3.61 3.52 3.80 Tracking Error ex post (in %) 1.08 1.02 1.18 Tracking Error ex ante (in %) 1.10 Information Ratio -1.32 -0.49 0.04 Sharpe Ratio -0.20 0.51 0.85 Correlation 0.95 0.96 0.96 Beta 0.90 1.03 1.09 Jensen-Alpha -1.37 -0.57 -0.28 Maximum Drawdown (in %) -4.93 -5.96 -5.96 Recovery Period (years) n.a. 0.79 0.79
Key figures
31.12.2014 30.09.2015 Assets in CHF (m) 348.8 409.4 Net asset value per entitlement in CHF 122.14 118.83

Portfolio structure by country/region
Investment Group Benchmark USA/Canada 52.8% 57.0% Japan 0.5% 3.3% United Kingdom 10.8% 9.2% Germany 5.5% 4.3% France 4.3% 6.2% Switzerland 4.0% 2.3% Sweden 3.1% 1.3% Netherlands 2.5% 3.3% PIIGS 2.6% 3.4% Other European countries 2.2% 1.4% Miscellaneous 10.5% 8.3% Liquidity, hedge 1.2% - Total 100.0% 100.0%
Maturity structure
0 – 3 years
3 – 5 years
5 – 7 years
7-10 years
> 10 years
Portfolio structure by category of borrower
Investment Group Benchmark Industry 59.0% 52.3% Utilities 4.0% 7.8% Banks, financial institutions 33.9% 39.9% Miscellaneous 1.9% 0.0% Liquidity 2.1% - Currency hedging -0.9% - Total 100.0% 100.0%
Portfolio structure by currencies and duration
Investment Group Benchmark Percentage Duration Percentage Duration USD 67.7% 6.5 65.6% 6.5 EUR 24.5% 6.1 21.4% 4.9 JPY 0.0% 0.0 2.1% 3.4 GBP 6.1% 6.2 6.8% 7.8 Miscellaneous 1.7% 0.0 4.1% 4.6 Total 100.0% 100.0% Modified Duration1) 6.3 6.1 Theoretical yield to maturity1) 3.4% 2.9%
1) before currency hedging, taking derivatives into account
Disclaimer This publication is not intended as a solicitation or recommendation to buy or sell investment instruments but only serves to provide information. All documents which form the legal basis for any investment decision can be obtained free of charge from the Swiss Life Investment Foundation, P.O. Box, 8022 Zurich, tel. 043 284 79 79. The circle of investors is limited to 2nd and 3rd pillar institutions domiciled in Switzerland which are not subject to tax, as well as employer-sponsored welfare funds. Past performance is not an indicator of current or future results. The performance data do not include the costs and fees associated with issuing and redeeming the fund units.
Major borrower and rating
Citigroup Inc 2.1% BBB+ Bank of America Corp 1.5% BBB+ PNC Bank National Association 1.2% A Koninklijke DSM NV 1.2% A- Verizon Communications Inc 1.1% BBB+
30 September 2015
Swiss Life Investment Foundation Bonds Global Corporates (CHF hedged)
Investment by rating
AAA
AA
A
BBB
Average rating BBB+
Further information on the debtors
Number of debtors 172 Proportion of non-benchmark debtors 6.4%

Performance 1M 3M 1Y 3Y 5Y p.a. since p.a. p.a. 11.10.13 Investment Group (in %) -0.22 -0.27 -0.17 0.80 Benchmark (in %) 0.03 -0.18 0.05 0.87 YTD 2014 2013 2012 2011 2010 Investment Group (in %) -0.41 1.67 Benchmark (in %) -0.12 1.39
Indexed performance and performances
Monthly performance
Investment Group Benchmark
30 September 2015
Swiss Life Investment Foundation Bonds Global Corporates Short Term (CHF hedged)
Investment strategy
Investments in corporate (including agency and supranational) debt securities denominated in foreign currencies with a short residual maturity (generally less than three years)
Active bond selection, duration manage-ment and yield curve positioning
Debtor limitation: 10% Non-benchmarked debt: max. 10% Average rating: at least BBB+ Foreign currency risks will be at least 90%
hedged against Swiss francs Implementation via investment in Swiss
Life iFunds (CH) Bond Global Corporates Short Term (CHF hedged)
Investment Group Benchmark
Product information
Swiss security number 22073699 ISIN CH0220736992 LEI 549300MHXLKUXBO8KC66 Bloomberg Ticker SWLOGNT SW Benchmark Barclays Global Aggregate Corporate 1-3 years TR (CHF hedged) Currency CHF Launch date 11.10.2013 Initial subscription price 100.00 End of financial year 30.09. Issuing/Redemption daily Deadline 14.30 Asset Manager according to Best Select Invest Plus® * Swiss Life Asset Management Ltd Monitoring of asset managers PPCmetrics supports the ongoing monitoring of asset managers and the evaluation of the investment results Price listings Bloomberg: ASSL www.swisslife.ch/anlagestiftung Total expense ratio TERKGAST ** - ex ante 0.38% - ex post as at 30.09.2015 0.38% Issuing/redemption commission none Distribution policy Profit retention * The selection of managers who Swiss Life Asset
Management Ltd permanently monitors and supports through the process in accordance with objective criteria and best institutional practice
** The total expense ratio TERKGAST includes all costs with the exception of transaction costs and trans-action-related taxes
Statistical information (annualised)
since 1Y 3Y 5Y 10Y 30.09.01 Volatility Investment Group (in %) 0.71 0.72 Volatility Benchmark (in %) 0.63 0.58 Tracking Error ex post (in %) 0.41 0.35 Tracking Error ex ante (in %) 0.40 Information Ratio -0.52 -0.21 Sharpe Ratio 0.52 1.45 Correlation 0.82 0.88 Beta 0.91 1.09 Jensen-Alpha -0.16 -0.18 Maximum Drawdown (in %) -1.06 -1.06 Recovery Period (years) n.a. n.a.
Key figures
31.12.2014 30.09.2015 Assets in CHF (m) 252.0 403.7 Net asset value per entitlement in CHF 102.02 101.60
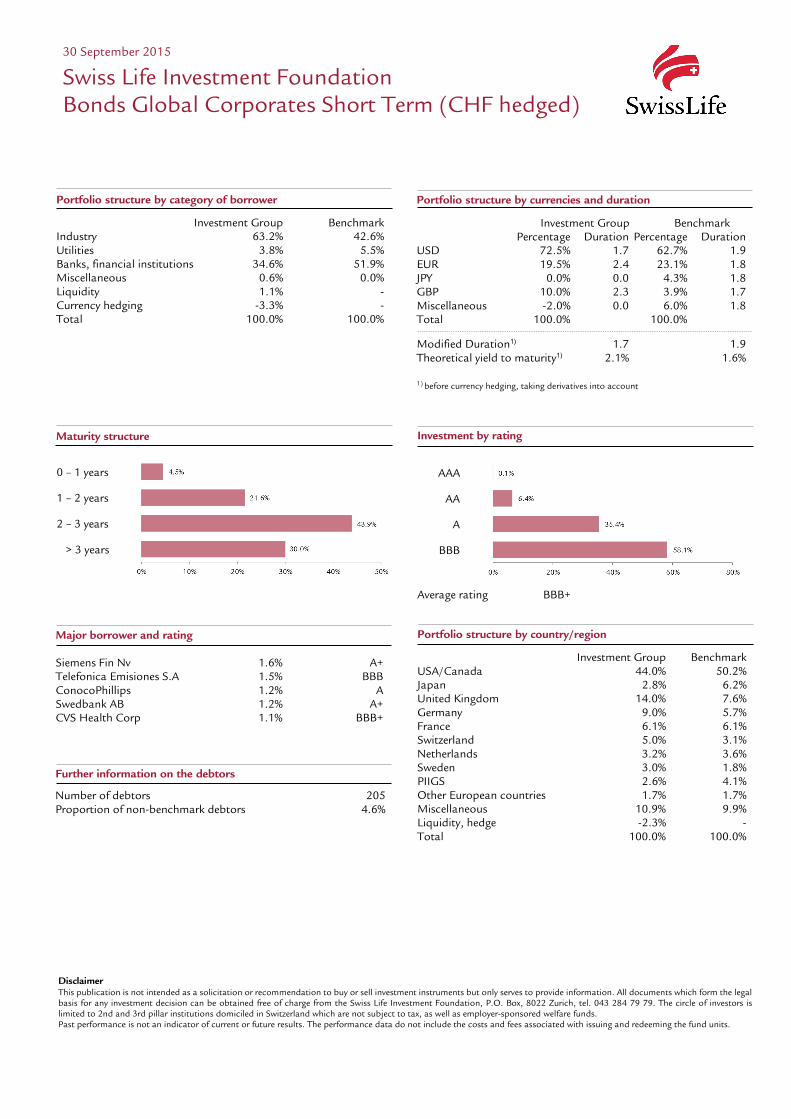
Portfolio structure by country/region
Investment Group Benchmark USA/Canada 44.0% 50.2% Japan 2.8% 6.2% United Kingdom 14.0% 7.6% Germany 9.0% 5.7% France 6.1% 6.1% Switzerland 5.0% 3.1% Netherlands 3.2% 3.6% Sweden 3.0% 1.8% PIIGS 2.6% 4.1% Other European countries 1.7% 1.7% Miscellaneous 10.9% 9.9% Liquidity, hedge -2.3% - Total 100.0% 100.0%
Maturity structure
0 – 1 years
1 – 2 years
2 – 3 years
> 3 years
Portfolio structure by category of borrower
Investment Group Benchmark Industry 63.2% 42.6% Utilities 3.8% 5.5% Banks, financial institutions 34.6% 51.9% Miscellaneous 0.6% 0.0% Liquidity 1.1% - Currency hedging -3.3% - Total 100.0% 100.0%
Portfolio structure by currencies and duration
Investment Group Benchmark Percentage Duration Percentage Duration USD 72.5% 1.7 62.7% 1.9 EUR 19.5% 2.4 23.1% 1.8 JPY 0.0% 0.0 4.3% 1.8 GBP 10.0% 2.3 3.9% 1.7 Miscellaneous -2.0% 0.0 6.0% 1.8 Total 100.0% 100.0% Modified Duration1) 1.7 1.9 Theoretical yield to maturity1) 2.1% 1.6%
1) before currency hedging, taking derivatives into account
Disclaimer This publication is not intended as a solicitation or recommendation to buy or sell investment instruments but only serves to provide information. All documents which form the legal basis for any investment decision can be obtained free of charge from the Swiss Life Investment Foundation, P.O. Box, 8022 Zurich, tel. 043 284 79 79. The circle of investors is limited to 2nd and 3rd pillar institutions domiciled in Switzerland which are not subject to tax, as well as employer-sponsored welfare funds. Past performance is not an indicator of current or future results. The performance data do not include the costs and fees associated with issuing and redeeming the fund units.
Major borrower and rating Siemens Fin Nv 1.6% A+ Telefonica Emisiones S.A 1.5% BBB ConocoPhillips 1.2% A Swedbank AB 1.2% A+ CVS Health Corp 1.1% BBB+
30 September 2015
Swiss Life Investment Foundation Bonds Global Corporates Short Term (CHF hedged)
Investment by rating
AAA
AA
A
BBB
Average rating BBB+
Further information on the debtors
Number of debtors 205 Proportion of non-benchmark debtors 4.6%
Indexed performance and performances
Monthly performance
-10%
-5%
0%
5%
10%
15%
Jan Feb Mar Apr May Jun Jul Aug Sep Oct Nov Dec
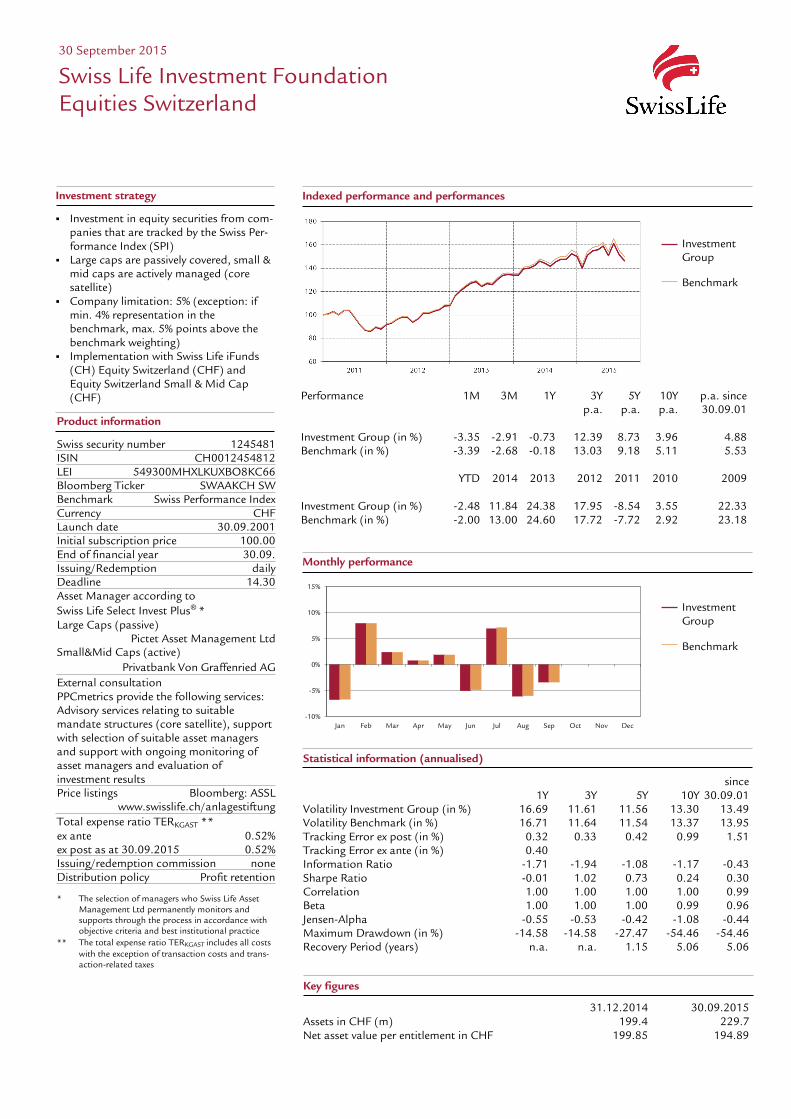
Performance 1M 3M 1Y 3Y 5Y 10Y p.a. since p.a. p.a. p.a. 30.09.01 Investment Group (in %) -3.35 -2.91 -0.73 12.39 8.73 3.96 4.88 Benchmark (in %) -3.39 -2.68 -0.18 13.03 9.18 5.11 5.53 YTD 2014 2013 2012 2011 2010 2009 Investment Group (in %) -2.48 11.84 24.38 17.95 -8.54 3.55 22.33 Benchmark (in %) -2.00 13.00 24.60 17.72 -7.72 2.92 23.18
30 September 2015
Swiss Life Investment Foundation Equities Switzerland
Investment strategy
Investment in equity securities from com-panies that are tracked by the Swiss Per-formance Index (SPI)
Large caps are passively covered, small & mid caps are actively managed (core satellite)
Company limitation: 5% (exception: if min. 4% representation in the benchmark, max. 5% points above the benchmark weighting)
Implementation with Swiss Life iFunds (CH) Equity Switzerland (CHF) and Equity Switzerland Small & Mid Cap (CHF)
Investment Group Benchmark
Investment Group Benchmark
Product information
Swiss security number 1245481 ISIN CH0012454812 LEI 549300MHXLKUXBO8KC66 Bloomberg Ticker SWAAKCH SW Benchmark Swiss Performance Index Currency CHF Launch date 30.09.2001 Initial subscription price 100.00 End of financial year 30.09. Issuing/Redemption daily Deadline 14.30 Asset Manager according to Swiss Life Select Invest Plus® * Large Caps (passive) Pictet Asset Management Ltd Small&Mid Caps (active) Privatbank Von Graffenried AG External consultation PPCmetrics provide the following services: Advisory services relating to suitable mandate structures (core satellite), support with selection of suitable asset managers and support with ongoing monitoring of asset managers and evaluation of investment results Price listings Bloomberg: ASSL www.swisslife.ch/anlagestiftung Total expense ratio TERKGAST ** ex ante 0.52% ex post as at 30.09.2015 0.52% Issuing/redemption commission none Distribution policy Profit retention * The selection of managers who Swiss Life Asset
Management Ltd permanently monitors and supports through the process in accordance with objective criteria and best institutional practice
** The total expense ratio TERKGAST includes all costs with the exception of transaction costs and trans-action-related taxes
Statistical information (annualised)
since 1Y 3Y 5Y 10Y 30.09.01 Volatility Investment Group (in %) 16.69 11.61 11.56 13.30 13.49 Volatility Benchmark (in %) 16.71 11.64 11.54 13.37 13.95 Tracking Error ex post (in %) 0.32 0.33 0.42 0.99 1.51 Tracking Error ex ante (in %) 0.40 Information Ratio -1.71 -1.94 -1.08 -1.17 -0.43 Sharpe Ratio -0.01 1.02 0.73 0.24 0.30 Correlation 1.00 1.00 1.00 1.00 0.99 Beta 1.00 1.00 1.00 0.99 0.96 Jensen-Alpha -0.55 -0.53 -0.42 -1.08 -0.44 Maximum Drawdown (in %) -14.58 -14.58 -27.47 -54.46 -54.46 Recovery Period (years) n.a. n.a. 1.15 5.06 5.06
Key figures
31.12.2014 30.09.2015 Assets in CHF (m) 199.4 229.7 Net asset value per entitlement in CHF 199.85 194.89

Portfolio structure by sector2)
Investment Group Benchmark Food & beverages 36.3% 36.4% Healthcare 20.3% 20.8% Banks 9.0% 10.0% Industry, energy, utilities 9.2% 8.3% Insurance 6.7% 6.6% Chemicals, oil & gas 4.2% 4.4% Goods and services 5.0% 4.7% Technology, media, telecoms 2.7% 2.1% Miscellaneous 5.7% 6.7% Liquidity 0.9% - Total 100.0% 100.0% 2) Taking derivatives and pooled investments into account
Biggest holdings3)
Investment Group Benchmark Nestlé 19.1% 19.1% Novartis 18.6% 18.6% Roche 14.8% 14.8% UBS 5.3% 5.3% Cie Fin Richemont 3.2% 3.2% ABB 3.1% 3.1% Zurich Insurance Group 2.9% 2.9% Credit Suisse Group 2.7% 2.7% Syngenta 2.4% 2.4% Swiss Re Reg. 2.3% 2.3% 3) Taking derivatives and pooled investments into account
30 September 2015
Swiss Life Investment Foundation Equities Switzerland
Disclaimer This publication is not intended as a solicitation or recommendation to buy or sell investment instruments but only serves to provide information. All documents which form the legal basis for any investment decision can be obtained free of charge from the Swiss Life Investment Foundation, P.O. Box, 8022 Zurich, tel. 043 284 79 79. The circle of investors is limited to 2nd and 3rd pillar institutions domiciled in Switzerland which are not subject to tax, as well as employer-sponsored welfare funds. Past performance is not an indicator of current or future results. The performance data do not include the costs and fees associated with issuing and redeeming the fund units.
Portfolio structure according to size of company1)
Investment Group Benchmark Percentage Number Percentage Number Large companies 84.0% 20 84.2% 20 Medium companies 13.6% 48 14.3% 80 Small companies 1.5% 11 1.5% 108 Liquidity 0.9% - - - Total 100.0% 79 100.0% 208 1) Taking derivatives and pooled investments into account
Indexed performance and performances
Statistical information (annualised)
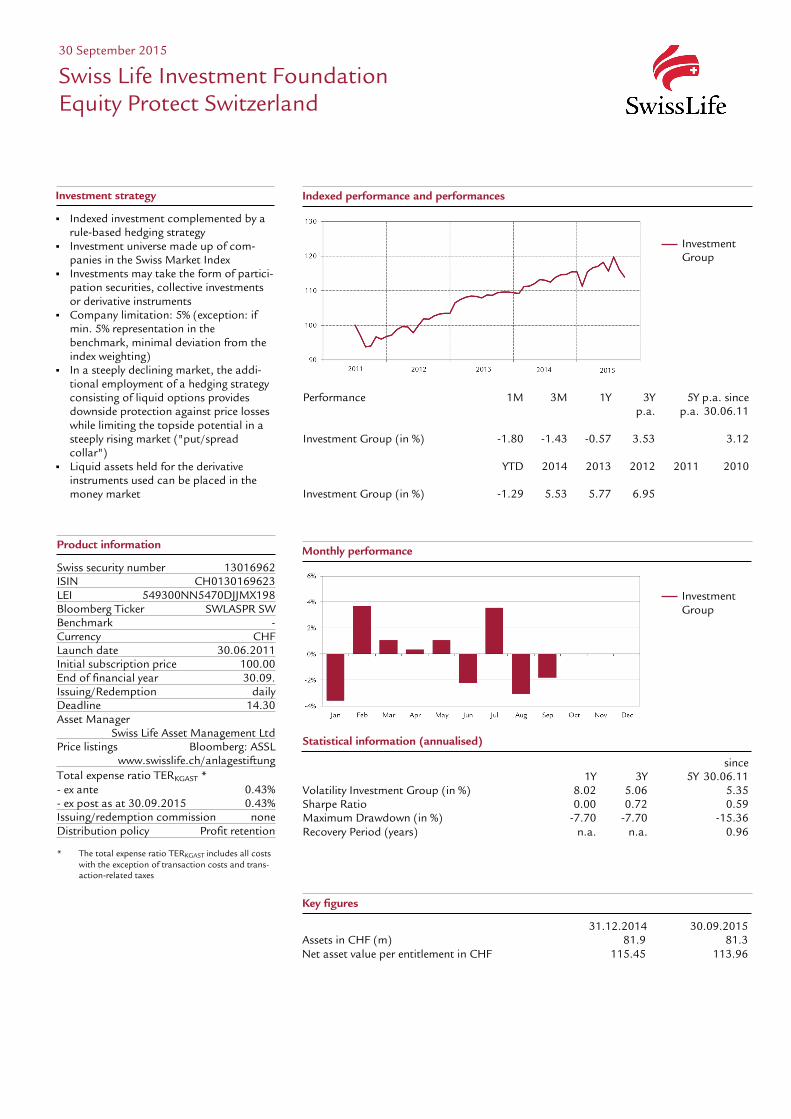
since 1Y 3Y 5Y 30.06.11 Volatility Investment Group (in %) 8.02 5.06 5.35 Sharpe Ratio 0.00 0.72 0.59 Maximum Drawdown (in %) -7.70 -7.70 -15.36 Recovery Period (years) n.a. n.a. 0.96
Key figures
31.12.2014 30.09.2015 Assets in CHF (m) 81.9 81.3 Net asset value per entitlement in CHF 115.45 113.96
Performance 1M 3M 1Y 3Y 5Y p.a. since p.a. p.a. 30.06.11 Investment Group (in %) -1.80 -1.43 -0.57 3.53 3.12 YTD 2014 2013 2012 2011 2010 Investment Group (in %) -1.29 5.53 5.77 6.95
30 September 2015
Swiss Life Investment Foundation Equity Protect Switzerland
Investment strategy
Indexed investment complemented by a rule-based hedging strategy
Investment universe made up of com-panies in the Swiss Market Index
Investments may take the form of partici-pation securities, collective investments or derivative instruments
Company limitation: 5% (exception: if min. 5% representation in the benchmark, minimal deviation from the index weighting)
In a steeply declining market, the addi-tional employment of a hedging strategy consisting of liquid options provides downside protection against price losses while limiting the topside potential in a steeply rising market ("put/spread collar")
Liquid assets held for the derivative instruments used can be placed in the money market
Investment Group
Product information
Swiss security number 13016962 ISIN CH0130169623 LEI 549300NN5470DJJMX198 Bloomberg Ticker SWLASPR SW Benchmark - Currency CHF Launch date 30.06.2011 Initial subscription price 100.00 End of financial year 30.09. Issuing/Redemption daily Deadline 14.30 Asset Manager Swiss Life Asset Management Ltd Price listings Bloomberg: ASSL www.swisslife.ch/anlagestiftung Total expense ratio TERKGAST * - ex ante 0.43% - ex post as at 30.09.2015 0.43% Issuing/redemption commission none Distribution policy Profit retention
* The total expense ratio TERKGAST includes all costs with the exception of transaction costs and trans-action-related taxes
Monthly performance
Investment Group
Portfolio structure
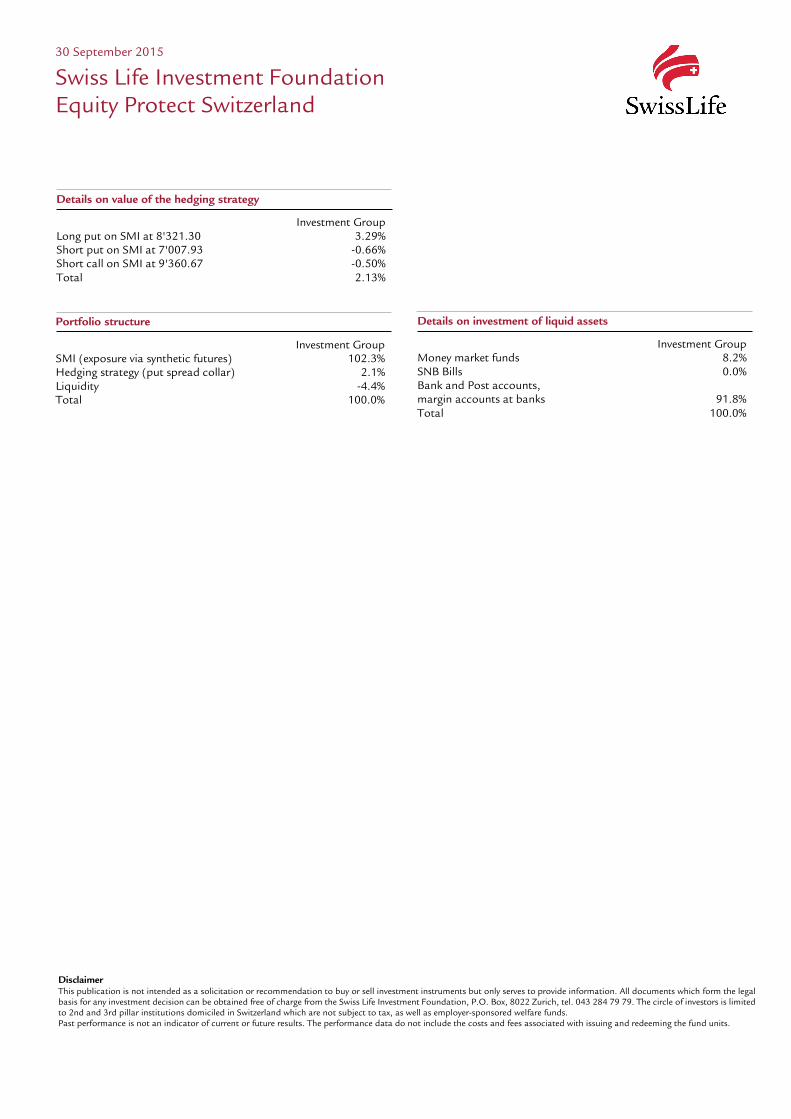
Investment Group SMI (exposure via synthetic futures) 102.3% Hedging strategy (put spread collar) 2.1% Liquidity -4.4% Total 100.0%
Details on investment of liquid assets
Investment Group Money market funds 8.2% SNB Bills 0.0% Bank and Post accounts, margin accounts at banks 91.8% Total 100.0%
30 September 2015
Swiss Life Investment Foundation Equity Protect Switzerland
Disclaimer This publication is not intended as a solicitation or recommendation to buy or sell investment instruments but only serves to provide information. All documents which form the legal basis for any investment decision can be obtained free of charge from the Swiss Life Investment Foundation, P.O. Box, 8022 Zurich, tel. 043 284 79 79. The circle of investors is limited to 2nd and 3rd pillar institutions domiciled in Switzerland which are not subject to tax, as well as employer-sponsored welfare funds. Past performance is not an indicator of current or future results. The performance data do not include the costs and fees associated with issuing and redeeming the fund units.
Details on value of the hedging strategy
Investment Group Long put on SMI at 8'321.30 3.29% Short put on SMI at 7'007.93 -0.66% Short call on SMI at 9'360.67 -0.50% Total 2.13%
Indexed performance and performances
Monthly performance
-10%
-5%
0%
5%
10%
15%
Jan Feb Mar Apr May Jun Jul Aug Sep Oct Nov Dec
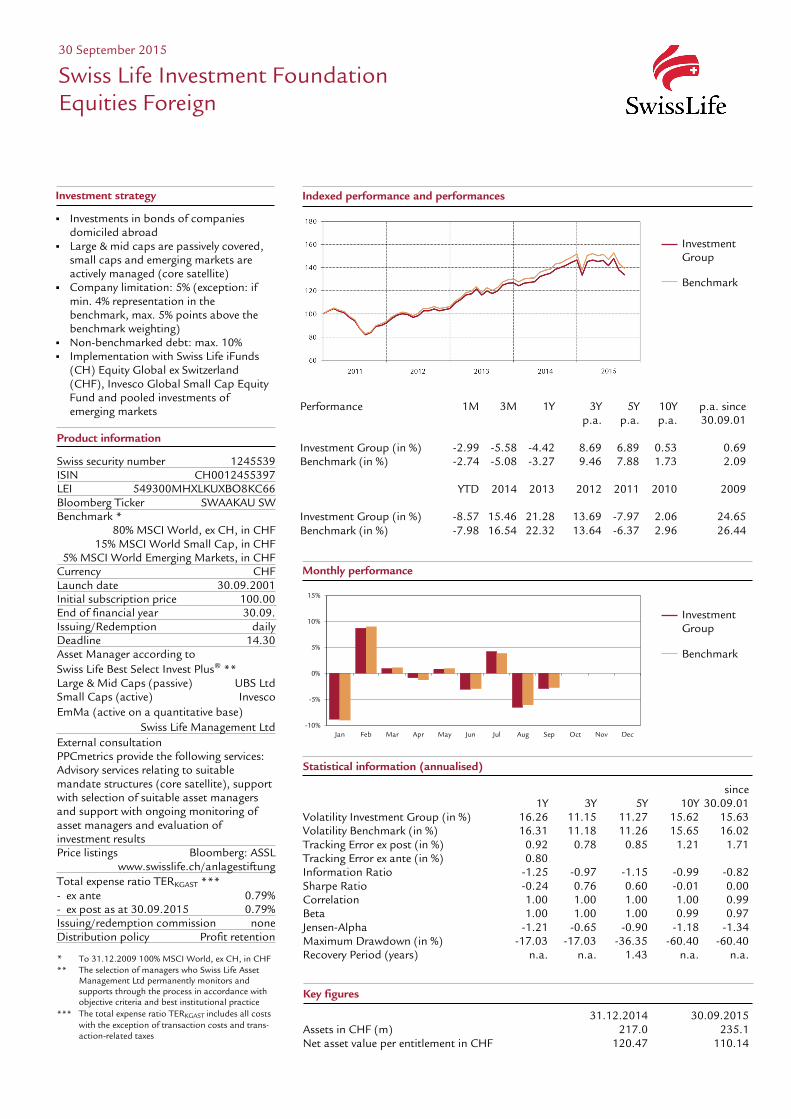
Performance 1M 3M 1Y 3Y 5Y 10Y p.a. since p.a. p.a. p.a. 30.09.01 Investment Group (in %) -2.99 -5.58 -4.42 8.69 6.89 0.53 0.69 Benchmark (in %) -2.74 -5.08 -3.27 9.46 7.88 1.73 2.09 YTD 2014 2013 2012 2011 2010 2009 Investment Group (in %) -8.57 15.46 21.28 13.69 -7.97 2.06 24.65 Benchmark (in %) -7.98 16.54 22.32 13.64 -6.37 2.96 26.44
30 September 2015
Swiss Life Investment Foundation Equities Foreign
Investment strategy
Investments in bonds of companies domiciled abroad
Large & mid caps are passively covered, small caps and emerging markets are actively managed (core satellite)
Company limitation: 5% (exception: if min. 4% representation in the benchmark, max. 5% points above the benchmark weighting)
Non-benchmarked debt: max. 10% Implementation with Swiss Life iFunds
(CH) Equity Global ex Switzerland (CHF), Invesco Global Small Cap Equity Fund and pooled investments of emerging markets
Investment Group Benchmark
Investment Group Benchmark
Product information
Swiss security number 1245539 ISIN CH0012455397 LEI 549300MHXLKUXBO8KC66 Bloomberg Ticker SWAAKAU SW Benchmark * 80% MSCI World, ex CH, in CHF 15% MSCI World Small Cap, in CHF 5% MSCI World Emerging Markets, in CHF Currency CHF Launch date 30.09.2001 Initial subscription price 100.00 End of financial year 30.09. Issuing/Redemption daily Deadline 14.30 Asset Manager according to Swiss Life Best Select Invest Plus® ** Large & Mid Caps (passive) UBS Ltd Small Caps (active) Invesco EmMa (active on a quantitative base) Swiss Life Management Ltd External consultation PPCmetrics provide the following services: Advisory services relating to suitable mandate structures (core satellite), support with selection of suitable asset managers and support with ongoing monitoring of asset managers and evaluation of investment results Price listings Bloomberg: ASSL www.swisslife.ch/anlagestiftung Total expense ratio TERKGAST *** - ex ante 0.79% - ex post as at 30.09.2015 0.79% Issuing/redemption commission none Distribution policy Profit retention * To 31.12.2009 100% MSCI World, ex CH, in CHF ** The selection of managers who Swiss Life Asset
Management Ltd permanently monitors and supports through the process in accordance with objective criteria and best institutional practice
*** The total expense ratio TERKGAST includes all costs with the exception of transaction costs and trans-action-related taxes
Statistical information (annualised)
since 1Y 3Y 5Y 10Y 30.09.01 Volatility Investment Group (in %) 16.26 11.15 11.27 15.62 15.63 Volatility Benchmark (in %) 16.31 11.18 11.26 15.65 16.02 Tracking Error ex post (in %) 0.92 0.78 0.85 1.21 1.71 Tracking Error ex ante (in %) 0.80 Information Ratio -1.25 -0.97 -1.15 -0.99 -0.82 Sharpe Ratio -0.24 0.76 0.60 -0.01 0.00 Correlation 1.00 1.00 1.00 1.00 0.99 Beta 1.00 1.00 1.00 0.99 0.97 Jensen-Alpha -1.21 -0.65 -0.90 -1.18 -1.34 Maximum Drawdown (in %) -17.03 -17.03 -36.35 -60.40 -60.40 Recovery Period (years) n.a. n.a. 1.43 n.a. n.a.
Key figures
31.12.2014 30.09.2015 Assets in CHF (m) 217.0 235.1 Net asset value per entitlement in CHF 120.47 110.14
Portfolio structure by sector2)
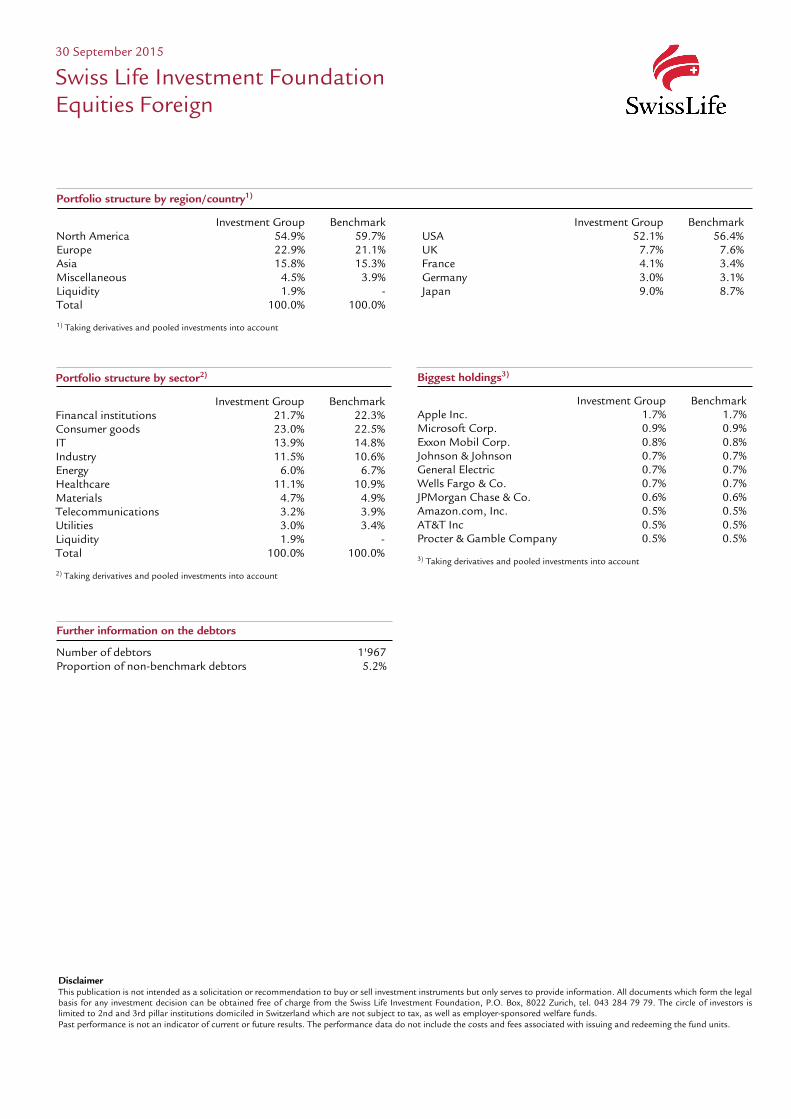
Investment Group Benchmark Financal institutions 21.7% 22.3% Consumer goods 23.0% 22.5% IT 13.9% 14.8% Industry 11.5% 10.6% Energy 6.0% 6.7% Healthcare 11.1% 10.9% Materials 4.7% 4.9% Telecommunications 3.2% 3.9% Utilities 3.0% 3.4% Liquidity 1.9% - Total 100.0% 100.0% 2) Taking derivatives and pooled investments into account
Biggest holdings3)
Investment Group Benchmark Apple Inc. 1.7% 1.7% Microsoft Corp. 0.9% 0.9% Exxon Mobil Corp. 0.8% 0.8% Johnson & Johnson 0.7% 0.7% General Electric 0.7% 0.7% Wells Fargo & Co. 0.7% 0.7% JPMorgan Chase & Co. 0.6% 0.6% Amazon.com, Inc. 0.5% 0.5% AT&T Inc 0.5% 0.5% Procter & Gamble Company 0.5% 0.5% 3) Taking derivatives and pooled investments into account
30 September 2015
Swiss Life Investment Foundation Equities Foreign
Disclaimer This publication is not intended as a solicitation or recommendation to buy or sell investment instruments but only serves to provide information. All documents which form the legal basis for any investment decision can be obtained free of charge from the Swiss Life Investment Foundation, P.O. Box, 8022 Zurich, tel. 043 284 79 79. The circle of investors is limited to 2nd and 3rd pillar institutions domiciled in Switzerland which are not subject to tax, as well as employer-sponsored welfare funds. Past performance is not an indicator of current or future results. The performance data do not include the costs and fees associated with issuing and redeeming the fund units.
Portfolio structure by region/country1)
Investment Group Benchmark Investment Group Benchmark North America 54.9% 59.7% USA 52.1% 56.4% Europe 22.9% 21.1% UK 7.7% 7.6% Asia 15.8% 15.3% France 4.1% 3.4% Miscellaneous 4.5% 3.9% Germany 3.0% 3.1% Liquidity 1.9% - Japan 9.0% 8.7% Total 100.0% 100.0% 1) Taking derivatives and pooled investments into account
Further information on the debtors
Number of debtors 1'967 Proportion of non-benchmark debtors 5.2%

Indexed performance and performances
Monthly performance
-4%
-2%
0%
2%
4%
6%
Jan Feb Mar Apr May Jun Jul Aug Sep Oct Nov Dec
Performance 1M 3M 1Y 3Y 5Y p.a. since p.a. p.a. 30.06.11 Investment Group (in %) -2.02 -4.19 -0.24 3.45 5.70 YTD 2014 2013 2012 2011 2010 Investment Group (in %) -2.02 5.32 8.53 6.86
Statistical information (annualised)
since 1Y 3Y 5Y 30.06.11 Volatility Investment Group (in %) 5.78 4.46 6.89 Sharpe Ratio 0.05 0.80 0.82 Maximum Drawdown (in %) -6.88 -6.88 -23.41 Recovery Period (years) n.a. n.a. 0.24
Key figures
31.12.2014 30.09.2015 Assets in CHF (m) 116.0 199.6 Net asset value per entitlement in CHF 129.17 126.56
30 September 2015
Swiss Life Investment Foundation Equity Protect Foreign (CHF hedged)
Investment strategy
Indexed investment complemented by a rule-based hedging strategy
Investment universe made up of com-panies in the major foreign stock market indices (S&P500, Eurostoxx50, FTSE100 and Nikkei225; weighted by market cap-italisation), whereby foreign currency risks will be at least 90% hedged against Swiss francs
Investments may take the form of parti-cipation securities, collective investments or derivative instruments
Company limitation: 5% (exception: if min. 5% representation in the benchmark, minimal deviation from the index weighting)
In a steeply declining market, the addi-tional employment of a hedging strategy consisting of liquid options provides downside protection against price losses while limiting the topside potential in a steeply rising market ("put/spread collar")
Liquid assets held for the derivative instruments used can be placed in the money market
Investment Group
Investment Group
Product information Swiss security number 13016964 ISIN CH0130169649 LEI 5493009CH5U7IN4LEI63 Bloomberg Ticker SWLAUSP SW Benchmark - Currency * CHF Launch date 30.06.2011 Initial subscription price 100.00 End of financial year 30.09. Issuing/Redemption daily Deadline 14.30 Asset Manager Swiss Life Asset Management Ltd Price listings Bloomberg: ASSL www.swisslife.ch/anlagestiftung Total expense ratio TERKGAST ** ex ante 0.59% ex post as at 30.09.2015 0.59% Issuing/redemption commission none Distribution policy Profit retention * To 31.12.2012 (unhedged) ** The total expense ratio TERKGAST includes all costs
with the exception of transaction costs and trans-action-related taxes

Portfolio structure
Investment Group S&P500 (exposure via synthetic futures) 60.6% Eurostoxx50 (exposure via synthetic futures) 12.1% FTSE100 (exposure via synthetic futures) 11.7% Nikkei225 (exposure via synthetic futures) 12.2% Hedging strategy (put spread collar) 2.9% Currency futures 0.5% Liquidity 0.0% Total 100.0%
Details on investment of liquid assets
Investment Group Money market funds 9.8% SNB Bills 0.0% Bank and Post accounts, margin accounts at banks 90.2% Total 100.0%
30 September 2015
Swiss Life Investment Foundation Equity Protect Foreign (CHF hedged)
Disclaimer This publication is not intended as a solicitation or recommendation to buy or sell investment instruments but only serves to provide information. All documents which form the legal basis for any investment decision can be obtained free of charge from the Swiss Life Investment Foundation, P.O. Box, 8022 Zurich, tel. 043 284 79 79. The circle of investors is limited to 2nd and 3rd pillar institutions domiciled in Switzerland which are not subject to tax, as well as employer-sponsored welfare funds. Past performance is not an indicator of current or future results. The performance data do not include the costs and fees associated with issuing and redeeming the fund units.
Details on value of the hedging strategy
Investment Group Long put on S&P500 at 1'934.34 2.85% Short put on S&P500 at 1'628.80 -0.55% Short call on S&P500 at 2'190.67 -0.01% Long put on Eurostoxx50 at 2'889.97 0.40% Short put on Eurostoxx50 at 2'433.83 -0.10% Short call on Eurostoxx50 at 3'337.96 -0.18% Long put on FTSE100 at 6'069.69 0.53% Short put on FTSE100 at 5'111.04 -0.11% Short call on FTSE100 at 6'861.56 -0.02% Long put on Nikkei225 at 16'388.02 0.39% Short put on Nikkei225 at 13'800.07 -0.10% Short call on Nikkei225 at 19'408.48 -0.15% Total 2.93%

Performance 1M 3M 1Y 3Y 5Y p.a. since p.a. p.a. 30.11.09 Investment Group (in %) 1.85 2.41 6.68 6.07 6.08 5.66 Benchmark (in %) 0.67 1.52 5.32 5.58 5.88 5.75 YTD 2014 2013 2012 2011 2010 Investment Group (in %) 5.70 5.61 5.84 6.39 5.81 4.19 Benchmark (in %) 3.90 5.06 5.73 6.52 6.89 4.91
Monthly performance
-2%
-1%
0%
1%
2%
3%
Jan Feb Mar Apr May Jun Jul Aug Sep Oct Nov Dec
5.61 5.84
Indexed performance and performances
30 September 2015
Swiss Life Investment Foundation Real Estate Switzerland
Investment strategy
Investments are made in directly held properties
Active management of the real estate portfolio
Diversification in terms of geographical location, type of use, size and age - Residential 50-75% - Commercial use 25-50% - Project developments 0-20%
Target borrowing ratio: 0-20%
Investment Group Benchmark
Product information
Swiss security number 10615013 ISIN CH0106150136 LEI 549300MHXLKUXBO8KC66 Bloomberg Ticker SWLIMMS SW Benchmark KGAST Immo-Index Currency CHF Launch date 30.11.2009 Initial subscription price 100.00 End of financial year 30.09. Issuing currently closed for subscriptions Redemption currently daily * Deadline 14.30 Asset Manager Swiss Life REIM (Switzerland) AG Price listings Bloomberg: ASSL www.swisslife.ch/anlagestiftung Management Fee ** 0.50% Property management as % of net rental income max. 4.50% Transaction commission for acquisitions and divestments as % of purchase/sales price max. 2.00% Building & renovation fee as % of building costs 2.00% Additional costs such as transfer of owner-ship costs estimates, etc., acc. to actual time/effort Total expense ratio TERISA *** - GAV basis as at 30.09.2015 0.77% - NAV basis as at 30.09.2015 0.84% Redemption commission **** 1.50% Distribution policy Profit retention * Based on current reallocation possibilities
(otherwise at end of quarter in compliance with notice period of 3 months)
** Includes costs for portfolio management, administration, accounting, NAV calculation, ordinary auditing, supervisory activities and reporting
*** The total expense ratio TERISA includes all costs with the exception of transaction costs and trans-action-related taxes
**** If claims can be reallocated as of the value date, no redemption commission is charged
Investment Group Benchmark
Statistical information (annualised)
since 1Y 3Y 5Y 10Y 30.09.01 Volatility Investment Group (in %) 2.11 1.65 1.52 1.48 Volatility Benchmark (in %) 0.41 0.53 0.62 0.58 Tracking Error ex post (in %) 1.87 1.60 1.53 1.49 Tracking Error ex ante (in %) 1.70 Information Ratio 0.72 0.31 0.13 -0.06 Sharpe Ratio 3.31 3.67 3.92 3.73 Correlation 0.65 0.26 0.19 0.18 Beta 3.32 0.79 0.46 0.47 Jensen-Alpha -11.97 1.63 3.29 2.91 Maximum Drawdown (in %) - - - -0.79 Recovery Period (years) - - - 0.25
Key figures
31.12.2014 30.09.2015 Assets in CHF (m) 1'511.0 1'614.1 Net asset value per entitlement in CHF 130.45 137.89
Geographical spread of properties2)
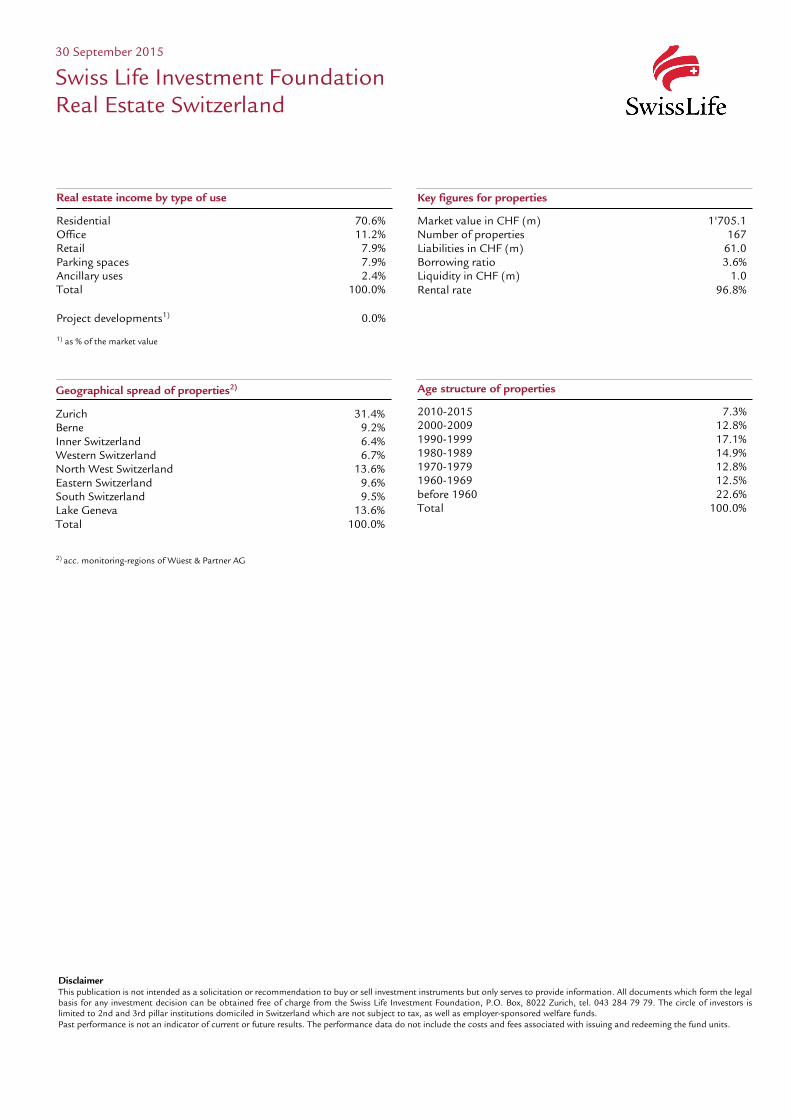
Zurich 31.4% Berne 9.2% Inner Switzerland 6.4% Western Switzerland 6.7% North West Switzerland 13.6% Eastern Switzerland 9.6% South Switzerland 9.5% Lake Geneva 13.6% Total 100.0% 2) acc. monitoring-regions of Wüest & Partner AG
Age structure of properties
2010-2015 7.3% 2000-2009 12.8% 1990-1999 17.1% 1980-1989 14.9% 1970-1979 12.8% 1960-1969 12.5% before 1960 22.6% Total 100.0%
Key figures for properties
Market value in CHF (m) 1'705.1 Number of properties 167 Liabilities in CHF (m) 61.0 Borrowing ratio 3.6% Liquidity in CHF (m) 1.0 Rental rate 96.8%
30 September 2015
Swiss Life Investment Foundation Real Estate Switzerland
Disclaimer This publication is not intended as a solicitation or recommendation to buy or sell investment instruments but only serves to provide information. All documents which form the legal basis for any investment decision can be obtained free of charge from the Swiss Life Investment Foundation, P.O. Box, 8022 Zurich, tel. 043 284 79 79. The circle of investors is limited to 2nd and 3rd pillar institutions domiciled in Switzerland which are not subject to tax, as well as employer-sponsored welfare funds. Past performance is not an indicator of current or future results. The performance data do not include the costs and fees associated with issuing and redeeming the fund units.
Real estate income by type of use
Residential 70.6% Office 11.2% Retail 7.9% Parking spaces 7.9% Ancillary uses 2.4% Total 100.0% Project developments1) 0.0% 1) as % of the market value

Performance 1M 3M 1Y 3Y 5Y p.a. since p.a. p.a. 31.10.11 Investment Group (in %) 0.90 1.48 5.22 5.32 5.19 Benchmark (in %) 0.67 1.52 5.32 5.58 5.88 YTD 2014 2013 2012 2011 2010 Investment Group (in %) 4.29 4.53 6.05 4.94 Benchmark (in %) 3.90 5.06 5.73 6.52
Indexed performance and performances
30 September 2015
Swiss Life Investment Foundation Commercial Real Estate Switzerland
Investment strategy
Investments are made in directly held properties
Active management of the real estate portfolio
Diversification in terms of geographical location, type of use, size and age - Commercial use 60-90% - Residential 10-30% - Project developments 0-20%
Target borrowing ratio: 0-30%
Investment Group Benchmark
Monthly performance
Investment Group Benchmark
Product information
Swiss security number 13683758 ISIN CH0136837587 LEI 549300MHXLKUXBO8KC66 Bloomberg Ticker SWLGSCH SW Benchmark KGAST Immo-Index Currency CHF Launch date 31.10.2011 Initial subscription price 100.00 End of financial year 30.09. Issuing currently closed for subscriptions Redemption currently daily * Deadline 14.30 Asset Manager Swiss Life REIM (Switzerland) AG Price listings Bloomberg: ASSL www.swisslife.ch/anlagestiftung Management Fee ** 0.50% Property management as % of net rental income max. 4.50% Transaction commission for acquisitions and divestments as % of purchase/sales price max. 2.00% Building & renovation fee as % of building costs 3.00% Additional costs such as transfer of owner-ship costs estimates, etc., acc. to actual time/effort Total expense ratio TERISA *** - Basis GAV per 30.09.2015 0.78% - Basis NAV per 30.09.2015 0.86% Redemption commission **** 1.50% Distribution policy Profit retention * Based on current reallocation possibilities
(otherwise at end of quarter in compliance with notice period of 3 months)
** Includes costs for portfolio management, administration, accounting, NAV calculation, ordinary auditing, supervisory activities and reporting
*** The total expense ratio TERISA includes all costs with the exception of transaction costs and trans-action-related taxes
**** If claims can be reallocated as of the value date, no redemption commission is charged
Statistical information (annualised)
since 1Y 3Y 5Y 10Y 30.09.01 Volatility Investment Group (in %) 1.15 1.12 1.21 Volatility Benchmark (in %) 0.41 0.53 0.64 Tracking Error ex post (in %) 0.98 1.10 1.25 Tracking Error ex ante (in %) 1.10 Information Ratio -0.10 -0.24 -0.55 Sharpe Ratio 4.89 4.79 4.29 Correlation 0.56 0.28 0.19 Beta 1.56 0.58 0.36 Jensen-Alpha -3.31 2.12 3.07 Maximum Drawdown (in %) - - - Recovery Period (years) - - -
Key figures
31.12.2014 30.09.2015 Assets in CHF (m) 836.2 872.1 Net asset value per entitlement in CHF 116.91 121.93
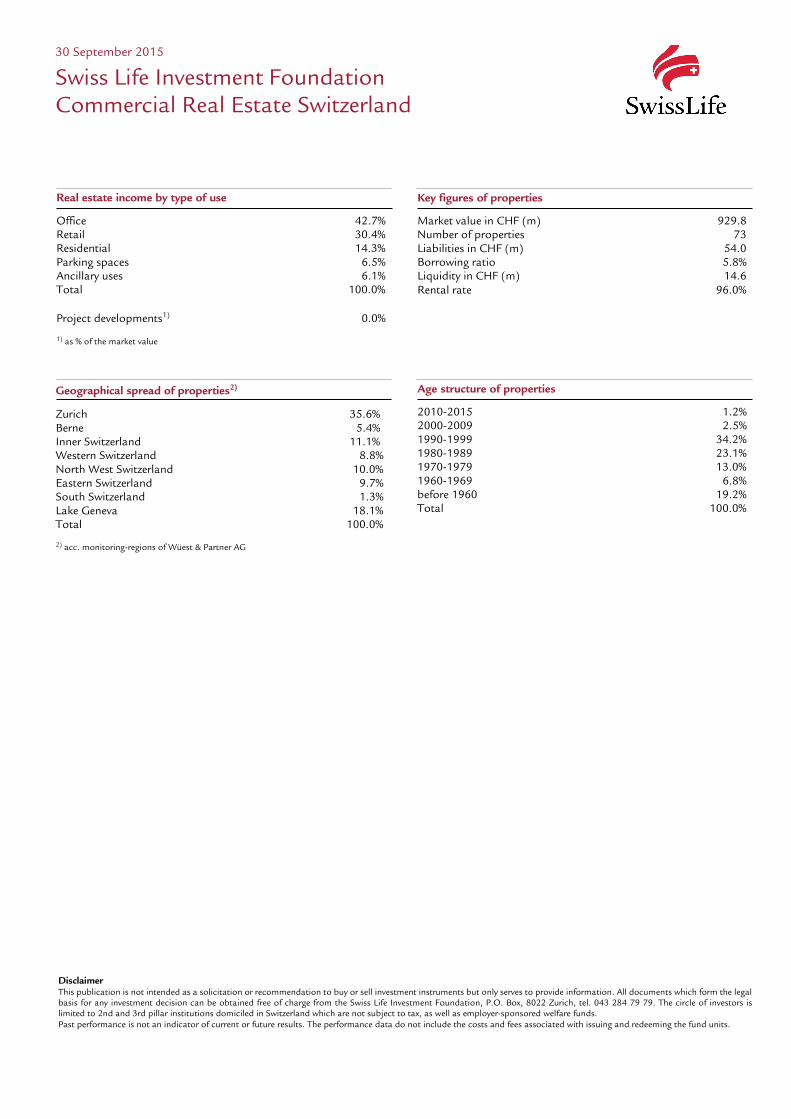
Geographical spread of properties2)
Zurich 35.6% Berne 5.4% Inner Switzerland 11.1% Western Switzerland 8.8% North West Switzerland 10.0% Eastern Switzerland 9.7% South Switzerland 1.3% Lake Geneva 18.1% Total 100.0% 2) acc. monitoring-regions of Wüest & Partner AG
Age structure of properties
2010-2015 1.2% 2000-2009 2.5% 1990-1999 34.2% 1980-1989 23.1% 1970-1979 13.0% 1960-1969 6.8% before 1960 19.2% Total 100.0%
Key figures of properties
Market value in CHF (m) 929.8 Number of properties 73 Liabilities in CHF (m) 54.0 Borrowing ratio 5.8% Liquidity in CHF (m) 14.6 Rental rate 96.0%
30 September 2015
Swiss Life Investment Foundation Commercial Real Estate Switzerland
Disclaimer This publication is not intended as a solicitation or recommendation to buy or sell investment instruments but only serves to provide information. All documents which form the legal basis for any investment decision can be obtained free of charge from the Swiss Life Investment Foundation, P.O. Box, 8022 Zurich, tel. 043 284 79 79. The circle of investors is limited to 2nd and 3rd pillar institutions domiciled in Switzerland which are not subject to tax, as well as employer-sponsored welfare funds. Past performance is not an indicator of current or future results. The performance data do not include the costs and fees associated with issuing and redeeming the fund units.
Real estate income by type of use
Office 42.7% Retail 30.4% Residential 14.3% Parking spaces 6.5% Ancillary uses 6.1% Total 100.0% Project developments1) 0.0% 1) as % of the market value

Performance 1M 3M 1Y 3Y 5Y p.a. since p.a. p.a. 28.02.11 Investment Group (in %) -0.53 -2.01 5.86 3.73 3.56 Benchmark (in %) -0.19 -1.88 7.10 4.47 4.32 YTD 2014 2013 2012 2011 2010 Investment Group (in %) -0.38 13.84 -2.05 5.02 Benchmark (in %) 0.68 14.47 -1.80 5.81
Monthly performance
-8%
-4%
0%
4%
8%
12%
Jan Feb Mar Apr May Jun Jul Aug Sep Oct Nov Dec
30 September 2015
Swiss Life Investment Foundation Real Estate Funds Switzerland
Investment strategy
The investment group invests in real estate investment funds which are under Swiss law, denominated in Swiss francs and invest exclusively in Swiss properties
Active selection of real estate investment funds
Implementation via investment in Swiss Life Funds (CH) Real Estate Switzerland Fund of Funds
Indexed performance and performances
90
100
110
120
130
140
2011 2012 2013 2014 2015
Investment Group Benchmark
Product information
Swiss security number 12468379 ISIN CH0124683795 LEI 549300MHXLKUXBO8KC66 Bloomberg Ticker SWLIMSC SW Benchmark SXI Swiss Real Estate® Funds Currency CHF Launch date 28.02.2011 Initial subscription price 100.00 End of financial year 30.09. Issuing/Redemption daily Deadline 14.30 Asset Manager Swiss Life Asset Management Ltd Price listings Bloomberg: ASSL www.swisslife.ch/anlagestiftung Total expense ratio TERKGAST * ex ante 1.19% ex post as at 30.09.2015 1.19% Issuing/redemption commission none Distribution policy Profit retention
* The total expense ratio TERKGAST includes all costs with the exception of transaction costs and trans-action-related taxes
Investment Group Benchmark
Statistical information (annualised)
since 1Y 3Y 5Y 10Y 28.02.11 Volatility Investment Group (in %) 12.70 9.06 7.84 Volatility Benchmark (in %) 13.15 9.43 8.13 Tracking Error ex post (in %) 0.71 0.69 0.58 Tracking Error ex ante (in %) 0.70 Information Ratio -1.73 -1.08 -1.32 Sharpe Ratio 0.49 0.42 0.46 Correlation 1.00 1.00 1.00 Beta 0.97 0.96 0.96 Jensen-Alpha -0.90 -0.53 -0.58 Maximum Drawdown (in %) -11.45 -11.45 -11.45 Recovery Period (years) n.a. n.a. n.a.
Key figures
31.12.2014 30.09.2015 Assets in CHF (m) 46.8 78.5 Net asset value per entitlement in CHF 117.82 117.37
Geographical spread of properties2)
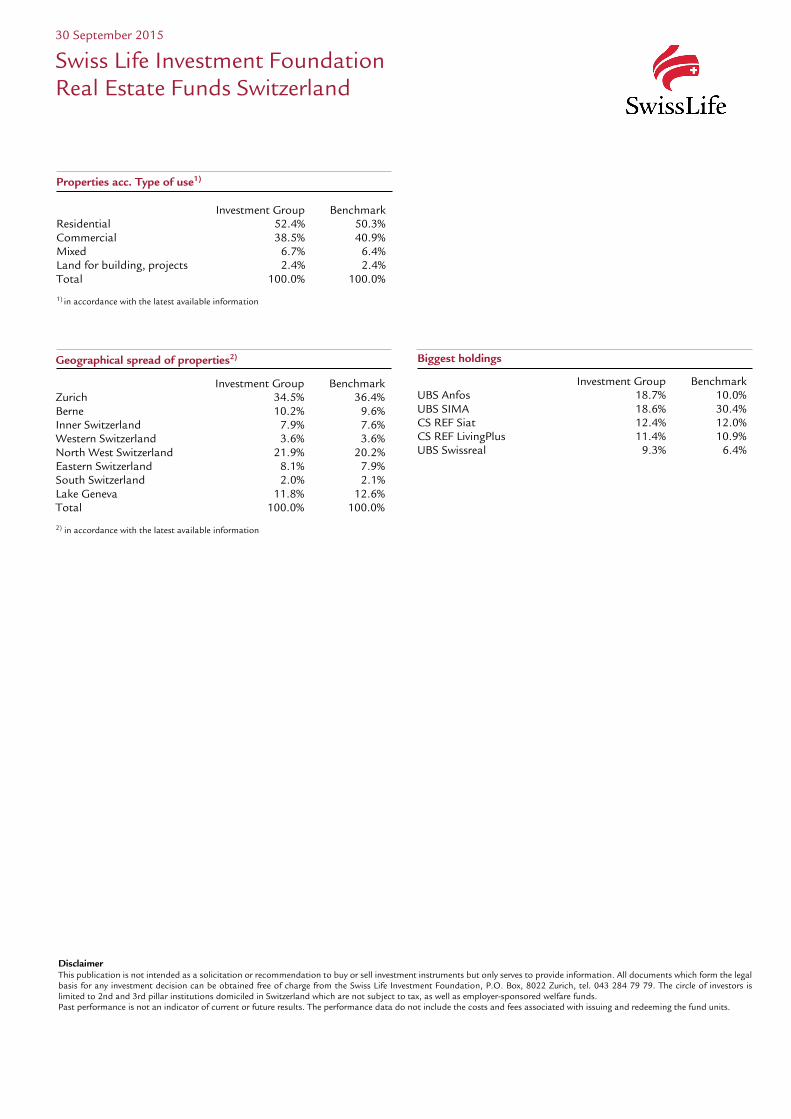
Investment Group Benchmark Zurich 34.5% 36.4% Berne 10.2% 9.6% Inner Switzerland 7.9% 7.6% Western Switzerland 3.6% 3.6% North West Switzerland 21.9% 20.2% Eastern Switzerland 8.1% 7.9% South Switzerland 2.0% 2.1% Lake Geneva 11.8% 12.6% Total 100.0% 100.0% 2) in accordance with the latest available information
Biggest holdings
Investment Group Benchmark UBS Anfos 18.7% 10.0% UBS SIMA 18.6% 30.4% CS REF Siat 12.4% 12.0% CS REF LivingPlus 11.4% 10.9% UBS Swissreal 9.3% 6.4%
30 September 2015
Swiss Life Investment Foundation Real Estate Funds Switzerland
Disclaimer This publication is not intended as a solicitation or recommendation to buy or sell investment instruments but only serves to provide information. All documents which form the legal basis for any investment decision can be obtained free of charge from the Swiss Life Investment Foundation, P.O. Box, 8022 Zurich, tel. 043 284 79 79. The circle of investors is limited to 2nd and 3rd pillar institutions domiciled in Switzerland which are not subject to tax, as well as employer-sponsored welfare funds. Past performance is not an indicator of current or future results. The performance data do not include the costs and fees associated with issuing and redeeming the fund units.
Properties acc. Type of use1) Investment Group Benchmark Residential 52.4% 50.3% Commercial 38.5% 40.9% Mixed 6.7% 6.4% Land for building, projects 2.4% 2.4% Total 100.0% 100.0% 1) in accordance with the latest available information

Indexed performance and performances
90
100
110
120
130
140
2012 2013 2014 20152011
Performance 1M 3M 1Y 3Y 5Y 10Y p.a. since p.a. p.a. p.a. 30.06.03 Investment Group (in %) -0.39 -0.18 1.52 3.77 3.87 2.82 3.12 Benchmark (in %) -0.27 0.14 2.47 4.01 4.00 3.18 3.58 YTD 2014 2013 2012 2011 2010 2009 Investment Group (in %) 0.04 6.39 3.99 6.59 2.38 2.73 7.00 Benchmark (in %) 0.65 6.61 3.82 5.86 3.14 3.01 7.20
30 September 2015
Swiss Life Investment Foundation BVG-Mix 15
Investment strategy
Investment in all investment categories authorised by the BVG (strategic investment allocation: 15%)
Active asset allocation Limit for equities: 19%, limit for foreign
currencies: 15% Average bond rating: at least A Implementation via investment in single-
asset-class investment groups Recommended fluctuation reserves:
around 6.5%
Investment Group Benchmark
Monthly performance
Investment Group Benchmark
Product information
Swiss security number 1564965 ISIN CH0015649657 LEI 549300MHXLKUXBO8KC66 Bloomberg Ticker SWABM15 SW Benchmark customized Currency CHF Launch date 30.06.2003 Initial subscription price 100.00 End of financial year 30.09. Issuing/Redemption daily Deadline 14.00 Asset Manager * - Tactical asset allocation: Swiss Life Asset Management Ltd - Use of homogeneous investment groups:
Diverse acc. to Swiss Life Best Select Invest Plus®
External consultation PPCmetrics provides the following services within the homogeneous investment groups: Advisory services relating to suitable man-date structure, support with selection of suitable asset managers and support with ongoing monitoring of asset managers and evaluation of investment results Price listings Bloomberg: ASSL www.swisslife.ch/anlagestiftung Total expense ratio TERKGAST ** ex ante 0.49% ex post as at 30.09.2015 0.50% Issuing/redemption commission none Distribution policy Profit retention * The selection of managers who Swiss Life Asset
Management Ltd permanently monitors and supports through the process in accordance with objective criteria and best institutional practice
** The total expense ratio TERKGAST includes all costs with the exception of transaction costs and trans-action-related taxes
Statistical information (annualised)
since 1Y 3Y 5Y 10Y 30.09.01 Volatility Investment Group (in %) 2.86 2.29 2.12 2.77 2.60 Volatility Benchmark (in %) 2.51 2.01 1.90 2.65 2.52 Tracking Error ex post (in %) 0.49 0.43 0.43 0.50 0.48 Tracking Error ex ante (in %) 0.50 Information Ratio -1.95 -0.56 -0.28 -0.71 -0.95 Sharpe Ratio 0.71 1.68 1.82 0.75 0.92 Correlation 0.99 0.99 0.98 0.98 0.98 Beta 1.13 1.13 1.10 1.03 1.01 Jensen-Alpha -1.32 -0.75 -0.52 -0.42 -0.48 Maximum Drawdown (in %) -2.94 -3.43 -3.43 -6.99 -6.99 Recovery Period (years) n.a. 0.54 0.54 0.76 0.76
Key figures
31.12.2014 30.09.2015 Assets in CHF (m) 45.5 70.5 Net asset value per entitlement in CHF 145.62 145.68
Portfolio structure by asset allocation
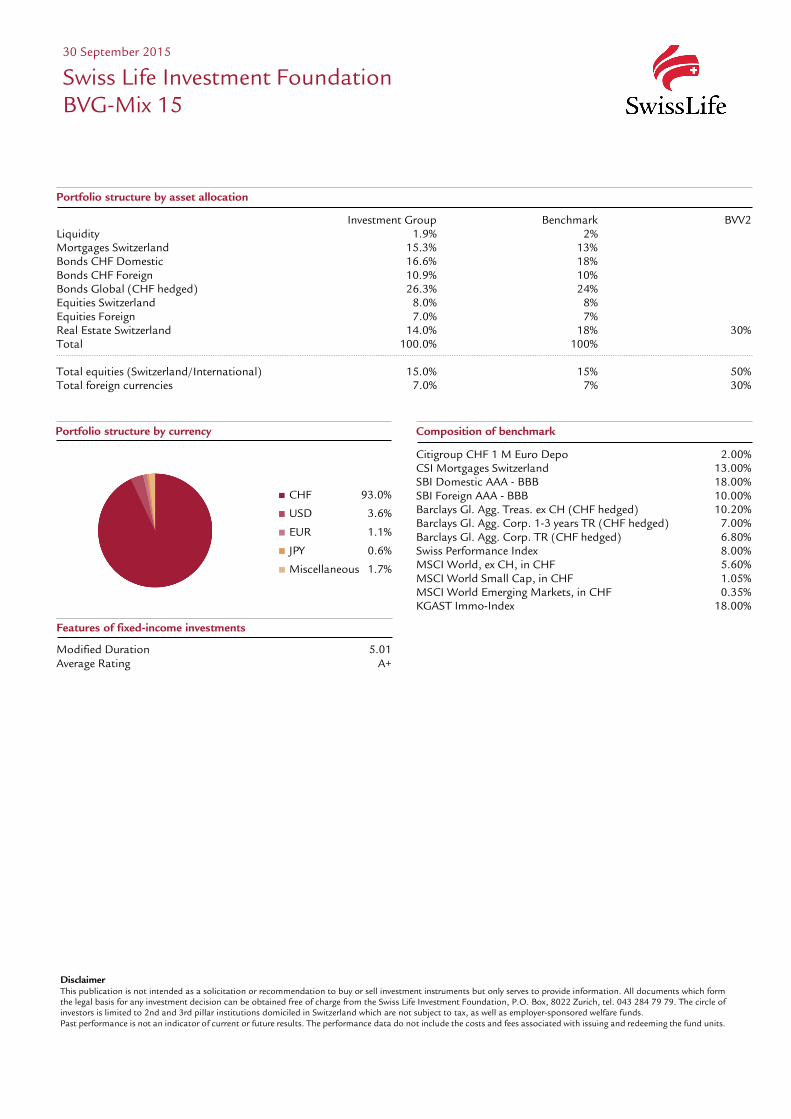
Investment Group Benchmark BVV2 Liquidity 1.9% 2% Mortgages Switzerland 15.3% 13% Bonds CHF Domestic 16.6% 18% Bonds CHF Foreign 10.9% 10% Bonds Global (CHF hedged) 26.3% 24% Equities Switzerland 8.0% 8% Equities Foreign 7.0% 7% Real Estate Switzerland 14.0% 18% 30% Total 100.0% 100% Total equities (Switzerland/International) 15.0% 15% 50% Total foreign currencies 7.0% 7% 30%
Composition of benchmark
Citigroup CHF 1 M Euro Depo 2.00% CSI Mortgages Switzerland 13.00% SBI Domestic AAA - BBB 18.00% SBI Foreign AAA - BBB 10.00% Barclays Gl. Agg. Treas. ex CH (CHF hedged) 10.20% Barclays Gl. Agg. Corp. 1-3 years TR (CHF hedged) 7.00% Barclays Gl. Agg. Corp. TR (CHF hedged) 6.80% Swiss Performance Index 8.00% MSCI World, ex CH, in CHF 5.60% MSCI World Small Cap, in CHF 1.05% MSCI World Emerging Markets, in CHF 0.35% KGAST Immo-Index 18.00%
Disclaimer This publication is not intended as a solicitation or recommendation to buy or sell investment instruments but only serves to provide information. All documents which form the legal basis for any investment decision can be obtained free of charge from the Swiss Life Investment Foundation, P.O. Box, 8022 Zurich, tel. 043 284 79 79. The circle of investors is limited to 2nd and 3rd pillar institutions domiciled in Switzerland which are not subject to tax, as well as employer-sponsored welfare funds. Past performance is not an indicator of current or future results. The performance data do not include the costs and fees associated with issuing and redeeming the fund units.
30 September 2015
Swiss Life Investment Foundation BVG-Mix 15
Portfolio structure by currency
CHF 93.0%
USD 3.6%
EUR 1.1%
JPY 0.6%
Miscellaneous 1.7%
Features of fixed-income investments
Modified Duration 5.01 Average Rating A+
Indexed performance and performances
90
100
110
120
130
140
201320122011 20152014
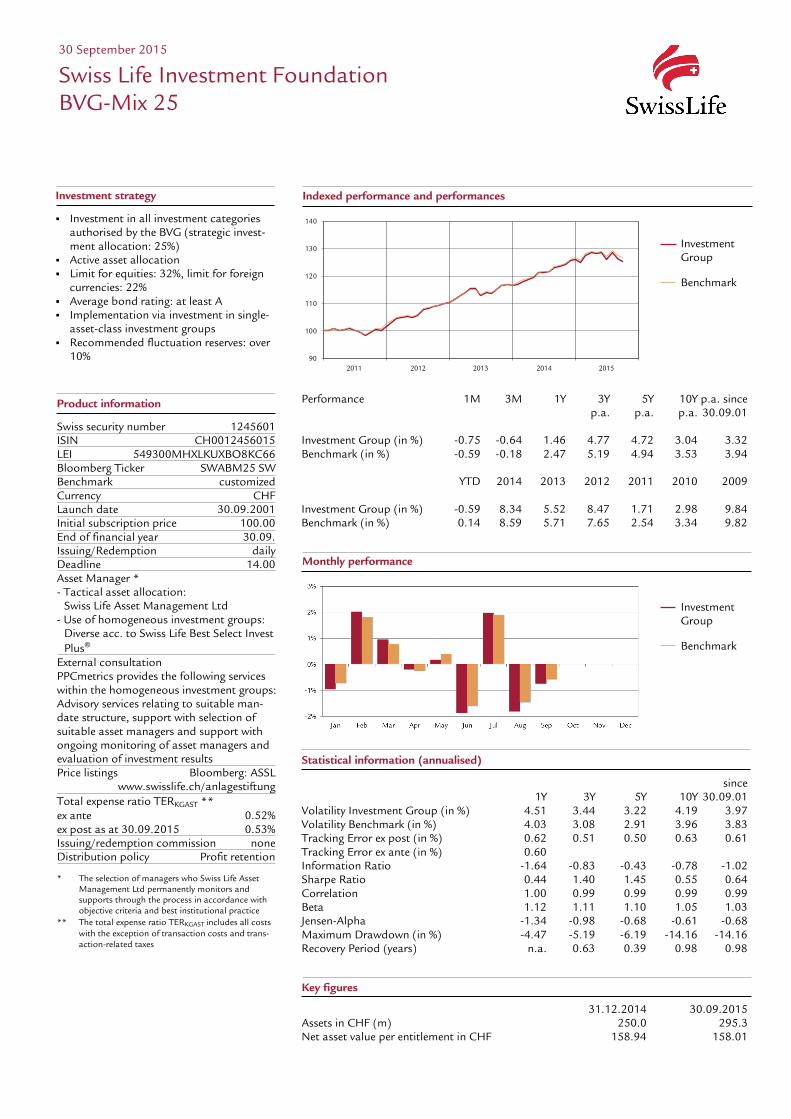
Performance 1M 3M 1Y 3Y 5Y 10Y p.a. since p.a. p.a. p.a. 30.09.01 Investment Group (in %) -0.75 -0.64 1.46 4.77 4.72 3.04 3.32 Benchmark (in %) -0.59 -0.18 2.47 5.19 4.94 3.53 3.94 YTD 2014 2013 2012 2011 2010 2009 Investment Group (in %) -0.59 8.34 5.52 8.47 1.71 2.98 9.84 Benchmark (in %) 0.14 8.59 5.71 7.65 2.54 3.34 9.82
30 September 2015
Swiss Life Investment Foundation BVG-Mix 25
Investment strategy
Investment in all investment categories authorised by the BVG (strategic invest-ment allocation: 25%)
Active asset allocation Limit for equities: 32%, limit for foreign
currencies: 22% Average bond rating: at least A Implementation via investment in single-
asset-class investment groups Recommended fluctuation reserves: over
10%
Investment Group Benchmark
Monthly performance
Investment Group Benchmark
Product information
Swiss security number 1245601 ISIN CH0012456015 LEI 549300MHXLKUXBO8KC66 Bloomberg Ticker SWABM25 SW Benchmark customized Currency CHF Launch date 30.09.2001 Initial subscription price 100.00 End of financial year 30.09. Issuing/Redemption daily Deadline 14.00 Asset Manager * - Tactical asset allocation: Swiss Life Asset Management Ltd - Use of homogeneous investment groups:
Diverse acc. to Swiss Life Best Select Invest Plus®
External consultation PPCmetrics provides the following services within the homogeneous investment groups: Advisory services relating to suitable man-date structure, support with selection of suitable asset managers and support with ongoing monitoring of asset managers and evaluation of investment results Price listings Bloomberg: ASSL www.swisslife.ch/anlagestiftung Total expense ratio TERKGAST ** ex ante 0.52% ex post as at 30.09.2015 0.53% Issuing/redemption commission none Distribution policy Profit retention * The selection of managers who Swiss Life Asset
Management Ltd permanently monitors and supports through the process in accordance with objective criteria and best institutional practice
** The total expense ratio TERKGAST includes all costs with the exception of transaction costs and trans-action-related taxes
Statistical information (annualised)
since 1Y 3Y 5Y 10Y 30.09.01 Volatility Investment Group (in %) 4.51 3.44 3.22 4.19 3.97 Volatility Benchmark (in %) 4.03 3.08 2.91 3.96 3.83 Tracking Error ex post (in %) 0.62 0.51 0.50 0.63 0.61 Tracking Error ex ante (in %) 0.60 Information Ratio -1.64 -0.83 -0.43 -0.78 -1.02 Sharpe Ratio 0.44 1.40 1.45 0.55 0.64 Correlation 1.00 0.99 0.99 0.99 0.99 Beta 1.12 1.11 1.10 1.05 1.03 Jensen-Alpha -1.34 -0.98 -0.68 -0.61 -0.68 Maximum Drawdown (in %) -4.47 -5.19 -6.19 -14.16 -14.16 Recovery Period (years) n.a. 0.63 0.39 0.98 0.98
Key figures
31.12.2014 30.09.2015 Assets in CHF (m) 250.0 295.3 Net asset value per entitlement in CHF 158.94 158.01
Portfolio structure by asset allocation
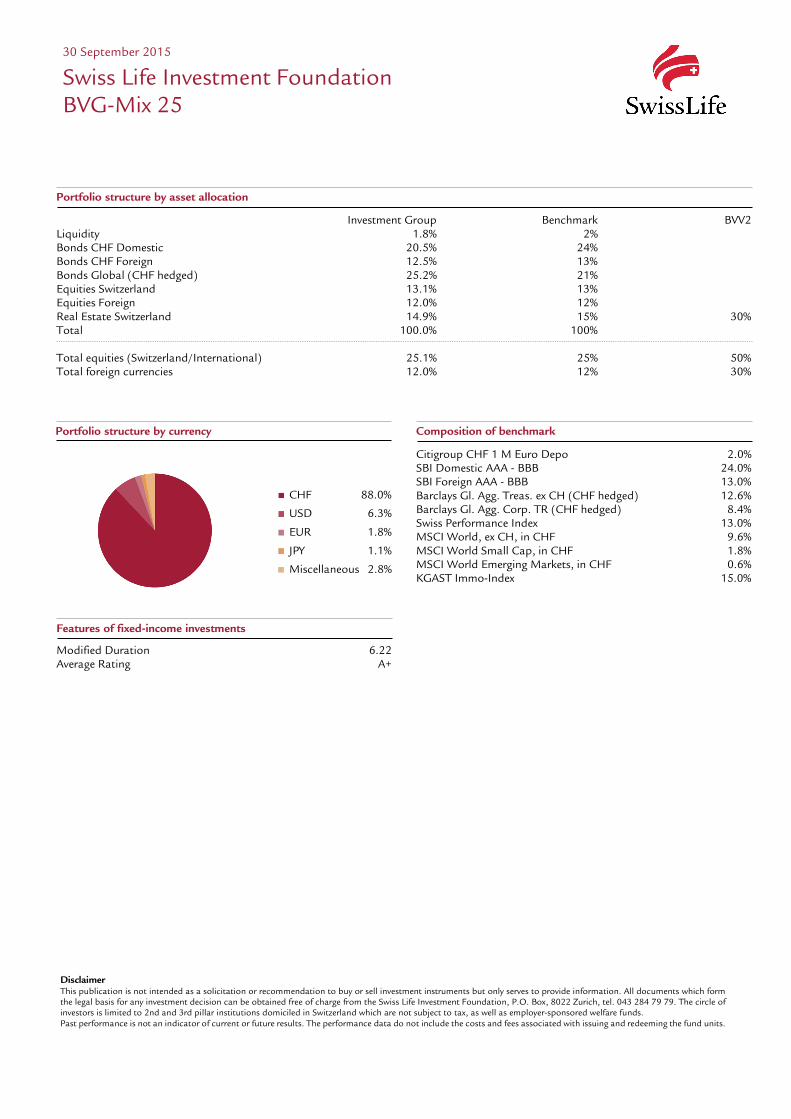
Investment Group Benchmark BVV2 Liquidity 1.8% 2% Bonds CHF Domestic 20.5% 24% Bonds CHF Foreign 12.5% 13% Bonds Global (CHF hedged) 25.2% 21% Equities Switzerland 13.1% 13% Equities Foreign 12.0% 12% Real Estate Switzerland 14.9% 15% 30% Total 100.0% 100% Total equities (Switzerland/International) 25.1% 25% 50% Total foreign currencies 12.0% 12% 30%
Composition of benchmark
Citigroup CHF 1 M Euro Depo 2.0% SBI Domestic AAA - BBB 24.0% SBI Foreign AAA - BBB 13.0% Barclays Gl. Agg. Treas. ex CH (CHF hedged) 12.6% Barclays Gl. Agg. Corp. TR (CHF hedged) 8.4% Swiss Performance Index 13.0% MSCI World, ex CH, in CHF 9.6% MSCI World Small Cap, in CHF 1.8% MSCI World Emerging Markets, in CHF 0.6% KGAST Immo-Index 15.0%
Disclaimer This publication is not intended as a solicitation or recommendation to buy or sell investment instruments but only serves to provide information. All documents which form the legal basis for any investment decision can be obtained free of charge from the Swiss Life Investment Foundation, P.O. Box, 8022 Zurich, tel. 043 284 79 79. The circle of investors is limited to 2nd and 3rd pillar institutions domiciled in Switzerland which are not subject to tax, as well as employer-sponsored welfare funds. Past performance is not an indicator of current or future results. The performance data do not include the costs and fees associated with issuing and redeeming the fund units.
30 September 2015
Swiss Life Investment Foundation BVG-Mix 25
Portfolio structure by currency
CHF 88.0%
USD 6.3%
EUR 1.8%
JPY 1.1%
Miscellaneous 2.8%
Features of fixed-income investments
Modified Duration 6.22 Average Rating A+

Indexed performance and performances
90
100
110
120
130
140
20132012 201520142011
Performance 1M 3M 1Y 3Y 5Y 10Y p.a. since p.a. p.a. p.a. 30.09.01 Investment Group (in %) -1.07 -1.13 0.87 5.60 5.20 3.03 3.33 Benchmark (in %) -0.92 -0.66 1.96 6.01 5.44 3.58 4.01 YTD 2014 2013 2012 2011 2010 2009 Investment Group (in %) -1.27 9.01 7.87 9.58 0.40 2.94 11.56 Benchmark (in %) -0.49 9.36 7.99 8.72 1.23 3.30 11.79
30 September 2015
Swiss Life Investment Foundation BVG-Mix 35
Investment strategy
Investment in all investment categories authorised by the BVG (strategic invest-ment allocation: 35%)
Active asset allocation Limit for equities: 45%, limit for foreign
currencies: 29% Average bond rating: at least A Implementation via investment in single-
asset-class investment groups Recommended fluctuation reserves: over
15%
Investment Group Benchmark
Monthly performance
Investment Group Benchmark
Product information
Swiss security number 1245606 ISIN CH0012456064 LEI 549300MHXLKUXBO8KC66 Bloomberg Ticker SWABM35 SW Benchmark customized Currency CHF Launch date 30.09.2001 Initial subscription price 100.00 End of financial year 30.09. Issuing/Redemption daily Deadline 14.00 Asset Manager * - Tactical asset allocation: Swiss Life Asset Management Ltd - Use of homogeneous investment groups:
Diverse acc. to Swiss Life Best Select Invest Plus®
External consultation PPCmetrics provides the following services within the homogeneous investment groups: Advisory services relating to suitable man-date structure, support with selection of suitable asset managers and support with ongoing monitoring of asset managers and evaluation of investment results Price listings Bloomberg: ASSL www.swisslife.ch/anlagestiftung Total expense ratio TERKGAST ** - ex ante 0.54% - ex post per 30.09.2015 0.55% Issuing/redemption commission none Distribution policy Profit retention * The selection of managers who Swiss Life Asset
Management Ltd permanently monitors and supports through the process in accordance with objective criteria and best institutional practice
** The total expense ratio TERKGAST includes all costs with the exception of transaction costs and trans-action-related taxes
Statistical information (annualised)
since 1Y 3Y 5Y 10Y 30.09.01 Volatility Investment Group (in %) 6.15 4.43 4.19 5.39 5.20 Volatility Benchmark (in %) 5.52 4.00 3.84 5.11 5.05 Tracking Error ex post (in %) 0.74 0.55 0.53 0.67 0.66 Tracking Error ex ante (in %) 0.60 Information Ratio -1.48 -0.75 -0.45 -0.83 -1.02 Sharpe Ratio 0.23 1.27 1.22 0.42 0.49 Correlation 1.00 1.00 1.00 0.99 0.99 Beta 1.11 1.10 1.08 1.05 1.02 Jensen-Alpha -1.36 -1.01 -0.68 -0.66 -0.72 Maximum Drawdown (in %) -5.67 -6.16 -9.99 -21.36 -21.36 Recovery Period (years) n.a. 0.55 0.48 3.06 3.06
Key figures
31.12.2014 30.09.2015 Assets in CHF (m) 92.3 107.4 Net asset value per entitlement in CHF 160.29 158.26

Portfolio structure by asset allocation
Investment Group Benchmark BVV2 Liquidity 1.8% 2% Bonds CHF Domestic 15.0% 20% Bonds CHF Foreign 10.6% 12% Bonds Global (CHF hedged) 23.6% 18% Equities Switzerland 18.1% 18% Equities Foreign 17.0% 17% Real Estate Switzerland 13.9% 13% 30% Total 100.0% 100% Total equities (Switzerland/International) 35.1% 35% 50% Total foreign currencies 17.0% 17% 30%
Composition of benchmark
Citigroup CHF 1 M Euro Depo 2.00% SBI Domestic AAA - BBB 20.00% SBI Foreign AAA - BBB 12.00% Barclays Gl. Agg. Treas. ex CH (CHF hedged) 10.80% Barclays Gl. Agg. Corp. TR (CHF hedged) 7.20% Swiss Performance Index 18.00% MSCI World, ex CH, in CHF 13.60% MSCI World Small Cap, in CHF 2.55% MSCI World Emerging Markets, in CHF 0.85% KGAST Immo-Index 13.00%
Disclaimer This publication is not intended as a solicitation or recommendation to buy or sell investment instruments but only serves to provide information. All documents which form the legal basis for any investment decision can be obtained free of charge from the Swiss Life Investment Foundation, P.O. Box, 8022 Zurich, tel. 043 284 79 79. The circle of investors is limited to 2nd and 3rd pillar institutions domiciled in Switzerland which are not subject to tax, as well as employer-sponsored welfare funds. Past performance is not an indicator of current or future results. The performance data do not include the costs and fees associated with issuing and redeeming the fund units.
30 September 2015
Swiss Life Investment Foundation BVG-Mix 35
Portfolio structure by currency
CHF 83.0%
USD 8.9%
EUR 2.6%
JPY 1.5%
Miscellaneous 4.0%
Features of fixed-income investments
Modified Duration 6.06 Average Rating A+
Indexed performance and performances
90
100
110
120
130
140
20132012 201520142011
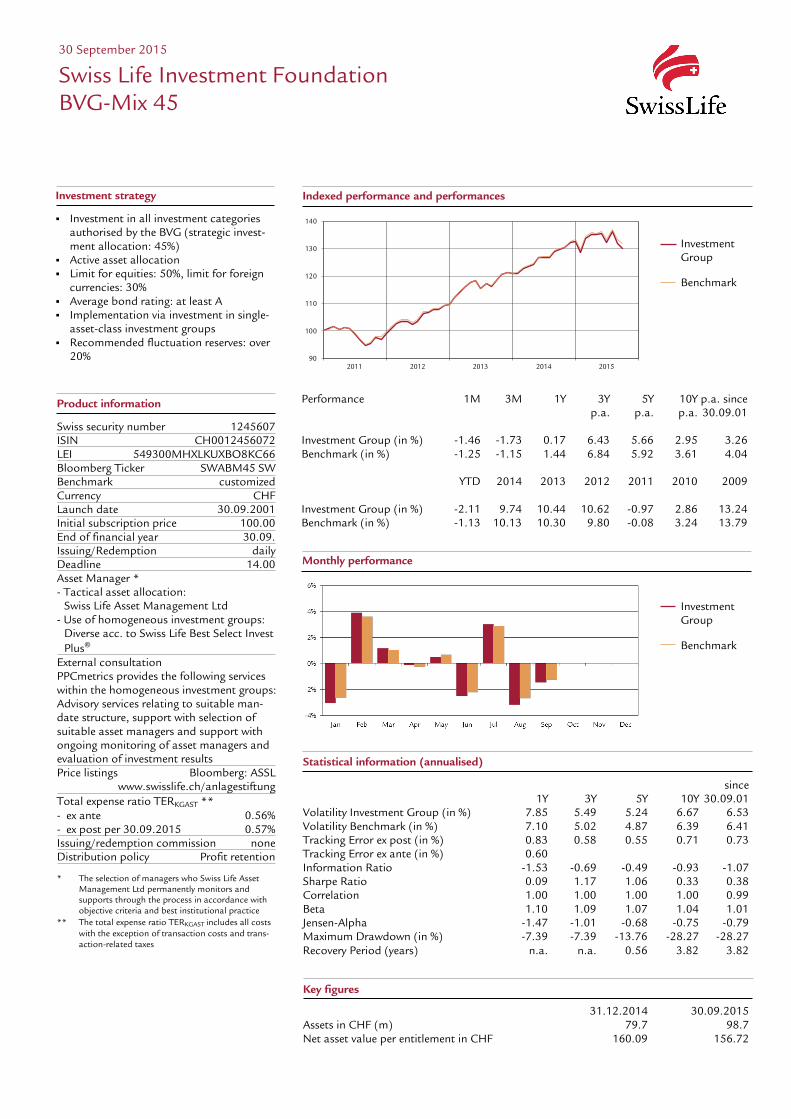
Performance 1M 3M 1Y 3Y 5Y 10Y p.a. since p.a. p.a. p.a. 30.09.01 Investment Group (in %) -1.46 -1.73 0.17 6.43 5.66 2.95 3.26 Benchmark (in %) -1.25 -1.15 1.44 6.84 5.92 3.61 4.04 YTD 2014 2013 2012 2011 2010 2009 Investment Group (in %) -2.11 9.74 10.44 10.62 -0.97 2.86 13.24 Benchmark (in %) -1.13 10.13 10.30 9.80 -0.08 3.24 13.79
30 September 2015
Swiss Life Investment Foundation BVG-Mix 45
Investment strategy
Investment in all investment categories authorised by the BVG (strategic invest-ment allocation: 45%)
Active asset allocation Limit for equities: 50%, limit for foreign
currencies: 30% Average bond rating: at least A Implementation via investment in single-
asset-class investment groups Recommended fluctuation reserves: over
20%
Investment Group Benchmark
Monthly performance
Investment Group Benchmark
Product information
Swiss security number 1245607 ISIN CH0012456072 LEI 549300MHXLKUXBO8KC66 Bloomberg Ticker SWABM45 SW Benchmark customized Currency CHF Launch date 30.09.2001 Initial subscription price 100.00 End of financial year 30.09. Issuing/Redemption daily Deadline 14.00 Asset Manager * - Tactical asset allocation: Swiss Life Asset Management Ltd - Use of homogeneous investment groups:
Diverse acc. to Swiss Life Best Select Invest Plus®
External consultation PPCmetrics provides the following services within the homogeneous investment groups: Advisory services relating to suitable man-date structure, support with selection of suitable asset managers and support with ongoing monitoring of asset managers and evaluation of investment results Price listings Bloomberg: ASSL www.swisslife.ch/anlagestiftung Total expense ratio TERKGAST ** - ex ante 0.56% - ex post per 30.09.2015 0.57% Issuing/redemption commission none Distribution policy Profit retention * The selection of managers who Swiss Life Asset
Management Ltd permanently monitors and supports through the process in accordance with objective criteria and best institutional practice
** The total expense ratio TERKGAST includes all costs with the exception of transaction costs and trans-action-related taxes
Statistical information (annualised)
since 1Y 3Y 5Y 10Y 30.09.01 Volatility Investment Group (in %) 7.85 5.49 5.24 6.67 6.53 Volatility Benchmark (in %) 7.10 5.02 4.87 6.39 6.41 Tracking Error ex post (in %) 0.83 0.58 0.55 0.71 0.73 Tracking Error ex ante (in %) 0.60 Information Ratio -1.53 -0.69 -0.49 -0.93 -1.07 Sharpe Ratio 0.09 1.17 1.06 0.33 0.38 Correlation 1.00 1.00 1.00 1.00 0.99 Beta 1.10 1.09 1.07 1.04 1.01 Jensen-Alpha -1.47 -1.01 -0.68 -0.75 -0.79 Maximum Drawdown (in %) -7.39 -7.39 -13.76 -28.27 -28.27 Recovery Period (years) n.a. n.a. 0.56 3.82 3.82
Key figures
31.12.2014 30.09.2015 Assets in CHF (m) 79.7 98.7 Net asset value per entitlement in CHF 160.09 156.72
Portfolio structure by asset allocation
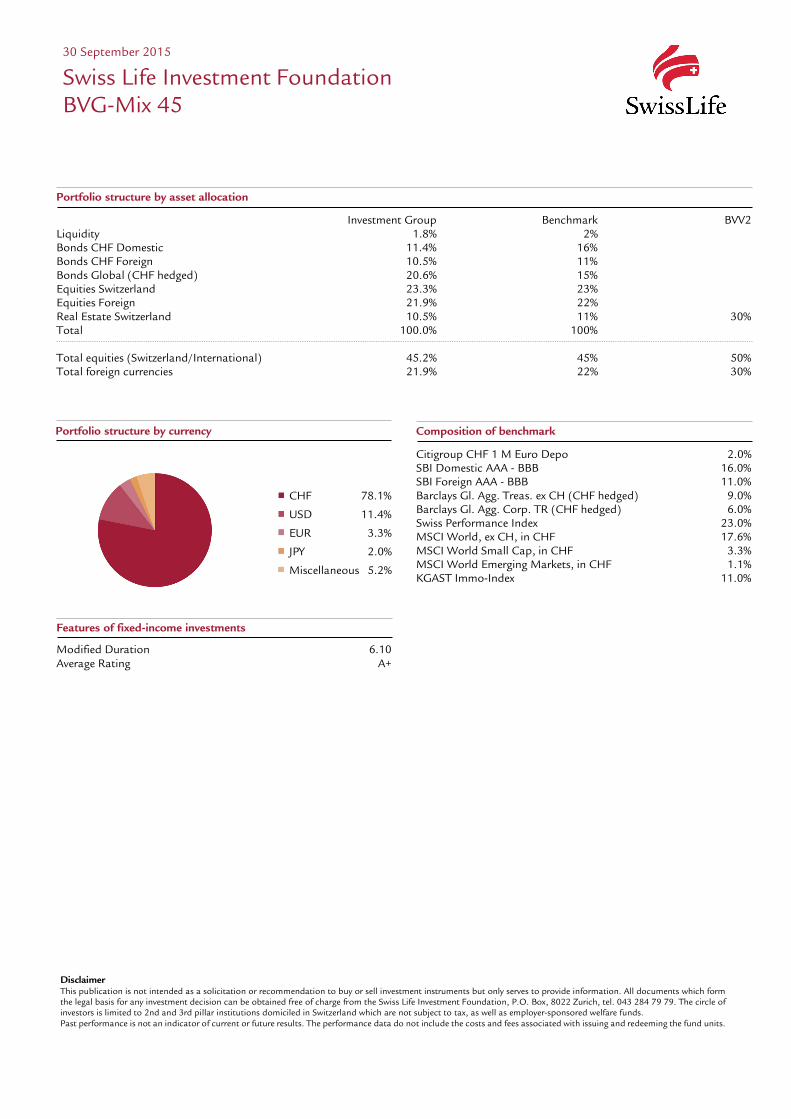
Investment Group Benchmark BVV2 Liquidity 1.8% 2% Bonds CHF Domestic 11.4% 16% Bonds CHF Foreign 10.5% 11% Bonds Global (CHF hedged) 20.6% 15% Equities Switzerland 23.3% 23% Equities Foreign 21.9% 22% Real Estate Switzerland 10.5% 11% 30% Total 100.0% 100% Total equities (Switzerland/International) 45.2% 45% 50% Total foreign currencies 21.9% 22% 30%
Composition of benchmark
Citigroup CHF 1 M Euro Depo 2.0% SBI Domestic AAA - BBB 16.0% SBI Foreign AAA - BBB 11.0% Barclays Gl. Agg. Treas. ex CH (CHF hedged) 9.0% Barclays Gl. Agg. Corp. TR (CHF hedged) 6.0% Swiss Performance Index 23.0% MSCI World, ex CH, in CHF 17.6% MSCI World Small Cap, in CHF 3.3% MSCI World Emerging Markets, in CHF 1.1% KGAST Immo-Index 11.0%
Disclaimer This publication is not intended as a solicitation or recommendation to buy or sell investment instruments but only serves to provide information. All documents which form the legal basis for any investment decision can be obtained free of charge from the Swiss Life Investment Foundation, P.O. Box, 8022 Zurich, tel. 043 284 79 79. The circle of investors is limited to 2nd and 3rd pillar institutions domiciled in Switzerland which are not subject to tax, as well as employer-sponsored welfare funds. Past performance is not an indicator of current or future results. The performance data do not include the costs and fees associated with issuing and redeeming the fund units.
30 September 2015
Swiss Life Investment Foundation BVG-Mix 45
Portfolio structure by currency
CHF 78.1%
USD 11.4%
EUR 3.3%
JPY 2.0%
Miscellaneous 5.2%
Features of fixed-income investments
Modified Duration 6.10 Average Rating A+
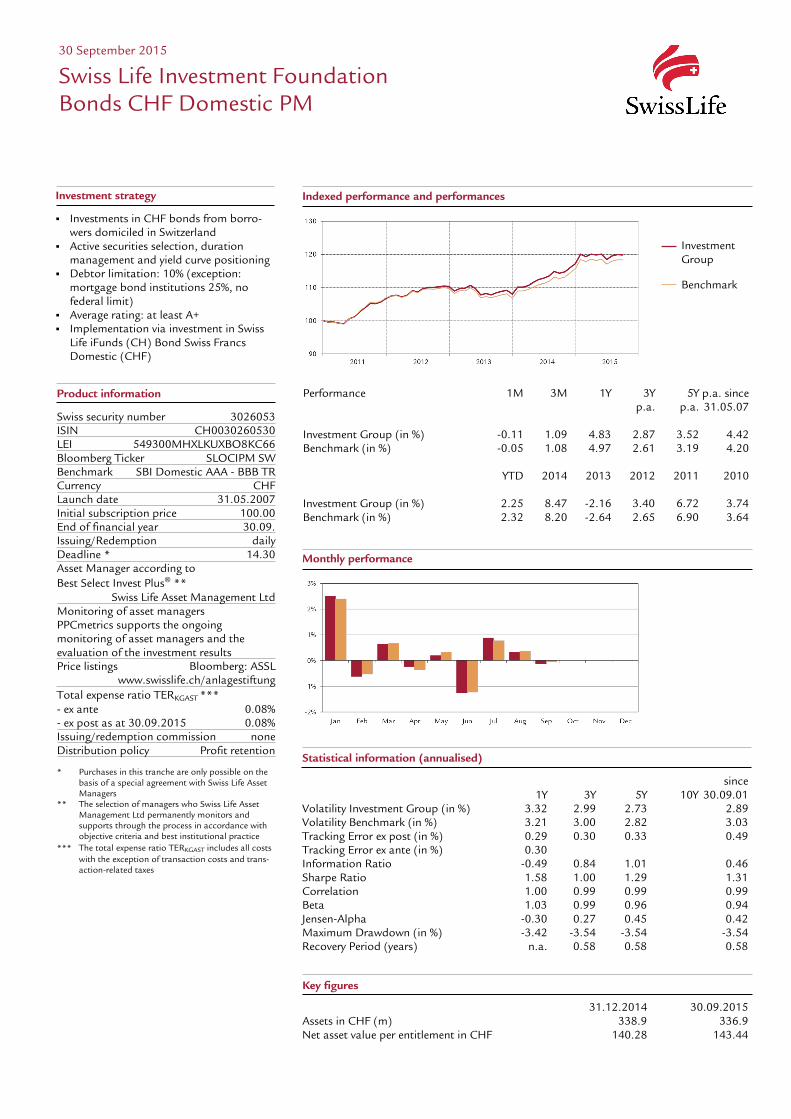
Performance 1M 3M 1Y 3Y 5Y p.a. since p.a. p.a. 31.05.07 Investment Group (in %) -0.11 1.09 4.83 2.87 3.52 4.42 Benchmark (in %) -0.05 1.08 4.97 2.61 3.19 4.20 YTD 2014 2013 2012 2011 2010 Investment Group (in %) 2.25 8.47 -2.16 3.40 6.72 3.74 Benchmark (in %) 2.32 8.20 -2.64 2.65 6.90 3.64
30 September 2015
Swiss Life Investment Foundation Bonds CHF Domestic PM
Investment strategy
Investments in CHF bonds from borro-wers domiciled in Switzerland
Active securities selection, duration management and yield curve positioning
Debtor limitation: 10% (exception: mortgage bond institutions 25%, no federal limit)
Average rating: at least A+ Implementation via investment in Swiss
Life iFunds (CH) Bond Swiss Francs Domestic (CHF)
8.47 -2.16
Indexed performance and performances
Investment Group Benchmark
Monthly performance
Product information
Swiss security number 3026053 ISIN CH0030260530 LEI 549300MHXLKUXBO8KC66 Bloomberg Ticker SLOCIPM SW Benchmark SBI Domestic AAA - BBB TR Currency CHF Launch date 31.05.2007 Initial subscription price 100.00 End of financial year 30.09. Issuing/Redemption daily Deadline * 14.30 Asset Manager according to Best Select Invest Plus® ** Swiss Life Asset Management Ltd Monitoring of asset managers PPCmetrics supports the ongoing monitoring of asset managers and the evaluation of the investment results Price listings Bloomberg: ASSL www.swisslife.ch/anlagestiftung Total expense ratio TERKGAST *** - ex ante 0.08% - ex post as at 30.09.2015 0.08% Issuing/redemption commission none Distribution policy Profit retention * Purchases in this tranche are only possible on the
basis of a special agreement with Swiss Life Asset Managers
** The selection of managers who Swiss Life Asset Management Ltd permanently monitors and supports through the process in accordance with objective criteria and best institutional practice
*** The total expense ratio TERKGAST includes all costs with the exception of transaction costs and trans-action-related taxes
Investment Group Benchmark
Statistical information (annualised)
since 1Y 3Y 5Y 10Y 30.09.01 Volatility Investment Group (in %) 3.32 2.99 2.73 2.89 Volatility Benchmark (in %) 3.21 3.00 2.82 3.03 Tracking Error ex post (in %) 0.29 0.30 0.33 0.49 Tracking Error ex ante (in %) 0.30 Information Ratio -0.49 0.84 1.01 0.46 Sharpe Ratio 1.58 1.00 1.29 1.31 Correlation 1.00 0.99 0.99 0.99 Beta 1.03 0.99 0.96 0.94 Jensen-Alpha -0.30 0.27 0.45 0.42 Maximum Drawdown (in %) -3.42 -3.54 -3.54 -3.54 Recovery Period (years) n.a. 0.58 0.58 0.58
Key figures
31.12.2014 30.09.2015 Assets in CHF (m) 338.9 336.9 Net asset value per entitlement in CHF 140.28 143.44
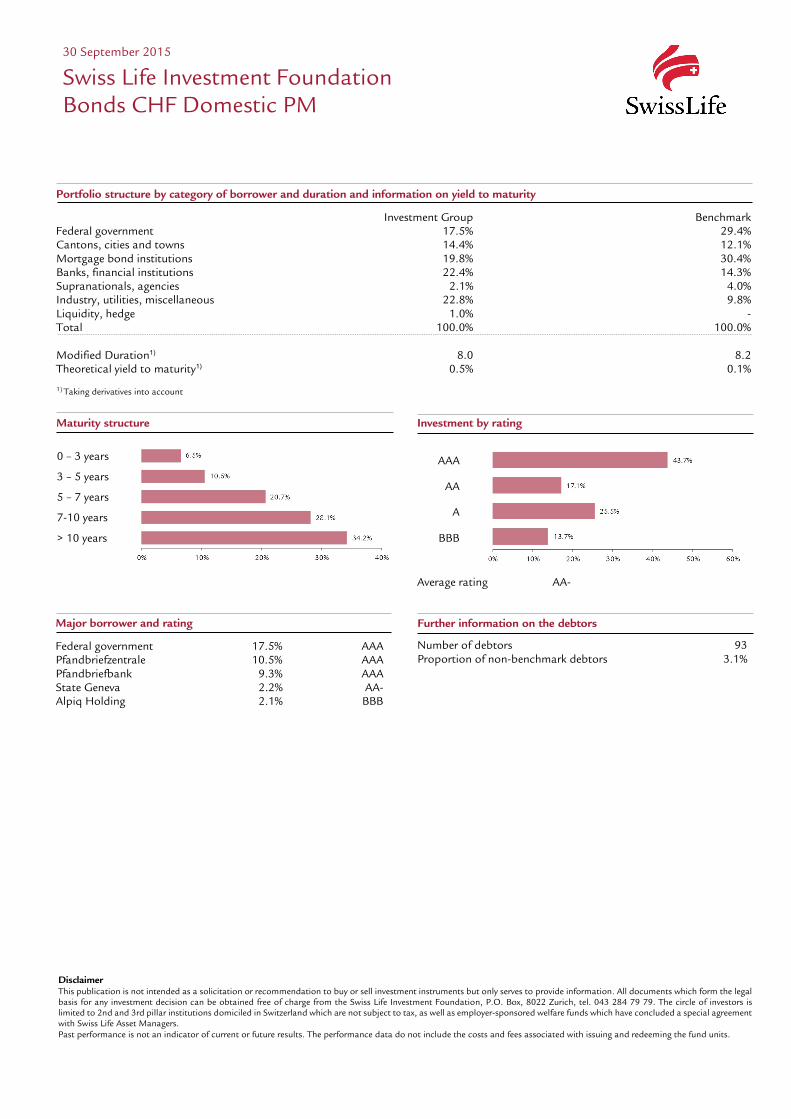
Portfolio structure by category of borrower and duration and information on yield to maturity
Investment Group Benchmark Federal government 17.5% 29.4% Cantons, cities and towns 14.4% 12.1% Mortgage bond institutions 19.8% 30.4% Banks, financial institutions 22.4% 14.3% Supranationals, agencies 2.1% 4.0% Industry, utilities, miscellaneous 22.8% 9.8% Liquidity, hedge 1.0% - Total 100.0% 100.0% Modified Duration1) 8.0 8.2 Theoretical yield to maturity1) 0.5% 0.1% 1) Taking derivatives into account
Disclaimer This publication is not intended as a solicitation or recommendation to buy or sell investment instruments but only serves to provide information. All documents which form the legal basis for any investment decision can be obtained free of charge from the Swiss Life Investment Foundation, P.O. Box, 8022 Zurich, tel. 043 284 79 79. The circle of investors is limited to 2nd and 3rd pillar institutions domiciled in Switzerland which are not subject to tax, as well as employer-sponsored welfare funds which have concluded a special agreement with Swiss Life Asset Managers. Past performance is not an indicator of current or future results. The performance data do not include the costs and fees associated with issuing and redeeming the fund units.
30 September 2015
Swiss Life Investment Foundation Bonds CHF Domestic PM
Investment by rating
AAA
AA
A
BBB
Average rating AA-
Maturity structure
0 – 3 years
3 – 5 years
5 – 7 years
7-10 years
> 10 years
Major borrower and rating
Federal government 17.5% AAA Pfandbriefzentrale 10.5% AAA Pfandbriefbank 9.3% AAA State Geneva 2.2% AA- Alpiq Holding 2.1% BBB
Further information on the debtors
Number of debtors 93 Proportion of non-benchmark debtors 3.1%

Performance 1M 3M 1Y 3Y 5Y p.a. since p.a. p.a. 31.05.07 Investment Group (in %) -0.21 -0.01 2.34 2.49 3.32 3.46 Benchmark (in %) -0.12 0.30 2.38 2.24 2.80 3.35 YTD 2014 2013 2012 2011 2010 Investment Group (in %) 0.96 4.95 0.90 7.43 2.99 4.37 Benchmark (in %) 1.04 4.78 0.38 6.01 2.73 3.67
30 September 2015
Swiss Life Investment Foundation Bonds CHF Foreign PM
Investment strategy
Investments in CHF bonds from borro-wers mainly domiciled abroad
Active securities selection, duration management and yield curve positioning
Debtor limitation: 10% (exception: if min. 8% representation in the benchmark, max. 5% points above the benchmark weighting)
Non-benchmarked debt: max. 20% Average rating: at least A+ Implementation via investment in Swiss
Life iFunds (CH) Bond Swiss Francs Foreign (CHF)
4.95 0.90
Indexed performance and performances
Investment Group Benchmark
Monthly performance
Product information
Swiss security number 3026054 ISIN CH0030260548 LEI 549300MHXLKUXBO8KC66 Bloomberg Ticker SLOCAPM SW Benchmark SBI Foreign AAA - BBB TR Currency CHF Launch date 31.05.2007 Initial subscription price 100.00 End of financial year 30.09. Issuing/Redemption daily Deadline * 14.30 Asset Manager according to Best Select Invest Plus® ** Swiss Life Asset Management Ltd Monitoring of asset managers PPCmetrics supports the ongoing monitoring of asset managers and the evaluation of the investment results Price listings Bloomberg: ASSL www.swisslife.ch/anlagestiftung Total expense ratio TERKGAST *** - ex ante 0.08% - ex post as at 30.09.2015 0.08% Issuing/redemption commission none Distribution policy Profit retention * Purchases in this tranche are only possible on the
basis of a special agreement with Swiss Life Asset Managers
** The selection of managers who Swiss Life Asset Management Ltd permanently monitors and supports through the process in accordance with objective criteria and best institutional practice
*** The total expense ratio TERKGAST includes all costs with the exception of transaction costs and trans-action-related taxes
Investment Group Benchmark
Statistical information (annualised)
since 1Y 3Y 5Y 10Y 30.09.01 Volatility Investment Group (in %) 1.74 1.76 1.88 3.34 Volatility Benchmark (in %) 1.76 1.73 1.92 3.05 Tracking Error ex post (in %) 0.53 0.46 0.51 1.34 Tracking Error ex ante (in %) 0.50 Information Ratio -0.08 0.54 1.01 0.08 Sharpe Ratio 1.63 1.49 1.76 0.86 Correlation 0.95 0.97 0.96 0.92 Beta 0.95 0.98 0.94 1.00 Jensen-Alpha 0.11 0.28 0.66 0.09 Maximum Drawdown (in %) -1.78 -2.21 -2.21 -9.04 Recovery Period (years) n.a. 0.41 0.41 0.68
Key figures
31.12.2014 30.09.2015 Assets in CHF (m) 161.0 177.8 Net asset value per entitlement in CHF 131.48 132.74
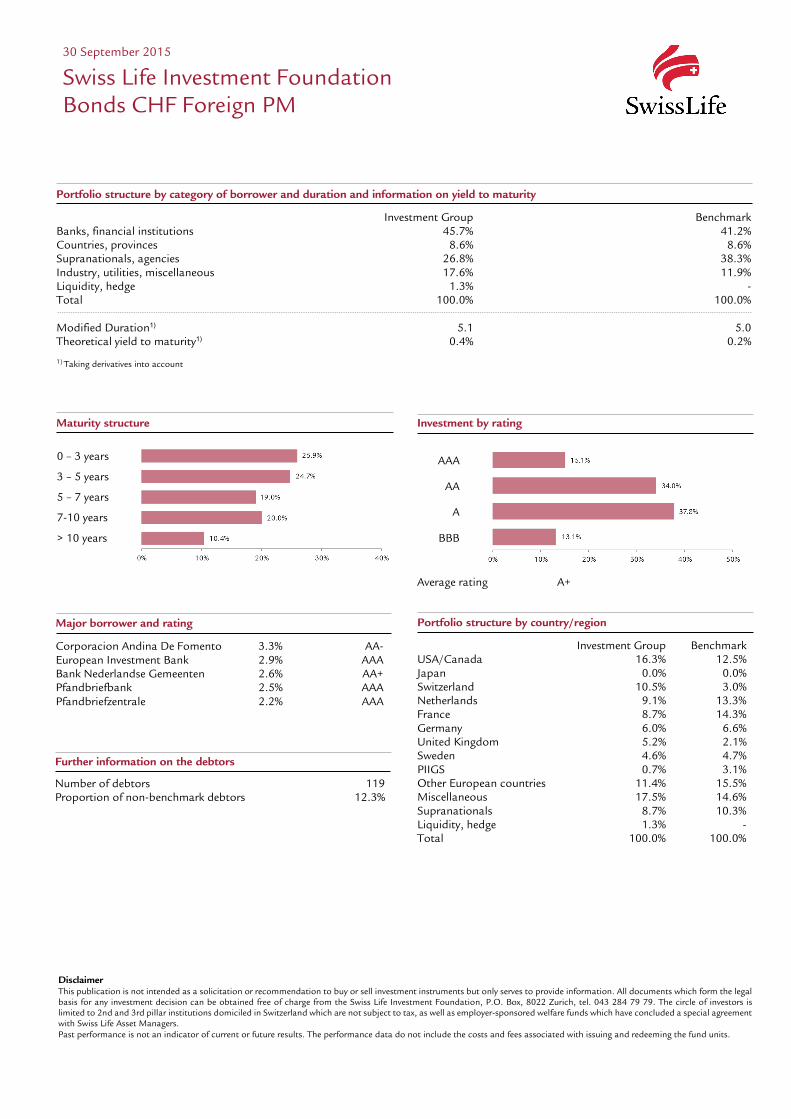
Portfolio structure by category of borrower and duration and information on yield to maturity
Investment Group Benchmark Banks, financial institutions 45.7% 41.2% Countries, provinces 8.6% 8.6% Supranationals, agencies 26.8% 38.3% Industry, utilities, miscellaneous 17.6% 11.9% Liquidity, hedge 1.3% - Total 100.0% 100.0% Modified Duration1) 5.1 5.0 Theoretical yield to maturity1) 0.4% 0.2% 1) Taking derivatives into account
Disclaimer This publication is not intended as a solicitation or recommendation to buy or sell investment instruments but only serves to provide information. All documents which form the legal basis for any investment decision can be obtained free of charge from the Swiss Life Investment Foundation, P.O. Box, 8022 Zurich, tel. 043 284 79 79. The circle of investors is limited to 2nd and 3rd pillar institutions domiciled in Switzerland which are not subject to tax, as well as employer-sponsored welfare funds which have concluded a special agreement with Swiss Life Asset Managers. Past performance is not an indicator of current or future results. The performance data do not include the costs and fees associated with issuing and redeeming the fund units.
30 September 2015
Swiss Life Investment Foundation Bonds CHF Foreign PM
Investment by rating
AAA
AA
A
BBB
Average rating A+
Maturity structure
0 – 3 years
3 – 5 years
5 – 7 years
7-10 years
> 10 years
Major borrower and rating
Corporacion Andina De Fomento 3.3% AA- European Investment Bank 2.9% AAA Bank Nederlandse Gemeenten 2.6% AA+ Pfandbriefbank 2.5% AAA Pfandbriefzentrale 2.2% AAA
Portfolio structure by country/region
Investment Group Benchmark USA/Canada 16.3% 12.5% Japan 0.0% 0.0% Switzerland 10.5% 3.0% Netherlands 9.1% 13.3% France 8.7% 14.3% Germany 6.0% 6.6% United Kingdom 5.2% 2.1% Sweden 4.6% 4.7% PIIGS 0.7% 3.1% Other European countries 11.4% 15.5% Miscellaneous 17.5% 14.6% Supranationals 8.7% 10.3% Liquidity, hedge 1.3% - Total 100.0% 100.0%
Further information on the debtors
Number of debtors 119 Proportion of non-benchmark debtors 12.3%

Performance 1M 3M 1Y 3Y 5Y p.a. since p.a. p.a. 31.05.07 Investment Group (in %) -0.12 0.38 0.69 2.40 2.79 2.45 Benchmark (in %) 0.53 0.99 1.73 2.54 2.19 2.18 YTD 2014 2013 2012 2011 2010 Investment Group (in %) -1.40 8.00 -0.59 8.82 5.91 -4.37 Benchmark (in %) -0.48 7.61 -0.33 6.47 4.65 -5.20
30 September 2015
Swiss Life Investment Foundation Bonds Global PM (CHF hedged)
Investment strategy
Investments in foreign-currency bonds from borrowers domiciled in Switzerland or abroad (since 1.1.2011 CHF hedged)
Active bond selection, duration manage-ment and yield curve positioning
Debtor limitation: 10% (exception: if min. 8% representation in the benchmark, max. 5% points above the benchmark weighting)
Non-benchmarked debt: max. 10% Average rating: at least A Implementation via investment in Swiss
Life iFunds (CH) Bond Global Government+ (CHF hedged) and Swiss Life iFunds (CH) Bond Global Corporates (CHF hedged)
8.00 -0.59
Indexed performance and performances
Monthly performance
Investment Group Benchmark
Investment Group Benchmark
Product information
Swiss security number 3026055 ISIN CH0030260555 LEI 549300MHXLKUXBO8KC66 Bloomberg Ticker SLOFGPM SW Benchmark * 40% Barclays Gl. Agg. Corp. 60% Barclays Gl. Agg. Treas. ex CH (Indices CHF hedged) Currency CHF Launch date 31.05.2007 Initial subscription price 100.00 End of financial year 30.09. Issuing/Redemption daily Deadline ** 14.30 Asset Manager according to Best Select Invest Plus® *** Swiss Life Asset Management Ltd Monitoring of asset managers PPCmetrics supports the ongoing monitoring of asset managers and the evaluation of the investment results Price listing Bloomberg: ASSL www.swisslife.ch/anlagestiftung Total expense ratio TERKGAST **** - ex ante 0.15% - ex post as at 30.09.2015 0.15% Issuing/redemption commission none Distribution policy Profit retention * To 30.06.12 60% Citigroup WGBI, ex CH (CHF
hedged) ** Purchases in this tranche are only possible on the
basis of a special agreement with Swiss Life Asset Managers
*** The selection of managers who Swiss Life Asset Management Ltd permanently monitors and supports through the process in accordance with objective criteria and best institutional practice
**** The total expense ratio TERKGAST includes all costs with the exception of transaction costs and trans-action-related taxes
Statistical information (annualised)
since 1Y 3Y 5Y 10Y 30.09.01 Volatility Investment Group (in %) 3.54 3.29 4.40 6.74 Volatility Benchmark (in %) 3.47 2.99 4.06 6.67 Tracking Error ex post (in %) 0.78 0.81 0.96 1.92 Tracking Error ex ante (in %) 0.90 Information Ratio -1.34 -0.17 0.62 0.14 Sharpe Ratio 0.35 0.77 0.64 0.28 Correlation 0.98 0.97 0.98 0.96 Beta 1.00 1.07 1.06 0.97 Jensen-Alpha -1.02 -0.32 0.45 0.31 Maximum Drawdown (in %) -4.14 -4.91 -10.05 -14.13 Recovery Period (years) n.a. 0.79 1.31 2.93
Key figures
31.12.2014 30.09.2015 Assets in CHF (m) 102.3 110.0 Net asset value per entitlement in CHF 124.07 122.33

Maturity structure
0 – 3 years
3 – 5 years
5 – 7 years
7-10 years
> 10 years
Portfolio structure by country/region
Investment Group Benchmark USA/Canada 38.7% 40.8% Japan 9.7% 17.5% United Kingdom 9.2% 8.5% PIIGS 5.2% 7.8% Miscellaneous 8.0% 7.1% France 3.9% 6.3% Germany 5.1% 4.7% Other European countries 7.0% 3.4% Netherlands 2.8% 2.3% Switzerland 1.8% 0.9% Sweden 1.9% 0.7% Supranationals 1.8% - Liquidity, hedge 4.9% - Total 100.0% 100.0%
Portfolio structure by category of borrower
Investment Group Benchmark Industry 27.3% 20.9% Utilities 2.0% 3.1% Banks, financial institutions 16.3% 16.0% Government, provinces, agencies 47.6% 60.0% Supranationals 1.8% 0.0% Liquidity 6.4% - Currency hedging -1.4% - Total 100.0% 100.0%
Duration and information on yield to maturity
Investment Group Benchmark Percentage Duration Percentage Duration USD 48.2% 6.2 43.3% 6.0 EUR 27.9% 6.6 25.0% 6.2 JPY 9.8% 5.0 17.0% 6.4 GBP 7.9% 8.3 7.6% 9.4 Miscellaneous 6.2% 0.6 7.1% 5.3 Total 100.0% 100.0% Modified Duration1) 6.2 6.8 Theoretical yield to maturity1) 2.2% 1.8%
1) before currency hedging, taking derivatives into account
Disclaimer This publication is not intended as a solicitation or recommendation to buy or sell investment instruments but only serves to provide information. All documents which form the legal basis for any investment decision can be obtained free of charge from the Swiss Life Investment Foundation, P.O. Box, 8022 Zurich, tel. 043 284 79 79. The circle of investors is limited to 2nd and 3rd pillar institutions domiciled in Switzerland which are not subject to tax, as well as employer-sponsored welfare funds which have concluded a special agreement with Swiss Life Asset Managers. Past performance is not an indicator of current or future results. The performance data do not include the costs and fees associated with issuing and redeeming the fund units.
Major borrower and rating
United States Treasury Note/Bond 12.9% AA+ Japan 8.8% A+ United Kingdom 3.8% AA+ Bundesrepublik Deutschland 1.8% AAA Kingdom of Spain 1.8% BBB
30 September 2015
Swiss Life Investment Foundation Bonds Global PM (CHF hedged)
Investment by rating
AAA
AA
A
BBB
Average rating A
Further information on the debtors
Number of debtors 244 Proportion of non-benchmark debtors 6.5%

Performance 1M 3M 1Y 3Y 5Y p.a. since p.a. p.a. 14.12.10 Investment Group (in %) 0.26 1.34 2.01 2.56 3.60 Benchmark (in %) 0.78 1.57 2.75 2.70 3.14 YTD 2014 2013 2012 2011 2010 Investment Group (in %) -0.53 8.68 -1.04 5.65 6.57 Benchmark (in %) 0.16 7.85 -0.32 3.97 5.12
Monthly performance
-2%
-1%
0%
1%
2%
3%
Jan Feb Mar Apr May Jun Jul Aug Sep Oct Nov Dec
30 September 2015
Swiss Life Investment Foundation Bonds Global Governments+ PM (CHF hedged)
Investment strategy
Investments in foreign-currency debt securities of governments and govern-ment-like institutions
Active bond selection, duration manage-ment and yield curve positioning
Debtor limitation: 10% (exception: if min. 8% representation in the benchmark, max. 5% points above the benchmark weighting)
Non-benchmarked debt: max. 10% Average rating: at least AA– Foreign currency risks will be at least 90%
hedged against Swiss francs Implementation via investment in Swiss
Life iFunds (CH) Bond Global Government+ (CHF hedged)
8.68 -1.04
Indexed performance and performances
Investment Group Benchmark
Product information
Swiss security number 11956107 ISIN CH0119561071 LEI 549300MHXLKUXBO8KC66 Bloomberg Ticker SWLGSPM SW Benchmark * Barclays Gl. Agg. Treas. ex CH (CHF hedged) Currency CHF Launch date 14.12.2010 Initial subscription price 100.00 End of financial year 30.09. Issuing/Redemption daily Deadline ** 14.30 Asset Manager according to Best Select Invest Plus® *** Swiss Life Asset Management Ltd Monitoring of asset managers PPCmetrics supports the ongoing monitoring of asset managers and the evaluation of the investment results Price listings Bloomberg: ASSL www.swisslife.ch/anlagestiftung Total expense ratio TERKGAST **** - ex ante 0.15% - ex post as at 30.09.2015 0.15% Issuing/redemption commission none Distribution policy Profit retention
* To 30.06.12 Citigroup WGBI, ex CH (CHF hedged) ** Purchases in this tranche are only possible on the
basis of a special agreement with Swiss Life Asset ManagersPurchases in this tranche are only possible on the basis of a special agreement with Swiss Life Asset Managers
*** The selection of managers who Swiss Life Asset Management Ltd permanently monitors and supports through the process in accordance with objective criteria and best institutional practice
**** The total expense ratio TERKGAST includes all costs with the exception of transaction costs and trans-action-related taxes
Investment Group Benchmark
Statistical information (annualised)
since 1Y 3Y 5Y 10Y 30.09.01 Volatility Investment Group (in %) 3.84 3.11 3.20 Volatility Benchmark (in %) 3.46 2.78 2.79 Tracking Error ex post (in %) 0.88 0.77 0.91 Tracking Error ex ante (in %) 0.80 Information Ratio -0.84 -0.18 0.51 Sharpe Ratio 0.66 0.87 1.13 Correlation 0.98 0.97 0.96 Beta 1.08 1.09 1.11 Jensen-Alpha -0.99 -0.39 0.12 Maximum Drawdown (in %) -4.45 -4.45 -4.45 Recovery Period (years) n.a. n.a. n.a.
Key figures
31.12.2014 30.09.2015 Assets in CHF (m) 404.4 311.0 Net asset value per entitlement in CHF 119.28 118.65
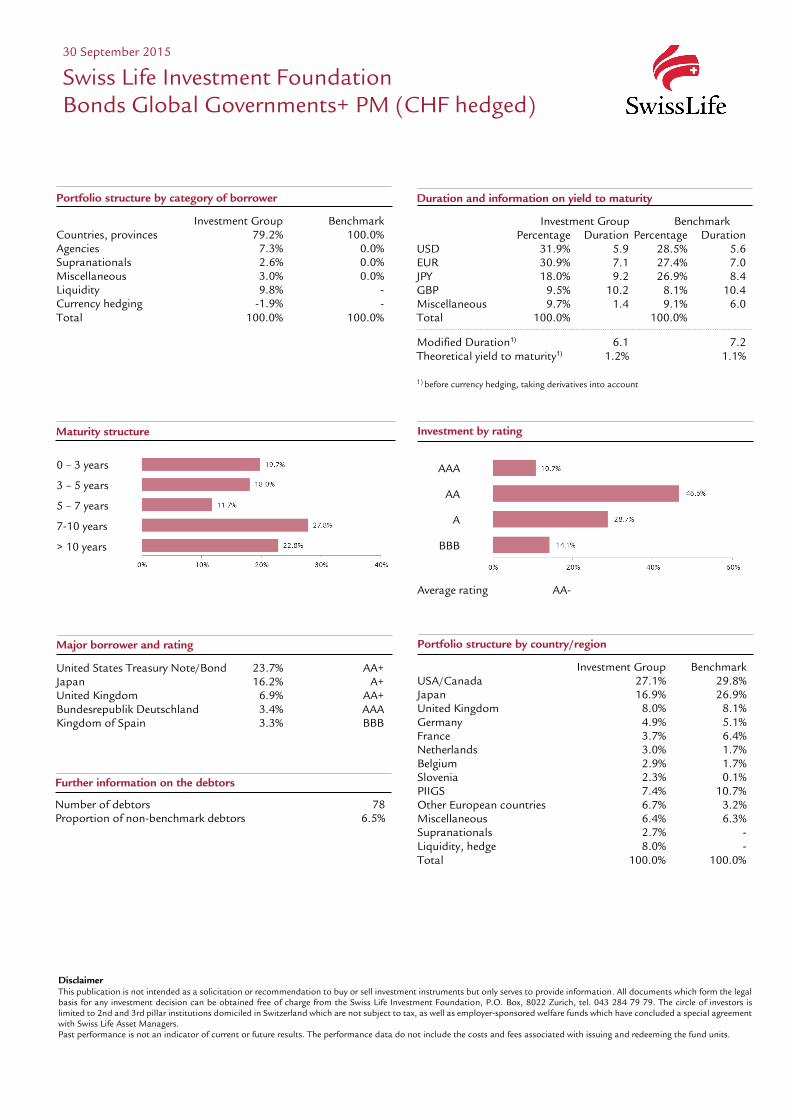
Maturity structure
0 – 3 years
3 – 5 years
5 – 7 years
7-10 years
> 10 years
Portfolio structure by country/region
Investment Group Benchmark USA/Canada 27.1% 29.8% Japan 16.9% 26.9% United Kingdom 8.0% 8.1% Germany 4.9% 5.1% France 3.7% 6.4% Netherlands 3.0% 1.7% Belgium 2.9% 1.7% Slovenia 2.3% 0.1% PIIGS 7.4% 10.7% Other European countries 6.7% 3.2% Miscellaneous 6.4% 6.3% Supranationals 2.7% - Liquidity, hedge 8.0% - Total 100.0% 100.0%
Portfolio structure by category of borrower
Investment Group Benchmark Countries, provinces 79.2% 100.0% Agencies 7.3% 0.0% Supranationals 2.6% 0.0% Miscellaneous 3.0% 0.0% Liquidity 9.8% - Currency hedging -1.9% - Total 100.0% 100.0%
Duration and information on yield to maturity
Investment Group Benchmark Percentage Duration Percentage Duration USD 31.9% 5.9 28.5% 5.6 EUR 30.9% 7.1 27.4% 7.0 JPY 18.0% 9.2 26.9% 8.4 GBP 9.5% 10.2 8.1% 10.4 Miscellaneous 9.7% 1.4 9.1% 6.0 Total 100.0% 100.0% Modified Duration1) 6.1 7.2 Theoretical yield to maturity1) 1.2% 1.1%
1) before currency hedging, taking derivatives into account
Disclaimer This publication is not intended as a solicitation or recommendation to buy or sell investment instruments but only serves to provide information. All documents which form the legal basis for any investment decision can be obtained free of charge from the Swiss Life Investment Foundation, P.O. Box, 8022 Zurich, tel. 043 284 79 79. The circle of investors is limited to 2nd and 3rd pillar institutions domiciled in Switzerland which are not subject to tax, as well as employer-sponsored welfare funds which have concluded a special agreement with Swiss Life Asset Managers. Past performance is not an indicator of current or future results. The performance data do not include the costs and fees associated with issuing and redeeming the fund units.
Major borrower and rating
United States Treasury Note/Bond 23.7% AA+ Japan 16.2% A+ United Kingdom 6.9% AA+ Bundesrepublik Deutschland 3.4% AAA Kingdom of Spain 3.3% BBB
30 September 2015
Swiss Life Investment Foundation Bonds Global Governments+ PM (CHF hedged)
Investment by rating
AAA
AA
A
BBB
Average rating AA-
Further information on the debtors
Number of debtors 78 Proportion of non-benchmark debtors 6.5%

Performance 1M 3M 1Y 3Y 5Y p.a. since p.a. p.a. 14.12.10 Investment Group (in %) -0.59 -0.75 -0.83 2.18 4.05 Benchmark (in %) 0.15 0.13 0.22 2.28 3.59 YTD 2014 2013 2012 2011 2010 Investment Group (in %) -2.43 7.22 -0.09 12.61 5.16 Benchmark (in %) -1.42 7.24 -0.35 10.30 3.88
Indexed performance and performances
Monthly performance
Investment Group Benchmark
30 September 2015
Swiss Life Investment Foundation Bonds Global Corporates PM (CHF hedged)
Investment strategy
Investments in foreign currency debt securities of companies, including agencies and supranationals
A maximum of 10% government debt securities can also be included
Active bond selection, duration manage-ment and yield curve positioning
Debtor limitation: 10% Non-benchmarked debt: max. 10% Average rating: at least BBB+ Foreign currency risks will be at least 90%
hedged against Swiss francs Implementation via investment in Swiss
Life iFunds (CH) Bond Global Corporates (CHF hedged)
Investment Group Benchmark
Product information
Swiss security number 11956108 ISIN CH0119561089 LEI 549300MHXLKUXBO8KC66 Bloomberg Ticker SWLGUPM SW Benchmark Barclays Gl. Agg. Corp. TR (CHF hedged) Currency CHF Launch date 14.12.2010 Initial subscription price 100.00 End of financial year 30.09. Issuing/Redemption daily Deadline * 14.30 Asset Manager according to Best Select Invest Plus® ** Swiss Life Asset Management Ltd Monitoring of asset managers PPCmetrics supports the ongoing monitoring of asset managers and the evaluation of the investment results Price listings Bloomberg: ASSL www.swisslife.ch/anlagestiftung Total expense ratio TERKGAST *** - ex ante 0.15% - ex post as at 30.09.2015 0.15% Issuing/redemption commission none Distribution policy Profit retention * Purchases in this tranche are only possible on the
basis of a special agreement with Swiss Life Asset Managers
** The selection of managers who Swiss Life Asset Management Ltd permanently monitors and supports through the process in accordance with objective criteria and best institutional practice
*** The total expense ratio TERKGAST includes all costs with the exception of transaction costs and trans-action-related taxes
Statistical information (annualised)
since 1Y 3Y 5Y 10Y 30.09.01 Volatility Investment Group (in %) 3.42 3.78 4.30 Volatility Benchmark (in %) 3.61 3.52 3.80 Tracking Error ex post (in %) 1.07 1.02 1.18 Tracking Error ex ante (in %) 1.10 Information Ratio -0.98 -0.09 0.39 Sharpe Ratio -0.09 0.61 0.94 Correlation 0.96 0.96 0.96 Beta 0.90 1.03 1.09 Jensen-Alpha -0.98 -0.18 0.12 Maximum Drawdown (in %) -4.77 -5.90 -5.90 Recovery Period (years) n.a. 0.77 0.77
Key figures
31.12.2014 30.09.2015 Assets in CHF (m) 348.8 409.4 Net asset value per entitlement in CHF 124.19 121.17

Portfolio structure by country/region
Investment Group Benchmark USA/Canada 52.8% 57.0% Japan 0.5% 3.3% United Kingdom 10.8% 9.2% Germany 5.5% 4.3% France 4.3% 6.2% Switzerland 4.0% 2.3% Sweden 3.1% 1.3% Netherlands 2.5% 3.3% PIIGS 2.6% 3.4% Other European countries 2.2% 1.4% Miscellaneous 10.5% 8.3% Liquidity, hedge 1.2% - Total 100.0% 100.0%
Maturity structure
0 – 3 years
3 – 5 years
5 – 7 years
7-10 years
> 10 years
Portfolio structure by category of borrower
Investment Group Benchmark Industry 59.0% 52.3% Utilities 4.0% 7.8% Banks, financial institutions 33.9% 39.9% Miscellaneous 1.9% 0.0% Liquidity 2.1% - Currency hedging -0.9% - Total 100.0% 100.0%
Portfolio structure by currencies and duration
Investment Group Benchmark Percentage Duration Percentage Duration USD 67.7% 6.5 65.6% 6.5 EUR 24.5% 6.1 21.4% 4.9 JPY 0.0% 0.0 2.1% 3.4 GBP 6.1% 6.2 6.8% 7.8 Miscellaneous 1.7% 0.0 4.1% 4.6 Total 100.0% 100.0% Modified Duration1) 6.3 6.1 Theoretical yield to maturity1) 3.4% 2.9%
1) before currency hedging, taking derivatives into account
Disclaimer This publication is not intended as a solicitation or recommendation to buy or sell investment instruments but only serves to provide information. All documents which form the legal basis for any investment decision can be obtained free of charge from the Swiss Life Investment Foundation, P.O. Box, 8022 Zurich, tel. 043 284 79 79. The circle of investors is limited to 2nd and 3rd pillar institutions domiciled in Switzerland which are not subject to tax, as well as employer-sponsored welfare funds which have concluded a special agreement with Swiss Life Asset Managers. Past performance is not an indicator of current or future results. The performance data do not include the costs and fees associated with issuing and redeeming the fund units.
Major borrower and rating
Citigroup Inc 2.1% BBB+ Bank of America Corp 1.5% BBB+ PNC Bank National Association 1.2% A Koninklijke DSM NV 1.2% A- Verizon Communications Inc 1.1% BBB+
30 September 2015
Swiss Life Investment Foundation Bonds Global Corporates PM (CHF hedged)
Investment by rating
AAA
AA
A
BBB
Average rating BBB+
Further information on the debtors
Number of debtors 172 Proportion of non-benchmark debtors 6.4%
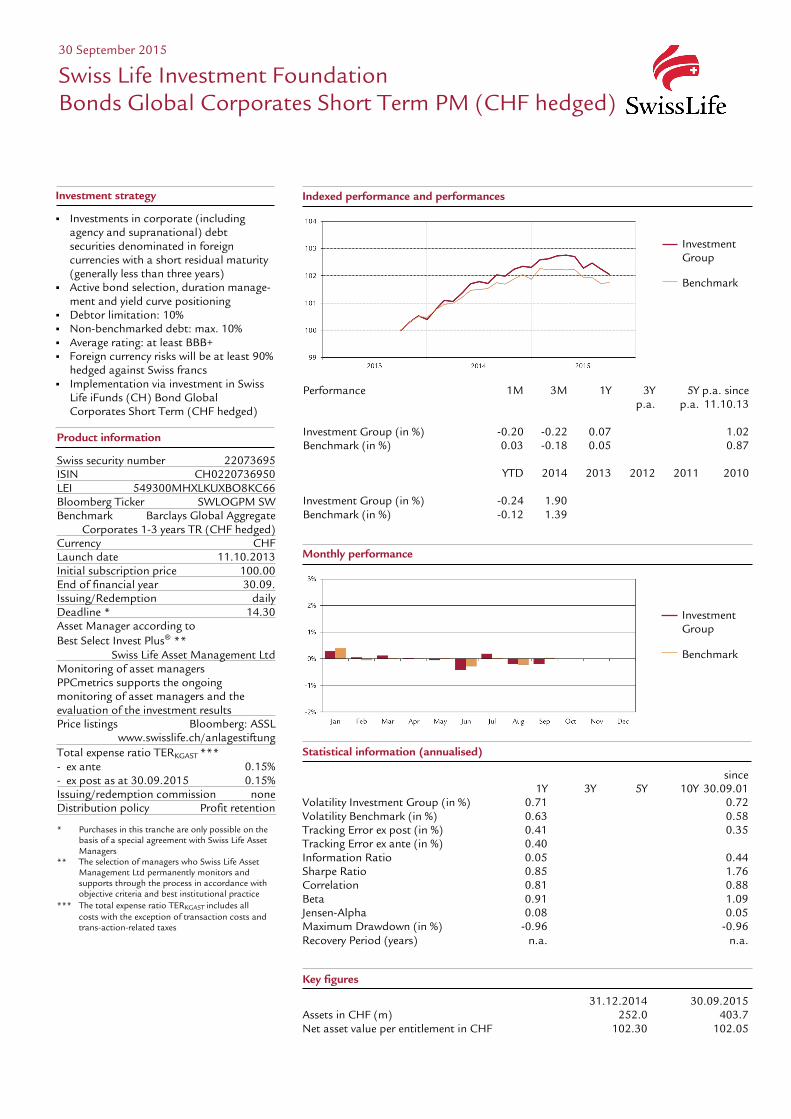
Performance 1M 3M 1Y 3Y 5Y p.a. since p.a. p.a. 11.10.13 Investment Group (in %) -0.20 -0.22 0.07 1.02 Benchmark (in %) 0.03 -0.18 0.05 0.87 YTD 2014 2013 2012 2011 2010 Investment Group (in %) -0.24 1.90 Benchmark (in %) -0.12 1.39
Monthly performance
Investment Group Benchmark
30 September 2015
Swiss Life Investment Foundation Bonds Global Corporates Short Term PM (CHF hedged)
Investment strategy
Investments in corporate (including agency and supranational) debt securities denominated in foreign currencies with a short residual maturity (generally less than three years)
Active bond selection, duration manage-ment and yield curve positioning
Debtor limitation: 10% Non-benchmarked debt: max. 10% Average rating: at least BBB+ Foreign currency risks will be at least 90%
hedged against Swiss francs Implementation via investment in Swiss
Life iFunds (CH) Bond Global Corporates Short Term (CHF hedged)
1.90
Indexed performance and performances
Product information
Swiss security number 22073695 ISIN CH0220736950 LEI 549300MHXLKUXBO8KC66 Bloomberg Ticker SWLOGPM SW Benchmark Barclays Global Aggregate Corporates 1-3 years TR (CHF hedged) Currency CHF Launch date 11.10.2013 Initial subscription price 100.00 End of financial year 30.09. Issuing/Redemption daily Deadline * 14.30 Asset Manager according to Best Select Invest Plus® ** Swiss Life Asset Management Ltd Monitoring of asset managers PPCmetrics supports the ongoing monitoring of asset managers and the evaluation of the investment results Price listings Bloomberg: ASSL www.swisslife.ch/anlagestiftung Total expense ratio TERKGAST *** - ex ante 0.15% - ex post as at 30.09.2015 0.15% Issuing/redemption commission none Distribution policy Profit retention * Purchases in this tranche are only possible on the
basis of a special agreement with Swiss Life Asset Managers
** The selection of managers who Swiss Life Asset Management Ltd permanently monitors and supports through the process in accordance with objective criteria and best institutional practice
*** The total expense ratio TERKGAST includes all costs with the exception of transaction costs and trans-action-related taxes
Investment Group Benchmark
Statistical information (annualised)
since 1Y 3Y 5Y 10Y 30.09.01 Volatility Investment Group (in %) 0.71 0.72 Volatility Benchmark (in %) 0.63 0.58 Tracking Error ex post (in %) 0.41 0.35 Tracking Error ex ante (in %) 0.40 Information Ratio 0.05 0.44 Sharpe Ratio 0.85 1.76 Correlation 0.81 0.88 Beta 0.91 1.09 Jensen-Alpha 0.08 0.05 Maximum Drawdown (in %) -0.96 -0.96 Recovery Period (years) n.a. n.a.
Key figures
31.12.2014 30.09.2015 Assets in CHF (m) 252.0 403.7 Net asset value per entitlement in CHF 102.30 102.05
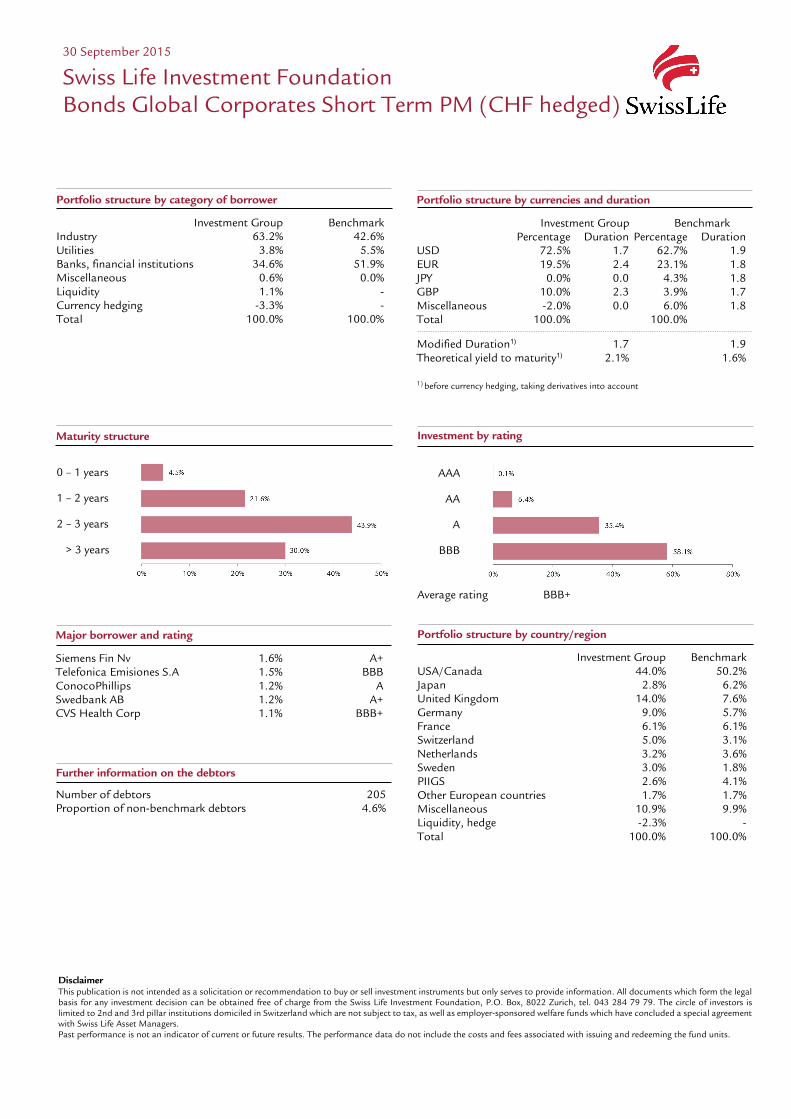
Portfolio structure by country/region
Investment Group Benchmark USA/Canada 44.0% 50.2% Japan 2.8% 6.2% United Kingdom 14.0% 7.6% Germany 9.0% 5.7% France 6.1% 6.1% Switzerland 5.0% 3.1% Netherlands 3.2% 3.6% Sweden 3.0% 1.8% PIIGS 2.6% 4.1% Other European countries 1.7% 1.7% Miscellaneous 10.9% 9.9% Liquidity, hedge -2.3% - Total 100.0% 100.0%
Maturity structure
0 – 1 years
1 – 2 years
2 – 3 years
> 3 years
Portfolio structure by category of borrower
Investment Group Benchmark Industry 63.2% 42.6% Utilities 3.8% 5.5% Banks, financial institutions 34.6% 51.9% Miscellaneous 0.6% 0.0% Liquidity 1.1% - Currency hedging -3.3% - Total 100.0% 100.0%
Portfolio structure by currencies and duration
Investment Group Benchmark Percentage Duration Percentage Duration USD 72.5% 1.7 62.7% 1.9 EUR 19.5% 2.4 23.1% 1.8 JPY 0.0% 0.0 4.3% 1.8 GBP 10.0% 2.3 3.9% 1.7 Miscellaneous -2.0% 0.0 6.0% 1.8 Total 100.0% 100.0% Modified Duration1) 1.7 1.9 Theoretical yield to maturity1) 2.1% 1.6%
1) before currency hedging, taking derivatives into account
Disclaimer This publication is not intended as a solicitation or recommendation to buy or sell investment instruments but only serves to provide information. All documents which form the legal basis for any investment decision can be obtained free of charge from the Swiss Life Investment Foundation, P.O. Box, 8022 Zurich, tel. 043 284 79 79. The circle of investors is limited to 2nd and 3rd pillar institutions domiciled in Switzerland which are not subject to tax, as well as employer-sponsored welfare funds which have concluded a special agreement with Swiss Life Asset Managers. Past performance is not an indicator of current or future results. The performance data do not include the costs and fees associated with issuing and redeeming the fund units.
Major borrower and rating
Siemens Fin Nv 1.6% A+ Telefonica Emisiones S.A 1.5% BBB ConocoPhillips 1.2% A Swedbank AB 1.2% A+ CVS Health Corp 1.1% BBB+
30 September 2015
Swiss Life Investment Foundation Bonds Global Corporates Short Term PM (CHF hedged)
Investment by rating
AAA
AA
A
BBB
Average rating BBB+
Further information on the debtors
Number of debtors 205 Proportion of non-benchmark debtors 4.6%
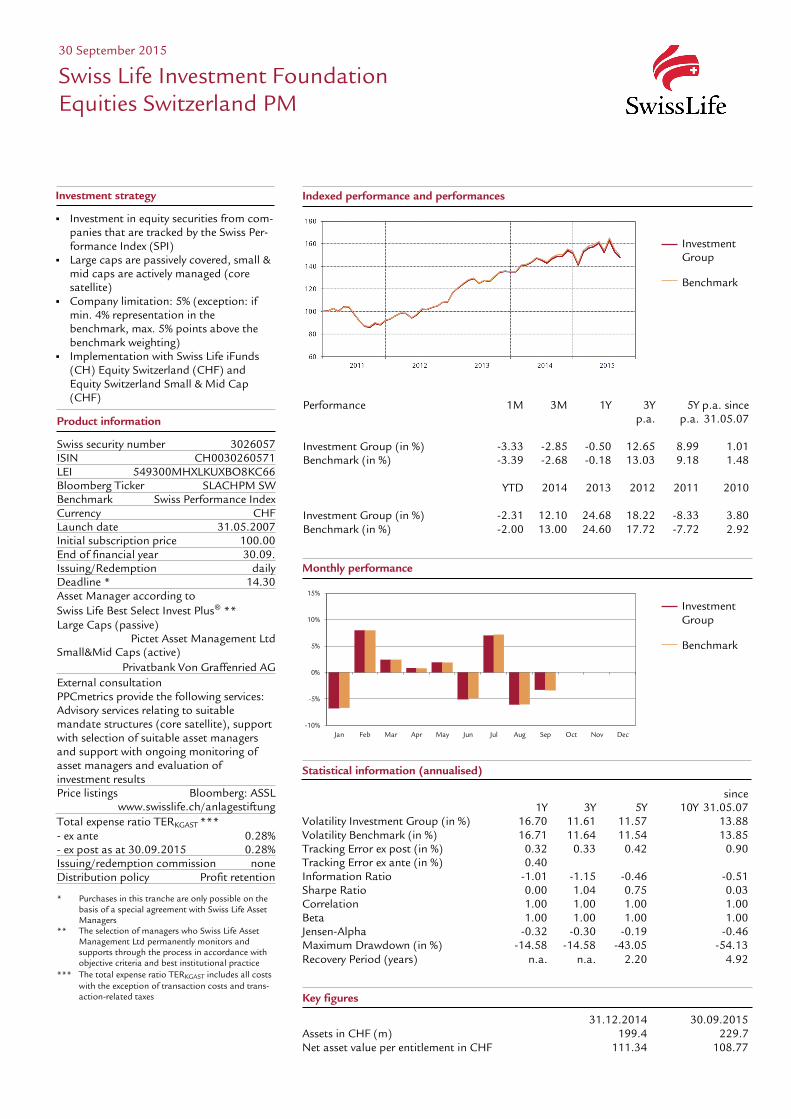
Performance 1M 3M 1Y 3Y 5Y p.a. since p.a. p.a. 31.05.07 Investment Group (in %) -3.33 -2.85 -0.50 12.65 8.99 1.01 Benchmark (in %) -3.39 -2.68 -0.18 13.03 9.18 1.48 YTD 2014 2013 2012 2011 2010 Investment Group (in %) -2.31 12.10 24.68 18.22 -8.33 3.80 Benchmark (in %) -2.00 13.00 24.60 17.72 -7.72 2.92
Indexed performance and performances
30 September 2015
Swiss Life Investment Foundation Equities Switzerland PM
Investment strategy
Investment in equity securities from com-panies that are tracked by the Swiss Per-formance Index (SPI)
Large caps are passively covered, small & mid caps are actively managed (core satellite)
Company limitation: 5% (exception: if min. 4% representation in the benchmark, max. 5% points above the benchmark weighting)
Implementation with Swiss Life iFunds (CH) Equity Switzerland (CHF) and Equity Switzerland Small & Mid Cap (CHF)
Investment Group Benchmark
Monthly performance
-10%
-5%
0%
5%
10%
15%
Jan Feb Mar Apr May Jun Jul Aug Sep Oct Nov Dec
Investment Group Benchmark
Product information
Swiss security number 3026057 ISIN CH0030260571 LEI 549300MHXLKUXBO8KC66 Bloomberg Ticker SLACHPM SW Benchmark Swiss Performance Index Currency CHF Launch date 31.05.2007 Initial subscription price 100.00 End of financial year 30.09. Issuing/Redemption daily Deadline * 14.30 Asset Manager according to Swiss Life Best Select Invest Plus® ** Large Caps (passive) Pictet Asset Management Ltd Small&Mid Caps (active) Privatbank Von Graffenried AG External consultation PPCmetrics provide the following services: Advisory services relating to suitable mandate structures (core satellite), support with selection of suitable asset managers and support with ongoing monitoring of asset managers and evaluation of investment results Price listings Bloomberg: ASSL www.swisslife.ch/anlagestiftung Total expense ratio TERKGAST *** - ex ante 0.28% - ex post as at 30.09.2015 0.28% Issuing/redemption commission none Distribution policy Profit retention * Purchases in this tranche are only possible on the
basis of a special agreement with Swiss Life Asset Managers
** The selection of managers who Swiss Life Asset Management Ltd permanently monitors and supports through the process in accordance with objective criteria and best institutional practice
*** The total expense ratio TERKGAST includes all costs with the exception of transaction costs and trans-action-related taxes
Statistical information (annualised)
since 1Y 3Y 5Y 10Y 31.05.07 Volatility Investment Group (in %) 16.70 11.61 11.57 13.88 Volatility Benchmark (in %) 16.71 11.64 11.54 13.85 Tracking Error ex post (in %) 0.32 0.33 0.42 0.90 Tracking Error ex ante (in %) 0.40 Information Ratio -1.01 -1.15 -0.46 -0.51 Sharpe Ratio 0.00 1.04 0.75 0.03 Correlation 1.00 1.00 1.00 1.00 Beta 1.00 1.00 1.00 1.00 Jensen-Alpha -0.32 -0.30 -0.19 -0.46 Maximum Drawdown (in %) -14.58 -14.58 -43.05 -54.13 Recovery Period (years) n.a. n.a. 2.20 4.92
Key figures
31.12.2014 30.09.2015 Assets in CHF (m) 199.4 229.7 Net asset value per entitlement in CHF 111.34 108.77

Portfolio structure by sector2)
Investment Group Benchmark Food & beverages 36.3% 36.4% Healthcare 20.3% 20.8% Banks 9.0% 10.0% Industry, energy, utilities 9.2% 8.3% Insurance 6.7% 6.6% Chemicals, oil & gas 4.2% 4.4% Goods and services 5.0% 4.7% Technology, media, telecoms 2.7% 2.1% Miscellaneous 5.7% 6.7% Liquidity 0.9% - Total 100.0% 100.0% 2) Taking derivatives and pooled investments into account
Largest equity positions3)
Investment Group Benchmark Nestlé 19.1% 19.1% Novartis 18.6% 18.6% Roche 14.8% 14.8% UBS 5.3% 5.3% Cie Fin Richemont 3.2% 3.2% ABB 3.1% 3.1% Zurich Insurance Group 2.9% 2.9% Credit Suisse Group 2.7% 2.7% Syngenta 2.4% 2.4% Swiss Re Reg. 2.3% 2.3% 3) Taking derivatives and pooled investments into account
30 September 2015
Swiss Life Investment Foundation Equities Switzerland PM
Disclaimer This publication is not intended as a solicitation or recommendation to buy or sell investment instruments but only serves to provide information. All documents which form the legal basis for any investment decision can be obtained free of charge from the Swiss Life Investment Foundation, P.O. Box, 8022 Zurich, tel. 043 284 79 79. The circle of investors is limited to 2nd and 3rd pillar institutions domiciled in Switzerland which are not subject to tax, as well as employer-sponsored welfare funds which have concluded a special agreement with Swiss Life Asset Managers. Past performance is not an indicator of current or future results. The performance data do not include the costs and fees associated with issuing and redeeming the fund units.
Portfolio structure according to size of company1)
Investment Group Benchmark Percentage Number Percentage Number Large companies 84.0% 20 84.2% 20 Medium companies 13.6% 48 14.3% 80 Small companies 1.5% 11 1.5% 108 Liquidity 0.9% - - - Total 100.0% 79 100.0% 208 1) Taking derivatives and pooled investments into account
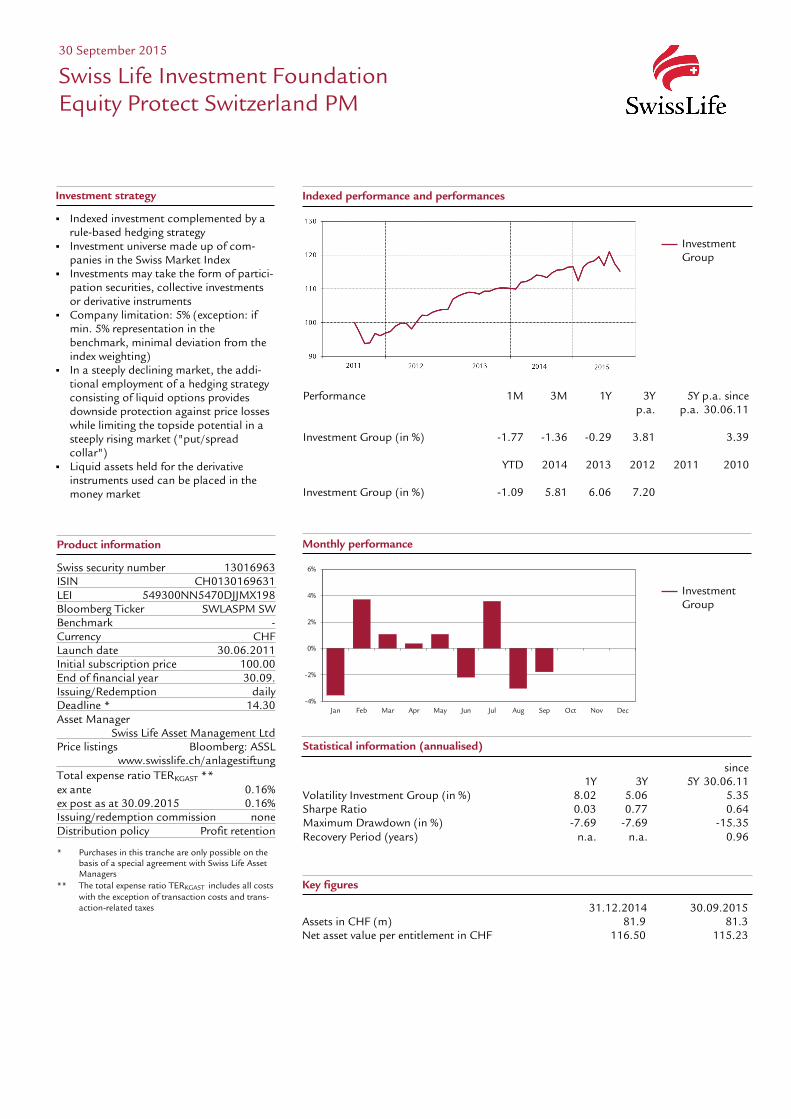
Indexed performance and performances
Monthly performance
-4%
-2%
0%
2%
4%
6%
Jan Feb Mar Apr May Jun Jul Aug Sep Oct Nov Dec
Statistical information (annualised)
since 1Y 3Y 5Y 30.06.11 Volatility Investment Group (in %) 8.02 5.06 5.35 Sharpe Ratio 0.03 0.77 0.64 Maximum Drawdown (in %) -7.69 -7.69 -15.35 Recovery Period (years) n.a. n.a. 0.96
Key figures
31.12.2014 30.09.2015 Assets in CHF (m) 81.9 81.3 Net asset value per entitlement in CHF 116.50 115.23
Performance 1M 3M 1Y 3Y 5Y p.a. since p.a. p.a. 30.06.11 Investment Group (in %) -1.77 -1.36 -0.29 3.81 3.39 YTD 2014 2013 2012 2011 2010 Investment Group (in %) -1.09 5.81 6.06 7.20
30 September 2015
Swiss Life Investment Foundation Equity Protect Switzerland PM
Investment strategy
Indexed investment complemented by a rule-based hedging strategy
Investment universe made up of com-panies in the Swiss Market Index
Investments may take the form of partici-pation securities, collective investments or derivative instruments
Company limitation: 5% (exception: if min. 5% representation in the benchmark, minimal deviation from the index weighting)
In a steeply declining market, the addi-tional employment of a hedging strategy consisting of liquid options provides downside protection against price losses while limiting the topside potential in a steeply rising market ("put/spread collar")
Liquid assets held for the derivative instruments used can be placed in the money market
Investment Group
Product information
Swiss security number 13016963 ISIN CH0130169631 LEI 549300NN5470DJJMX198 Bloomberg Ticker SWLASPM SW Benchmark - Currency CHF Launch date 30.06.2011 Initial subscription price 100.00 End of financial year 30.09. Issuing/Redemption daily Deadline * 14.30 Asset Manager Swiss Life Asset Management Ltd Price listings Bloomberg: ASSL www.swisslife.ch/anlagestiftung Total expense ratio TERKGAST ** ex ante 0.16% ex post as at 30.09.2015 0.16% Issuing/redemption commission none Distribution policy Profit retention * Purchases in this tranche are only possible on the
basis of a special agreement with Swiss Life Asset Managers
** The total expense ratio TERKGAST includes all costs with the exception of transaction costs and trans-action-related taxes
Investment Group

Portfolio structure
Investment Group SMI (exposure via synthetic futures) 102.3% Hedging strategy (put spread collar) 2.1% Liquidity -4.4% Total 100.0%
Details on investment of liquid assets
Investment Group Money market funds 8.2% SNB Bills 0.0% Bank and Post accounts, margin accounts at banks 91.8% Total 100.0%
30 September 2015
Swiss Life Investment Foundation Equity Protect Switzerland PM
Disclaimer This publication is not intended as a solicitation or recommendation to buy or sell investment instruments but only serves to provide information. All documents which form the legal basis for any investment decision can be obtained free of charge from the Swiss Life Investment Foundation, P.O. Box, 8022 Zurich, tel. 043 284 79 79. The circle of investors is limited to 2nd and 3rd pillar institutions domiciled in Switzerland which are not subject to tax, as well as employer-sponsored welfare funds which have concluded a special agreement with Swiss Life Asset Managers. Past performance is not an indicator of current or future results. The performance data do not include the costs and fees associated with issuing and redeeming the fund units.
Details on value of the hedging strategy
Investment Group Long put on SMI at 8'321.30 3.29% Short put on SMI at 7'007.93 -0.66% Short call on SMI at 9'360.67 -0.50% Total 2.13%

Performance 1M 3M 1Y 3Y 5Y p.a. since p.a. p.a. 31.05.07 Investment Group (in %) -2.96 -5.50 -4.08 9.08 7.27 -1.54 Benchmark (in %) -2.74 -5.08 -3.27 9.46 7.88 -0.94 YTD 2014 2013 2012 2011 2010 Investment Group (in %) -8.34 15.87 21.72 14.08 -7.64 2.43 Benchmark (in %) -7.98 16.54 22.32 13.64 -6.37 2.96
Indexed performance and performances
30 September 2015
Swiss Life Investment Foundation Equities Foreign PM
Investment strategy Investments in bonds of companies
domiciled abroad Large & mid caps are passively covered,
small caps and emerging markets are actively managed (core satellite)
Company limitation: 5% (exception: if min. 4% representation in the benchmark, max. 5% points above the benchmark weighting)
Non-benchmarked debt: max. 10% Implementation with Swiss Life iFunds
(CH) Equity Global ex Switzerland (CHF), Invesco Global Small Cap Equity Fund and pooled investments of emerging markets
Investment Group Benchmark
Monthly performance
Investment Group Benchmark
Product information
Swiss security number 3026051 ISIN CH0030260514 LEI 549300MHXLKUXBO8KC66 Bloomberg Ticker SLAAUPM SW Benchmark * 80% MSCI World, ex CH, in CHF 15% MSCI World Small Cap, in CHF 5% MSCI World Emerging Markets, in CHF Currency CHF Launch date 31.05.2007 Initial subscription price 100.00 End of financial year 30.09. Issuing/Redemption daily Deadline ** 14.30 Asset Manager according to Swiss Life Best Select Invest Plus® *** Large & Mid Caps (passive) UBS Ltd Small Caps (active) Invesco EmMa (active on a quantitative base) Swiss Life Management Ltd External consultation PPCmetrics provide the following services: Advisory services relating to suitable mandate structures (core satellite), support with selection of suitable asset managers and support with ongoing monitoring of asset managers and evaluation of investment results Price listings Bloomberg: ASSL www.swisslife.ch/anlagestiftung Total expense ratio TERKGAST **** - ex ante 0.43% - ex post as at 30.09.2015 0.43% Issuing/redemption commission none Distribution policy Profit retention * To 31.12.2009 100% MSCI World, ex CH, in CHF ** Purchases in this tranche are only possible on the
basis of a special agreement with Swiss Life Asset Managers
*** The selection of managers who Swiss Life Asset Management Ltd permanently monitors and supports through the process in accordance with objective criteria and best institutional practice
**** The total expense ratio TERKGAST includes all costs with the exception of transaction costs and trans-action-related taxes
Statistical information (annualised)
since 1Y 3Y 5Y 10Y 31.05.07 Volatility Investment Group (in %) 16.28 11.17 11.33 16.47 Volatility Benchmark (in %) 16.31 11.18 11.26 16.50 Tracking Error ex post (in %) 0.92 0.79 0.93 1.19 Tracking Error ex ante (in %) 0.80 Information Ratio -0.89 -0.47 -0.65 -0.50 Sharpe Ratio -0.22 0.79 0.62 -0.13 Correlation 1.00 1.00 1.00 1.00 Beta 1.00 1.00 1.00 1.00 Jensen-Alpha -0.86 -0.31 -0.58 -0.61 Maximum Drawdown (in %) -17.02 -17.02 -36.24 -59.96 Recovery Period (years) n.a. n.a. 1.43 n.a.
Key figures
31.12.2014 30.09.2015 Assets in CHF (m) 217.0 235.1 Net asset value per entitlement in CHF 95.85 87.86
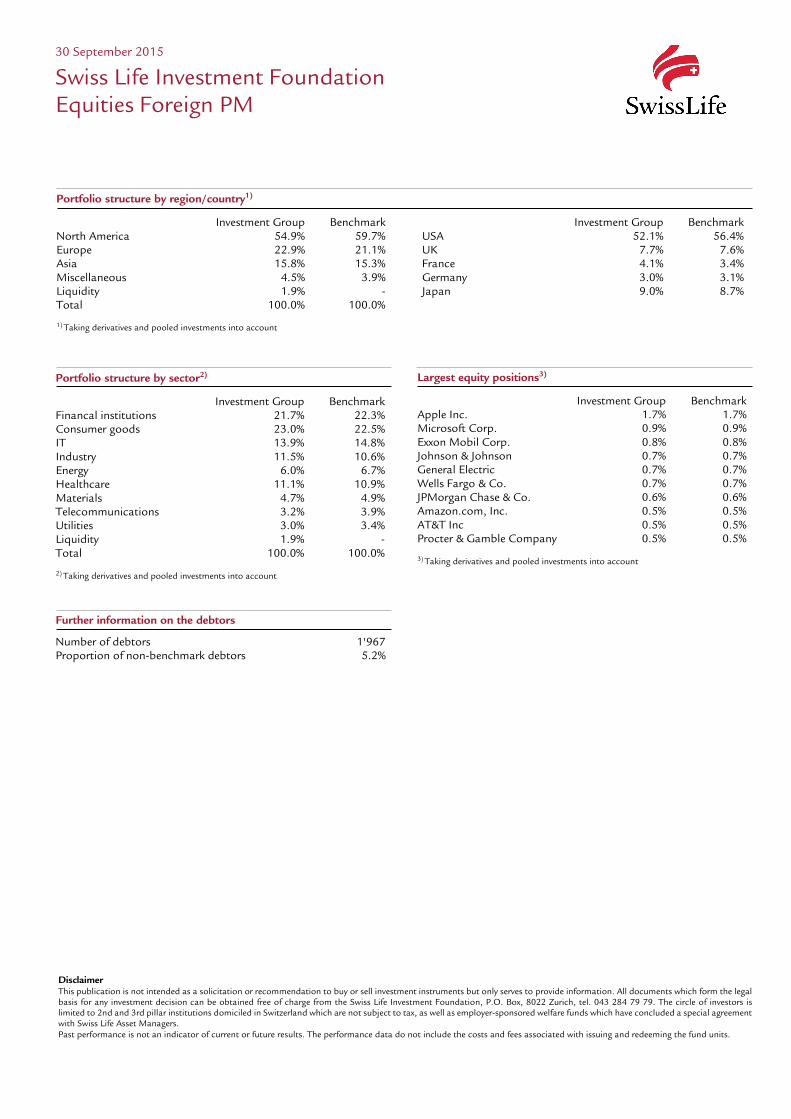
Portfolio structure by sector2)
Investment Group Benchmark Financal institutions 21.7% 22.3% Consumer goods 23.0% 22.5% IT 13.9% 14.8% Industry 11.5% 10.6% Energy 6.0% 6.7% Healthcare 11.1% 10.9% Materials 4.7% 4.9% Telecommunications 3.2% 3.9% Utilities 3.0% 3.4% Liquidity 1.9% - Total 100.0% 100.0% 2) Taking derivatives and pooled investments into account
Largest equity positions3)
Investment Group Benchmark Apple Inc. 1.7% 1.7% Microsoft Corp. 0.9% 0.9% Exxon Mobil Corp. 0.8% 0.8% Johnson & Johnson 0.7% 0.7% General Electric 0.7% 0.7% Wells Fargo & Co. 0.7% 0.7% JPMorgan Chase & Co. 0.6% 0.6% Amazon.com, Inc. 0.5% 0.5% AT&T Inc 0.5% 0.5% Procter & Gamble Company 0.5% 0.5% 3) Taking derivatives and pooled investments into account
30 September 2015
Swiss Life Investment Foundation Equities Foreign PM
Disclaimer This publication is not intended as a solicitation or recommendation to buy or sell investment instruments but only serves to provide information. All documents which form the legal basis for any investment decision can be obtained free of charge from the Swiss Life Investment Foundation, P.O. Box, 8022 Zurich, tel. 043 284 79 79. The circle of investors is limited to 2nd and 3rd pillar institutions domiciled in Switzerland which are not subject to tax, as well as employer-sponsored welfare funds which have concluded a special agreement with Swiss Life Asset Managers. Past performance is not an indicator of current or future results. The performance data do not include the costs and fees associated with issuing and redeeming the fund units.
Portfolio structure by region/country1)
Investment Group Benchmark Investment Group Benchmark North America 54.9% 59.7% USA 52.1% 56.4% Europe 22.9% 21.1% UK 7.7% 7.6% Asia 15.8% 15.3% France 4.1% 3.4% Miscellaneous 4.5% 3.9% Germany 3.0% 3.1% Liquidity 1.9% - Japan 9.0% 8.7% Total 100.0% 100.0% 1) Taking derivatives and pooled investments into account
Further information on the debtors
Number of debtors 1'967 Proportion of non-benchmark debtors 5.2%
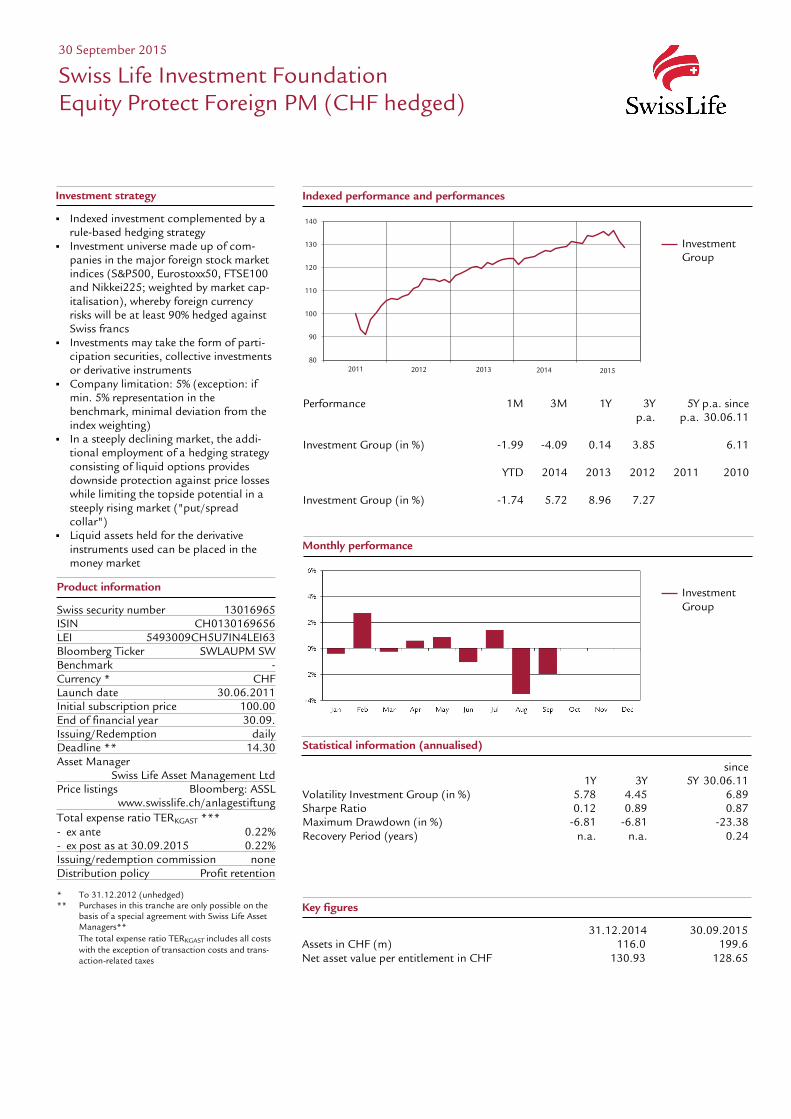
Monthly performance
Performance 1M 3M 1Y 3Y 5Y p.a. since p.a. p.a. 30.06.11 Investment Group (in %) -1.99 -4.09 0.14 3.85 6.11 YTD 2014 2013 2012 2011 2010 Investment Group (in %) -1.74 5.72 8.96 7.27
Indexed performance and performances
80
90
100
110
120
130
140
2011 2012 2013 2014 2015
Statistical information (annualised)
since 1Y 3Y 5Y 30.06.11 Volatility Investment Group (in %) 5.78 4.45 6.89 Sharpe Ratio 0.12 0.89 0.87 Maximum Drawdown (in %) -6.81 -6.81 -23.38 Recovery Period (years) n.a. n.a. 0.24
Key figures
31.12.2014 30.09.2015 Assets in CHF (m) 116.0 199.6 Net asset value per entitlement in CHF 130.93 128.65
30 September 2015
Swiss Life Investment Foundation Equity Protect Foreign PM (CHF hedged)
Investment strategy
Indexed investment complemented by a rule-based hedging strategy
Investment universe made up of com-panies in the major foreign stock market indices (S&P500, Eurostoxx50, FTSE100 and Nikkei225; weighted by market cap-italisation), whereby foreign currency risks will be at least 90% hedged against Swiss francs
Investments may take the form of parti-cipation securities, collective investments or derivative instruments
Company limitation: 5% (exception: if min. 5% representation in the benchmark, minimal deviation from the index weighting)
In a steeply declining market, the addi-tional employment of a hedging strategy consisting of liquid options provides downside protection against price losses while limiting the topside potential in a steeply rising market ("put/spread collar")
Liquid assets held for the derivative instruments used can be placed in the money market
Investment Group
Investment Group
Product information
Swiss security number 13016965 ISIN CH0130169656 LEI 5493009CH5U7IN4LEI63 Bloomberg Ticker SWLAUPM SW Benchmark - Currency * CHF Launch date 30.06.2011 Initial subscription price 100.00 End of financial year 30.09. Issuing/Redemption daily Deadline ** 14.30 Asset Manager Swiss Life Asset Management Ltd Price listings Bloomberg: ASSL www.swisslife.ch/anlagestiftung Total expense ratio TERKGAST *** - ex ante 0.22% - ex post as at 30.09.2015 0.22% Issuing/redemption commission none Distribution policy Profit retention * To 31.12.2012 (unhedged) ** Purchases in this tranche are only possible on the
basis of a special agreement with Swiss Life Asset Managers**
The total expense ratio TERKGAST includes all costs with the exception of transaction costs and trans-action-related taxes

Portfolio structure
Investment Group S&P500 (exposure via synthetic futures) 60.6% Eurostoxx50 (exposure via synthetic futures) 12.1% FTSE100 (exposure via synthetic futures) 11.7% Nikkei225 (exposure via synthetic futures) 12.2% Hedging strategy (put spread collar) 2.9% Currency futures 0.5% Liquidity 0.0% Total 100.0%
Details on investment of liquid assets
Investment Group Money market funds 9.8% SNB Bills 0.0% Bank and Post accounts, margin accounts at banks 90.2% Total 100.0%
30 September 2015
Swiss Life Investment Foundation Equity Protect Foreign PM (CHF hedged)
Disclaimer This publication is not intended as a solicitation or recommendation to buy or sell investment instruments but only serves to provide information. All documents which form the legal basis for any investment decision can be obtained free of charge from the Swiss Life Investment Foundation, P.O. Box, 8022 Zurich, tel. 043 284 79 79. The circle of investors is limited to 2nd and 3rd pillar institutions domiciled in Switzerland which are not subject to tax, as well as employer-sponsored welfare funds which have concluded a special agreement with Swiss Life Asset Managers. Past performance is not an indicator of current or future results. The performance data do not include the costs and fees associated with issuing and redeeming the fund units.
Details on value of the hedging strategy
Investment Group Long put on S&P500 at 1'934.34 2.85% Short put on S&P500 at 1'628.80 -0.55% Short call on S&P500 at 2'190.67 -0.01% Long put on Eurostoxx50 at 2'889.97 0.40% Short put on Eurostoxx50 at 2'433.83 -0.10% Short call on Eurostoxx50 at 3'337.96 -0.18% Long put on FTSE100 at 6'069.69 0.53% Short put on FTSE100 at 5'111.04 -0.11% Short call on FTSE100 at 6'861.56 -0.02% Long put on Nikkei225 at 16'388.02 0.39% Short put on Nikkei225 at 13'800.07 -0.10% Short call on Nikkei225 at 19'408.48 -0.15% Total 2.93%
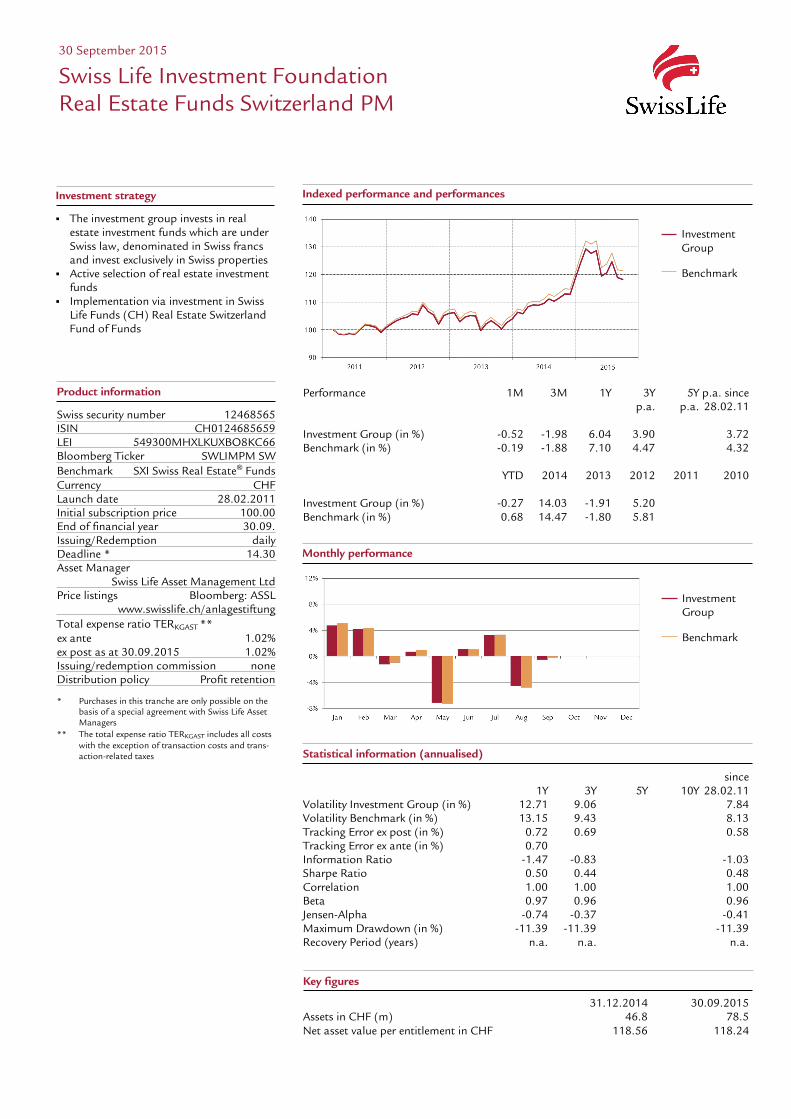
Performance 1M 3M 1Y 3Y 5Y p.a. since p.a. p.a. 28.02.11 Investment Group (in %) -0.52 -1.98 6.04 3.90 3.72 Benchmark (in %) -0.19 -1.88 7.10 4.47 4.32 YTD 2014 2013 2012 2011 2010 Investment Group (in %) -0.27 14.03 -1.91 5.20 Benchmark (in %) 0.68 14.47 -1.80 5.81
30 September 2015
Swiss Life Investment Foundation Real Estate Funds Switzerland PM
Investment strategy
The investment group invests in real estate investment funds which are under Swiss law, denominated in Swiss francs and invest exclusively in Swiss properties
Active selection of real estate investment funds
Implementation via investment in Swiss Life Funds (CH) Real Estate Switzerland Fund of Funds
14.03 -1.91
Indexed performance and performances
Monthly performance
Investment Group Benchmark
Product information
Swiss security number 12468565 ISIN CH0124685659 LEI 549300MHXLKUXBO8KC66 Bloomberg Ticker SWLIMPM SW Benchmark SXI Swiss Real Estate® Funds Currency CHF Launch date 28.02.2011 Initial subscription price 100.00 End of financial year 30.09. Issuing/Redemption daily Deadline * 14.30 Asset Manager Swiss Life Asset Management Ltd Price listings Bloomberg: ASSL www.swisslife.ch/anlagestiftung Total expense ratio TERKGAST ** ex ante 1.02% ex post as at 30.09.2015 1.02% Issuing/redemption commission none Distribution policy Profit retention * Purchases in this tranche are only possible on the
basis of a special agreement with Swiss Life Asset Managers
** The total expense ratio TERKGAST includes all costs with the exception of transaction costs and trans-action-related taxes
Investment Group Benchmark
Statistical information (annualised)
since 1Y 3Y 5Y 10Y 28.02.11 Volatility Investment Group (in %) 12.71 9.06 7.84 Volatility Benchmark (in %) 13.15 9.43 8.13 Tracking Error ex post (in %) 0.72 0.69 0.58 Tracking Error ex ante (in %) 0.70 Information Ratio -1.47 -0.83 -1.03 Sharpe Ratio 0.50 0.44 0.48 Correlation 1.00 1.00 1.00 Beta 0.97 0.96 0.96 Jensen-Alpha -0.74 -0.37 -0.41 Maximum Drawdown (in %) -11.39 -11.39 -11.39 Recovery Period (years) n.a. n.a. n.a.
Key figures
31.12.2014 30.09.2015 Assets in CHF (m) 46.8 78.5 Net asset value per entitlement in CHF 118.56 118.24
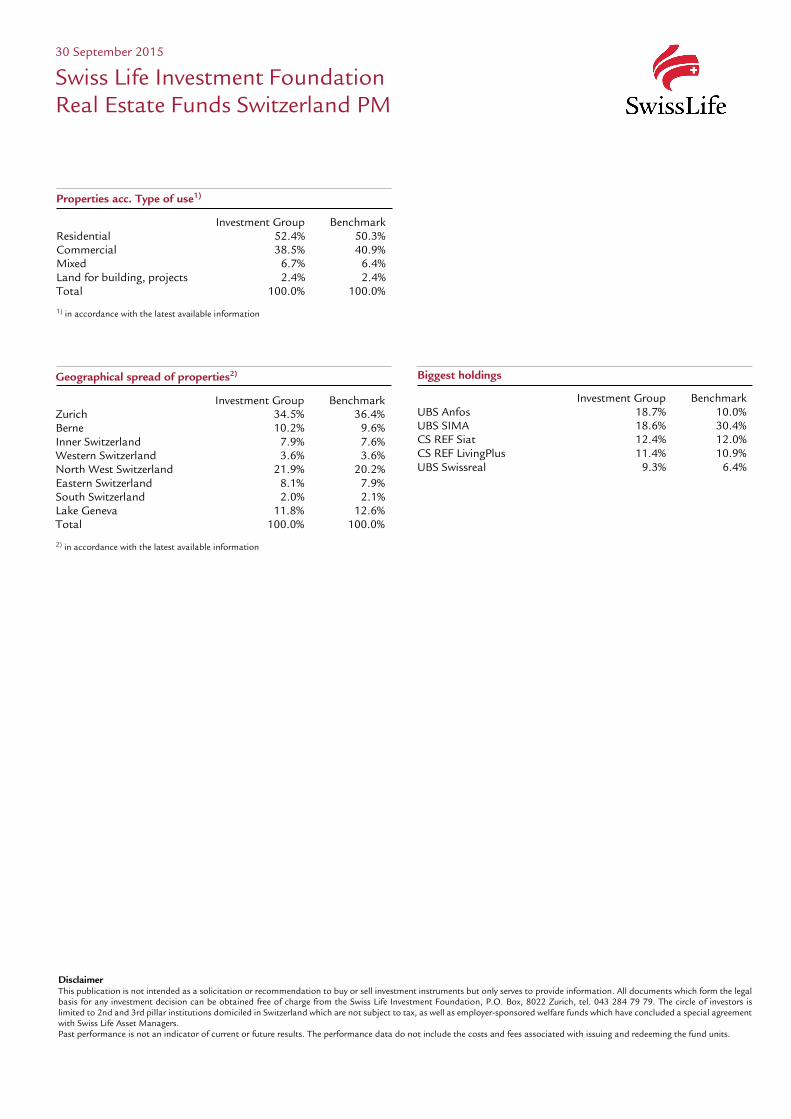
Geographical spread of properties2)
Investment Group Benchmark Zurich 34.5% 36.4% Berne 10.2% 9.6% Inner Switzerland 7.9% 7.6% Western Switzerland 3.6% 3.6% North West Switzerland 21.9% 20.2% Eastern Switzerland 8.1% 7.9% South Switzerland 2.0% 2.1% Lake Geneva 11.8% 12.6% Total 100.0% 100.0% 2) in accordance with the latest available information
Biggest holdings
Investment Group Benchmark UBS Anfos 18.7% 10.0% UBS SIMA 18.6% 30.4% CS REF Siat 12.4% 12.0% CS REF LivingPlus 11.4% 10.9% UBS Swissreal 9.3% 6.4%
30 September 2015
Swiss Life Investment Foundation Real Estate Funds Switzerland PM
Disclaimer This publication is not intended as a solicitation or recommendation to buy or sell investment instruments but only serves to provide information. All documents which form the legal basis for any investment decision can be obtained free of charge from the Swiss Life Investment Foundation, P.O. Box, 8022 Zurich, tel. 043 284 79 79. The circle of investors is limited to 2nd and 3rd pillar institutions domiciled in Switzerland which are not subject to tax, as well as employer-sponsored welfare funds which have concluded a special agreement with Swiss Life Asset Managers. Past performance is not an indicator of current or future results. The performance data do not include the costs and fees associated with issuing and redeeming the fund units.
Properties acc. Type of use1)
Investment Group Benchmark Residential 52.4% 50.3% Commercial 38.5% 40.9% Mixed 6.7% 6.4% Land for building, projects 2.4% 2.4% Total 100.0% 100.0% 1) in accordance with the latest available information
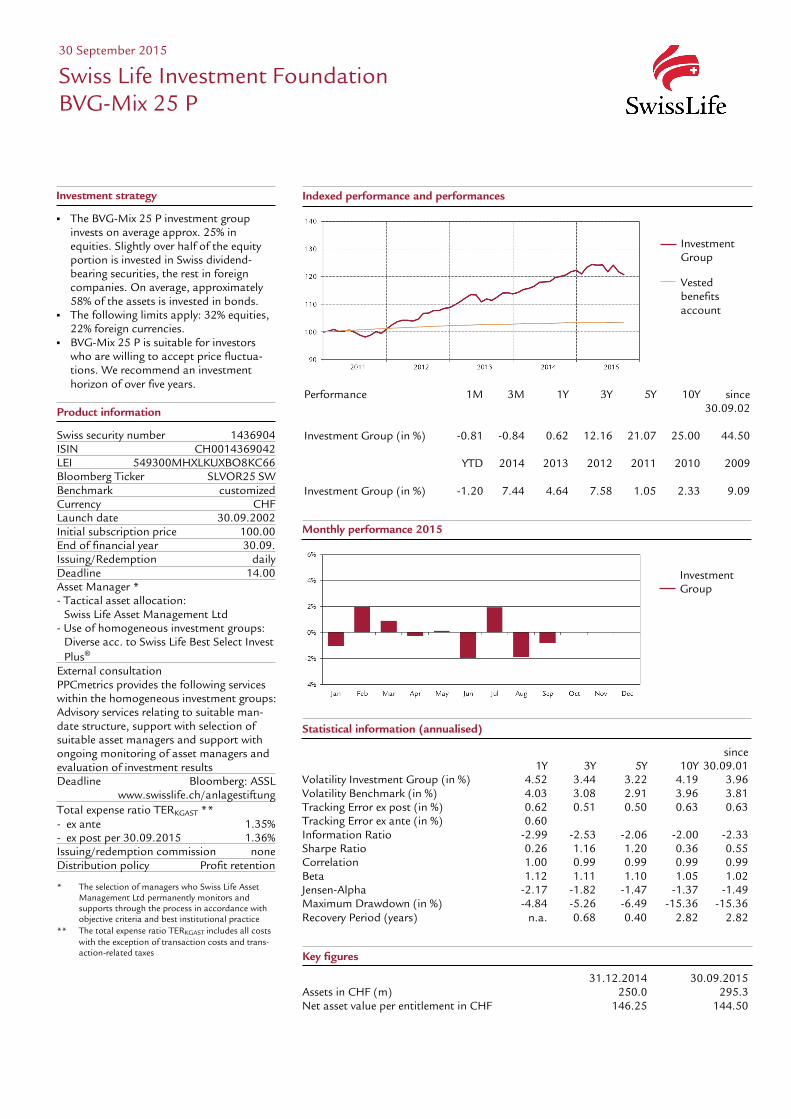
Indexed performance and performances
Performance 1M 3M 1Y 3Y 5Y 10Y since 30.09.02 Investment Group (in %) -0.81 -0.84 0.62 12.16 21.07 25.00 44.50 YTD 2014 2013 2012 2011 2010 2009 Investment Group (in %) -1.20 7.44 4.64 7.58 1.05 2.33 9.09
30 September 2015
Swiss Life Investment Foundation BVG-Mix 25 P
Investment strategy
The BVG-Mix 25 P investment group invests on average approx. 25% in equities. Slightly over half of the equity portion is invested in Swiss dividend-bearing securities, the rest in foreign companies. On average, approximately 58% of the assets is invested in bonds.
The following limits apply: 32% equities, 22% foreign currencies.
BVG-Mix 25 P is suitable for investors who are willing to accept price fluctua-tions. We recommend an investment horizon of over five years.
Investment Group Vested benefits account
Monthly performance 2015
Investment Group
Product information
Swiss security number 1436904 ISIN CH0014369042 LEI 549300MHXLKUXBO8KC66 Bloomberg Ticker SLVOR25 SW Benchmark customized Currency CHF Launch date 30.09.2002 Initial subscription price 100.00 End of financial year 30.09. Issuing/Redemption daily Deadline 14.00 Asset Manager * - Tactical asset allocation: Swiss Life Asset Management Ltd - Use of homogeneous investment groups:
Diverse acc. to Swiss Life Best Select Invest Plus®
External consultation PPCmetrics provides the following services within the homogeneous investment groups: Advisory services relating to suitable man-date structure, support with selection of suitable asset managers and support with ongoing monitoring of asset managers and evaluation of investment results Deadline Bloomberg: ASSL www.swisslife.ch/anlagestiftung Total expense ratio TERKGAST ** - ex ante 1.35% - ex post per 30.09.2015 1.36% Issuing/redemption commission none Distribution policy Profit retention * The selection of managers who Swiss Life Asset
Management Ltd permanently monitors and supports through the process in accordance with objective criteria and best institutional practice
** The total expense ratio TERKGAST includes all costs with the exception of transaction costs and trans-action-related taxes
Statistical information (annualised)
since 1Y 3Y 5Y 10Y 30.09.01 Volatility Investment Group (in %) 4.52 3.44 3.22 4.19 3.96 Volatility Benchmark (in %) 4.03 3.08 2.91 3.96 3.81 Tracking Error ex post (in %) 0.62 0.51 0.50 0.63 0.63 Tracking Error ex ante (in %) 0.60 Information Ratio -2.99 -2.53 -2.06 -2.00 -2.33 Sharpe Ratio 0.26 1.16 1.20 0.36 0.55 Correlation 1.00 0.99 0.99 0.99 0.99 Beta 1.12 1.11 1.10 1.05 1.02 Jensen-Alpha -2.17 -1.82 -1.47 -1.37 -1.49 Maximum Drawdown (in %) -4.84 -5.26 -6.49 -15.36 -15.36 Recovery Period (years) n.a. 0.68 0.40 2.82 2.82
Key figures
31.12.2014 30.09.2015 Assets in CHF (m) 250.0 295.3 Net asset value per entitlement in CHF 146.25 144.50
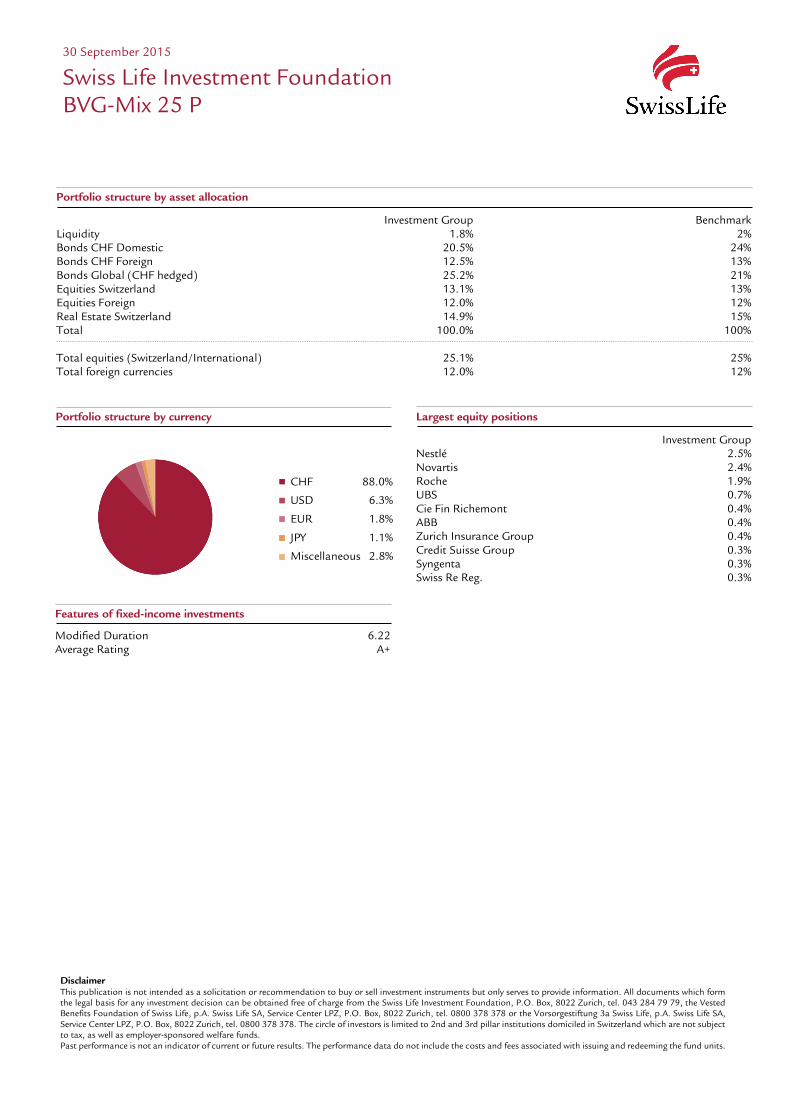
Portfolio structure by currency
Largest equity positions
Investment Group Nestlé 2.5% Novartis 2.4% Roche 1.9% UBS 0.7% Cie Fin Richemont 0.4% ABB 0.4% Zurich Insurance Group 0.4% Credit Suisse Group 0.3% Syngenta 0.3% Swiss Re Reg. 0.3%
Disclaimer This publication is not intended as a solicitation or recommendation to buy or sell investment instruments but only serves to provide information. All documents which form the legal basis for any investment decision can be obtained free of charge from the Swiss Life Investment Foundation, P.O. Box, 8022 Zurich, tel. 043 284 79 79, the Vested Benefits Foundation of Swiss Life, p.A. Swiss Life SA, Service Center LPZ, P.O. Box, 8022 Zurich, tel. 0800 378 378 or the Vorsorgestiftung 3a Swiss Life, p.A. Swiss Life SA, Service Center LPZ, P.O. Box, 8022 Zurich, tel. 0800 378 378. The circle of investors is limited to 2nd and 3rd pillar institutions domiciled in Switzerland which are not subject to tax, as well as employer-sponsored welfare funds. Past performance is not an indicator of current or future results. The performance data do not include the costs and fees associated with issuing and redeeming the fund units.
30 September 2015
Swiss Life Investment Foundation BVG-Mix 25 P
CHF 88.0%
USD 6.3%
EUR 1.8%
JPY 1.1%
Miscellaneous 2.8%
Portfolio structure by asset allocation
Investment Group Benchmark Liquidity 1.8% 2% Bonds CHF Domestic 20.5% 24% Bonds CHF Foreign 12.5% 13% Bonds Global (CHF hedged) 25.2% 21% Equities Switzerland 13.1% 13% Equities Foreign 12.0% 12% Real Estate Switzerland 14.9% 15% Total 100.0% 100% Total equities (Switzerland/International) 25.1% 25% Total foreign currencies 12.0% 12%
Features of fixed-income investments
Modified Duration 6.22 Average Rating A+
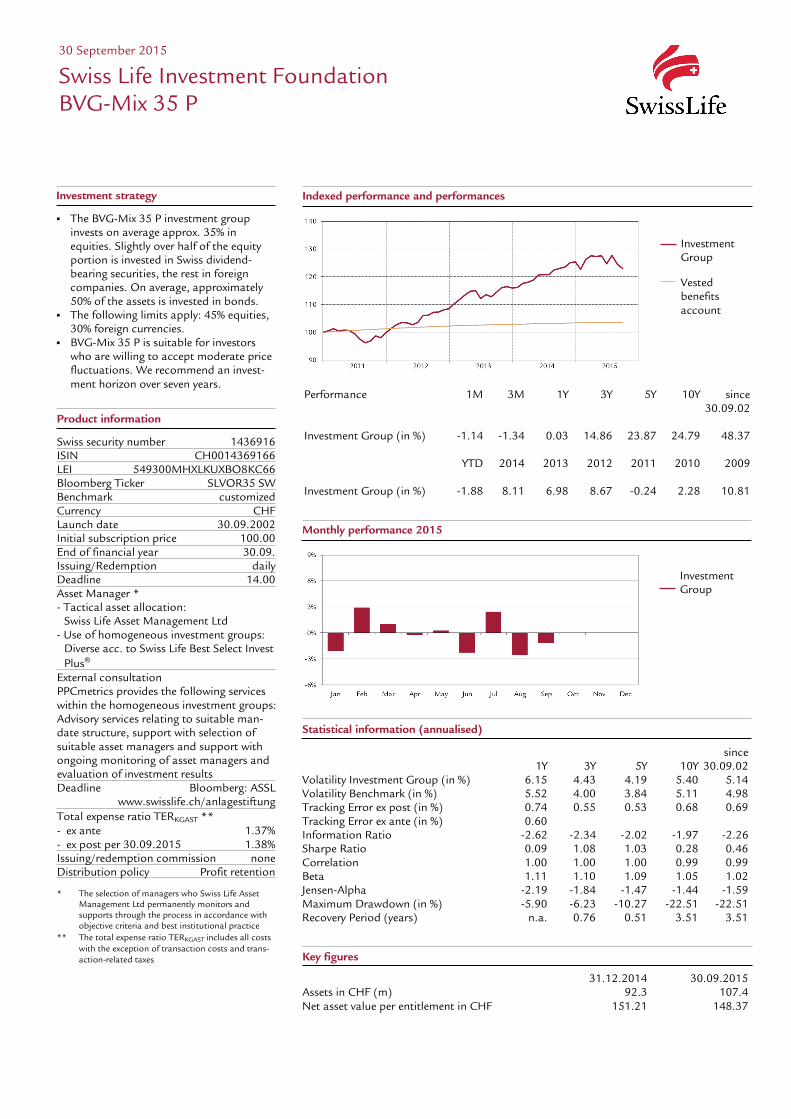
Indexed performance and performances
Performance 1M 3M 1Y 3Y 5Y 10Y since 30.09.02 Investment Group (in %) -1.14 -1.34 0.03 14.86 23.87 24.79 48.37 YTD 2014 2013 2012 2011 2010 2009 Investment Group (in %) -1.88 8.11 6.98 8.67 -0.24 2.28 10.81
30 September 2015
Swiss Life Investment Foundation BVG-Mix 35 P
Investment strategy
The BVG-Mix 35 P investment group invests on average approx. 35% in equities. Slightly over half of the equity portion is invested in Swiss dividend-bearing securities, the rest in foreign companies. On average, approximately 50% of the assets is invested in bonds.
The following limits apply: 45% equities, 30% foreign currencies.
BVG-Mix 35 P is suitable for investors who are willing to accept moderate price fluctuations. We recommend an invest-ment horizon over seven years.
Investment Group Vested benefits account
Monthly performance 2015
Investment Group
Product information
Swiss security number 1436916 ISIN CH0014369166 LEI 549300MHXLKUXBO8KC66 Bloomberg Ticker SLVOR35 SW Benchmark customized Currency CHF Launch date 30.09.2002 Initial subscription price 100.00 End of financial year 30.09. Issuing/Redemption daily Deadline 14.00 Asset Manager * - Tactical asset allocation: Swiss Life Asset Management Ltd - Use of homogeneous investment groups:
Diverse acc. to Swiss Life Best Select Invest Plus®
External consultation PPCmetrics provides the following services within the homogeneous investment groups: Advisory services relating to suitable man-date structure, support with selection of suitable asset managers and support with ongoing monitoring of asset managers and evaluation of investment results Deadline Bloomberg: ASSL www.swisslife.ch/anlagestiftung Total expense ratio TERKGAST ** - ex ante 1.37% - ex post per 30.09.2015 1.38% Issuing/redemption commission none Distribution policy Profit retention * The selection of managers who Swiss Life Asset
Management Ltd permanently monitors and supports through the process in accordance with objective criteria and best institutional practice
** The total expense ratio TERKGAST includes all costs with the exception of transaction costs and trans-action-related taxes
Statistical information (annualised)
since 1Y 3Y 5Y 10Y 30.09.02 Volatility Investment Group (in %) 6.15 4.43 4.19 5.40 5.14 Volatility Benchmark (in %) 5.52 4.00 3.84 5.11 4.98 Tracking Error ex post (in %) 0.74 0.55 0.53 0.68 0.69 Tracking Error ex ante (in %) 0.60 Information Ratio -2.62 -2.34 -2.02 -1.97 -2.26 Sharpe Ratio 0.09 1.08 1.03 0.28 0.46 Correlation 1.00 1.00 1.00 0.99 0.99 Beta 1.11 1.10 1.09 1.05 1.02 Jensen-Alpha -2.19 -1.84 -1.47 -1.44 -1.59 Maximum Drawdown (in %) -5.90 -6.23 -10.27 -22.51 -22.51 Recovery Period (years) n.a. 0.76 0.51 3.51 3.51
Key figures
31.12.2014 30.09.2015 Assets in CHF (m) 92.3 107.4 Net asset value per entitlement in CHF 151.21 148.37
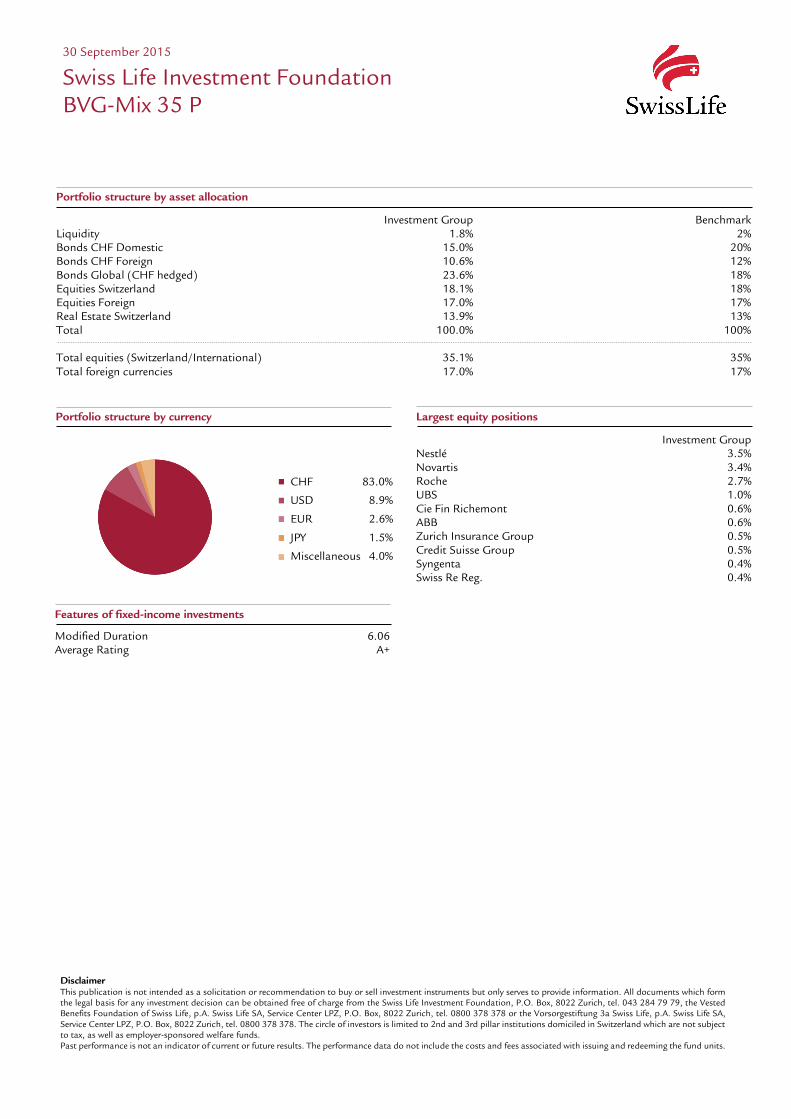
Portfolio structure by currency
Largest equity positions
Investment Group Nestlé 3.5% Novartis 3.4% Roche 2.7% UBS 1.0% Cie Fin Richemont 0.6% ABB 0.6% Zurich Insurance Group 0.5% Credit Suisse Group 0.5% Syngenta 0.4% Swiss Re Reg. 0.4%
Disclaimer This publication is not intended as a solicitation or recommendation to buy or sell investment instruments but only serves to provide information. All documents which form the legal basis for any investment decision can be obtained free of charge from the Swiss Life Investment Foundation, P.O. Box, 8022 Zurich, tel. 043 284 79 79, the Vested Benefits Foundation of Swiss Life, p.A. Swiss Life SA, Service Center LPZ, P.O. Box, 8022 Zurich, tel. 0800 378 378 or the Vorsorgestiftung 3a Swiss Life, p.A. Swiss Life SA, Service Center LPZ, P.O. Box, 8022 Zurich, tel. 0800 378 378. The circle of investors is limited to 2nd and 3rd pillar institutions domiciled in Switzerland which are not subject to tax, as well as employer-sponsored welfare funds. Past performance is not an indicator of current or future results. The performance data do not include the costs and fees associated with issuing and redeeming the fund units.
30 September 2015
Swiss Life Investment Foundation BVG-Mix 35 P
CHF 83.0%
USD 8.9%
EUR 2.6%
JPY 1.5%
Miscellaneous 4.0%
Portfolio structure by asset allocation
Investment Group Benchmark Liquidity 1.8% 2% Bonds CHF Domestic 15.0% 20% Bonds CHF Foreign 10.6% 12% Bonds Global (CHF hedged) 23.6% 18% Equities Switzerland 18.1% 18% Equities Foreign 17.0% 17% Real Estate Switzerland 13.9% 13% Total 100.0% 100% Total equities (Switzerland/International) 35.1% 35% Total foreign currencies 17.0% 17%
Features of fixed-income investments
Modified Duration 6.06 Average Rating A+
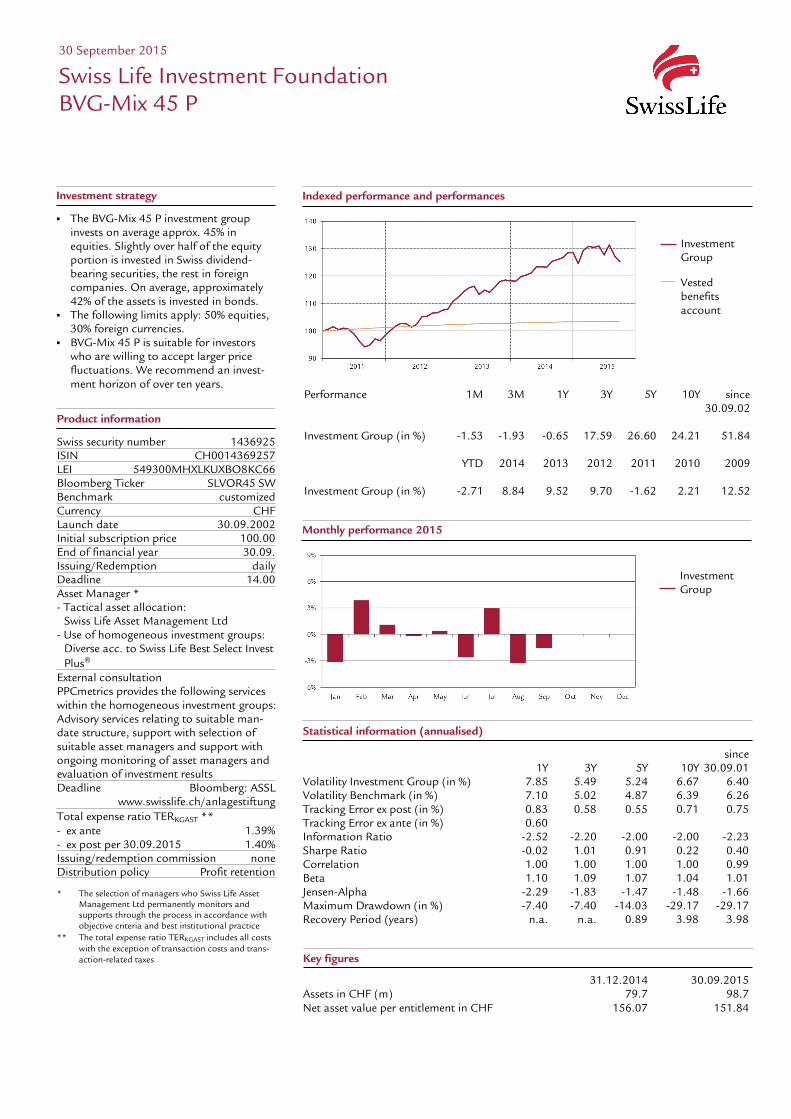
Indexed performance and performances
Performance 1M 3M 1Y 3Y 5Y 10Y since 30.09.02 Investment Group (in %) -1.53 -1.93 -0.65 17.59 26.60 24.21 51.84 YTD 2014 2013 2012 2011 2010 2009 Investment Group (in %) -2.71 8.84 9.52 9.70 -1.62 2.21 12.52
30 September 2015
Swiss Life Investment Foundation BVG-Mix 45 P
Investment strategy
The BVG-Mix 45 P investment group invests on average approx. 45% in equities. Slightly over half of the equity portion is invested in Swiss dividend-bearing securities, the rest in foreign companies. On average, approximately 42% of the assets is invested in bonds.
The following limits apply: 50% equities, 30% foreign currencies.
BVG-Mix 45 P is suitable for investors who are willing to accept larger price fluctuations. We recommend an invest-ment horizon of over ten years.
Investment Group Vested benefits account
Monthly performance 2015
Investment Group
Product information
Swiss security number 1436925 ISIN CH0014369257 LEI 549300MHXLKUXBO8KC66 Bloomberg Ticker SLVOR45 SW Benchmark customized Currency CHF Launch date 30.09.2002 Initial subscription price 100.00 End of financial year 30.09. Issuing/Redemption daily Deadline 14.00 Asset Manager * - Tactical asset allocation: Swiss Life Asset Management Ltd - Use of homogeneous investment groups:
Diverse acc. to Swiss Life Best Select Invest Plus®
External consultation PPCmetrics provides the following services within the homogeneous investment groups: Advisory services relating to suitable man-date structure, support with selection of suitable asset managers and support with ongoing monitoring of asset managers and evaluation of investment results Deadline Bloomberg: ASSL www.swisslife.ch/anlagestiftung Total expense ratio TERKGAST ** - ex ante 1.39% - ex post per 30.09.2015 1.40% Issuing/redemption commission none Distribution policy Profit retention * The selection of managers who Swiss Life Asset
Management Ltd permanently monitors and supports through the process in accordance with objective criteria and best institutional practice
** The total expense ratio TERKGAST includes all costs with the exception of transaction costs and trans-action-related taxes
Statistical information (annualised)
since 1Y 3Y 5Y 10Y 30.09.01 Volatility Investment Group (in %) 7.85 5.49 5.24 6.67 6.40 Volatility Benchmark (in %) 7.10 5.02 4.87 6.39 6.26 Tracking Error ex post (in %) 0.83 0.58 0.55 0.71 0.75 Tracking Error ex ante (in %) 0.60 Information Ratio -2.52 -2.20 -2.00 -2.00 -2.23 Sharpe Ratio -0.02 1.01 0.91 0.22 0.40 Correlation 1.00 1.00 1.00 1.00 0.99 Beta 1.10 1.09 1.07 1.04 1.01 Jensen-Alpha -2.29 -1.83 -1.47 -1.48 -1.66 Maximum Drawdown (in %) -7.40 -7.40 -14.03 -29.17 -29.17 Recovery Period (years) n.a. n.a. 0.89 3.98 3.98
Key figures
31.12.2014 30.09.2015 Assets in CHF (m) 79.7 98.7 Net asset value per entitlement in CHF 156.07 151.84

Portfolio structure by currency
Largest equity positions
Investment Group Nestlé 4.4% Novartis 4.3% Roche 3.4% UBS 1.2% Cie Fin Richemont 0.8% ABB 0.7% Zurich Insurance Group 0.7% Credit Suisse Group 0.6% Syngenta 0.6% Swiss Re Reg. 0.5%
Disclaimer This publication is not intended as a solicitation or recommendation to buy or sell investment instruments but only serves to provide information. All documents which form the legal basis for any investment decision can be obtained free of charge from the Swiss Life Investment Foundation, P.O. Box, 8022 Zurich, tel. 043 284 79 79, the Vested Benefits Foundation of Swiss Life, p.A. Swiss Life SA, Service Center LPZ, P.O. Box, 8022 Zurich, tel. 0800 378 378 or the Vorsorgestiftung 3a Swiss Life, p.A. Swiss Life SA, Service Center LPZ, P.O. Box, 8022 Zurich, tel. 0800 378 378. The circle of investors is limited to 2nd and 3rd pillar institutions domiciled in Switzerland which are not subject to tax, as well as employer-sponsored welfare funds. Past performance is not an indicator of current or future results. The performance data do not include the costs and fees associated with issuing and redeeming the fund units.
30 September 2015
Swiss Life Investment Foundation BVG-Mix 45 P
CHF 78.1%
USD 11.4%
EUR 3.3%
JPY 2.0%
Miscellaneous 5.2%
Portfolio structure by asset allocation
Investment Group Benchmark Liquidity 1.8% 2% Bonds CHF Domestic 11.4% 16% Bonds CHF Foreign 10.5% 11% Bonds Global (CHF hedged) 20.6% 15% Equities Switzerland 23.3% 23% Equities Foreign 21.9% 22% Real Estate Switzerland 10.5% 11% Total 100.0% 100% Total equities (Switzerland/International) 45.2% 45% Total foreign currencies 21.9% 22%
Features of fixed-income investments
Modified Duration 6.10 Average Rating A+