30 april 2021 performance - martin currie
TRANSCRIPT

30 APRIL 2021
PROFILE
Objective To achieve long-term returns in
excess of the total return from
the MSCI All Country World
index.
Benchmark MSCI All Country World index
Sector Global
Launch 1999
PERFORMANCE
Cumulative performance over periods to 30 April 2021
One
month
Three
months
Six
months
One
year
Three
years
Five
years
Share price 10.1% 5.3% 15.9% 37.1% 69.4% 129.1%
NAV 5.1% 5.0% 14.3% 30.4% 62.5% 124.8%
Benchmark 4.0% 8.7% 19.8% 32.8% 47.1% 107.1%
12-months performance
To end
Q1 2021
To end
Q1 2020
To end
Q1 2019
To end
Q1 2018
To end
Q1 2017
Share price 32.4% 3.8% 17.8% (0.7%) 31.5%
NAV 32.0% 3.5% 17.5% 0.5% 31.4%
Benchmark 38.9% (5.7%) 11.1% 2.6% 32.9%
Past performance is not a guide to future returns.
Source: Martin Currie. The NAV basis used is cum-income in £. Please note prior to July 2017 the NAV basis
used was ex-income NAV in £. Ex-income NAVs exclude current-year income, while cum-income NAVs include
current-year income. These figures do not include the cost of buying and selling shares in an investment trust. If
these were included, performance figures would be reduced.
Prior to 1 February 2020 the Trust's benchmark was the FTSE World index and the MSCI All Country World
Index (ACWI) thereafter.
Source: Martin Currie and FIS APT. Active share is a measure of the percentage difference between the portfolio holdings and the index constituents.
Source for historic yield: Martin Currie as at 30 April 2021. The historic yield reflects dividends declared for the previous financial year as a percentage
of the mid-market share price, as at the date shown. Investors may be subject to tax on their dividends.
The NAV stated in our reporting is inclusive of current year revenue. All sources (unless indicated): Martin Currie as at 30 April 2021.
Shares for French-based luxury group Kering
were strong in April responding to a solid first-
quarter sales performance which beat market
expectations. This was despite trading
conditions in Europe remaining challenging
because of COVID-19 and the very limited
opportunity for international travel. Significantly,
it was Gucci that led Kering’s outperformance in
the month. This key brand had a weaker
showing than its peers in 2020 (arguably
because of more exposure to highly impacted
geographies, particularly Italy), so its improved
performance has been well received by
investors. Chinese pharmaceutical firm Wuxi
Biologics was another notable performer during
the month, after strong results towards the end
of March which showed revenue growth ahead
of expectations. As a result, the management
team are looking to expand the employee
headcount by around 50% this year to support
the strong operational momentum. Mettler
Toledo, a leading global supplier of precision
instruments, was also supportive to the
portfolio’s performance. Although there was no
specific news flow regarding the company, its
competitor Sartorius AG reported strong growth
in one of its divisions, which was likely to have
been regarded as a positive indicator for Mettler
Toledo’s outlook.
On the other side, ResMed – a global leader in
the development of medical devices that
diagnose, treat and manage respiratory
disorders – was a notable drag on portfolio
performance following company results that
disappointed the market. However, the
company provided more information on the
release of a key product later in the year, which
should enable continued share gains based on
improved patient experience. Elsewhere, Assa
Abloy’s share price also struggled in April after
management indicated that the spike in steel
prices may impact company margins. As a
market leader in locks, Assa Abloy usually
manages to offset raw material inflation with
price increases of its own. However, the
unusually rapid and steep rise in steel prices in
the US means that there will be a lag in the
company being able to pass this through.
However, we are confident that Assa Abloy
retains its pricing power in the long term.
Finally, the Swedish industrial tools and
equipment manufacturer Atlas Copco also
underperformed the market in April after a
particularly strong outperformance in the first
quarter.
In terms of portfolio activity, there were no new
purchases or outright sales.
MANAGERS' COMMENTARY
Zehrid Osmani
PORTFOLIO
Region allocation
31 Mar 30 Apr
North America 42.8% 43.1%
Europe 39.3% 39.2%
Emerging Markets 16.0% 15.7%
Pacific ex Japan 7.2% 7.2%
Middle East 2.3% 2.4%
Cash 2.2% 1.8%
*The risk outlined at the end of this document relating to gearing is particularly relevant to this company but should be read in conjunction with all
warnings and comments given.
Gearing* (9.8%) (9.4%)
Top 10 holdings
43.4(43.4% of total portfolio)
Taiwan Semiconductor
Manufacturing Co Ltd
5.1%
Microsoft Corp 4.7%
Masimo Corp 4.4%
Atlas Copco AB 4.4%
Kingspan Group PLC 4.3%
Linde PLC 4.2%
Visa Inc 4.2%
Moncler SpA 4.1%
Hexagon AB 4.1%
Wuxi Biologics Cayman Inc 3.9%
Number of holdings 31
Number of countries 13
Active share 99.2%
Key facts
Total assets
Share price (p)
Net asset value per share (p)
Discount (premium)
Historic net yield
£347.6m
388.0
374.3
(3.7%)
1.1%
†
‡
†
‡
CAPITAL STRUCTURE
Ordinary shares 84,844,443
BOARD OF DIRECTORS
Gillian Watson (chairman) Neil Gaskell
Marian Glen
Christopher Metcalfe
Gary Le Sueur
KEY INFORMATION
Year end
Annual general meeting
Interim dividends paid
Investment management fee^
31 January
June
January, April, July, October
0.5% per annum for the first £300m of the
NAV (excluding income) and 0.35% for the
NAV (excluding income) in excess of
£300m, calculated quarterly.
Ongoing charge 0.60% (as at 31 July 2020)§
TIDM code
Reuters code
Sedol code
MNP
MNP.L
0537241
^Management fee effective 1 February 2021.
Percentage of shareholders' funds.§
Net asset value and dividend history
As at
31 January
Share
price
NAV
per share
Discount/
(premium)
Dividend
per share
2011 125.0p 135.5p 7.7% 3.50p
2012 129.0p 139.2p 7.3% 3.70p
2013 147.4p 152.6p 3.4% 3.90p
2014 156.5p 157.4p 0.6% 4.00p
2015 179.5p 178.6p (0.5%) 4.10p
2016 173.0p 176.3p 1.9% 4.15p
2017 223.8p 224.0p 0.1% 4.20p
2018 247.0p 246.2p (0.3%) 4.20p
2019 242.0p 245.9p 1.6% 4.20p
2020 311.0p 301.9p (3.0%) 4.20p
2021 370.0p 258.0p (3.4%) 4.20p
Past performance is not a guide to future returns.
IMPORTANT INFORMATION
This information is issued and approved by Martin Currie Investment Management Limited. It does not constitute investment advice. Market and currencymovements may cause the capital value of shares, and the income from them, to fall as well as rise and you may get back less than you invested. Please notethat, as the shares in investment trusts are traded on a stockmarket, the share price will fluctuate in accordance with supply and demand and may not reflect the
value of underlying net asset value of the shares.
Depending on market conditions and market sentiment, the spread between purchase and sale price can be wide. As with all stock exchange investments thevalue of investment trust share purchases will immediately fall by the difference between the buying and selling prices, the bid-offer spread. The value of
investments and the income from them may go down as well as up and is not guaranteed. An investor may not get back the amount originally invested.
Investment trusts may borrow money in order to make further investments. This is known as 'gearing' and can enhance shareholder returns in rising markets but,conversely, can reduce them in falling markets.
The majority of charges will be deducted from the capital of the Company. This will constrain capital growth of the Company in order to maintain the incomestreams.
Morningstar Rating for Funds
Morningstar rates funds from one to five stars based on how well they've performed (after adjusting for risk) in comparison to similar funds. Within eachMorningstar Category, the top 10% of funds receive five stars, the next 22.5% four stars, the middle 35% three stars, the next 22.5% two stars, and the bottom10% receive one star. Funds are rated for up to three time periods—three-, five-, and 10 years—and these ratings are combined to produce an overall rating.
Funds with less than three years of history are not rated. Ratings are objective, based entirely on a mathematical evaluation of past performance. They’re a usefultool for identifying funds worthy of further research, but shouldn’t be considered buy or sell recommendations.
© 2020 Morningstar, Inc. All rights reserved. The information contained herein: (1) is proprietary to Morningstar and/or its content providers; (2) may not be copiedor distributed; and (3) is not warranted to be accurate, complete, or timely. Neither Morningstar nor its content providers are responsible for any damages orlosses arising from any use of this information. Past performance is no guarantee of future results.
Martin Currie Investment Management Limited, registered in Scotland (no SC066107).
Registered office: Saltire Court, 20 Castle Terrace, Edinburgh EH1 2ES
Tel: 0808 100 2125 Fax: 0870 888 3035 www.martincurrie.com
This company is authorised and regulated by the Financial Conduct Authority. Please note that call to the above number may be recorded.
Zehrid Osmani
Zehrid joined Martin Currie from BlackRock where, during his tenyears, he played a key part in building their successful Europeanequity franchise. He held a number of senior roles at the company,including Head of European Research, with responsibility for a 23-strong team of analysts. In this role, he developed and implementeda fundamental research platform, demonstrating his strongunderstanding of equity research. Zehrid also managed a number ofequity funds at BlackRock, with a specific focus on managing theteam's unconstrained, high conviction, long term portfolios, driven byfundamental research.
MANAGER'S BIOGRAPHY
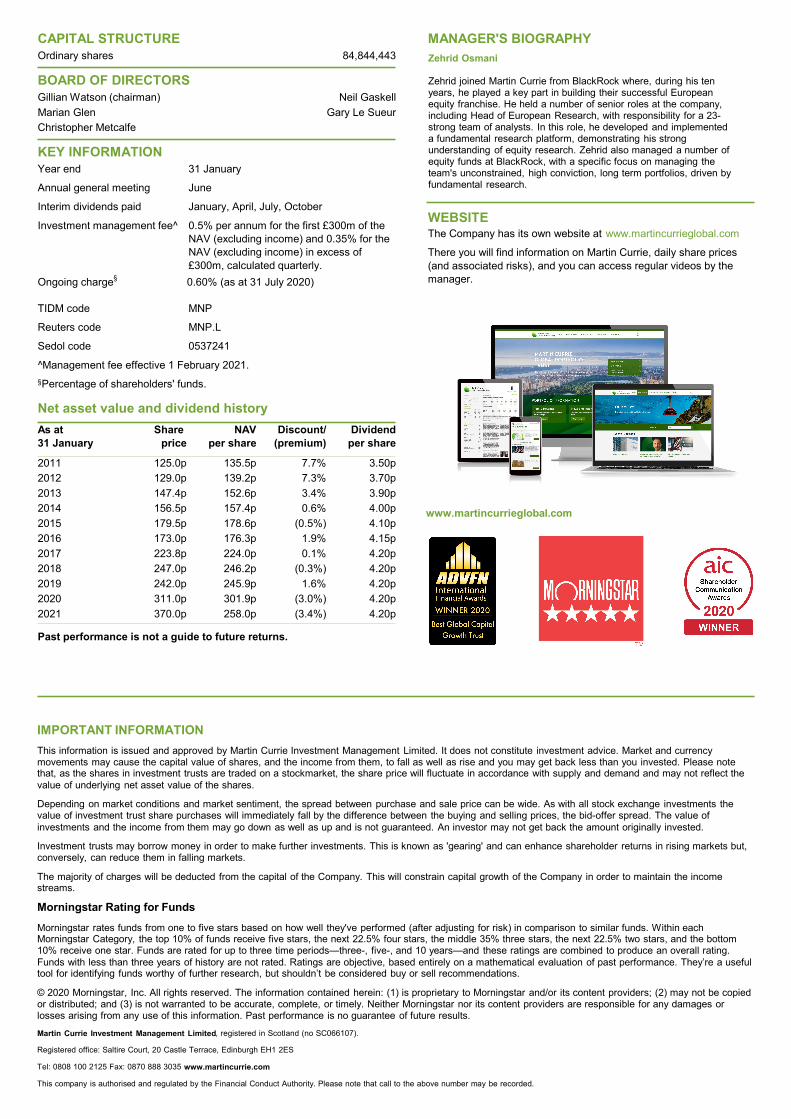
WEBSITEThe Company has its own website at www.martincurrieglobal.com
There you will find information on Martin Currie, daily share prices
(and associated risks), and you can access regular videos by the
manager.
www.martincurrieglobal.com