3-part series · group wholesale fit direct white label loyalty ota ... •create your kpi’s ......
TRANSCRIPT


3-Part Series
1.Big Box Integrated Resort insights (Jack Easdale, Venetian|Palazzo)
2.High-End Boutique insights (Nicole Young, SBE)
3.Demographic/Psychographic insights (Angie Dobney, Rainmaker)
2
Transcending Optimization
Integrated Resorts Insights
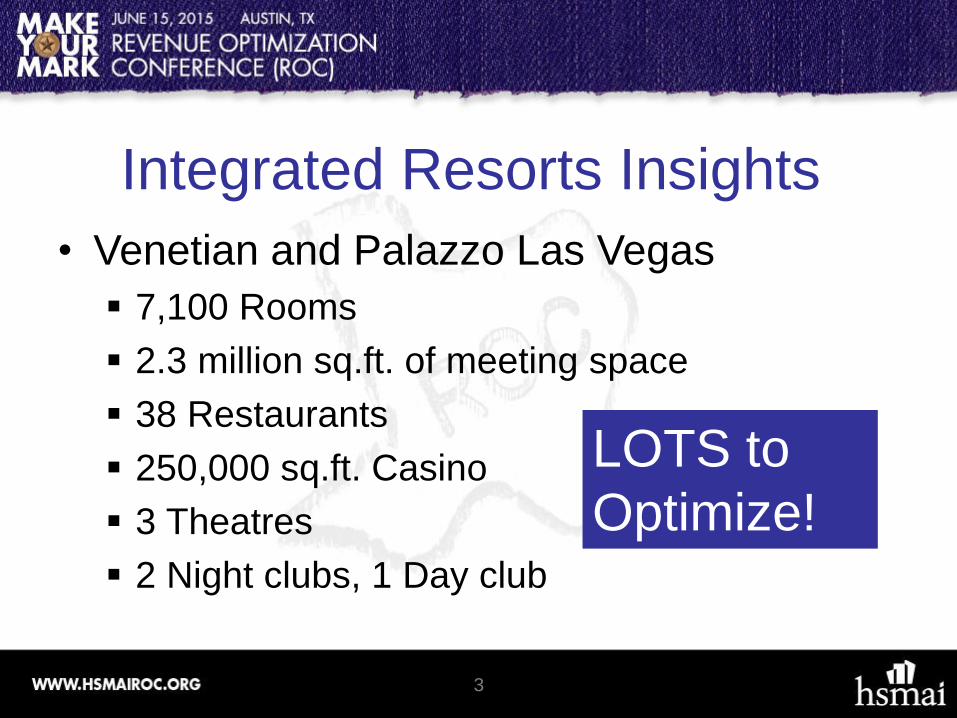
• Venetian and Palazzo Las Vegas
7,100 Rooms
2.3 million sq.ft. of meeting space
38 Restaurants
250,000 sq.ft. Casino
3 Theatres
2 Night clubs, 1 Day club
3
LOTS to
Optimize!

Integrated Resorts Insights Minneapolis 2006
Orlando 2007
Austin 2008
Anaheim 2009
Orlando 2010
Austin 2011
Baltimore 2012
Minneapolis 2013
Los Angeles 2014
Austin 2015
4
This is my 10th
HSMAI ROC
Conference,
and the
feedback in the
survey is the
same every
year….
“Give me
something I
can take
back to my
hotel AND
USE”
Integrated Resorts Insights
5
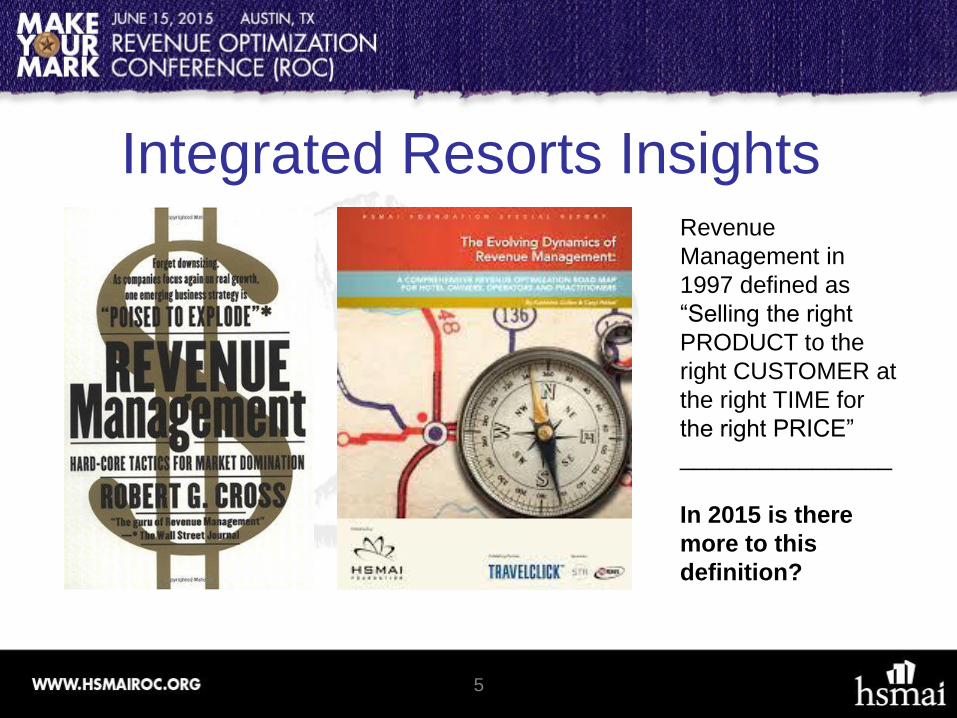
Revenue
Management in
1997 defined as
“Selling the right
PRODUCT to the
right CUSTOMER at
the right TIME for
the right PRICE”
________________
In 2015 is there
more to this
definition?

Integrated Resorts Insights
• I’ll argue there IS more to the definition
• Selling the right PRODUCT to the right
CUSTOMER at the right TIME for the right
PRICE…at the right COST!
6

Integrated Resorts Insights
• Vegas hotels routinely run 90-95% months selling out
most nights
• Vegas hotels have numerous nights with $500-$1,000
standard room rates market-wide (NYE, CES, Fight
Weekends, Memorial Day, Electric Daisy Carnival, AAPEX, etc.)
• When demand exceeds supply, raise rates right?
• When demand exceeds supply, optimize market mix to
favor higher margin segments right?
• But do you REALLY know what’s optimal?
7

Integrated Resorts Insights • To truly optimize the PROFIT for your owners and
shareholders, you need to unequivocally understand two
sides of the equation:
1. The Marginal REVENUE associated with selling the next
room, per segment
2. The Marginal EXPENSE associated with selling the next
room, per segment
8
Integrated Resorts Insights
• Nobody in your property or company understands Room
Revenue like you do. Nobody.
• If you’ve completed an in-depth distribution channel
analysis for your property or company, nobody
understands directly attributable Distribution Costs like
you do.
9

Integrated Resorts Insights
10
Two fantastic resources on Distribution. GET THEM!

Integrates Resorts Insights
• Revenues Per Room – Room Revenue ($237)
– F&B Revenue ($40)
– Meeting Room Rental ($17)
– Casino Theo ($25)
– Retail Revenue ($10)
– Resort Fee Revenue ($21)
• Total Revenue Per Guest is $350
11

Integrates Resorts Insights
• Expenses Per Room – Rooms Expense ($55)* Includes Sales, Mktg, & Distro costs
– F&B Expense ($30)
– Meeting Room Expense ($6)
– Casino Expenses ($10)
– Retail Expenses ($8)
– Resort Fee Expenses ($6)
• Total Expense Per Guest is $115
12

Integrated Resorts Insights
• In this simple generic example…
Revenues per Room $350
Expenses per Room $115
EBITDA per Room $235
13
P and L by Market Segment
• Now here where it becomes interesting
• Now here’s where it becomes cumbersome
• Now here’s where you buy your Controller a beer, because he/she’s
going to be your new best friend
• Now here’s where you provide REAL value to your organization by
making optimal decisions
14
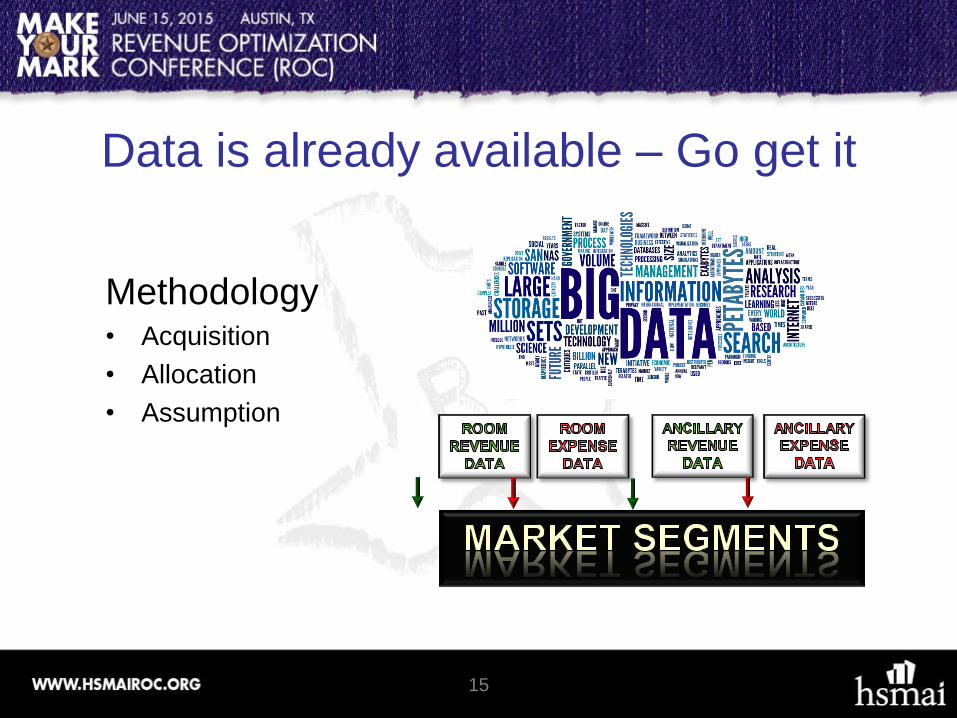
Methodology • Acquisition
• Allocation
• Assumption
15
Data is already available – Go get it

16
Data Acquisition – Required data
• Room Data – Revenues AND Expenses – Room nights and revenue by market segment
– Include any resort fees, forfeit deposits, upgrades, etc.
• Ancillary Data – Revenues AND Expenses – Entertainment, meeting space rental, F&B including room service and restaurants, entertainment, retail,
etc.
• Cost per Occupied Room – Expense – This should already be defined by the Controller
Historical P&Ls are vital for this process – This data should be available via the Controller
Revenue (at a minimum) must be captured by group code to allow market segment association
Expenses can later be allocated with some base assumptions

17
Allocation
– Allocation is the tricky part and will demand some
one on one time with department leaders
• i.e. Sales Directors will be your best friend….
Two primary items must be defined for each expense per segment: % of expenses to segment AND distribution of said expenses within each segment
Some specific expenses will be impossible to break into % allocations, assumptions will be used to fill the gaps (Next Slide)
ExpenseExpense Category
Summary
Electronic Channel
PortionGDS% OTA% IHG% Sales Corporate Tradeshow Wholesale
TOTAL PAYROLL EXPENSES Departmental Expense 15% 30% 100%
80150 - COMMISSIONS Z Do Not Use Commission 50% 100% 50% 60% 30% 10%
80180 - CONTRACT LABOR Departmental Expense 30% 33% 33% 33% 50% 33% 33% 33%
80185 - COMP-ON PROPERTY Departmental Expense 40% 12% 88% 40% 12% 88%
80210 - DUES,MEM, & SUBS Departmental Expense 50% 100% 50% 50% 50%
Clearly define the segments: Sales, Wholesale, BAR, OTA, etc.
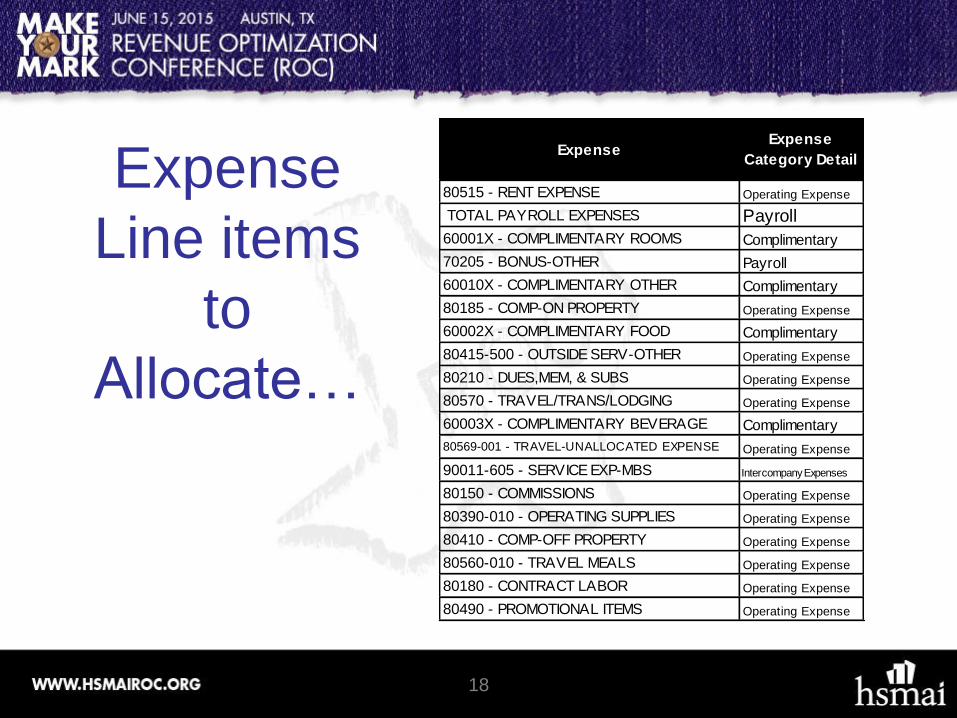
Expense
Line items
to
Allocate…
18
ExpenseExpense
Category Detail
80515 - RENT EXPENSE Operating Expense
TOTAL PAYROLL EXPENSES Payroll
60001X - COMPLIMENTARY ROOMS Complimentary
70205 - BONUS-OTHER Payroll
60010X - COMPLIMENTARY OTHER Complimentary
80185 - COMP-ON PROPERTY Operating Expense
60002X - COMPLIMENTARY FOOD Complimentary
80415-500 - OUTSIDE SERV-OTHER Operating Expense
80210 - DUES,MEM, & SUBS Operating Expense
80570 - TRAVEL/TRANS/LODGING Operating Expense
60003X - COMPLIMENTARY BEVERAGE Complimentary
80569-001 - TRAVEL-UNALLOCATED EXPENSE Operating Expense
90011-605 - SERVICE EXP-MBS Intercompany Expenses
80150 - COMMISSIONS Operating Expense
80390-010 - OPERATING SUPPLIES Operating Expense
80410 - COMP-OFF PROPERTY Operating Expense
80560-010 - TRAVEL MEALS Operating Expense
80180 - CONTRACT LABOR Operating Expense
80490 - PROMOTIONAL ITEMS Operating Expense

19
Potential Results
20
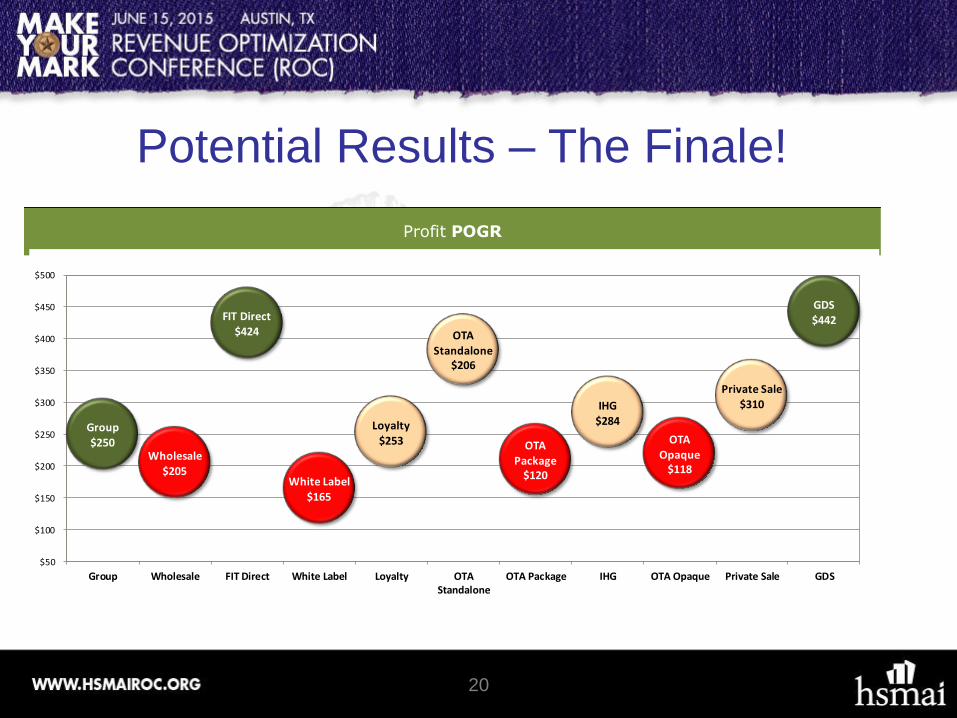
Potential Results – The Finale!
Profit POGR
Group$250
Wholesale
$205
FIT Direct$424
White Label$165
Loyalty$253
OTA
Standalone$206
OTA
Package$120
IHG$284
OTA Opaque
$118
Private Sale
$310
GDS$442
$50
$100
$150
$200
$250
$300
$350
$400
$450
$500
Group Wholesale FIT Direct White Label Loyalty OTAStandalone
OTA Package IHG OTA Opaque Private Sale GDS

21
Transcendent Revenue
Management
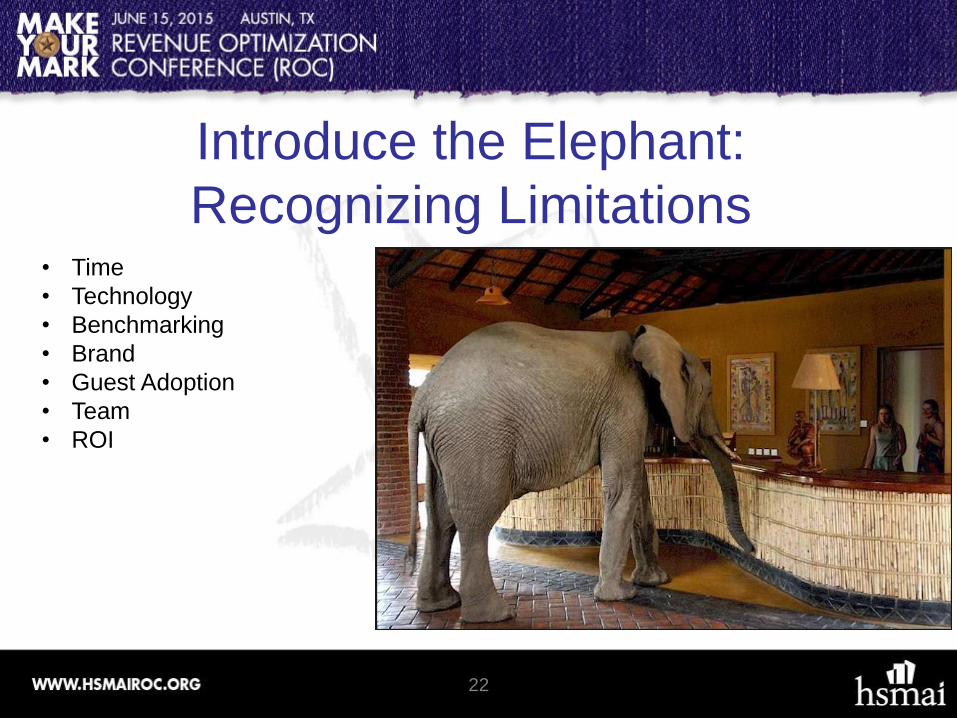
Introduce the Elephant:
Recognizing Limitations
22
• Time
• Technology
• Benchmarking
• Brand
• Guest Adoption
• Team
• ROI

23
DORM
GM’s
Sales &
Conference
Venue
Managers
Front
Line/Support
Staff
The Role of Revenue Management in
TRM Development
• Positioning Activities
– Appropriate for non-peak or low volume
– Is your offering and price optimal?
• SWOT
• Benchmarking tools
• Caution towards disrupting current demand
24
Building Sound Strategy
• Yielding Activities (peak)
– Identify demand & scarcity by venue/income
• Annual seasonality
• Day & week part
• Customer segment (resident vs. non-resident)
• Focus on high potential ROI and captivity rate
• Observation and data collection period
25
Back to the Basics

– Translate to the fundamentals
• ARI equivalent
• Purchase cycle (booking window)
• Establish baseline performance
• Create your KPI’s
• Data and informational requirements
26
Back to the Basics (cont.)
• Identify strategic team
• Methods of deployment - Tactics
– technology/system administration
– training and accountability
– frequency
• Define Success – goal setting
• Period of measurement
27
Executing the Plan

• Elective charges - value of assurance
• Don’t get “fixed” in old ways
• Develop special event revenue plans
28
Easy Ways to Get Started

• Honor your value proposition
• Don’t forget the guest!
– Periodic total trip cost model
– Bifurcated strategy for in-house & local guests
– Social listening, no news is good news
29
Check and Balance

My favorite quote this year!
30
Steve Wynn- 2014 G2E Keynote address
“It’s always been that the non-casino
story was the story. It was never the
slot machines– they’ve been
everywhere for centuries,” Wynn said.
“You got to give people something
they’re willing to get on an airplane
and submit to a body search for,” he
said. “That ain’t a slot machine,
friends, and it sure as hell ain’t a
baccarat table.”

Why focus on Total Revenue Management?
• Applying Revenue Management principles and best
practices: 3-5% increase in Room Revenue
• Applying profit-based total revenue management: 8-15%
lift in Total Profit.
• Providing a tool where your Sales manager can quickly
provide scientific optimized pricing: 11.4% increase in
conversion and a 8.2% increase in group revenue
31

Gaming vs. Non-gaming revenue
32
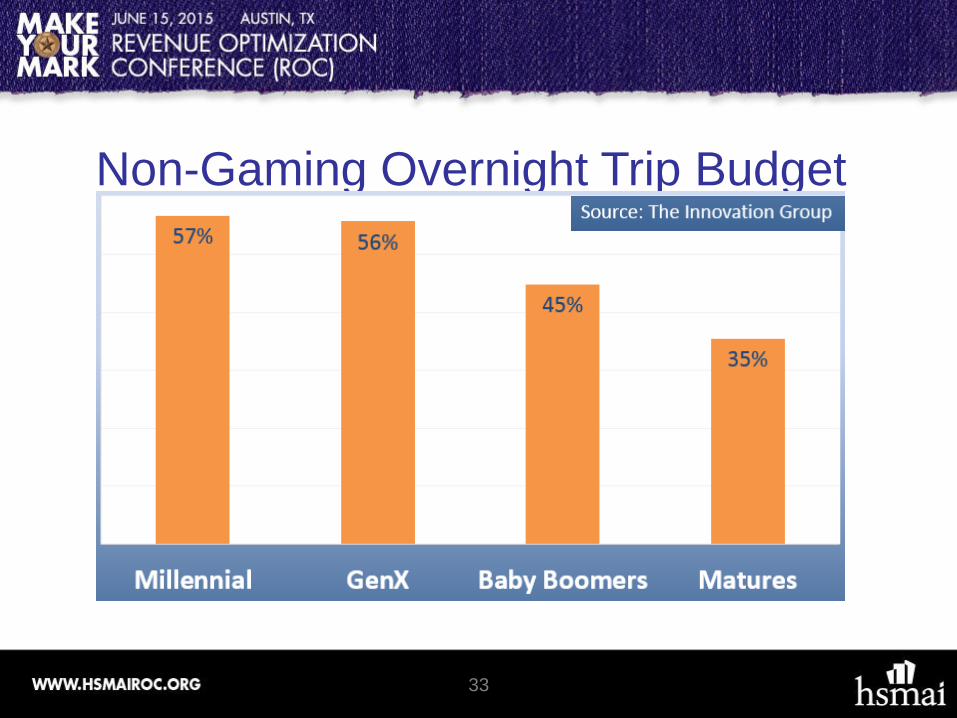
Non-Gaming Overnight Trip Budget
33

Non-Gaming Day Trip Budget
34

A look at what is ahead in spending patterns
• The focus is shifting to target Millennials and not
the Baby Boomers or Gen X.
• Millennials are reaching the age where they are
starting to have spending power. They are
starting to accumulate wealth.
35

How many Millennials are there?
36
72 Million Baby Boomers
50 Million Gen X'ers
81 Million Millennials
Population by Generation

Growth estimates
37
Skift says by 2020, Millennials
will be nearly half the
workforce. By 2030, they’re
predicted to outspend baby
boomers. And they are taking
that spending power and
putting it behind one of their
passions: Travel.

2015 Overnight Trips
Age Group Expected change %
Baby Boomers -1%
Gen X -6%
Millennials 10%
38
MMGY Portrait of American Travelers
Who are they? • They have grown up using technology. It was not
learned. They expect everything to be available all the
time.
• Content creators: 60% of the content out there. They will
leave reviews.
• Educated: they stayed in school during the recession
and earned higher degrees. They are the most
educated generation.
• Engaged: they want to share their experiences with
others.
39

Preferences • They would rather have a great experience
than buy something.
• Not as focused on your room product, but rather the
common areas.
• They enjoy being engaged in groups.
• They like to help people and support issues.
• They like to be healthy.
• They are authentic and crave inspiration and
personalization.
40

Change is happening!
• Almost all hotel companies are changing their look to
attract this new, young customer. Hotel lobbies are
becoming a portal to the local culture surrounding the
property.
• Food and Beverage menu items are changing
– Healthy offerings
– Craft cocktails & Microbrews
41

Has there been an impact on OTA’s?
• 60% of business is coming from meta search engines /
clicks
• 45% of millennial bookings are done via mobile
• OTA’s have launched or retailored brands to target
millennials (Cheaptickets, Hotels.com, etc;)
• Booking widow averages 10 days less with millennials;
rapid information and trained to book last minute
42

Millennial Travel Spend
• Millennials are willing to spend money on
travel, and the amount they’re spending is
increasing. They spent 20% more on trips in
2014 than the previous year.
• They are more likely to indulge in hotel
services such as food, beverage, dry
cleaning and spa treatments.
• They’re also more interested in pet-friendly
accommodations.
43
MMGY Portrait of American Travelers
Millennial Travel Spend
• Today Millennial travelers spend less than older people
on leisure trips: PhoCusWright says older travelers
spend an average of $3,381, while millennials spend
$3,217. But they’re not in their peak earning years yet,
so look for that number to grow.
44
45
Summary
• Taking the Total Revenue Management approach with
your RM strategy increases total profit.
• Millennials love to travel and spend money on these
ancillary revenues.
• Engage this generation thru your brand marketing and
with ancillary products that are profitable.