3 overview of potential alternative energy …
TRANSCRIPT

Alternative Energy Programmatic EIS 3-1 October 2007
3 OVERVIEW OF POTENTIAL ALTERNATIVE ENERGY TECHNOLOGIES ON THE OCS
This chapter provides an overview of alternative energy technologies for which research, demonstration, or commercial projects are likely to be initiated on the Outer Continental Shelf (OCS) within the next 5 to 7 years. Section 3.1 explains how the alternative energy resources for the OCS were selected for further detailed analysis. Sections 3.2 through 3.4 describe how electricity is generated from each of these resources, and Section 3.5 describes the types of activities that can be expected to occur on the OCS as these technologies are tested, implemented, and decommissioned. More detailed information about the wind, wave, and ocean current facilities is provided in Elcock (2006). 3.1 SCREENING OF ALTERNATIVE ENERGY TECHNOLOGIES
Resources on the OCS can be used to generate electricity by using a variety of alternative energy sources. The technologies used to extract this energy are relatively new and untested in the offshore environment of the OCS; therefore, this programmatic Environmental Impact Statement (EIS) focuses on those technologies that are likely to be initiated—for research, demonstration, or commercial scale—within a 5- to 7-year time frame. These technologies use the following resources: wind, wave, and ocean current. Each of these technologies has been demonstrated at the pilot scale, and at least one (wind) has been developed at the commercial scale outside of the United States. Technology to recover tidal resources is currently being tested, but future activities are expected to occur very close to shore, outside of the jurisdiction of the Minerals Management Service (MMS). Other energy sources such as solar power and the production of hydrogen are not expected to be economically viable on the OCS for research, demonstration, or commercial ventures within the next 5 to 7 years and, therefore, are not included in this analysis. The amount of energy produced by each technology and for different devices can vary. To compare electric power output from energy sources to average household consumption rates, an estimate of 1 kilowatt (kW)/household is generally assumed. Therefore, a 1-megawatt (MW) electricity-generating device operating at full capacity would generate enough electricity to supply about 1,000 households. However, the actual number would depend on factors such as the reliability of the system and the availability of the resource. According to the Edison Electric Institute (EEI), the average total per-household use has grown from 1.07 kW/household in 1978 to 1.30 kW/household in 2003, and it is projected to reach 1.45 kW/household by 2030 (EEI 2006).
Water depth is another screening factor. Water depth is particularly important for
offshore wind technologies, where foundations are critical components of the design. Currently available technology allows for siting of wind turbine generators (WTGs) in depths of up to about 30 m (96 ft). Monopiles can be installed in depths of up to about 25 m (80 ft). Depths between 25 and 40 m (80 and 130 ft) may require a tripod or truss foundation. For the next few years, the maximum depth for WTGs will likely be 45 m (144 ft). Deeper waters may require floating wind turbine technology (which is not expected to be commercially viable for at least 10 to 15 years), while very shallow waters are subject to plunging breakers that can cause high

Alternative Energy Programmatic EIS 3-2 October 2007
impact loads on towers and foundation equipment. The most economically viable depth for WTGs is 5 to 20 m (16 to 64 ft) (TRC 2006).
For offshore wave energy conversion (WEC) technologies, water depth requirements
vary with the type of technology but are generally in the range of 20 to 90 m (66 to 300 ft). Wave attenuators may require at least 50 m (150 ft). For ocean current technologies, depths again depend on the technology and can range from as little as 18 to 36 m (60 to 120 ft) to up to 90 to 500 m (300 to 1,600 ft) or more.
Screening criteria should also consider the distance between the offshore facility and the
onshore interconnections. The distance between an OCS facility and the shoreline can be an influential factor in the overall cost of facility installation. Transmission system installation costs and maintenance and repair costs tend to increase the farther a project is from shore. Existing wind facilities in Europe range from about 40 m (130 ft) to about 20 km (12 mi) from shore. Large projects with higher electricity production can justify the higher costs associated with siting farther from the shoreline. The distance beyond which transmission lines would be economically infeasible would depend on project size, transmission voltage and voltage type (alternating current [AC] versus direct current [DC]), geological conditions in the area, environmental sensitivity of the location, and length of the transmission line to an onshore interconnection. 3.2 WIND
Wind turbines harness the kinetic energy of the moving air and convert it to electricity. Offshore wind turbines can produce more electricity than can onshore turbines, because offshore winds are less turbulent (the ocean is flat relative to onshore topography, which may have hills, mountains, and other obstructions), and they tend to flow at higher speeds than onshore winds. Because the potential energy produced from the wind is directly proportional to the cube of the wind speed, increased wind speeds of only a few miles per hour can produce a significantly larger amount of electricity. A turbine at a site with an average wind speed of 26 km/h (16 mph), for example, can produce 50% more electricity than can the same turbine at a site with average wind speeds of 23 km/h (14 mph) (Offshore Wind 2006).
A wind turbine can be compared to a fan operating in reverse: rather than using
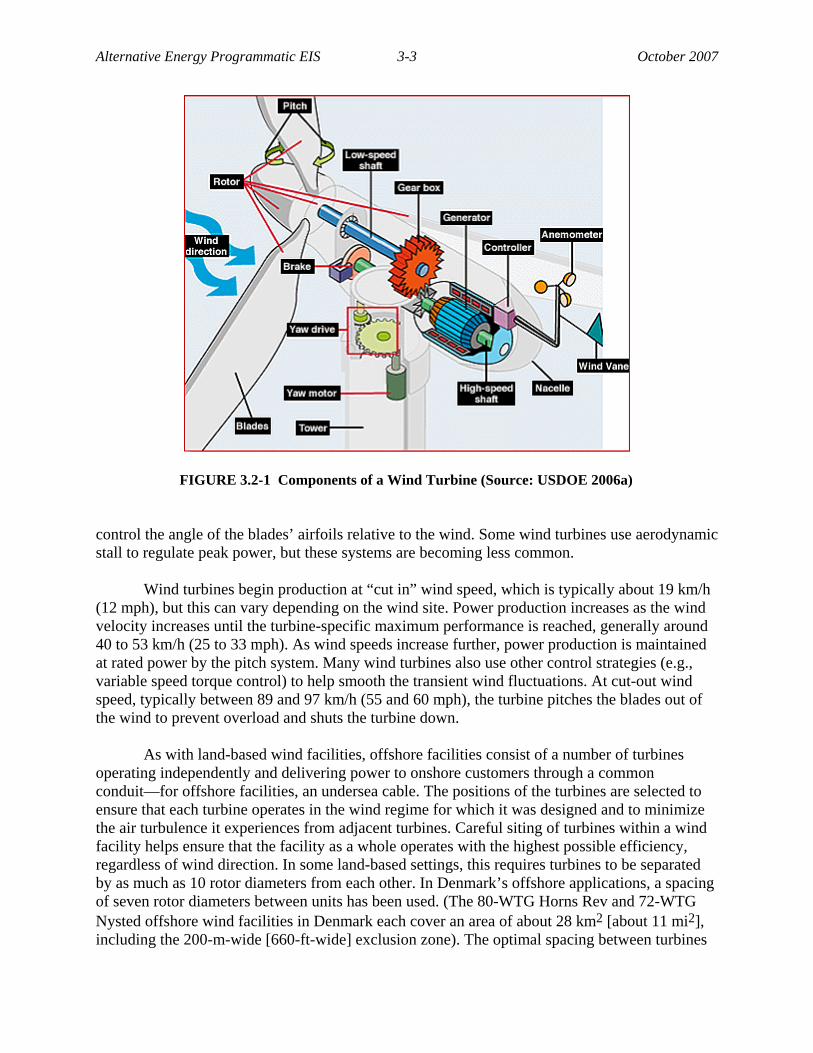
electricity to produce wind, the turbine uses the wind to make electricity (Figure 3.2-1). Today’s wind turbines have evolved into a familiar form that comprises three evenly spaced composite blades mounted to a hub. This assembly, known as the rotor, is oriented upwind from a tower on which most of the mechanical equipment is mounted. In a wind turbine, the rotor captures approximately half of the kinetic energy of incident wind through a process of aerodynamic lift. The rotor spins a shaft that is connected through a set of gears to the center shaft of an electrical generator. A turbine’s power output generally increases as the wind speed increases until it reaches the nameplate power level (rated power). The turbine then begins to regulate power to prevent overproduction. Most wind turbines today have a blade pitch system as the primary means for regulating peak power. This system rotates the blades about their spanwise axes to
Alternative Energy Programmatic EIS 3-3 October 2007
FIGURE 3.2-1 Components of a Wind Turbine (Source: USDOE 2006a) control the angle of the blades’ airfoils relative to the wind. Some wind turbines use aerodynamic stall to regulate peak power, but these systems are becoming less common.
Wind turbines begin production at “cut in” wind speed, which is typically about 19 km/h (12 mph), but this can vary depending on the wind site. Power production increases as the wind velocity increases until the turbine-specific maximum performance is reached, generally around 40 to 53 km/h (25 to 33 mph). As wind speeds increase further, power production is maintained at rated power by the pitch system. Many wind turbines also use other control strategies (e.g., variable speed torque control) to help smooth the transient wind fluctuations. At cut-out wind speed, typically between 89 and 97 km/h (55 and 60 mph), the turbine pitches the blades out of the wind to prevent overload and shuts the turbine down.
As with land-based wind facilities, offshore facilities consist of a number of turbines operating independently and delivering power to onshore customers through a common conduit—for offshore facilities, an undersea cable. The positions of the turbines are selected to ensure that each turbine operates in the wind regime for which it was designed and to minimize the air turbulence it experiences from adjacent turbines. Careful siting of turbines within a wind facility helps ensure that the facility as a whole operates with the highest possible efficiency, regardless of wind direction. In some land-based settings, this requires turbines to be separated by as much as 10 rotor diameters from each other. In Denmark’s offshore applications, a spacing of seven rotor diameters between units has been used. (The 80-WTG Horns Rev and 72-WTG Nysted offshore wind facilities in Denmark each cover an area of about 28 km2 [about 11 mi2], including the 200-m-wide [660-ft-wide] exclusion zone). The optimal spacing between turbines

Alternative Energy Programmatic EIS 3-4 October 2007
is typically determined on a case-by-case basis and is driven largely by the efficiency gains achieved by increasing output by minimizing the wake effects related to the nearby turbines, thereby also reducing unit wear and tear and associated maintenance requirements. The larger turbines and rotors designed for the offshore market will likely have a greater wake effect, resulting in associated increases in the recommended spacing of such offshore turbines. Primary assemblies (and approximate dimensions) of an OCS WTG are shown in Figure 3.2-2 and include the following:
• Rotor (blades and blade hub), which is connected through a drivetrain to the generator;
• Turbine assembly, which includes the gearbox and generator and is enclosed
by a shell or nacelle; • Tower, which supports the turbine assembly, houses the remaining facility
components, and provides sheltered access for personnel; and • Foundation or structure to support the tower.
Offshore WTGs look similar to those onshore, but they may have several design
modifications to accommodate the more demanding climates of offshore locations. These include strengthening the tower to cope with wind-wave interactions, protecting the nacelle components from the corrosive nature of sea air, and adding access platforms for navigation and maintenance. Offshore turbines are typically equipped with corrosion protection, internal climate control, high-grade exterior paint, and built-in service cranes. They also typically have warning devices and fog signals to alert ships in foul weather. To minimize expensive servicing, offshore turbines may have automatic greasing systems to lubricate bearings and blades, and preheating and cooling systems to maintain gear oil temperature within a narrow temperature range. Lightning protection systems minimize the risk of damage from strikes that occur frequently in some locations offshore. There are also navigation and aerial warning lights. Turbines and towers are typically painted light blue or grey to help them blend into the sky. The lower section of the support towers may be painted in bright colors to aid in navigation and to highlight the structures for passing vessels.
To take advantage of the steadier and higher-velocity offshore winds and economies of scale, offshore WTGs are also bigger than onshore turbines—a typical onshore turbine installed today has a tower height of about 60 to 80 m (200 to 260 ft) and blades about 30 to 40 m (100 to 130 ft) long; most offshore wind turbines are larger in size, and new prototype designs are even bigger (Figure 3.2-3). Offshore turbines installed today have power-generating capacities of between 2 and 4 MW, with tower heights greater than 61 m (200 ft) and rotor diameters of 76 to 107 m (250 to 350 ft). A 3.6-MW turbine weighs 290 metric tons (MT) (320 tons) and stands from 126 to 134 m (413−440 ft) tall, approximately the height of a 30-story building. Turbines of up to 5 MW (with rotor diameters of up to 130 m [425 ft]) are being tested. Today, more than 800 MW of offshore wind energy capacity is installed worldwide (all in waters less than 30 m [100 ft] deep).

Alternative Energy Programmatic EIS 3-5 October 2007
FIGURE 3.2-2 Primary Components and Dimensions of a 2-MW Danish Wind Turbine Generator (Source: Adapted from Offshore Wind Collaborative Organizing Group 2005)
Wind turbines are commonly classified by their rated output at a certain rated wind speed, but the amount of time a wind turbine produces a given power output is as important as the rated power. The amount of energy that the wind transfers to the blades increases with increasing wind speed, rotor swept area (which is the capture area, or the area of the circle swept by the rotor as it rotates), and density of the air. Energy output depends on factors that include average wind speed, the speed at which the WTG begins to produce power, blade shape, stalling characteristics, operating characteristics, and component (e.g., generator and gearbox) efficiencies. Capacity factor is the WTG’s actual annual energy output divided by the energy output that would be produced if it operated at its rated power output for the entire year.

Alternative Energy Programmatic EIS 3-6 October 2007
FIGURE 3.2-3 Schematic of Wind Turbine Sizes (Source: Connors and McGowan 2000)
For onshore WTGs, reasonable capacity factors are 0.25 to 0.3, and a good capacity factor would be 0.4 (AWEA 1998). The potential capacity factors for offshore WTGs are greater: in 2004, the capacity factor for the Nysted Wind Facility in Denmark was just under 40%; in the first four months of 2005, the capacity factor was more than 47%. For the Horns Rev Wind Facility in Denmark, the full-year 2004 capacity factor was 26%, but major technical problems caused 30% to 50% of the turbines to be unavailable throughout the year; when the turbines were fully operational at all times, the capacity factor reached just over 53%. Because 2004 was considered to be an average wind-speed year for the Danish climate, long-term capacity factors are estimated to be about 40% for Nysted and about 45% for Horns Rev (IEA 2005).
Figure 3.2-4 is a simplified diagram of an offshore wind facility provided by the British Wind Energy Association (BWEA 2006). The numbers in the diagram are keyed to the following discussion. After a suitable place for the wind facility is located, foundation piles—usually about 3.7 to 5.5 m (12 to 18 ft) in diameter are driven into the seabed (1). Once the turbine is assembled, sensors on the turbine detect the wind direction and turn the nacelle to face into the wind so that the blades can collect the maximum amount of energy throughout each diurnal cycle.1 The wind moving over the aerodynamic blades (2) causes rotation around a horizontal axis, which is connected to a shaft inside the nacelle (3). The rotating shaft powers a generator to convert the energy into electricity. The shaft may be coupled to the generator via a gearbox
1 Diurnal wind cycles result from the differential cooling and heating rates between land and water, thereby
generating wind even if there are no storm fronts in the area.

Alternative Energy Programmatic EIS 3-7 October 2007
FIGURE 3.2-4 Schematic of an Offshore Wind Facility (see text for discussion) (Source: BWEA 2006)
(speed increaser) or coupled directly if the generator is designed to operate at low speeds and high torque levels. Undersea collection cables (4) take the power from the individual turbines to an offshore transformer (or substation) (5), which converts the electricity to a higher voltage before transmission via undersea cable to the land (6). The collection voltages within the facility are in the medium voltage range of 24 to 36 kV. Transmission voltages (from the substation to the shore) are in the 115 to 150kV range.
An electric service platform (ESP) is a central offshore platform that provides a common electrical interconnection for all of the WTGs in the array and serves as a substation where the outputs of multiple collection cables are combined, brought into phase, and stepped up further in voltage for transmission to a land-based substation that is connected to the onshore grid. It also provides a central service facility for the wind facility and may include a helicopter landing pad, control and instrumentation system, crane, man-overboard boat, communication unit, electrical equipment, fire extinguishing equipment, emergency back-up (diesel) generators, staff and service facilities, and temporary living quarters (for emergency periods or inclement weather when crews cannot be removed). These temporary accommodations would likely use waste storage tanks that would be pumped to the service vessel for proper disposal. The ESP would likely provide a central area to store insulating oil used in the WTGs. The ESP for a large wind facility can store 150,000 L (40,000 gal) of insulating oil and 7,600 L (2,000 gal) of additional fluids such as diesel fuel and lubricating oil (Applied Science Associates 2006).
Currently, offshore wind facilities are connected to onshore utility transmission systems
through AC submarine cable systems. For distances of up to a few tens of kilometers and power levels in the few hundred megawatt range, AC cable connections would be adequate. However, for greater distances and loads, DC connections may be more economical, because capacitance and losses limit the technically feasible length of AC cable. The following discussion addressing AC and DC cabling is based on Wright et al. (2002). AC cable system technology is well understood, but for high-voltages (greater than 175kV) or long distances (30 to 250 km [20 to 155 mi] depending on voltage and cable type), their current-carrying capacity is reduced

Alternative Energy Programmatic EIS 3-8 October 2007
due to the generation of reactive current. When the charging current and losses of an AC cable become unacceptable, high-voltage direct current (HVDC) may be considered. For systems that warrant them, HVDC can offer advantages. These include the ability to operate safely at higher current with a given amount of insulation, providing more power per cable. While they need converters at either end, which can lead to electrical losses, DC systems have lower overall losses. Because the AC voltage at the two ends can differ, it is possible that a transformer may not be needed. Because HVDC losses over long distances are nearly negligible, facilities can be sited further offshore, where wind resources may be higher and more consistent, and where visibility from the land may be diminished. A relatively new type of HVDC system, which uses a voltage source converter (VCS) system rather than conventional thyristor-based current source converters, can offer additional advantages. For example, conventional HVDC requires an AC current source for commutation, and the converter itself is large. The VCS system is more compact and does not require an independent AC source, thereby reducing device footprint and avoiding the need for external AC power (which would likely be provided by a diesel generator). Regarding the cables themselves, AC systems use three single-core cables, while DC cables typically use two cables. This bipolar design often includes sea electrodes for temporary backup, which can emit gases.
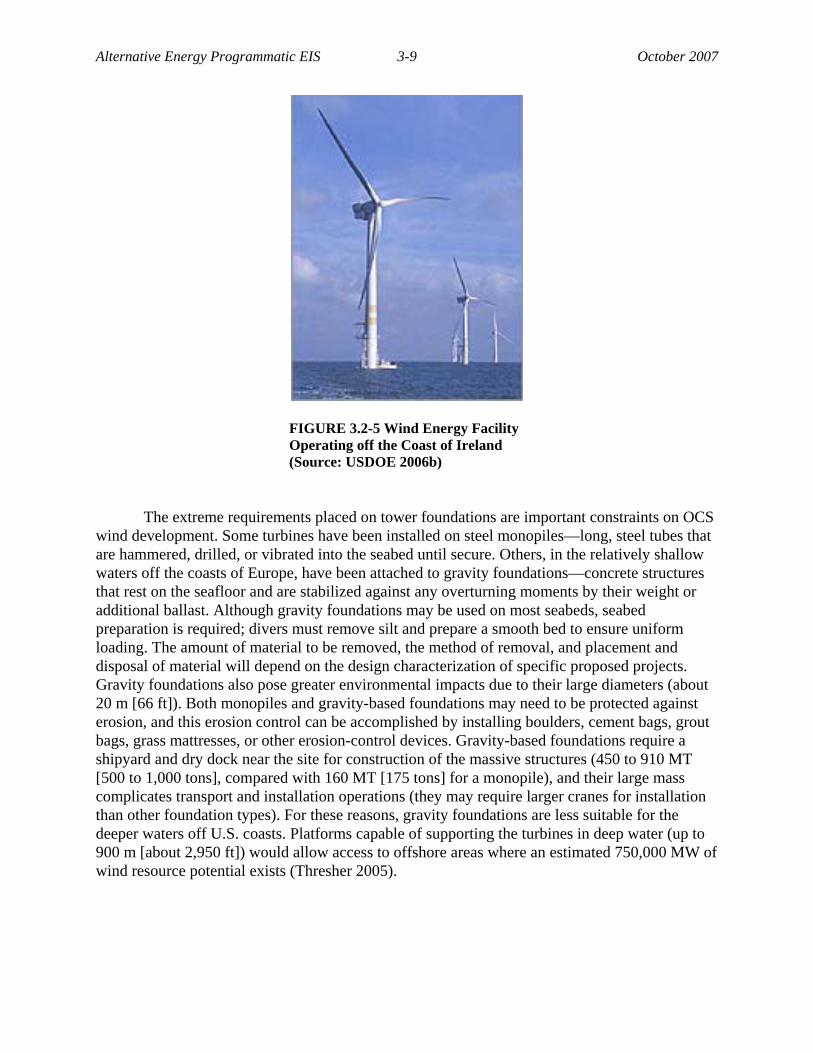
The United States has vast onshore wind resources and space for development (relative to Europe), and a number of projects have been constructed onshore; however, no commercial wind facilities operate today off the coasts of the United States. In the past few years, however, interest in offshore wind energy has increased because of a number of factors: offshore wind turbines can generate power closer to high-value coastal load centers than can onshore turbines; offshore winds produce more power per unit area; and offshore European wind facilities have demonstrated the feasibility of offshore facilities. Figure 3.2-5 shows an offshore wind facility operating off the coast of Ireland.
European pilot and commercial offshore wind projects have provided information to demonstrate the feasibility of offshore wind power generation. This experience, combined with the fact that a large portion of the development costs are for offshore activities that require expensive installation equipment, means that developers in the United States may move directly to commercial operations and not expand resources for demonstration. However, new technologies and equipment, such as new foundation types, will require testing.
Wind speeds tend to increase with distance from the shore, allowing turbines built farther offshore to capture more wind energy. However, as the distance from land and water depth increases, the costs of building and maintaining the turbines and transmitting the power back to shore increase sharply. To capture the wind power and achieve the economies of scale needed to make the far offshore sites financially viable, it is generally believed that 5-MW or larger turbines will be needed. Low-cost mooring and anchor development for erecting and decommissioning in relatively deeper waters (greater than 30 m [100 ft]) and for improving accessibility and reliability would need to be developed. Ways to store wind energy for later use may also be required. Large composite blades would be needed to reduce the weight of the blades and to improve their ability to withstand variations in turbulence. Reducing blade weight also reduces the structural demands placed on the towers.
Alternative Energy Programmatic EIS 3-9 October 2007
FIGURE 3.2-5 Wind Energy Facility Operating off the Coast of Ireland (Source: USDOE 2006b)
The extreme requirements placed on tower foundations are important constraints on OCS wind development. Some turbines have been installed on steel monopiles—long, steel tubes that are hammered, drilled, or vibrated into the seabed until secure. Others, in the relatively shallow waters off the coasts of Europe, have been attached to gravity foundations—concrete structures that rest on the seafloor and are stabilized against any overturning moments by their weight or additional ballast. Although gravity foundations may be used on most seabeds, seabed preparation is required; divers must remove silt and prepare a smooth bed to ensure uniform loading. The amount of material to be removed, the method of removal, and placement and disposal of material will depend on the design characterization of specific proposed projects. Gravity foundations also pose greater environmental impacts due to their large diameters (about 20 m [66 ft]). Both monopiles and gravity-based foundations may need to be protected against erosion, and this erosion control can be accomplished by installing boulders, cement bags, grout bags, grass mattresses, or other erosion-control devices. Gravity-based foundations require a shipyard and dry dock near the site for construction of the massive structures (450 to 910 MT [500 to 1,000 tons], compared with 160 MT [175 tons] for a monopile), and their large mass complicates transport and installation operations (they may require larger cranes for installation than other foundation types). For these reasons, gravity foundations are less suitable for the deeper waters off U.S. coasts. Platforms capable of supporting the turbines in deep water (up to 900 m [about 2,950 ft]) would allow access to offshore areas where an estimated 750,000 MW of wind resource potential exists (Thresher 2005).

Alternative Energy Programmatic EIS 3-10 October 2007
3.3 WAVE A variety of technologies have been proposed to capture wave energy; however, each is in too early a stage of development to enable prediction of which technology or mix of technologies will be most prevalent in future commercialization. Some of the technologies that have been the target of recent developmental efforts and are appropriate for OCS applications are point absorbers, attenuators, overtopping devices, and terminators. These types of WEC technologies vary in size, anchoring method, spacing, interconnection, array patterns, and water depth limitations. Wave energy facilities would also require connection of each WEC to a transformer as part of synchronization with the onshore power grid. Small transformers could be integral to each WEC device or distributed among “hub” or “collector” buoys. At this stage of development, large electrical service platforms similar to those for wind facilities are not envisioned, at least within the next 5 to 7 years. The following paragraphs highlight characteristics of these four WEC technologies. 3.3.1 Point Absorbers
Point absorbers have a small horizontal dimension compared with the vertical dimension
and utilize the rise and fall of the wave height at a single point for WEC. Two types are discussed: the first type is being considered for a demonstration project and the second for a commercial project.
3.3.1.1 Point Absorber Considered for Development A specific point absorber under development uses the wave energy to pressurize a
hydraulic fluid that is then used to drive a turbine generator. The vertical movement of the buoy drives a broad, neutrally buoyant disk acting as a water piston contained in a long tube beneath the buoy. The water piston motion in turn elongates and relaxes a hose containing seawater, and the change in hose volume acts as a pump to pressurize the seawater (Figure 3.3-1). These point absorbers can deliver 80 to 250 kW of power each. The 250-kW version is 6 m (about 20 ft) in diameter and extends 30 m (about 100 ft) into the water. It is made of steel. The capacity factor for this device is not established because the unit is still under development, but it is estimated to range from 12 to 40% (EPRI 2004).
A 1-MW demonstration facility using this point absorber technology has been proposed for placement off the coast of Washington. The proposed facility would include four units, each rated at 250 kW and to be placed 5.9 km (3.7 mi) offshore in water approximately 46 m (150 ft) deep. Power levels are expected to average 46 kW per unit. The demonstration facility is expected to deliver 1,500 MWh annually for 3 years. The mooring system for the device consists of four concrete anchors placed in an approximately square pattern on the ocean floor with the buoy approximately centered on the surface above. The buoy closest to shore functions as the collection buoy or the hub, where the power cables from each of the other buoys are connected to the subsea cable. Grid

Alternative Energy Programmatic EIS 3-11 October 2007
FIGURE 3.3-1 Point Absorber Wave Energy Conversion (WEC) Device (Source: AquaEnergy Group, Ltd. 2006)
synchronization occurs via a variable speed drive and step-up transformer to a suitable voltage level. Generated electricity is brought to shore via a standard submarine electrical cable, which is run along the seafloor and under the beach at the shore. An interconnection station occupying about 5 × 5 m (15 × 15 ft) can deliver the power to the electrical grid.
3.3.1.2 Point Absorber Considered for Commercialization For this point absorber, the rising and falling of the waves offshore cause the buoy to
move freely up and down. The construction involves a floating structure with one component that is relatively immobile and a second component with movement driven by wave motion (a floating buoy inside a fixed cylinder). The relative motion is used to drive electromechanical or hydraulic energy converters. The resultant mechanical stroking is converted via a sophisticated (and patented, proprietary) power take-off to drive an electrical generator. The generated power is transmitted to shore via an underwater power cable. Buoys are spaced to maximize energy capture. Optimum operation is achieved in 50-m (164 ft) water depths, which are typically found 0.8 to 8 km (0.5 to 5.0 mi) from shore. The capacity factor for the buoy is estimated to be approximately 35% (OPT 2006a).
The power system consists of an array of buoys connected electrically in parallel to an
underwater power cable, which transports the energy to the shore. The arrays are arranged in two to five rows, which are nominally parallel to the shore. Sensors on the device continuously monitor the performance of the various subsystems and surrounding ocean environment. Data are transmitted to shore in real time. The buoys are anchored to the sea bottom with “a proprietary anchoring system that avoids any damage or threat to the sea bed or sea life” (OPT 2006b).

Alternative Energy Programmatic EIS 3-12 October 2007
A demonstration unit rated at 40 kW was installed in 2005 for testing offshore near Atlantic City, New Jersey. Testing in the Pacific Ocean is also being conducted, with a unit installed in 2004 and 2005 off the coast of the Marine Corps Base in Oahu, Hawaii. A commercial-scale system is planned for the northern coast of Spain, with an initial wave facility (multiple units) at a 1.25-MW rating. Initial operation is expected in 2007.
A 50-MW commercial facility is proposed for installation off the coast of Oregon, with
an estimated total power output of 153,300 MWh/yr. It is expected that the proposed wave facility would consist of 200 devices deployed in an array of four rows that are parallel to the beach. Each row would consist of roughly 54 250-kW buoys. The power would be generated as asynchronous AC and converted to 60-Hz three-phase synchronous power before being fed into the substation. The proposed facility would use an existing power substation left behind after the closing of an old paper mill and a 3-km (2-mi) underwater effluent pipeline (from the paper mill) that can be used to run underwater power cables from the wave facility to the shore. 3.3.2 Attenuators Attenuators are long, multisegment floating structures oriented parallel to the direction of the wave travel. They ride the waves like a ship, extracting energy by using restraints at the bow of the device and along its length. The differing heights of waves along the length of the device cause flexing where the segments connect, and this flexing is connected to hydraulic pumps or other converters. An example of an attenuator in the advanced development stage has four floating cylindrical pontoons that are 30 to 38 m (100 to 125 ft) long × 3.5 to 4.6 m (12 to 15 ft) in diameter and connected by two separate hinges at each segment junction, for a total of six hinges (Figure 3.3-2). Flexing at the hinged joints caused by wave action drives hydraulic pumps built into the joints. A transformer in the nose of the unit steps up the power-to-line voltage for transmission to shore. Power is fed down an umbilical cable to a junction box in the seabed, connecting it and other machines via a common subsea cable to shore. The capacity factor for such a unit is estimated to be approximately 40% (EPRI 2004).
FIGURE 3.3-2 Attenuator WEC Device (Source: Ocean Power Delivery Ltd. 2006)

Alternative Energy Programmatic EIS 3-13 October 2007
A full-scale, four-segment production prototype rated at 750 kW was sea tested for 1,000 h in 2004. This successful demonstration was followed by the first order of a commercial system from a consortium led by a Portuguese power company. The first stage, scheduled to have been completed in 2006, consists of three machines with a combined rating of 2.25 MW to be sited about 5 km (3 mi) off the coast of northern Portugal. An expansion to more than 20-MW capacity is being considered. A 22.5-MW wave energy facility is also planned for Scotland, with the first phase having been targeted for 2006. An Electric Power Research Institute (EPRI)-cosponsored study (Bedard et al. 2005) has evaluated the feasibility of this attenuator (and other WEC) technologies at sites off the coasts of Hawaii (2 km [1.2 mi] from shore; 15.2 kW/m [4.6 kW/ft] average annual wave energy), Oregon (3.5 km [2.2 mi] from shore; 21.2 kW/m [6.5 kW/ft]), California (13 km [8.1 mi] from shore; 11.2 kW/m [3.4 kW/ft]), Massachusetts (9.1 km [5.7 mi] from shore; 13.8 kW/m [4.2 kW/ft]), and Maine (9.2 km [5.7 mi] from shore; 4.9 kW/m [1.5 kW/ft]). 3.3.3 Overtopping Devices Overtopping devices have reservoirs that are filled by impinging waves to levels above the average surrounding ocean. They are partially submerged structures consisting of walls over which the waves topple, filling the reservoir and creating a head of water, which, when released, turns hydroturbines or other conversion devices at the bottom of the reservoir as the water is released back to the ocean. One design includes wave reflectors that concentrate the waves toward it and thus raise the effective wave height. A unit of this type is quite large (150 × 260 to 300 m [about 490 × 850 to 980 ft]), with a rated capacity of 4 MW. It is designed for deployment in water depths greater than 20 to 30 m (66 to 98 ft) to take advantage of high-energy ocean waves. The capacity factor for this device is estimated to be approximately 33% (EPRI 2004). A 7-MW demonstration project exists off the coast of Wales, and a precommercial prototype project performing long-term and real sea tests on hydraulic behavior, turbine strategy, and power production to the grid is underway in Denmark. The design (Figure 3.3-3) has been scaled
FIGURE 3.3-3 Overtopping WEC Device (Source: Wave Dragon 2005)

Alternative Energy Programmatic EIS 3-14 October 2007
to large sizes, with a span of more than 200 m (660 ft) across the reflector arms and a capacity of approximately 24 MW. 3.3.4 Terminators
Terminator devices extend perpendicular to the direction of wave travel and capture or
reflect the power of the wave. These devices are typically installed onshore or nearshore; however, floating versions have been designed for offshore applications. The oscillating water column (OWC) is a form of terminator in which water enters through a subsurface opening into a chamber with air trapped above it. The wave action causes the captured water column to move up and down like a piston to force the air through an opening connected to a turbine. A full-scale, 500-kW prototype OWC is undergoing testing offshore at Port Kembla in Australia (about 200 m [0.1 mi] from the Port Kembla Harbor breakwater), and a further project is under development about 1.9 km (1.2 mi) off the coast of Rhode Island. These devices have power ratings of 500 kW to 2 MW, depending on the wave climate and the device dimensions. The capacity factor is estimated to be approximately 50% (EPRI 2004). 3.4 OCEAN CURRENTS Ocean current energy is at an early stage of development, with only a small number of prototypes and demonstration units having been tested to date. The proposed designs are based on technology used to extract tidal energy and may or may not be successful in an ocean current environment. Engineering challenges faced by adapting tidal technology to ocean currents involve no slack water, water depths of 300 to 500 m (985 to 1,640 ft), and relatively large distances from shore (20 to 25 km [12 to 16 mi]). One such technology involves submerged turbines. Energy can be extracted from the ocean currents by using submerged turbines that are similar in function to wind turbines and capture energy through the processes of hydrodynamic, rather than aerodynamic, lift or drag. These turbines have rotor blades, a generator for converting the rotational energy into electricity, and a means for transporting the electrical current to shore for incorporation into the electrical grid. Today, two types of turbines—horizontal axis and vertical axis—are generally considered for ocean current energy.
Prototype horizontal axis turbines, similar to wind turbines, have been built and tested, and over the next 5 to 7 years, the horizontal axis turbines are probably the most likely to be installed on the OCS. The horizontal axis marine current turbine functions like the horizontal axis wind turbine, but because water is more than 800 times more dense than air, a 5.6 km/h (3.5 mph) current has the kinetic energy of winds in excess of 161 km/h (100 mph). Because they are relatively constant in location and velocity, ocean currents can lead to a large capacity factor (the fraction of time they are actively generating energy) for the turbines; for nontidal flows, the capacity factor may reach 80%. Vertical axis turbines are either drag or lift designs, with the lift devices offering more potential than the drag designs. The flow of current needed to generate power economically depends on the technology; for existing horizontal axis turbines, a quasi-continuous current velocity of about 5.6 km/h (3.5 mph) is adequate. For tidal flows, more than 9.3 km/h (5.8 mph) would be needed to compensate for slack tide periods.

Alternative Energy Programmatic EIS 3-15 October 2007
Mechanisms such as posts, cables, or anchors are required to keep the turbines stationary relative to the currents with which they interact. Turbines may be suspended from a floating structure or fixed to the seabed. Turbines may be anchored to the ocean floor in a variety of ways. They may be tethered with cables, with the relatively constant current interacting with the turbine used to maintain location and stability. Such a configuration would be analogous to flying an underwater kite where the kite is a turbine designed to keep upright and the kite flyer is the anchor. Additional components may include concentrators (or shrouds) around the blades to increase the flow and power output from the turbine. Various alternative designs have been proposed, including the use of a barge moored in the current stream with a large cable loop to which water-filled parachutes are fastened. The parachutes would be pushed by the current and closed on their way back, forming a loop similar to a large horizontal waterwheel. Figures 3.4-1a and b show two possible turbine and anchor technologies. In large areas with powerful currents, it would be possible to install water turbines in groups or clusters to create a “marine current facility,” similar in design approach to wind turbine facilities. Turbine spacing would be determined on the basis of wake interactions and maintenance needs.
For marine current energy to be used, a number of potential problems need to be addressed, including avoidance of drag from cavitations (air bubble formation that creates turbulence and substantially decreases the efficiency of current-energy harvest), prevention of marine growth buildup, corrosion control, and overall system reliability. Because the logistics of maintenance are likely to be complex and the costs potentially high, system reliability is of particular importance.
No currently operating commercial turbines using offshore ocean currents are connected to an electric-power transmission or distribution grid. However, a number of configurations are being tested on a small scale, and several tidal current turbine applications are near commercialization. For example, a system of tidal turbines with a total capacity of up to 10 MW is being tested in New York’s East River. In March 2006, an electric utility company announced
FIGURES 3.4-1a and b Visualization of Two Possible Turbine and Anchor Technologies (Sources: Hammerfest Strøm AS 2006; Gulfstream Energy Incorporated 2006)

Alternative Energy Programmatic EIS 3-16 October 2007
plans to purchase alternative energy to be generated from ocean currents near Bermuda using a patented technology in which a large submersible (similar to a submarine) operating within a cylindrical unit captures the energy of ocean currents to power generators. It incorporates a gearbox that allows it to provide large-volume electricity production. The generator is 46 m (150 ft) long and contains a four-blade turbine. The generator would operate between 75 and 200 m (250 and 660 ft) below sea level (about 46 m [150 ft] above the seafloor) and provide power to a substation on land that would connect to Bermuda Electric Light Company’s (BELCO) power grid (Jones 2006). The number of generators has not been determined, but the 10 MW to be made available by 2007 would come from one unit (Gadbois 2006). Several demonstration projects off the Florida coast have been proposed. One such proposal describes a technology, developed in the United Kingdom, that uses a twin-rotor machine that generates power while submerged but can be raised from the water for maintenance. According to the proposal, the twin axial flow rotors are about 5 to 10 m (16 to 33 ft) in diameter and made of composite. Using the flow of the current, each rotor drives a generator via a large gearbox, similar to a hydroelectric or wind turbine. The rotors turn at about 10 to 20 revolutions/min (rpm) (ship propellers turn about 10 times faster). The twin power units are mounted on a winglike extension on either side of a tubular steel monopile that is about 3 m (about 10 ft) in diameter and set into a hole drilled into the seabed from a jack-up barge. The pile used for the prototype for this technology (a single-turbine, 300-kW device) is 2.1 m (6.9 ft) in diameter and 42.5 m (139.4 ft) long and weighs 73 MT (80 tons); it carries the weight of all the other components and the operating forces on the rotor. The powertrain (rotor, gearbox, and generator) are mounted on a collar that can slide up and down the pile (Figure 3.4-2).
FIGURE 3.4-2 SeaFlow Experimental Test (Source: Robinson 2006)

Alternative Energy Programmatic EIS 3-17 October 2007
Another proposed technology would deploy several energy production units (EPUs), each of which would consist of the following:
• Two counter-rotating fiberglass rotors, each approximately 21 m (69 ft) in diameter,
• An integrated turbine generating 2 to 3 MW of electricity, • Ballast tanks roughly 46 m (150 ft) in length supporting the EPU at 60 m
(200 ft) underwater,
• A mooring umbilical line to an anchor on the seabed, and
• An interconnection transmission line to shore. Monitoring systems for pressure, temperature, vibration, rpm, and power output would be
located on the units and onshore. The units would be installed in groups or clusters to form a marine current facility, with a predicted density of up to eight turbines/mi2. This grouping is intended to avoid wake-interaction effects between the turbines and to allow for access by maintenance vessels.
Yet another technology uses a buoyant underwater system that is anchored to the seabed and is connected to a utility company onshore. The mooring system has yet to be designed, but the unit would include a buoy that would be connected to the module and hold electronic monitoring devices to track currents and environmental effects. 3.5 DESCRIPTION OF ALTERNATIVE ENERGY ACTIVITIES ON THE OCS
Numerous activities must occur for electricity to be generated from OCS resources and for that electricity to be incorporated into the electric grid. In general, these activities include testing of the technology in a demonstration, characterizing a potential site for suitability, building the facility, and operating it. In addition, at the completion of its useful life, the facility must be decommissioned. The following sections describe each of these activities for alternative energy development on the OCS. 3.5.1 Technology Testing
Before a technology can be deemed feasible for commercial energy production, it must be tested in the OCS environment. As noted, OCS wind technologies have been demonstrated at several locations in Europe, and several offshore commercial-scale wind facilities have been built and are now generating electricity. The same overall scheme has been used, with the variations in foundation design (from concrete gravity-based foundations to steel monopiles), turbine size (increasing from 500 kW to more than 3 MW), and distance from shore. If it were deemed necessary to conduct a demonstration of an OCS wind technology in U.S. waters, it

Alternative Energy Programmatic EIS 3-18 October 2007
would probably be for a new foundation technology. For example, one company has proposed a project to test an innovative technology that would allow future wind facilities to be located 19 to 32 km (12 to 20 mi) offshore. The proposed project, in State waters off the eastern end of Long Island, would consist of three turbines, two on traditional monopile bases and one using a new “lift-boat” technology, that would allow wind turbines to be located in water depths of 46 m (150 ft) (Winergy 2006). (Current monopile technology allows a turbine to be built in about 20 m [65 ft] or less of water.)
Wave and ocean current technologies are less advanced than wind technologies, and proposals to test and demonstrate various forms of these technologies on the OCS can be expected in the next 5 to 7 years. A demonstration-scale test for these technologies would most likely involve the deployment of one or two devices per test—with or without an undersea transmission connection to the shore. (Because undersea transmission would be similar for all three resource technologies, wave and ocean current demonstrations may not include installation of cable transmission lines until the technologies themselves have been demonstrated.)
The devices would be installed in the offshore environment, and depending on the size of the individual unit, they could be towed to their offshore locations or could be shipped by barge or special-purpose vessel. Again depending on the size of the unit, installation may be conducted by using barges (for smaller technologies such as point absorbers for WEC) or may require the use of specialized installation equipment for larger structures such as overtopping devices.
The demonstration units would also need to be fixed in place. Depending on the
particular technology, this could be accomplished by using steel monopiles, multilegged support systems, concrete anchors, or slack mooring systems. In each case, the mooring technology used in the demonstration would likely be the type intended for commercial operations, although the demonstration may provide information that could be used to make design changes to improve the anchoring approach. The mooring technologies may require pile driving or other disturbances to the ocean bottom.
The activities related to the construction, operation, and potential removal of the facilities
used for technology testing would be similar to the activities described in Sections 3.5.2 through 3.5.5 for commercial-scale facilities, except that they would be on a smaller scale.
3.5.2 Site Characterization
Before installation of a technology, site-specific characterizations would need to be conducted to collect data on ocean-bottom characteristics and unidentified hazards (e.g., for mooring and undersea transmission), potential environmental impacts (e.g., to migratory bird routes, benthic habitats, and coastal sediment transport processes), potential archaeological impacts, and possible conflicting uses (e.g., radar interferences, commercial fishing, and U.S. Department of Defense training and operations). Integrated marine geophysical/ hydrographic surveys and geotechnical/sediment sampling programs provide data to assess and characterize existing seafloor and sub-seafloor conditions to select appropriate design, construction, and installation techniques. The objectives of these surveys and programs are

Alternative Energy Programmatic EIS 3-19 October 2007
generally to identify water depths, seafloor morphology and structural features, sub-seafloor stratigraphy, and natural or man-made obstructions on or below the seafloor. Various technologies can be used to collect necessary data. However, because most of these data pertain to depths that are probably no more than 100 m (300 ft) below the surface of the seafloor, the need for technologies with potentially significant environmental impacts, such as high-resolution two-dimensional and three-dimensional site surveys or high-energy seismic exploration surveys that use air guns or air-gun arrays, is not anticipated. The following bulleted paragraphs summarize site characterization techniques; Continental Shelf Associates (2004) contains more detailed information on these and other geological, geophysical, and geotechnical survey approaches. Precise requirements would depend on the site.
• To locate shallow hazards, cultural resources, and hard-bottom areas, and to
evaluate installation feasibility, assist in the selection of appropriate foundation system designs, and determine the variability of subsurface sediments, a variety of techniques can be used. These include the following:
− Deep-tow, side-scan sonar survey. For this technique, used for evaluating
surface sediments, seafloor morphology, and potential surface obstructions, a ship tows a data communications cable toward the end of which is attached a 30- to 45-m (100- to 150-ft) long section of chain. This chain keeps the sensor package—or “fish”—tracking at approximately 25 to 30 m (80 to 100 ft) above the bottom. The sensor package, which is about 3.6 to 4.3 m (12 to 14 ft) long and 1 m (3 ft) in diameter, consists of two sonar devices, one mounted on each side of the fish, and a pinger for sub-bottom profiling. The ship pulls the cable, chain, and fish along a track, then circles and sails along a parallel track 300 m (990 ft) from the first, providing a 100-m (330-ft) overlap in coverage. The chain drags along the seafloor, cutting a trench approximately 10 cm (4 in.) wide by 15 cm (6 in.) deep (Continental Shelf Associates 2004).
− Digital depth sounders. These are microprocessor-controlled, high-
resolution, survey-grade depth sounders that operate at a frequency of 200 kilohertz (kHz), providing precise water depth measurements in both digital and graphic formats (PAL 2006).
− “Boomer” sub-bottom profiling system. This profiler generates a high-
energy, low-frequency transducer (“boomer”) acoustic pulse in the water column in the range of 0.5 to 5 kHz. The system-generated signal propagates toward the seabed where it is partially reflected at the water-sediment interface. The remainder of the signal continues into the bottom and is partially reflected at each successive sub-bottom interface. The system generates a profile view of seismic reflectors below the bottom, which are interpreted to develop a geologic cross section of subsurface sediment conditions under the track line surveyed (PAL 2006).

Alternative Energy Programmatic EIS 3-20 October 2007
− GeoStar full spectrum CHIRP system. This sub-bottom profiler uses wide-band high-frequency modulation pulses to detect and measure the depth to reflecting horizons in the shallow subsurface. It operates in the 2 to 16 kHz frequency range. The system provides better near-surface resolution than the lower-frequency, higher-energy boomer profiling system, but it typically does not penetrate to the deeper sub-bottom reflectors that the boomer system can reach (PAL 2006).
• To obtain physical and chemical data on surface sediments, geological and
geochemical sampling may be used.
− Bottom-sampling devices. These devices penetrate a few centimeters to several meters below the seafloor. To obtain samples of surficial sediments, a piston core or gravity core (“dart”—essentially a weighted tube) is dropped to the ocean floor and recovered with an attached wire line. A grab or dredge can also be used. A grab has a jaw-like mechanism, and a dredge is a wire cage dragged along the seafloor. Shallow coring uses a conventional rotary drill located on a boat or drilling barge to remove several feet of consolidated rock. Bottom sampling and shallow coring can be conducted simultaneously with a small marine-drilling vessel. Neither bottom sampling nor shallow coring uses high-energy sound sources (Continental Shelf Associates 2004).
− Vibracore samples can be used to assess bulk physical and chemical
parameters and to characterize sediments at and above proposed cable burial depths. A Vibracore sampler usually consists of a core-barrel and a vibratory driving mechanism mounted on a four-legged tower guide and platform. The entire assembly is lowered to the sediment surface below the water by a crane/cable hoist system. After the device has been positioned, compressed air is supplied to the vibratory unit through flexible hoses from the floating plant. Upon application of the compressed air, the oscillating hammer (vibrator) propels the core-barrel into the sub-bottom materials. Once the core-barrel has been extended to its full length, the sampler is retracted from the sediment and returned to the floating plant deck. Typically, 8-cm- (3-in.-) diameter cores of up to 6.1 m (20 ft) in length are obtained; some devices may be modified to take samples of 9.1- or 12-m (30- or 40-ft) lengths. The device is generally used to sample sands and fine-grained materials (USACE 1987).
− Deep borings (about 30 m, or 99 ft) below the seafloor may also be
conducted to characterize geologic conditions to the maximum expected depths of foundations.
• For field investigations to assess benthic community composition and to
identify submerged aquatic vegetation within a project area, benthic and vegetation resource surveys are used.

Alternative Energy Programmatic EIS 3-21 October 2007
− Benthic samples can be obtained via surface grab methods at various locations. Shellfish can be surveyed using clam rakes, 0.25-inch mesh box sieves, and manually operated bottom dredges. Benthic samples can be taken with a portable gravity dredge (or grab) sampler deployed over the side of a survey vessel. One example is the van Veen grab sampler, a lightweight sampler designed for taking large samples in soft bottoms. This sampler, which ranges in size from 36 by 28 cm (14 in. by 11 in.) to 70 by 36 cm (27 in. by 14 in.) and has a penetration depth of 25 cm (10 in.), is lowered through the water column with the jaws open and locked. When the jaws are released, a tug on the lines sets the jaws around the sample, which is then returned to the deck for field logging and sampling.
− Vegetative communities can also be sampled using a van Veen Grab. Such
sampling is often preceded by other survey (e.g., side-scan sonar) and study (e.g., diver television system) techniques that identify the potential existence of such communities. Diver television systems are lowered from an observation platform (or vessel) to the seabed using an electronic winch. The platform and camera system are then allowed to drift with the prevailing currents. Video feed is monitored on the platform in real time. After the camera system is retrieved, the van Veen Grab is used to sample the vegetative communities and verify the observations made with the camera system (ESS Group 2006).
• To locate buried pipelines, items of archaeological interest, waste dumps, and
other metallic debris, marine magnetic surveys can be used. A magnetometer measures the earth’s magnetic field and/or its vertical gradient field to determine structure and sedimentary properties of subsurface horizons. It does not entail emitting high-energy sound sources or conducting seafloor activities. However, it is often conducted in conjunction with a seismic survey. Sensors are typically one of three types⎯an Overhauser effect sensor, a proton precession sensor, or a cesium vapor sensor. The sensor is housed in a cylinder about 1 m (3 ft) long and 15 to 20 cm (38 to 51 in.) in diameter, and weighs about 14 kg (31 lb). The electronics package inside the case contains about 1 L (0.3 gal) of nontoxic, chemically inert fluid. The sensor is towed at a depth of 3 m (10 ft); depth devices mounted on the cable maintain a constant depth (Continental Shelf Associates 2004). According to PAL (2006), the cesium vapor sensor is designed to detect ferrous metal objects buried beneath or lying on the seabed. It acquires information about the ambient magnetic field strength by measuring the variation in cesium electron energy level states. As the sensor passes near objects containing ferrous metal, a fluctuation/disturbance in the earth’s magnetic field is detected. This fluctuation is measured in gammas and is proportional to the amount of ferrous components in the sensed object. Each individual run of the magnetometer in a survey covers roughly 15.2 to 22.9 m (50 to 75 ft) in width.

Alternative Energy Programmatic EIS 3-22 October 2007
Because an anomaly peripherally detected by a single magnetometer run would not provide an accurate indication of the anomaly’s size or location, additional magnetometer information would be collected on the anomalies as necessary.
• Information on the sea bottom for anchoring and cable installation can be collected by using multibeam echosounder and acoustic backscatter devices to develop a three-dimensional image of the seafloor. Grab sampling and/or gravity coring in the vicinity of the anchors and transmission lines would likely be used for identifying the seafloor composition. Benthic surveys may include side-scan sonar, side-mounted video camera, seafloor-mounted acoustic Doppler current profilers (ADCPs), and remotely operated vehicles. European experience with poor anchoring of marine current devices suggests that a thorough site investigation must be conducted before the foundation is designed (EU 2005). Surveys, including borings to depths beyond the pile-driving depth, particularly around any platforms on which transformers may be located, would be required prior to construction.
• The above technologies generally require tethering of the survey instrument to
a vessel. Autonomous underwater vehicles (AUVs) are robots that can operate in water as deep as 6,000 m (19,700 ft). Powered by batteries or fuel cells, AUVs can be used to study the ocean and ocean floor. They carry sensors such as magnetometers, compasses, depth sensors, and side-scan and other sonars to navigate autonomously and map features of the ocean. The oil and gas industry has used AUVs to characterize potential drilling sites, using them as a substitute for conventional ship-borne hydrographic survey tasks and conventional tethered remotely operated vehicle tasks. AUVs may also be appropriate for site characterization of alternative energy facilities on the OCS, particularly marine current facility.
Data would also need to be collected on resource characteristics and potential. For OCS
wind development, a key component used for characterizing wind conditions is the meteorological tower. To determine whether a site is appropriate for a wind turbine facility, a meteorological tower is installed in the area of the proposed facility to measure wind speeds and to collect other relevant data. Scientific measurement devices consist of anemometers, vanes, barometers, and temperature transmitters on the tower. The tower should be tall enough to measure wind speeds at the hub height elevation of the proposed turbines, and it must be in the general area of proposed development to collect data about wave and current action. The tower needs to be anchored to the sea bottom; over the next 5 to 7 years, anchoring would most likely be accomplished using a monopile driven into the sea bottom or three pilings supporting a single steel pile that supports the deck. To obtain OCS wave data, existing offshore wave and weather buoys may be used, while nearshore applications may use in-situ wave measuring devices. To obtain ocean current data, ADCPs (mounted on vessels or the seafloor) would likely be used.

Alternative Energy Programmatic EIS 3-23 October 2007
3.5.3 Facility Construction
In general, the following activities would be conducted in the construction of an OCS energy conversion facility on the OCS. Manufacturing of individual devices and/or components onshore. Components to be fabricated onshore include foundations or other anchoring devices (most likely made of steel, but concrete could also be used), turbines, rotors (most likely of composite materials), transformers, and transmission cables. Additional components for specific energy conversion technologies would include towers for WTGs (steel, manufactured in sections to be assembled offshore); buoys, anchoring devices, and other components for WECs; and possibly submersibles and underwater generators for ocean current technologies. Transport of components to the port location from which they would be shipped to the OCS location. Transport would occur by truck and by marine vessel (for large components). Some of the WEC devices (e.g., point absorbers) would be built on the nearby shore, as components for these devices are typically available from U.S. suppliers. These devices can be built locally using standard construction techniques available in most shipyards. Some ocean current devices, on the other hand, are today made only in Europe, and these devices would need to be shipped overseas, or the technology would need to be licensed to North American companies for commercial production and transport to the port.
Port preparation. Existing ports may require expansion to accommodate the equipment (e.g., large cranes for offloading and reloading components). Construction work including dredging and dock expansion may be needed.
Assembly and loading of components onto transport vessels and transport to the OCS. For large components (turbines, rotors, some WECs, and ocean current devices), large cranes would be used for loading. Some of the cable-laying, purpose-built, and large transport and installation ships would need to be moved to the port location. (In the early years, such vessels may come from overseas.) Some devices (e.g., point absorbers) can be towed to their offshore locations.
Installation of components offshore. Technicians to install the OCS systems would be transported by vessel to the OCS facility site; in some cases, helicopters may be used. Specific components to be installed would vary depending on the technology:
• Anchoring devices. For the next 5 to 7 years, wind turbines can be expected to
be mounted on towers supported by steel monopile foundations. Other OCS energy technologies (such as ocean current technologies that use rotors to generate electricity) may also use monopiles. Monopiles would likely be driven into the ocean floor by using vibratory hammers or other pile-driving equipment from a barge. Other technologies (point absorbers, attenuators, overtopping WEC devices) may use slack mooring configurations, and terminators may use asymmetric mooring arrangements, with the device

Alternative Energy Programmatic EIS 3-24 October 2007
supported on legs that connect the structure with the seabed. Scour protection (e.g., rubble mounds, seagrass mattresses) may also be required.
• Energy conversion devices. To minimize operations in harsh offshore
environments, as much assembly of the turbines and other conversion devices as possible would occur onshore. For some technologies, the entire device may be built onshore and transported as a unit to the site; others would require additional assembly offshore. This would likely be done from a barge or special-purpose vessel with the capacity to handle large equipment. The remaining offshore assembly of individual devices could require less than a day (for some WTGs) to a week or more (for some WECs).
• Transformers/service platforms. These would be assembled in a manner
similar to the energy conversion devices, that is, as much assembly as possible would occur onshore, and offshore assembly and installation would be conducted from barges or other special purpose vessels.
• Subsea cables. Subsea cable installation would include both medium-voltage
cables within the OCS facility to collect the electricity generated from the individual devices and transmit it to the transformer, and high-voltage cables for transmission from the transformer(s) to the shore. Special cable-laying vessels designed specifically for both transport and installation would likely be used if the cables were buried, and generally these cables would be buried using a jet-plow technique in the seafloor about 1 to 3 m (3 to 10 ft). This technique simultaneously lays and embeds submarine cable in one continuous trench. It is possible that in deep waters, where the cables would not interfere with other marine uses, the cables would not be buried. Additional precautions would be needed if it were deemed necessary to transmit the energy over rocky or seismically active areas.
Today, commercial offshore wind facilities use high-voltage AC (HVAC) to transmit electricity from the ESP or transformer(s) to the shore. Various cable types can be used, but a common one used in Europe is the cross-linked polyethylene (XLPE) insulated cable. This cable uses extruded insulation, has excellent thermal characteristics and low dielectric losses, and requires no oil supply system (Lazaridis 2005). Components of submarine cables that may result in environmental impacts include the type of insulation, number of conductors (e.g., single versus “three-core” cables), screening, sheathing (which, because it is often metallic, helps ground the cable and creates a moisture barrier), and armor. Armor is the overall jacket, to which corrosion protection is applied. Corrosion protection may include a biocide. See Lazaridis (2005) and Wright et al. (2002) for more detailed and technical information on offshore transmission line options and technologies.
Onshore construction. Onshore transmission-related needs would vary from project to project, but for the next 5 to 7 years, it is expected that the only onshore construction would be

Alternative Energy Programmatic EIS 3-25 October 2007
for staging areas and for the hooking up of the transmission line to an existing onshore substation. Cables to transmit the electricity from the OCS facility to the shoreline would be required, and high-voltage cables to transmit the electricity from the subsea cable would likely be buried, which may be accomplished by horizontal directional drilling (HDD). HDD is a trenchless drilling technique that is typically less disruptive than digging the length of the trench from the surface. HDD uses a remotely guided drill head driven by a rotary drill rig. Depending on the length of the cable and the burial depth, one or two drill rigs may be used. Typically, when two are used, one is located at the entry point of the cable and one at the exit point, with the cable joined between the entry and exit points via one or more splices. A bentonite clay drilling-mud system provides for lubrication and cutting return and maintains the integrity of the hole. (Bentonite clay comes from the weathering of volcanic ash, swells to several times its original volume when placed in water, and forms thixotropic [gel-like at rest, but fluid when agitated] gels when small amounts are added to water.) Staging areas for equipment and a pit to hold the bentonite and drill cuttings until they can be replaced or recycled are required. When HDD is used under shorelines or water, a temporary coffer dam may be constructed to contain any turbidity associated with the drilling operations. During HDD, it is possible that drilling mud can escape into the environment as a result of a spill, tunnel collapse, or “frac-out.” Frac-out can occur when drilling muds are released through fissures or cracks in the earth. Existing substations would likely be used. Most of the energy conversion devices would be monitored from shore, and existing operations (often in another state) are expected to be used for such monitoring.
Wind resources are variable, and these variations must be integrated into the onshore electric power generation, transmission, and distribution systems with which they interface. Improved forecasting models can improve the ability of the utility to respond to changing power outputs. Utility studies indicate that wind can readily be absorbed in an integrated network until the wind capacity accounts for at least 20% of maximum demand. Beyond this, some changes to operational practice may be needed. A large geographical spread of wind power would reduce variability, increase predictability, and decrease the number of instances with near-zero or peak output. 3.5.4 Facility Operation
Routine operations of OCS energy conversion facilities generally would not require offshore personnel. The control and monitoring of devices and transformers would be carried out remotely using fiber-optic cables or other communication devices. However, periodic maintenance and inspection would be required. Wind turbines, for example, would be inspected and serviced about twice a year (to receive a change of oil, replenish lubrication, check fasteners, change filters, inspect major components, etc.); corrections of malfunctions would also be required. Together, such services may average about 1 wk/yr per turbine. (It should be noted that the wind facility would continue production during scheduled maintenance activities; only the unit undergoing maintenance would be shut down.) Technicians would be transported by relatively small boats to the turbine (or transformer) sites where they would either work directly on the turbine or transport components to the shore for repair and then return them. In poor weather conditions, the technicians may be transported via helicopter to the OCS location.

Alternative Energy Programmatic EIS 3-26 October 2007
For wave technologies, operational activities can include conditions monitoring, reliability management, structural monitoring, and repair. Offshore systems may need to be returned periodically to shore for maintenance or replacement. Remote monitoring and supervisory controls are expected. To repair any of the submerged components (e.g., hose pumps, piston assembly, and check valves), a buoy would need to be floated into a horizontal position. This would require a crane to bring it into a horizontal position or the pumping of air into subsea compartments. The buoy can also be towed into a nearby port for major overhaul activities. The terminator WEC can be accessed by boat for regular maintenance. The operation and maintenance strategy for this type of device would be to conduct as many tasks as possible on the device itself and to remove the device only in case of critical structural failures. For attenuators, device maintenance would likely be conducted at a pier onshore. The device can be disconnected from its mooring and towed to a nearby port for maintenance overhauls; subsystems, such as power modules, can be lifted out with a crane and replaced. 3.5.5 Facility Decommissioning
Once an OCS alternative energy facility reached the end of its useful life, it would be decommissioned. Decommissioning entails dismantling and removal of the energy conversion devices, the electric service platforms (or transformers) and their foundations, scour protection devices, and transmission cables, and the subsequent transport of these materials to shore for reuse, recycling, or disposal. The devices and equipment would be dismantled in the same manner as they were assembled, only in reverse. Monopile foundations would likely be cut off at the mud line followed by the removal of the sediment within it to a suitable depth below the level of the seafloor. Once the sediments are removed, the remaining monopile would be cut off at a depth of approximately 5 m (15 ft) below the mudline. The pile could be cut with the use of explosives but most likely would be accomplished by using one or a combination of: acetylene cutting torches, mechanical cutting, or high-pressure water jet. Special vessels and equipment that are large enough to conduct the disassembly and haul the components or debris to shore would be required. In some cases, helicopters may be used. Once the materials were transferred to the shore, onshore transport would be conducted by truck.
It is possible that all or some of the facilities could remain in place and be used for other purposes (e.g., artificial fishing reefs); however, because these activities are considered to be too far into the future and too speculative at this time, they are not analyzed in this programmatic EIS.