3 nations brief
TRANSCRIPT

3 Nations (USA, China & India)
Last three decades has seen some interesting dynamics and realignments in economic influence of nations in the world.
In particular, 3 Nations have a significant impact on wealth of nations and will continue to do so for foreseeable future.
Here is their story as a visual essay using Infactum software.
By 2050 PwC projects that GDP ranking will be: #1 China, #2 USA, #3 India.
CHINA
Year 1980
USA GDP 2015 = $22T as baseline
USA
= $22T
Year 2015

Economic performance comparison chart 1990-2015: USA, China and India
Contrasting to GDP story, clearly China has grown in world PPP share while US is giving it up. India is growing steadily.
Summary of dynamic that has shaped up in the last three decades for 3 Nations:
1980 – 1990 - USA from Carter era to Reaganomics. - Chinese economic liberalization starts under Deng.
Rapid growth as a manufacturing hub - India still a socialist economy
1990- 2000 - USA’s 2000 Dotcom bust - ‘Made in China’ is ubiquitous - Indian economic liberalization starts & IT grows.
2000-2010 - USA: Two costly wars and home mortgage crises - China starts investing $1.1T worldwide to fuel
growth - India economic growth sputters but domestic
consumption & FDI grow
2010- onward - US finds its mojo, rebounds in economic growth - China faces internal structural faults & growth
slows - India turns right again under Modi
USA China India
18.11 18.48 6.78
100% 100% 37%
GDP 2015:
USA China India
22T 14T 3T
100% 64% 14%
World PPP Share % 2015

What drives the US GDP?
2008-2009 Home Credit Crisis-
Mortgage delinquencies rise
2008-2009 Spending
contracts, Unemployment
rates rise
2008-2009 Domestic
Consumption dips, triggers
recession
Trade Balance: Goods & Services: -4%
Government Consumption: 15%
Capital Formation: 17%
Household Consumption: 72%
US GDP components
Anatomy of an economic crisis
In 2013, domestic consumption equals
$11.5T, greater than total GDP of
China is key to US GDP
Mortgage crisis of 2008-09 exposes US
GDP’s deep dependency on domestic
consumption.

China has given the world cheap labor and cheap goods, as well as cheap capital via export of excess savings.
Those days are coming to an end according to a Forbes report.
What drives China’s GDP?
Domestic consumption will
become largest component of GDP
2008-2009 global recession
Large government backed capital
investment in economy drives GDP
growth but accumulates debt
Debt rose from $7 trillion in 2007
to $28 trillion by mid-2014 to equal
2.8 times GDP
-
2000 to 2013, Chinese wages rose >500%. In 2013, China’s
average monthly wages at $723 compared to India ~$110. To
remain competitive increased productivity & greater efficiency
are required especially in services sector

High risk investment countries include Syria, Yemen, Iraq, Afghanistan, Venezuela, Nigeria and more. These
countries were leveraged previously by developed nations through institutions such as World Bank and IMF
for betterment reforms of populations. That leverage is now with China.
China investments: 2005-2015
China’s investments between 2005
to 2015 reached $1.1T
China’s made investments across
all Geos but focus has been on
resource rich high risk regions
Sub-Sahara West Asia East Africa Arabia South America

China’s massive investment ties a vast populations of the world particularly in Asia, Africa and Latin America,
to its economic growth. Ongoing debt restructuring will hurt these regions more than it hurts China as
growth slows down.
Where are the Chinese investments going (2005-2015)?
45% of investments focus
on energy (Oil, Coal etc.)
In most African countries, Chinese investments dominate economy. As an example, investment in Nigeria is 53% of its FDI. China owns 4 oil blocks and a refinery in Nigeria.
In South America, Chinese investment in Brazil equals $50B in energy, mining & transport
Venezuela received $50B in exchange for oil

Rise in employment drives domestic
consumption
Growth in Industry &
Services
Liberalization encourages FDI
flows
What drives India GDP growth?
Population (Millions)
------------Population by Income------------
Poor Low Middle Upper Middle
High
2001 1059.5 375.1 665.9 15.0 3.3 0.2
2011 1221.2 242.0 938.5 32.2 7.3 1.1
India is looking to move to next phase of growth based on infrastructure improvements and renewed focus on
boosting domestic manufacturing with ‘Make in India’ campaign amidst major challenges on bringing in reforms that
are needed for growth.
Growth in India GDP is driven by increased FDI, expertise in IT and increased domestic consumption of a growing middle class.
India records the second fastest growth of middle class globally after China.
Indian middle class has 22.6% of the nation’s wealth share
India continues as favorite destination of investment averaging $40B a year between 2007-2014
Dominant FDI in last 15 years is in the service sector as India became the back office of the world
Recent FDI is shifting to badly needed infrastructure development mainly in power and transportation.
Trade Balance: Goods & Services: -7%
Government Consumption: 12%
Capital Formation: 37%
Household Consumption: 57%
India GDP components
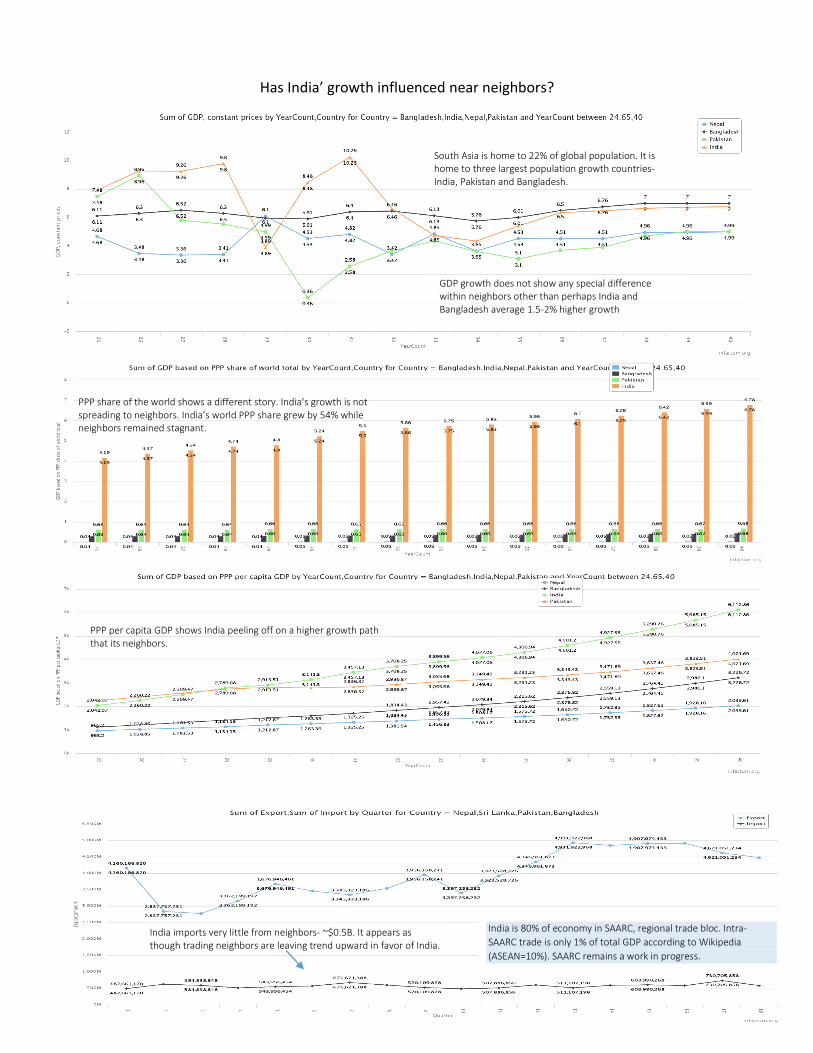
Has India’ growth influenced near neighbors?
India is 80% of economy in SAARC, regional trade bloc. Intra-
SAARC trade is only 1% of total GDP according to Wikipedia
(ASEAN=10%). SAARC remains a work in progress.
GDP growth does not show any special difference within neighbors other than perhaps India and Bangladesh average 1.5-2% higher growth
PPP share of the world shows a different story. India’s growth is not spreading to neighbors. India’s world PPP share grew by 54% while neighbors remained stagnant.
PPP per capita GDP shows India peeling off on a higher growth path that its neighbors.
India imports very little from neighbors- ~$0.5B. It appears as though trading neighbors are leaving trend upward in favor of India.
South Asia is home to 22% of global population. It is home to three largest population growth countries- India, Pakistan and Bangladesh.

Forward to 2050
Despite ongoing challenges, the economy will continue to grow at a steady rate and be one of the major drivers of global growth. Higher productivity is key to steady growth.
•Focus on education to add skilled workers
•Immigration of highly skilled workers to keep innovation leadership
China will look to higher productivity from its workforce and increased domestic consumption
•Weening away from foreign technology adoption by Investments in R&D (already ↑ 2.5% GDP),
•Institutional reforms with greater transparency for continued FDI
•Ease government control on insititutions
India has a great opportunity to become the third largest economy on strength of its younger skilled workforce
•Continued economic liberalization, improving labor laws for large scale manufacturing
•Improve infrastructure
•Bringing quality to education and investing in R&D
2015
2020
2030
2040
2050
GDP Growth
GDP Growth %
Stable Growth Towards stable
growth Towards moderate
growth
2015
2020
2030
2040
2050
Growth
> 10 times 2 Times >3 Times