3. handset antennas and influences due to the human body
TRANSCRIPT
3. Handset Antennas and Influences due to the Human Body
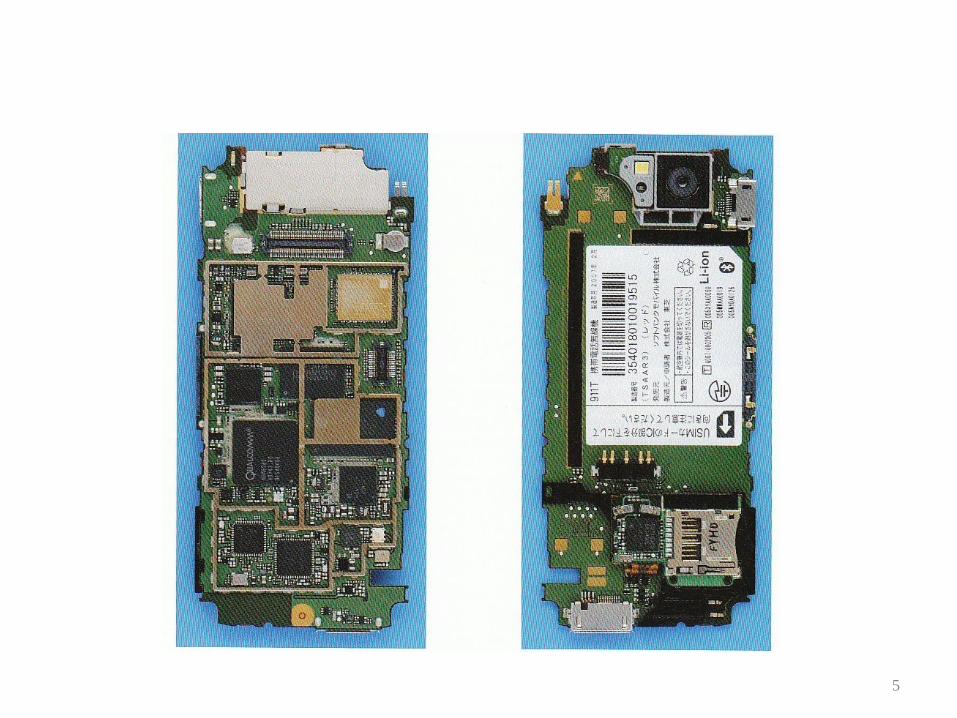
• In real operating conditions, the characteristics of a handset antenna can be influenced by many components used in the handset.
• Also, due to that fact that recent handsets are becoming more compact, it has now become necessary to take into account the influence of the handset chassis.
• Built-in antennas are one of the most common types of antenna used in handset terminals. However, such antennas are strongly influenced by the handset terminal chassis and also by the user‘s hand and head when operating the terminal.
• These influences must be taken into account during the design stage of the handset antenna.
• This chapter is therefore devoted to the discussion of the techniques used to evaluate such influences. It is possible to use a special type of mannequin, called a phantom, to evaluate the influence of the human body on the antenna characteristics.
• Measurement methods are described using a phantom and measured data are compared with those using human operators.
1
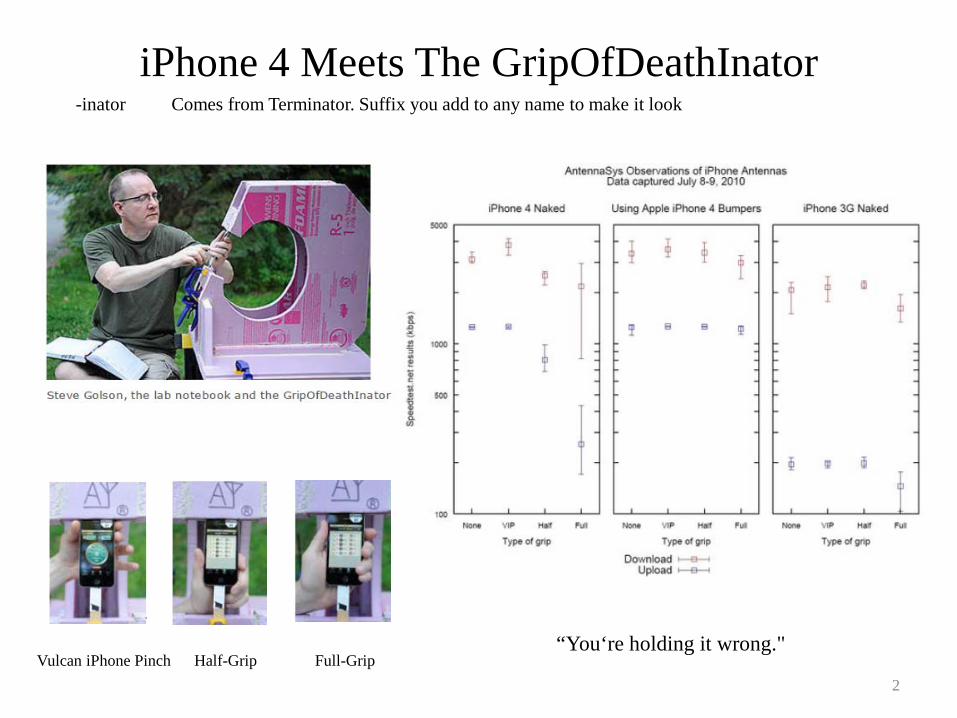
iPhone 4 Meets The GripOfDeathInator
Vulcan iPhone Pinch Half-Grip Full-Grip“You‘re holding it wrong."
-inator Comes from Terminator. Suffix you add to any name to make it look
2

3

Bluetooth antenna DTV whip antenna AGPS monopole antenna
Fellica small loop antennaCellular folded antenna
Flooded antenna
Monopole antenna
4
5
3.1 The effects of chassis on the handset antenna
• The purpose of these antenna measurements is to extract data that help counteract the effects of the chassis and the human body on the antenna operating characteristics during the design stage.
• Even if the antenna characteristics are proven to be fully satisfactory when the antenna is attached to the terminal chassis, if an actual operator uses the handset the antenna characteristics can still be greatly altered by an actual operator.
• It is therefore vital for the final antenna design that the influences of the human body on the antenna characteristics are fully investigated.
• A dielectric material, which is electrically equivalent to human body tissue, is used to design a mannequin called a phantom for these evaluation tests.
• Alternatively, an actual person can be used for the measurements. This chapter first explains the effect of the chassis on the antenna performance. Details of different types of phantom are described in the following sections.
6

3.1.1 Relationship between antenna type and the chassis size
• A monopole antenna is a typical example of handset antenna to discuss the chassis size, because various shaped built-in monopole antennas are used in mobile handset.
• For simplicity, this section discusses the input impedance and radiation pattern of the monopole antenna.
• If a quarter wavelength monopole antenna is placed on an infinite ground plane, the total antenna length can be regarded as half wavelength due to the image current induced on the ground plane.
• However, since an infinite ground plane does not exist in reality, the antenna must be installed on a finite ground plane.
• As explained in Section 2.1.4, the input impedance and radiation pattern of the antenna are influenced by the size of the ground plane. Since the handset chassis acts as the ground plane for most monopole antennas on mobile terminals, the antenna characteristics can be strongly affected by the casing size.
7
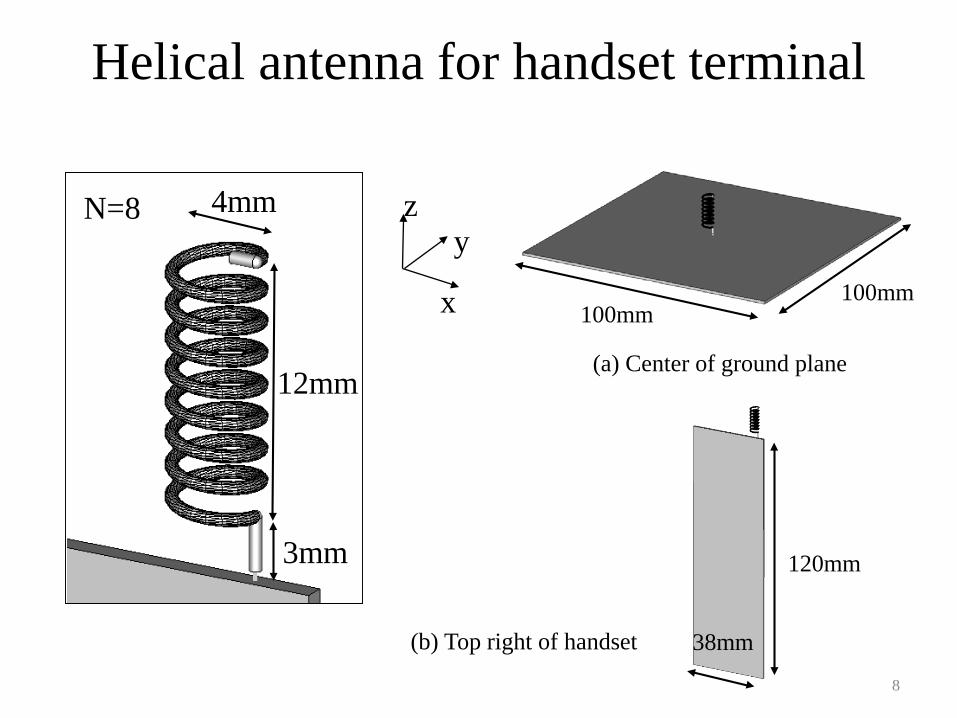
4mm
12mm
3mm 120mm
38mm
100mm100mm
N=8
x
zy
Helical antenna for handset terminal
(a) Center of ground plane
(b) Top right of handset
8
Frequency [GHz]
Retu
rn L
oss [
dB]
0.4 0.6 0.8 1 1.2 1.4
-20
-15
-10
-5
0
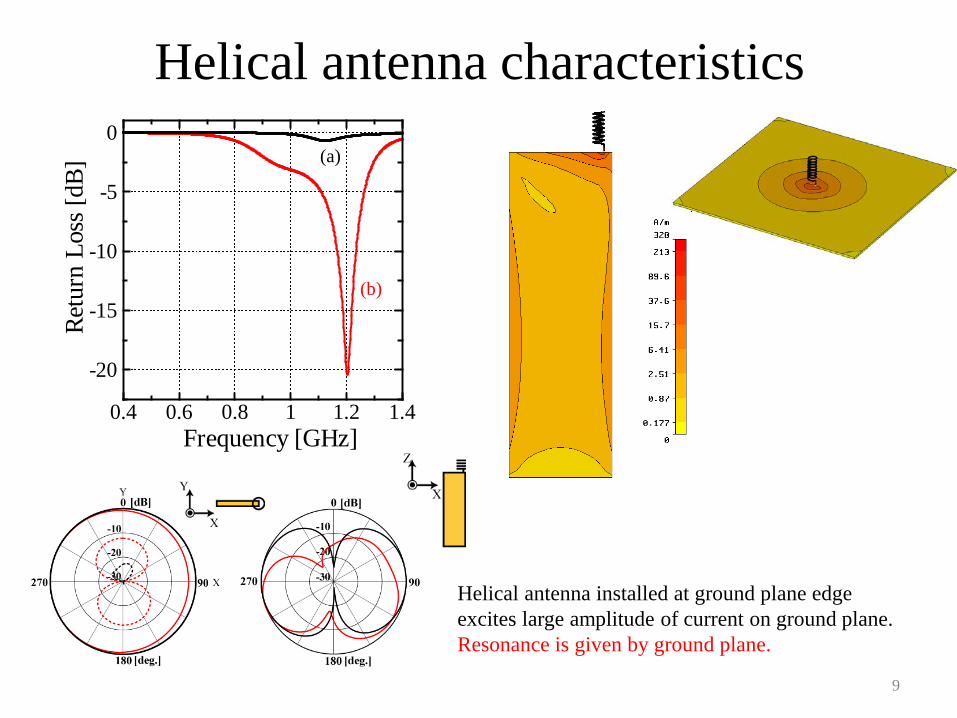
Helical antenna characteristics(a)
(b)
Helical antenna installed at ground plane edgeexcites large amplitude of current on ground plane.Resonance is given by ground plane.
9

Fig. 3.1 Analysis model of an antenna attached to a chassis
• As shown in Fig. 3.1, the chassis may be approximated by a metal board of height L and width W.
• The monopole antenna may be approximated by a wire model of length h as shown in Fig. 3.1.
• The method of moments may be used to calculate the radiation pattern from this model in the z-x plane. Current flowing on the outside of the chassis causes undesirable pattern lobes from the handset.
h
L
W
z
yx
10
• If the chassis height L is larger than the length of the monopole antenna h then a large side lobe will appear in the z-x plane cut of the radiation pattern, as shown in Fig. 3.2 (a).
• Handset terminals for digital TV reception often use monopole antennas of approximately half wavelength in length in order to increase the antenna gain.
• The actual length of the monopole antenna is 3/8λ or 5/8λ so as to take into account the impedance matching considerations at the antenna feed point.
• For sleeve antennas, unlike monopole antennas, a ground plane is not required to achieve resonance. However, side lobes would appear on the radiation pattern when the length of the chassis becomes greater than the antenna length, as shown in Fig. 3.2 (b). This is also due to the current flow on the chassis surface.
11
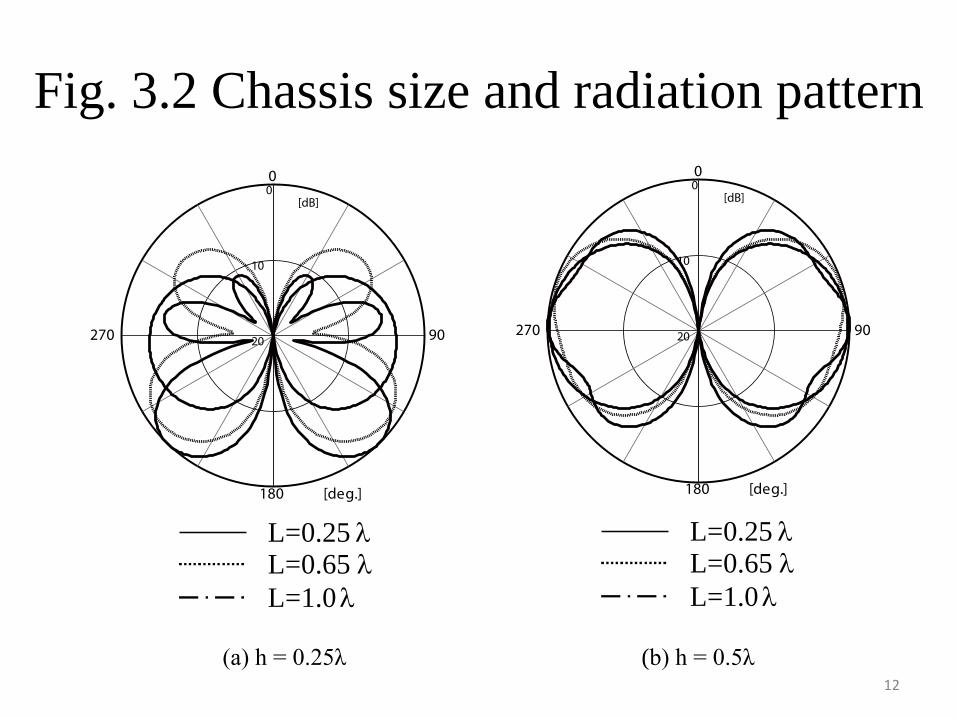
Fig. 3.2 Chassis size and radiation pattern0
10
20
[dB]
0
90
180
270
[deg.]
L=0.25 λL=0.65 λL=1.0 λ
0
10
20
[dB]
0
90
180
270
[deg.]
L=0.25 λL=0.65 λL=1.0 λ
(a) h = 0.25λ (b) h = 0.5λ12
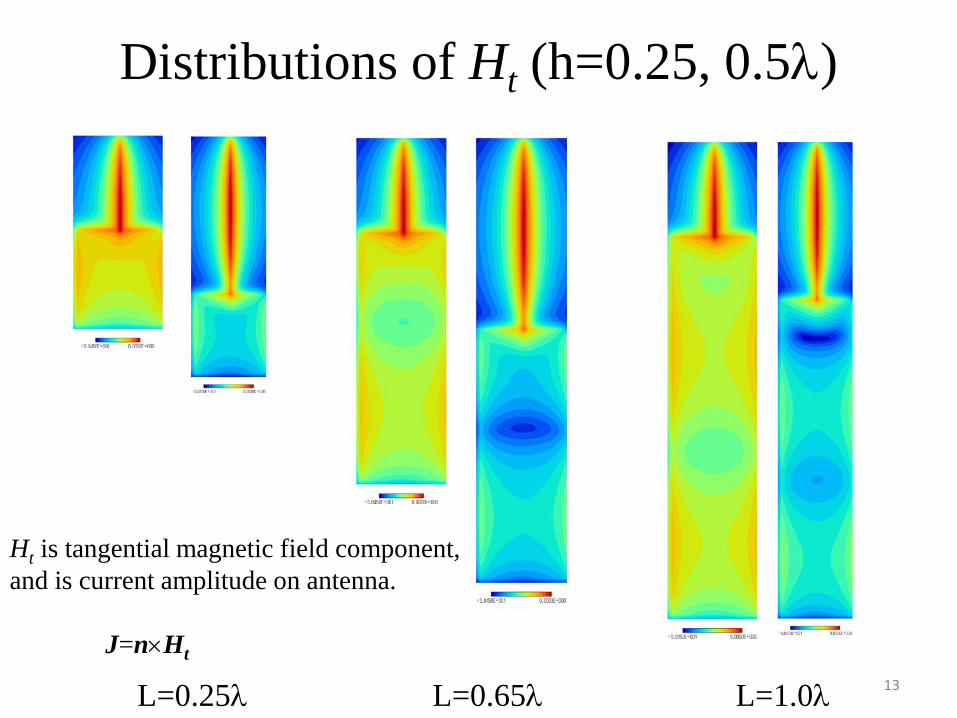
L=0.25λ L=0.65λ L=1.0λ
Distributions of Ht (h=0.25, 0.5λ)
Ht is tangential magnetic field component,and is current amplitude on antenna.
J=n×Ht
13
• By making a notch on the casing, it is possible to partially suppress the current flow on the chassis.
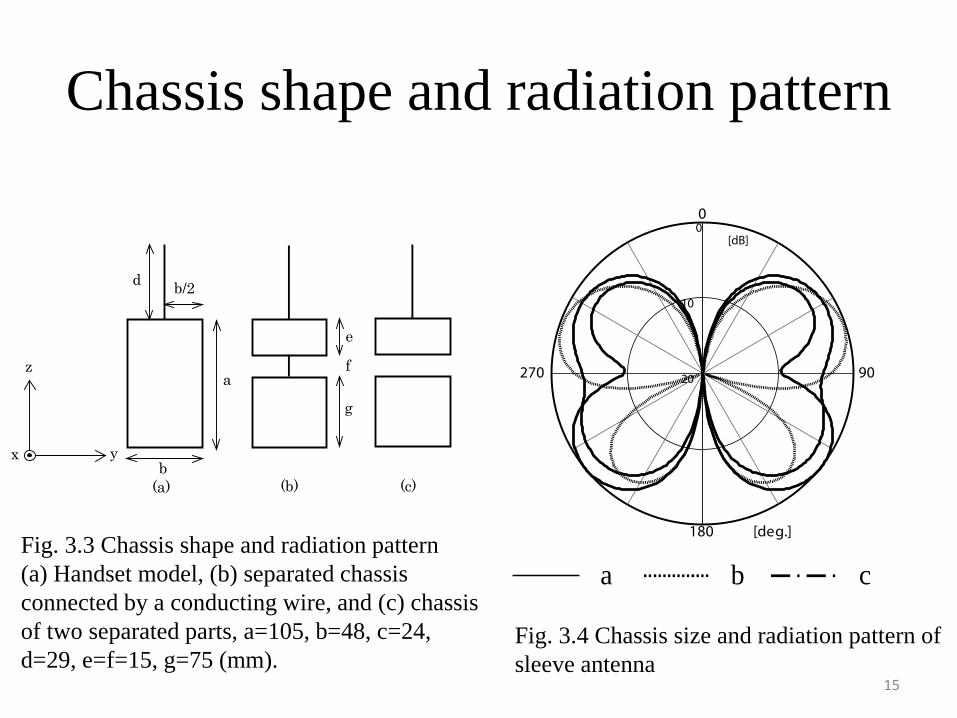
• In order to further suppress the undesirable radiation lobes, the chassis may be completely separated into two parts as shown in Fig. 3.3 with two separate parts connected by a conducting wire.
• The resulting radiation pattern for this shape of handset is shown in Fig. 3.4. Although the side lobes cannot be completely removed using this technique, handset type (b) does give a better side lobe suppression than handset type (a).
• If the handset is divided into two isolated sections (with no conducting wire), then the side lobes in the radiation pattern completely vanish. If a chassis length L is larger than the length of the monopole antenna h, then a large side lobe will appear.
• When discussing antenna length it is important to remember that the length refers to the electrical length of the antenna. The use of a helical structure or inductive loading can shorten the physical length of an antenna for mobile terminal applications.
• Its resonance properties are then equivalent to those of a monopole antenna or a sleeve antenna, where their electrical lengths are defined as λ/4 or λ/2 respectively. When using physically shortened antennas, the chassis electrical length must be less than the antenna electrical length.
14
Chassis shape and radiation pattern
d
a
b
z
yx
b/2
g
e
f
(a) (b) (c)
0
10
20
[dB]
0
90
180
270
[deg.]
a b cFig. 3.3 Chassis shape and radiation pattern(a) Handset model, (b) separated chassis connected by a conducting wire, and (c) chassis of two separated parts, a=105, b=48, c=24, d=29, e=f=15, g=75 (mm).
Fig. 3.4 Chassis size and radiation pattern of sleeve antenna
15

3.1.2 Relationship between Average Antenna Gain and Chassis Size
• As shown in the preceding section, the radiation pattern of a handset antenna depends greatly on the relative length of the antenna with respect to that of the chassis.
• Therefore, it is necessary to make some quantitative estimation of how much radiation pattern distortion will occur if the chassis size is changed.
• The chassis width does not change radiation pattern if the width is less than the chassis length, whilst a wide chassis increases the frequency bandwidth just like a thick wire antenna. Accordingly, chassis size in this section refers to the length only.
• An additional consideration is the slant angle of the handset relative to the operator’s head during actual use.
• This section shows the influence of the slant angle on the antenna gain and also discusses the influence of the head and the hand on the antenna performance.
16
• Since electromagnetic waves are scattered by many obstacles when travelling from the base station to the reception point, in modern mobile communication systems it can be assumed that the waves will approach the handset from all directions.
• As was shown in section 2.4.1, the waves arriving at the receiving point can be considered to be concentrated in a horizontal plane.
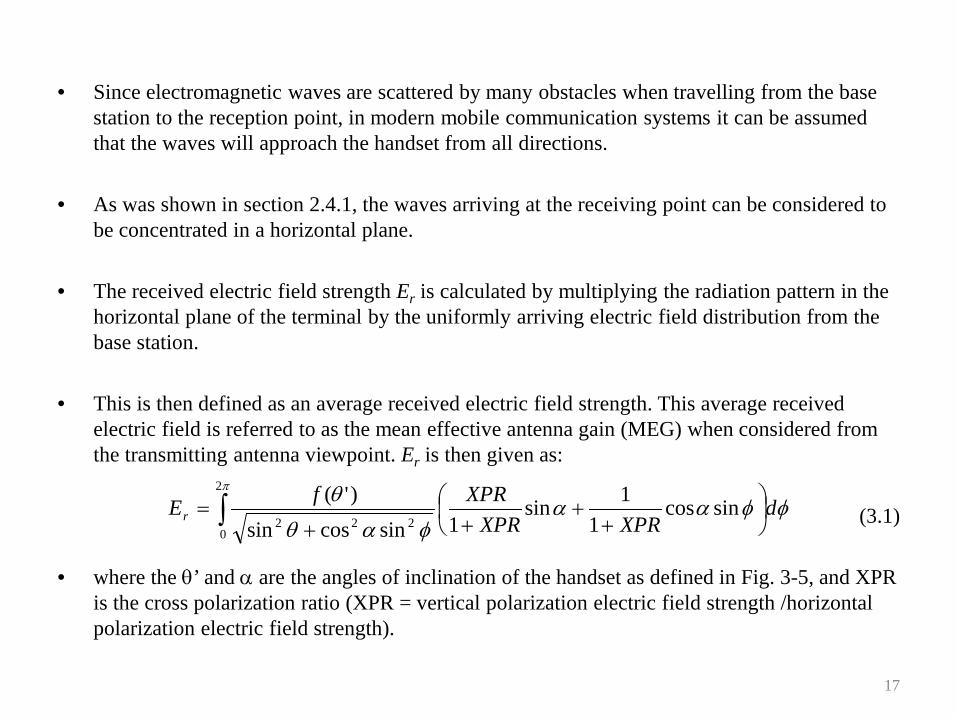
• The received electric field strength Er is calculated by multiplying the radiation pattern in the horizontal plane of the terminal by the uniformly arriving electric field distribution from the base station.
• This is then defined as an average received electric field strength. This average received electric field is referred to as the mean effective antenna gain (MEG) when considered from the transmitting antenna viewpoint. Er is then given as:
(3.1)
• where the θ’ and α are the angles of inclination of the handset as defined in Fig. 3-5, and XPR is the cross polarization ratio (XPR = vertical polarization electric field strength /horizontal polarization electric field strength).
∫
++
++=
π
φφααφαθ
θ2
0222
sincos1
1sin1sincossin
)'( dXPRXPR
XPRfEr
17

Fig. 3.5 Inclination angles θ’, α of the handset and coordinate system
x
y
z
θ
φx
z’
z
θ’
α
θ
φα
θ’
The waves arriving at the receiving point can be considered to be concentrated in a horizontal plane
18

• The angle θ’ is given in terms of the Eθ and Eφ electric field components, but can be neglected for most handset terminals. In the handset coordinate system shown in Fig. 3-5 (a), φ and θ’ satisfy the following equation:
(3.2)
• Fig. 3-6 shows an example of the average received electric field strength as a function of the angle of inclination, using the handset radiation pattern shown in Fig.3-2 (a). The data set ‘S’, ‘M’ and ‘L’ represent small, medium and large casing sizes respectively.
• Although the difference between the chassis sizes is hardly noticeable when the inclination angle is less than 10°, it can be clearly seen that the antenna gain of even the smallest chassis is large for an inclination angle that is greater than 10°.
• It can be concluded from these results that it is desirable to increase the effective gain of the antenna so that side lobes do not appear in the radiation pattern.
αφπαθ +
−=
21'
19
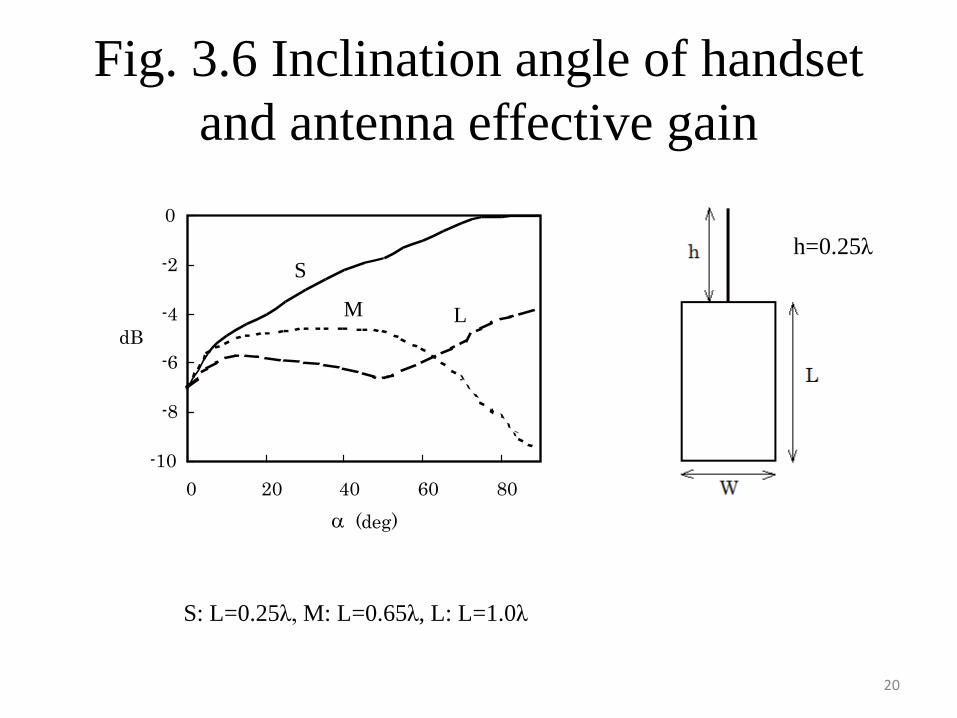
Fig. 3.6 Inclination angle of handset and antenna effective gain
LM
-10
-8
-6
-4
-2
0
0 20 40 60 80
α(deg)
dB
S
S: L=0.25λ, M: L=0.65λ, L: L=1.0λ
α
h=0.25λ
20
3.1.3 Current flow measurement on the handset chassis
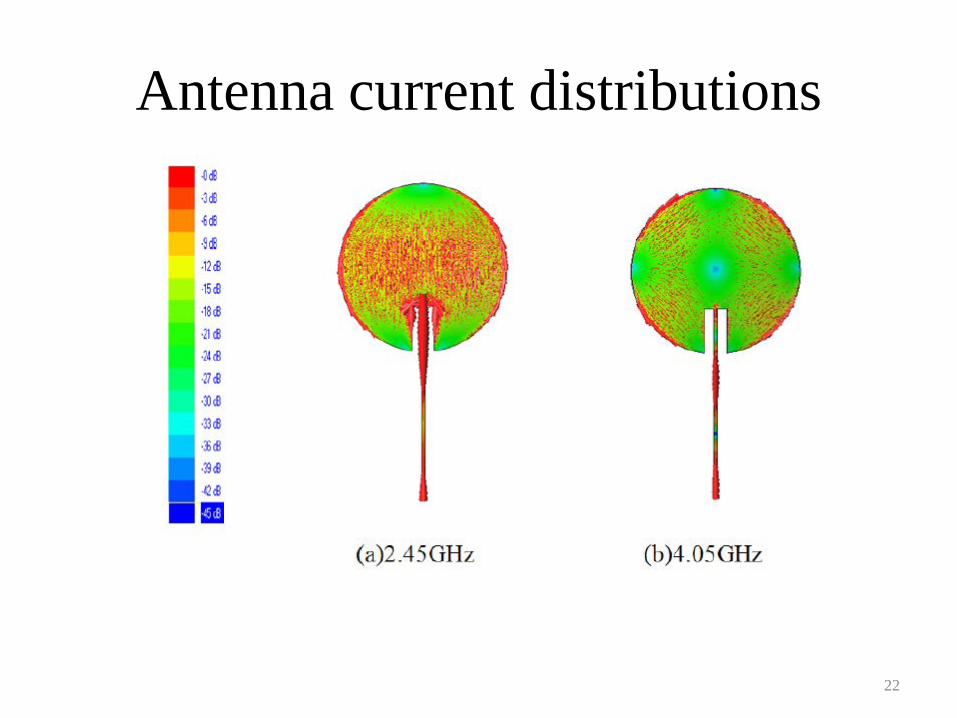
• Once the antenna is installed into the handset chassis, simulation or measurement is required to find the current flow on the chassis surface.
• Since it is difficult to include all the electronic components that make up the handset in the simulation model, it is better to measure the current flow on the chassis. It can, however, be estimated indirectly from the measured radiation pattern of the antenna with the chassis.
• For radiation pattern measurement, the influence of the feed cables should be minimized. The current flowing on the cable is suppressed to a low level by covering it with ferrite beads or using a balun.
• Alternatively, the feed cable may be removed using a built-in miniature transmitter in the terminal. For the measurement method using optical fiber, the metal cable connected to the antenna is replaced by optical fiber and the cable effects can be greatly reduced.
• With a miniaturized Optical/Electrical (O/E) converter connected to the antenna, accurate measurement results can be obtained. The S-parameter method as shown in 2.1.4 can also eliminate cable effects with off-line processing.
21
Antenna current distributions
22
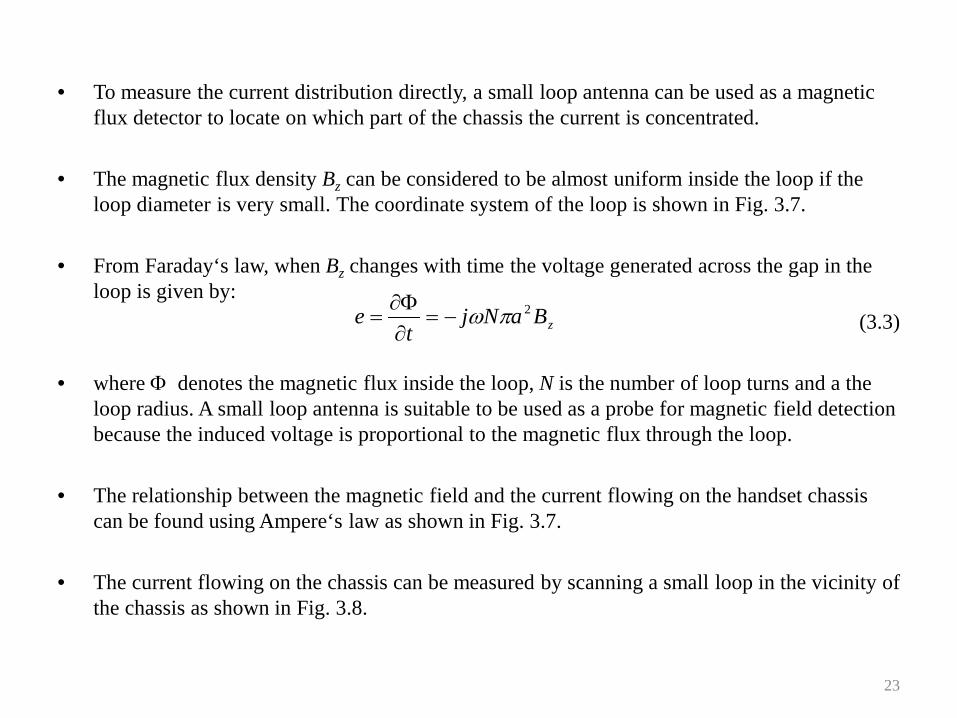
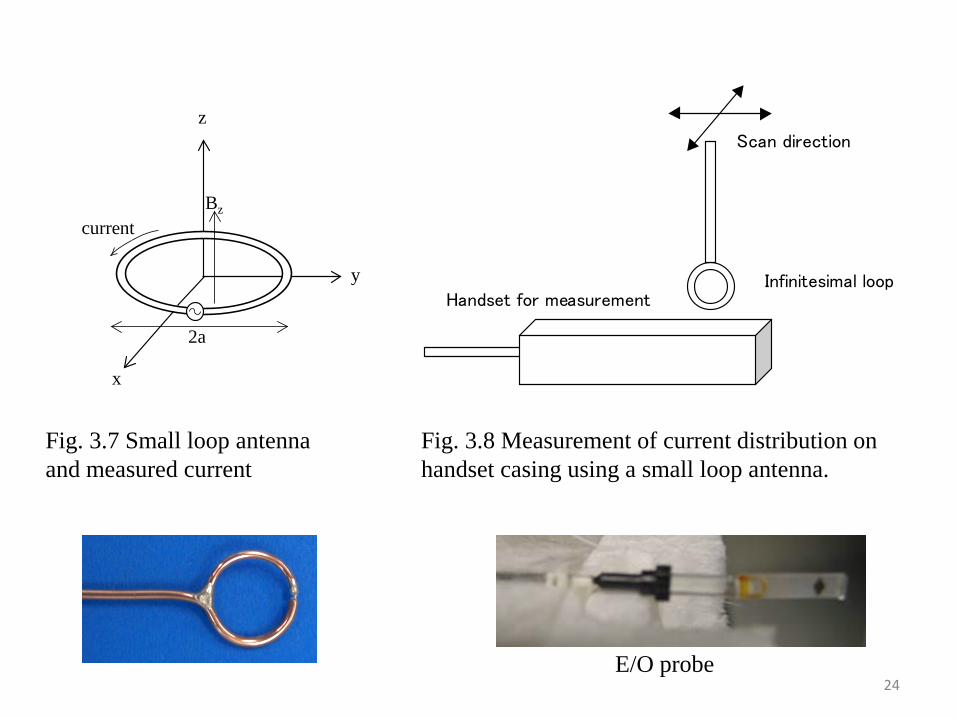
• To measure the current distribution directly, a small loop antenna can be used as a magnetic flux detector to locate on which part of the chassis the current is concentrated.
• The magnetic flux density Bz can be considered to be almost uniform inside the loop if the loop diameter is very small. The coordinate system of the loop is shown in Fig. 3.7.
• From Faraday‘s law, when Bz changes with time the voltage generated across the gap in the loop is given by:
(3.3)
• where Φ denotes the magnetic flux inside the loop, N is the number of loop turns and a the loop radius. A small loop antenna is suitable to be used as a probe for magnetic field detection because the induced voltage is proportional to the magnetic flux through the loop.
• The relationship between the magnetic field and the current flowing on the handset chassis can be found using Ampere‘s law as shown in Fig. 3.7.
• The current flowing on the chassis can be measured by scanning a small loop in the vicinity of the chassis as shown in Fig. 3.8.
zBaNjt
e 2πω−=∂Φ∂
=
23
x
y
z
current
2a
Bz
Infinitesimal loop
Scan direction
Handset for measurement
Fig. 3.7 Small loop antenna and measured current
Fig. 3.8 Measurement of current distribution on handset casing using a small loop antenna.
E/O probe24
3.2 The phantom - an electrical equivalent model of the human body
• Although the influence of the handset chassis on the antenna operating characteristics is a major problem, the primary problem to overcome is the influence of the human body on the antenna.
• Since handset in used is in close proximity to the head and body, it is strongly affected by these parts of the human body. Thus, for practical handset antenna designs it is required to take into account the influences of the human body.
• It is therefore necessary to account for such influences on the antenna as much as possible. Moreover, even under the influence of the human body, the antenna should still operate within specified limits dictated by the system designer.
• The design of a handset antenna should also be such that the human body (specifically the head) is irradiated as little as possible. A medical technique that utilizes microwave radiation, called diathermy, is often used in the treatment of several different kinds of disease.
• This type of medical treatment was uncovered not long after the discovery of electromagnetic waves. However, since there was no theoretical basis to analyze such effect at that time, only the negative influences of electromagnetic waves on the human body were more commonly known. 25

• When it was realized that electromagnetic waves can heat up human body tissues by a few degrees, a safety standard was introduced to indicate an acceptable level of exposure of the human body to electromagnetic waves.
• The original safety standard defined the safe level of irradiation of the surface of the human body as 10 mW/cm2 but this was later lowered to 1 mW/cm2.
• One application of such heating effect is in the treatment of cancer. It is known that cancer cells have a lower resistance to heat than normal body cells thus irradiating both the cancer and normal cells with electromagnetic radiation can destroy the cancer cells.
• This type of medical treatment is referred to as hypothermia. However, the purpose of this chapter is not to discuss the influence of electromagnetic waves on the human body but to evaluate whether or not the level of electromagnetic radiation radiated by the portable handset terminal satisfies the national safety standard.
• With the cooperation of a volunteer, it is possible to measure the influence of electromagnetic radiation from the handset on the human body. In performing such experiment, one problem is that the volunteer must maintain the same posture as if the handset would be in actual use for long period of time.
• Another problem is that the volunteer may be over exposed to electromagnetic radiation. There can also be considerable difference between individuals, thus making it difficult to achieve data repeatability. 26
• The gain of a handset antenna was evaluated using the random field measurement method for 30 different test subjects and has been reported as having a deviation of 6 dB depending on a difference in operators.
• In order to obtain test data repeatability, the influence of the human body on the antenna may be evaluated using a special kind of mannequin called a phantom. In addition, the composition of the dielectric materials that make up the phantom (or the human body) may be entered into a computer in order to simulate the experimental test setup.
• The specifications of phantoms for numerical simulation and experimental usage are described in detail in the following sections.
27

3.2.1 Phantoms used in numerical simulations
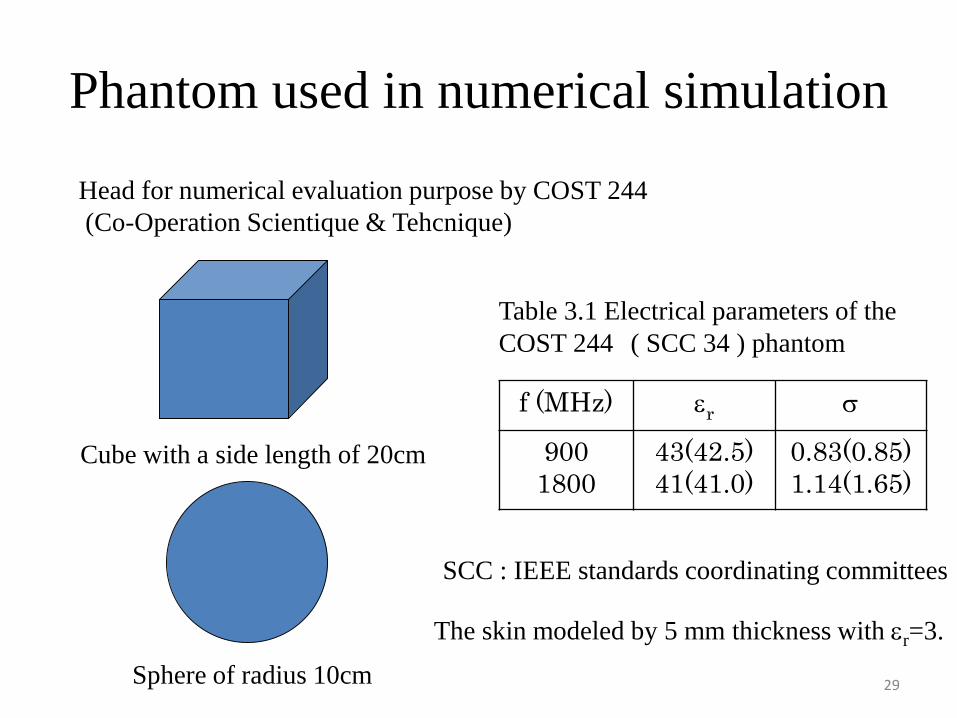
• For mobile telephone development, it is necessary to evaluate the influence of the human head on the handset radiation characteristics. An European work group called CO-operation in the field of Scientific and Technical Research 244 (COST 244) has proposed two simplified models of the head for numerical evaluation purposes .
• One model is a cube with a side length of 20 cm and the other is a sphere of radius of 10 cm. Both the cube and the sphere are modeled on the basis that they are composed of a homogeneous dielectric material. An example of typically assumed material constants is given in Table 3.1. In order to model the skin, an outer shell of dielectric material of thickness 5 mm, with a dielectric constant of 3 (εr=3), is added.
• A similar phantom described by the COST 244 work group was also adopted in the United States by the IEEE Standards Coordinating Committees (SCC 34) which describes safety standards for irradiation by electromagnetic radiation.
• There is, however, a slight difference in the assumed material constants as shown in Table 3.1. Such a simple form of phantom is useful as a standard to check the validity of computation codes and measurement setups. Since the composition of a human body is extremely complex, a phantom model that imitates the structure of the body (e.g. the head) is used in general.
28
Phantom used in numerical simulation
Head for numerical evaluation purpose by COST 244(Co-Operation Scientique & Tehcnique)
Cube with a side length of 20cm
Sphere of radius 10cm
f (MHz) εr σ
9001800
43(42.5)41(41.0)
0.83(0.85)1.14(1.65)
Table 3.1 Electrical parameters of the COST 244 ( SCC 34 ) phantom
SCC : IEEE standards coordinating committees
The skin modeled by 5 mm thickness with εr=3.
29
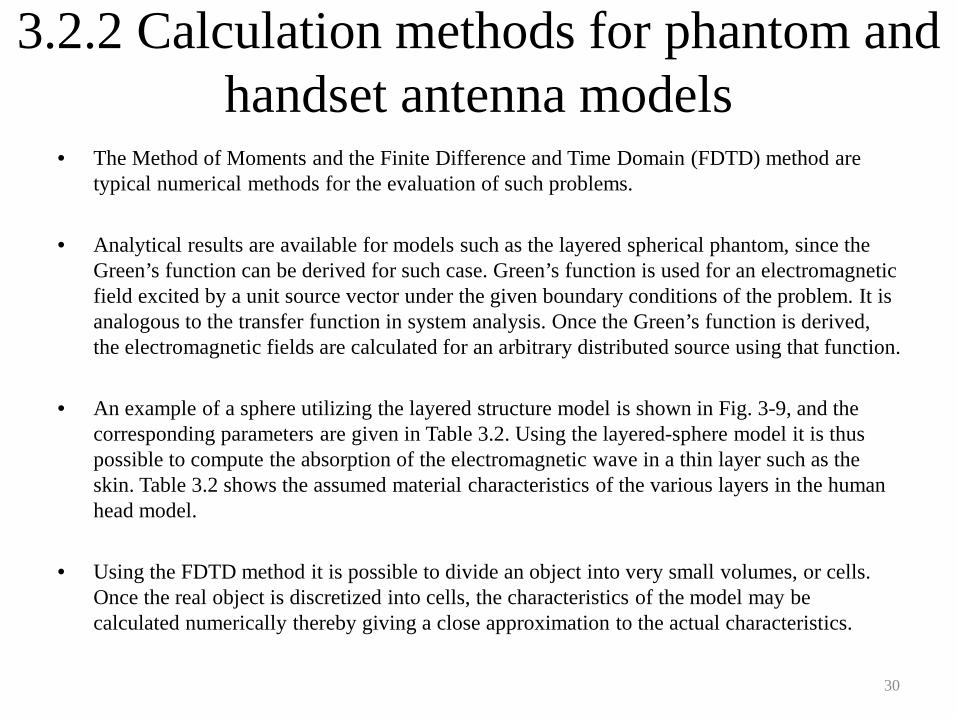
3.2.2 Calculation methods for phantom and handset antenna models
• The Method of Moments and the Finite Difference and Time Domain (FDTD) method are typical numerical methods for the evaluation of such problems.
• Analytical results are available for models such as the layered spherical phantom, since the Green’s function can be derived for such case. Green’s function is used for an electromagnetic field excited by a unit source vector under the given boundary conditions of the problem. It is analogous to the transfer function in system analysis. Once the Green’s function is derived, the electromagnetic fields are calculated for an arbitrary distributed source using that function.
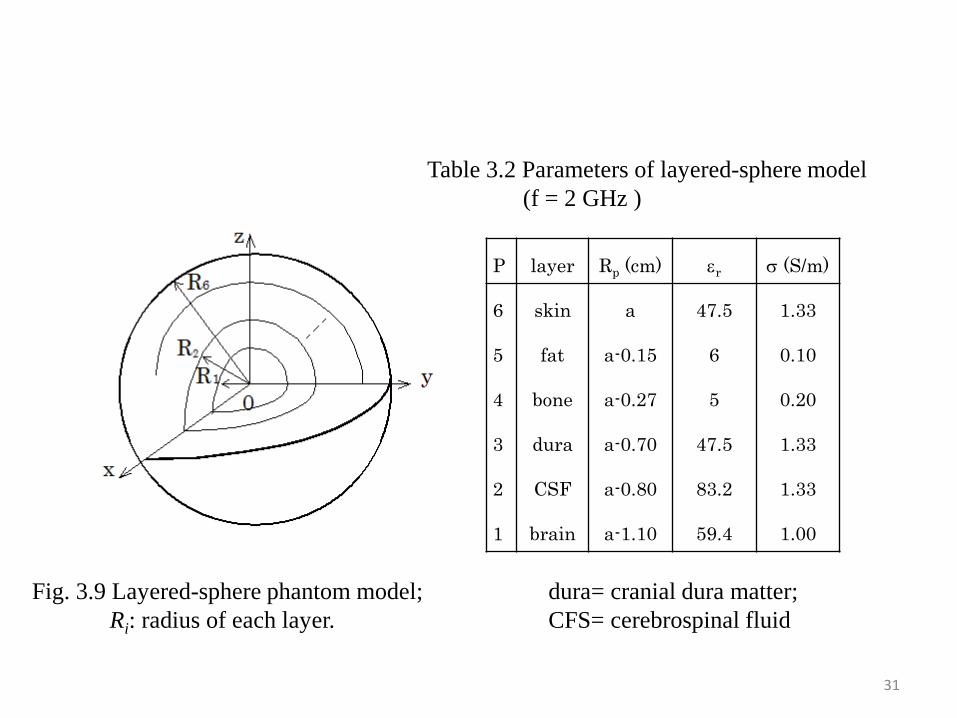
• An example of a sphere utilizing the layered structure model is shown in Fig. 3-9, and the corresponding parameters are given in Table 3.2. Using the layered-sphere model it is thus possible to compute the absorption of the electromagnetic wave in a thin layer such as the skin. Table 3.2 shows the assumed material characteristics of the various layers in the human head model.
• Using the FDTD method it is possible to divide an object into very small volumes, or cells. Once the real object is discretized into cells, the characteristics of the model may be calculated numerically thereby giving a close approximation to the actual characteristics.
30
P layer Rp (cm) εr σ (S/m)
6
5
4
3
2
1
skin
fat
bone
dura
CSF
brain
a
a-0.15
a-0.27
a-0.70
a-0.80
a-1.10
47.5
6
5
47.5
83.2
59.4
1.33
0.10
0.20
1.33
1.33
1.00
Fig. 3.9 Layered-sphere phantom model; Ri: radius of each layer.
Table 3.2 Parameters of layered-sphere model(f = 2 GHz )
dura= cranial dura matter; CFS= cerebrospinal fluid
31
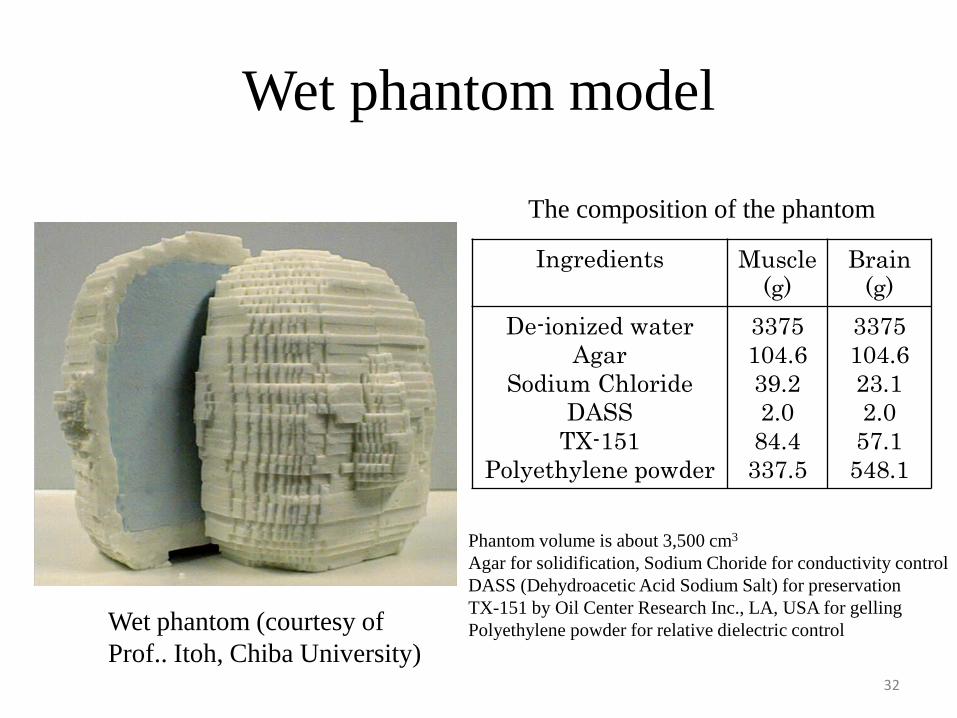
Wet phantom model
Wet phantom (courtesy of Prof.. Itoh, Chiba University)
Ingredients Muscle (g)
Brain (g)
De-ionized waterAgar
Sodium ChlorideDASS
TX-151Polyethylene powder
3375104.639.22.0
84.4337.5
3375104.623.12.0
57.1548.1
The composition of the phantom
Phantom volume is about 3,500 cm3
Agar for solidification, Sodium Choride for conductivity controlDASS (Dehydroacetic Acid Sodium Salt) for preservation TX-151 by Oil Center Research Inc., LA, USA for gellingPolyethylene powder for relative dielectric control
32
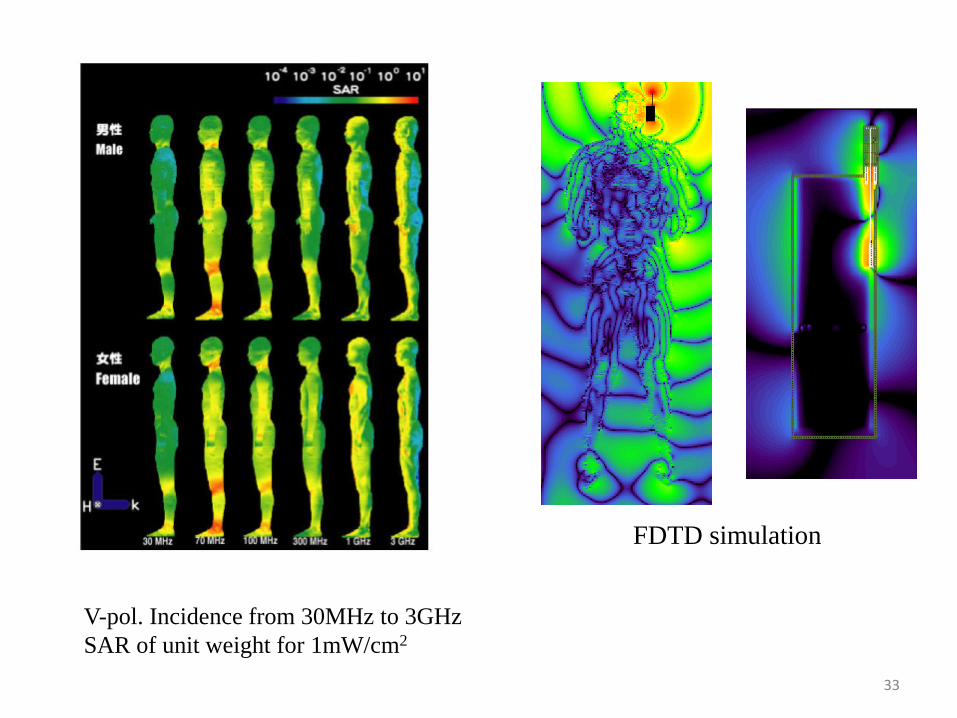
FDTD simulation
V-pol. Incidence from 30MHz to 3GHzSAR of unit weight for 1mW/cm2
33
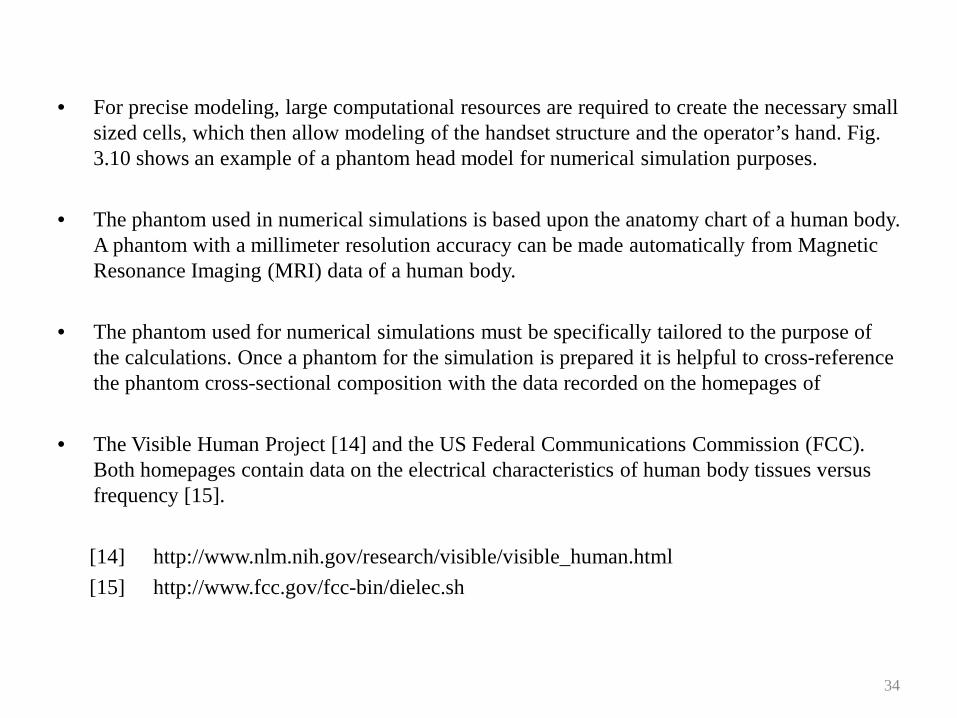
• For precise modeling, large computational resources are required to create the necessary small sized cells, which then allow modeling of the handset structure and the operator’s hand. Fig. 3.10 shows an example of a phantom head model for numerical simulation purposes.
• The phantom used in numerical simulations is based upon the anatomy chart of a human body. A phantom with a millimeter resolution accuracy can be made automatically from Magnetic Resonance Imaging (MRI) data of a human body.
• The phantom used for numerical simulations must be specifically tailored to the purpose of the calculations. Once a phantom for the simulation is prepared it is helpful to cross-reference the phantom cross-sectional composition with the data recorded on the homepages of
• The Visible Human Project [14] and the US Federal Communications Commission (FCC). Both homepages contain data on the electrical characteristics of human body tissues versus frequency [15].
[14] http://www.nlm.nih.gov/research/visible/visible_human.html[15] http://www.fcc.gov/fcc-bin/dielec.sh
34

Fig. 3.10 Head phantom model for calculations
35

3.2.3 Phantoms for Use in Experimental Measurements
• To evaluate the characteristics of a mobile handset operating near the human body as well as to confirm the validity of simulation models, experimental measurements using a physical model of a phantom are also required.
• Since cost and/or complexity preclude the construction of a phantom that is an exact replica of the human body, a phantom composed of two different kinds of homogeneous dielectric material is normally used. A plastic skin of several millimeters thick, called the shell, is used to enclose a liquid to maintain the physical form of the phantom.
• There are two main classifications of phantoms for experimental use: (1) a dry phantom which is made of a hard ceramic material and (2) a wet phantom which consists of a water solution or a jelly-like substance made into the desired shape.
36
• One problem is that the dry phantom tends to be very heavy although the hard material acts as a realistic imitation of the head, hand and upper half of the body. The wet phantom however offers the advantage that additives can be used to change the material characteristics of the phantom.
• In addition, when performing electromagnetic wave irradiation experiments, it has the advantage that an optional cut can be made through the body of the phantom to observe an arbitrary cut plane in the measurements.
• On the other hand, a major disadvantage of wet phantoms when compared with dry phantoms is that, due to the type of material used in wet phantoms, it is difficult to preserve them for more than a month.
37

3.2.3.1 The dry phantom• The human body consists of low water content structures such as the skin, fat and bone, and
high water content structures such as the brain, muscles and internal organs. However, the electrical characteristics of the tissues vary greatly at frequencies of 10 MHz and more.
• For the mobile communications operating frequency band of 800 MHz to 2 GHz, the dielectric-loss tangent is 0.1 to 3.0, and the dielectric constant from 20 to 70.
• For materials used in the construction of phantoms, it is not easy to obtain a material with a loss tangent (tan δ) between 1 and 10. Ceramic materials, however, can be used to give a dielectric constant (εr) between 10 and several 10,000s, in the microwave frequency band.
• A phantom with a loss tangent similar to that of the human body can be made by adding conducting powder to the ceramic. The composition of the plastic shell used to form the phantom shape is Ba, Ca, Ti, Sn and carbon powder, which then mimics the electrical characteristics of a living body.
• The electrical characteristics of the plastic and oxide powder are εr = 3.1, tanδ = 0.1 at 1 MHz and εr = 20, tanδ = 0.02 at 1 MHz, respectively. The dry phantom shown in Fig. 3.11 is proven to be particularly useful when the influence of the hand on the radiation characteristics of the handset have to be considered.
38
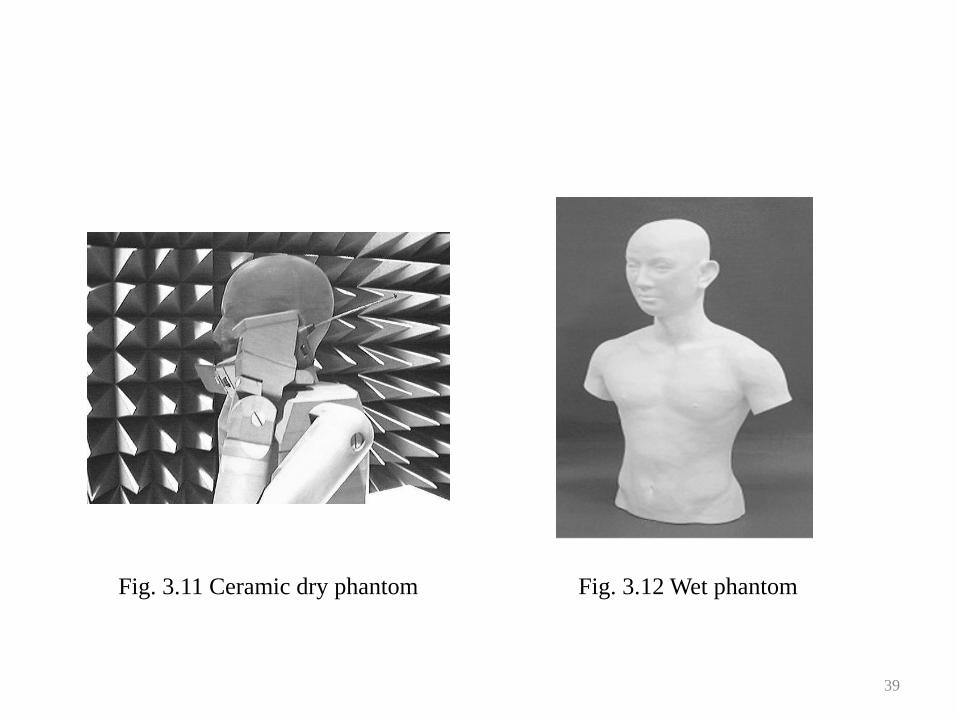
Fig. 3.11 Ceramic dry phantom Fig. 3.12 Wet phantom
39

3.2.3.2 The wet phantom• For the examination of electromagnetic irradiation effects on the human body, it is important
to measure the temperature rise distribution inside the phantom and a dry phantom must therefore be cut into sections during the production process.
• The wet phantom is convenient, since an optional cut along one side is possible for making such measurements, as shown in Fig. 3.12. For performing hyperthermia experiments, it is also possible to place the radiation applicator inside the wet phantom at a location of the users’ choice.
• In the construction of wet phantoms, a salt solution and agar have been the choice for phantoms used in the microwave frequency band. The loss tangent may be controlled by use of the NaCl, although the control of the dielectric constant was proven to be difficult.
• Since the material from which a wet phantom is made is equivalent to biological material, it also suffers the problem that it can decompose over time. For experimental use, it is ideal to have wet phantoms that can be preserved for long period of time while having suitable material characteristics.
• If the food preservative Dehydroacetic Acid Sodium Salt (DASS) is added to the phantom material, preservation period of one month or more may be possible at normal temperature. The phantom should also be covered by a thin film for further protection. 40
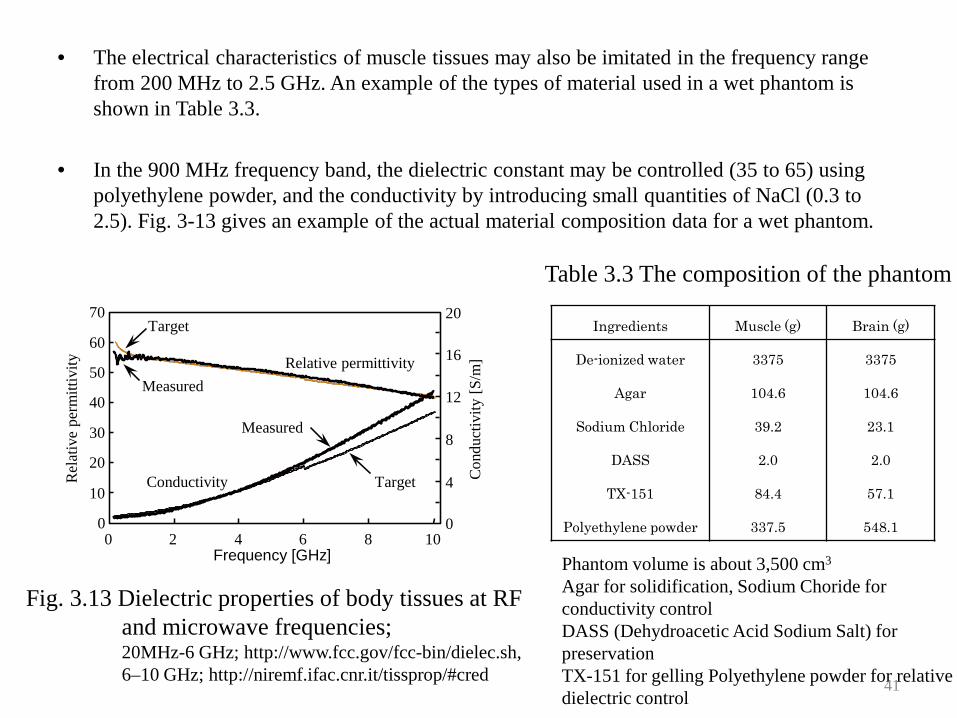
• The electrical characteristics of muscle tissues may also be imitated in the frequency range from 200 MHz to 2.5 GHz. An example of the types of material used in a wet phantom is shown in Table 3.3.
• In the 900 MHz frequency band, the dielectric constant may be controlled (35 to 65) using polyethylene powder, and the conductivity by introducing small quantities of NaCl (0.3 to 2.5). Fig. 3-13 gives an example of the actual material composition data for a wet phantom.
0
4
8
12
16
20
0
10
20
30
40
50
60
70
0 2 4 6 8 10
Rel
ativ
epe
rmitt
ivity
Con
duct
ivity
[S/m
]
Frequency [GHz]
Relative permittivity
Conductivity
Target
Measured
Target
Measured
Fig. 3.13 Dielectric properties of body tissues at RFand microwave frequencies; 20MHz-6 GHz; http://www.fcc.gov/fcc-bin/dielec.sh, 6–10 GHz; http://niremf.ifac.cnr.it/tissprop/#cred
Table 3.3 The composition of the phantom
Ingredients Muscle (g) Brain (g)
De-ionized water
Agar
Sodium Chloride
DASS
TX-151
Polyethylene powder
3375
104.6
39.2
2.0
84.4
337.5
3375
104.6
23.1
2.0
57.1
548.1
Phantom volume is about 3,500 cm3
Agar for solidification, Sodium Choride for conductivity controlDASS (Dehydroacetic Acid Sodium Salt) for preservation TX-151 for gelling Polyethylene powder for relative dielectric control
41
3.2.3.3 Whole body phantoms• In the 900 MHz operating band and higher, the hand and the head are the dominant influences
on mobile telephone radiation characteristics. For low frequency bands such as the 150 MHz band, used for Multiple Channel Access (MCA) services, a whole body phantom is required.
• This is because the wavelength of the radiation is considerably longer than that at the microwave frequencies and resonance effects are observed across the entire length of the human body. VHF band pagers are also used in close proximity to the human body, thus it is also necessary to evaluate the influence of the human body on the operating characteristics of a pager.
• A dry whole body phantom may be made with ceramics only, whereas a wet whole body phantom is made by filling a plastic mannequin with a salt solution and using a double cylinder made of vinyl chloride containing material which is electrically equivalent to that of human muscle tissue.
• An example of such a whole body phantom is shown in Fig. 3.14. There is also a homogeneous phantom which is composed of rectangular parallelepipeds that occupies the same volume as a ‘standard’ human body. As an example, a phantom which is equivalent to an average Japanese man in his 20s is 40 cm × 16 cm × 166 cm, with a relative permittivity of εr = 40.0 and a conductivity of σ = 0.32 S/m.
42
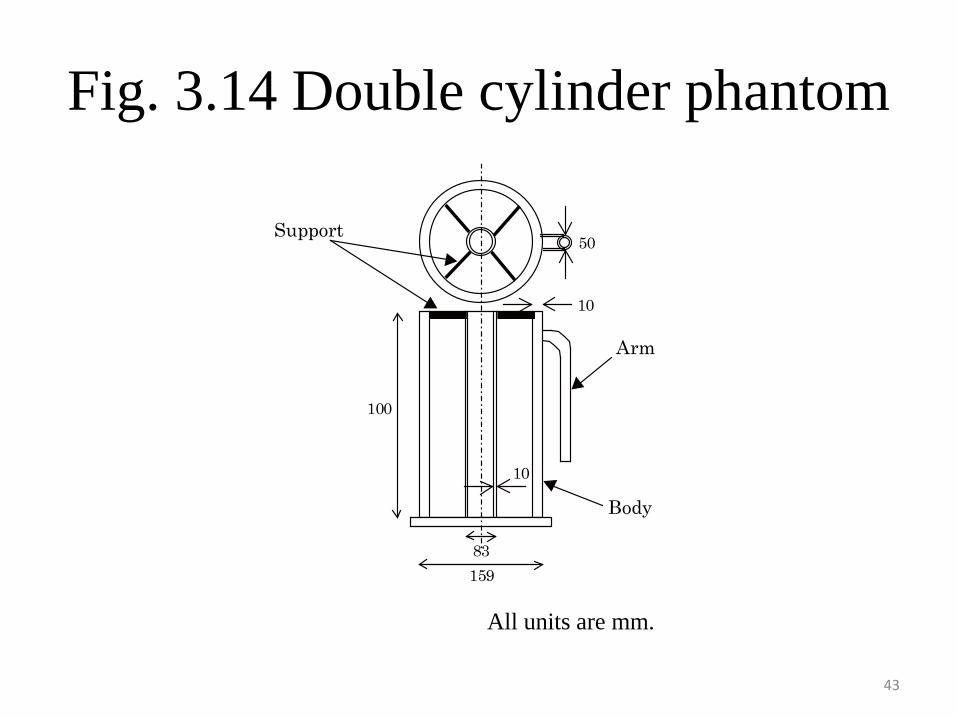
Fig. 3.14 Double cylinder phantom
83159
100
10
10
50Support
Arm
Body
All units are mm.
43

3.3 Antenna measurements with human test subjects and phantoms• This section presents measurement examples for evaluating the characteristics of a mobile
handset antenna in close proximity to human test subjects.
• Actual measured data of the antenna input and radiation characteristics are presented using a standard dipole antenna. The measurement results are also compared with these obtained using a dry phantom shaped like the upper half of the human body.
• The close proximity of the human body to a handset antenna can change the input impedance characteristics and also distort the radiation pattern of the antenna.
• The influences of the hand and the head on the antenna may be measured by fixing the antenna and handset to the hand of the dry phantom and introducing a coaxial feeder cable between the antenna feed point and the measurement equipment.
• As mentioned in Chapter 2, while performing the measurements, the position of the antenna (and cable) relative to the phantom should not be changed. A material such as styrene foam, with a dielectric constant close to 1 (almost equivalent to air), is used to hold the antenna under test in position. Fig. 3.15 shows the antenna measurement setup using a dry phantom.
44
• For the antenna input impedance measurement, if the distance L between the feed point and the phantom surface is greater than a wavelength (L > λ), the measured results are unaffected by the presence of the phantom.
• Since the phantom acts as an obstacle which disturbs the radiation field from the antenna, the radiation pattern toward the phantom side will be changed.
• Measurement examples are presented in section 3.3. By measuring the radiation efficiency of the antenna while it is in close proximity to the phantom, the extent to which power is absorbed by phantom may be evaluated.
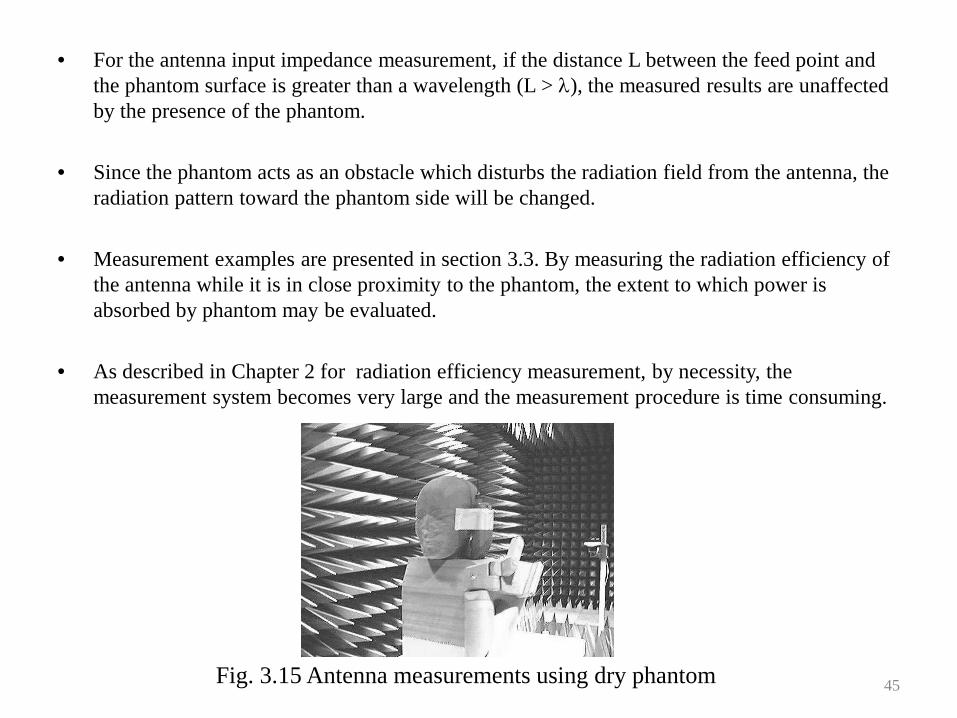
• As described in Chapter 2 for radiation efficiency measurement, by necessity, the measurement system becomes very large and the measurement procedure is time consuming.
Fig. 3.15 Antenna measurements using dry phantom 45
• For a relative measurement, the random field method is a well-known technique. This method was also explained in Chapter 2. Normally, for the random field measurement a human test subject is used to hold the terminal while the measurement is performed. However, the measurement error can be reduced by the use of a phantom.
• The Mean Effective Gain (MEG) of the radiation pattern is measured inside a RF anechoic chamber and is used to evaluate the relative efficiency. In a real operating environment for a mobile communication system, an approximate antenna gain is calculated using the MEG in the horizontal plane, as defined in 3.1.
• As mentioned previously, this is due to the fact that the signal arriving at the mobile terminal is coming from a point far away and the RF waves are thus concentrated in the horizontal plane.
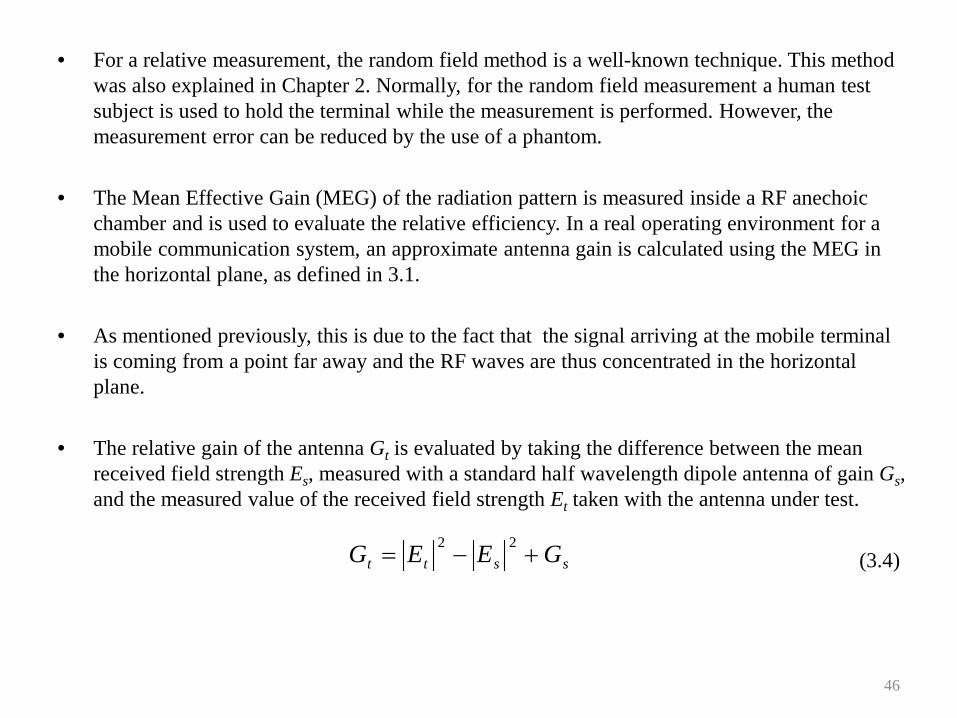
• The relative gain of the antenna Gt is evaluated by taking the difference between the mean received field strength Es, measured with a standard half wavelength dipole antenna of gain Gs, and the measured value of the received field strength Et taken with the antenna under test.
(3.4)sstt GEEG +−= 22
46
3.3.1 Measurements of antenna characteristics in the presence of human body
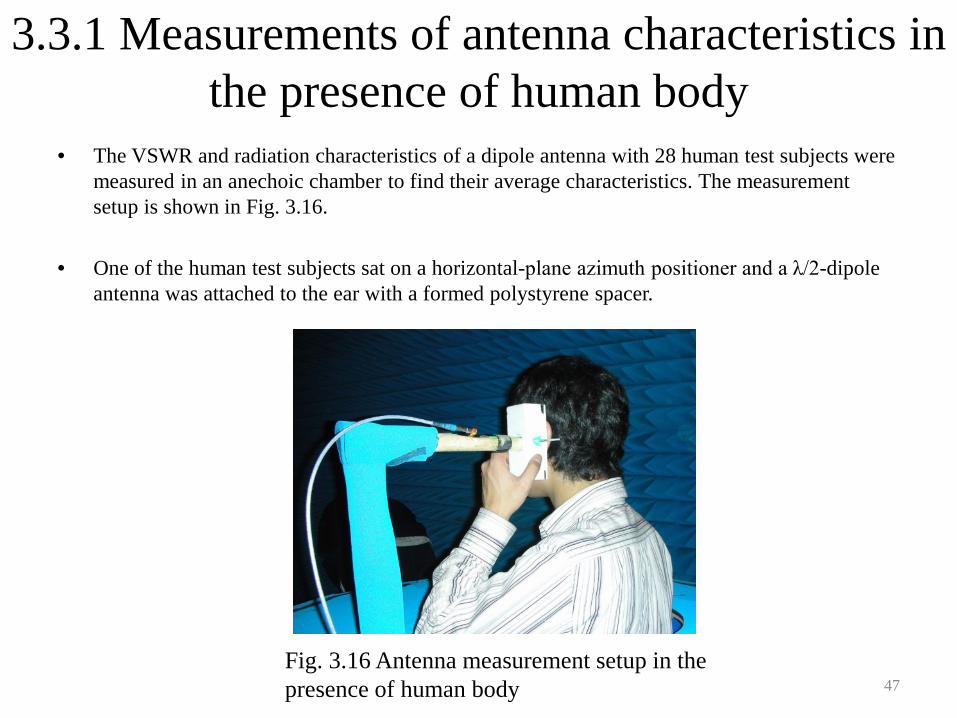
• The VSWR and radiation characteristics of a dipole antenna with 28 human test subjects were measured in an anechoic chamber to find their average characteristics. The measurement setup is shown in Fig. 3.16.
• One of the human test subjects sat on a horizontal-plane azimuth positioner and a λ/2-dipole antenna was attached to the ear with a formed polystyrene spacer.
Fig. 3.16 Antenna measurement setup in the presence of human body 47
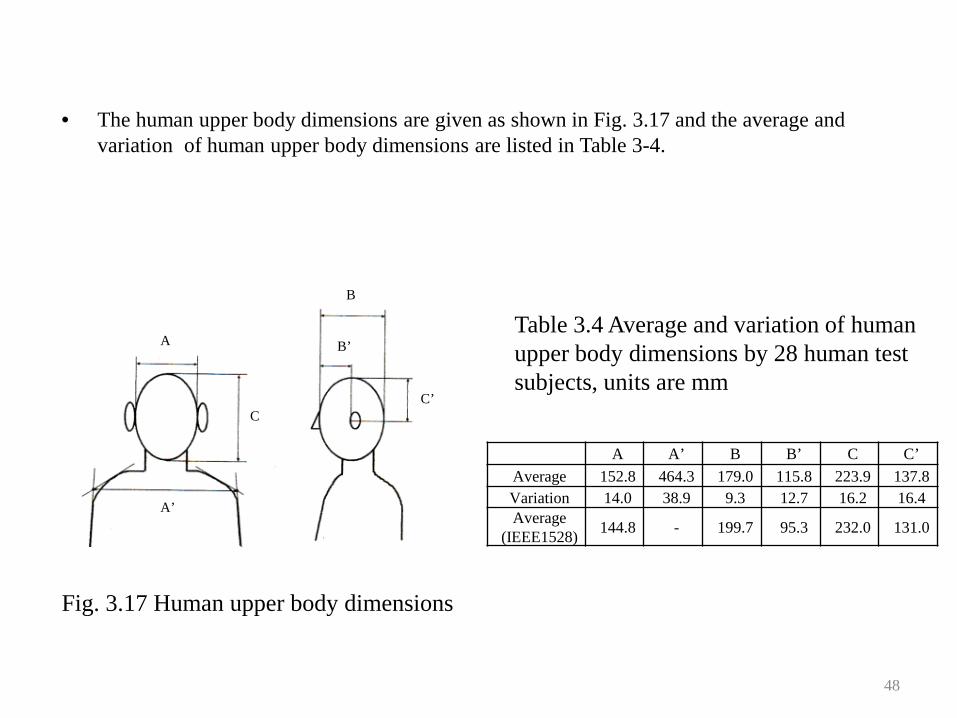
• The human upper body dimensions are given as shown in Fig. 3.17 and the average and variation of human upper body dimensions are listed in Table 3-4.
A
A’
C
B
B’
C’
Fig. 3.17 Human upper body dimensions
A A’ B B’ C C’Average 152.8 464.3 179.0 115.8 223.9 137.8Variation 14.0 38.9 9.3 12.7 16.2 16.4Average
(IEEE1528) 144.8 - 199.7 95.3 232.0 131.0
Table 3.4 Average and variation of human upper body dimensions by 28 human test subjects, units are mm
48
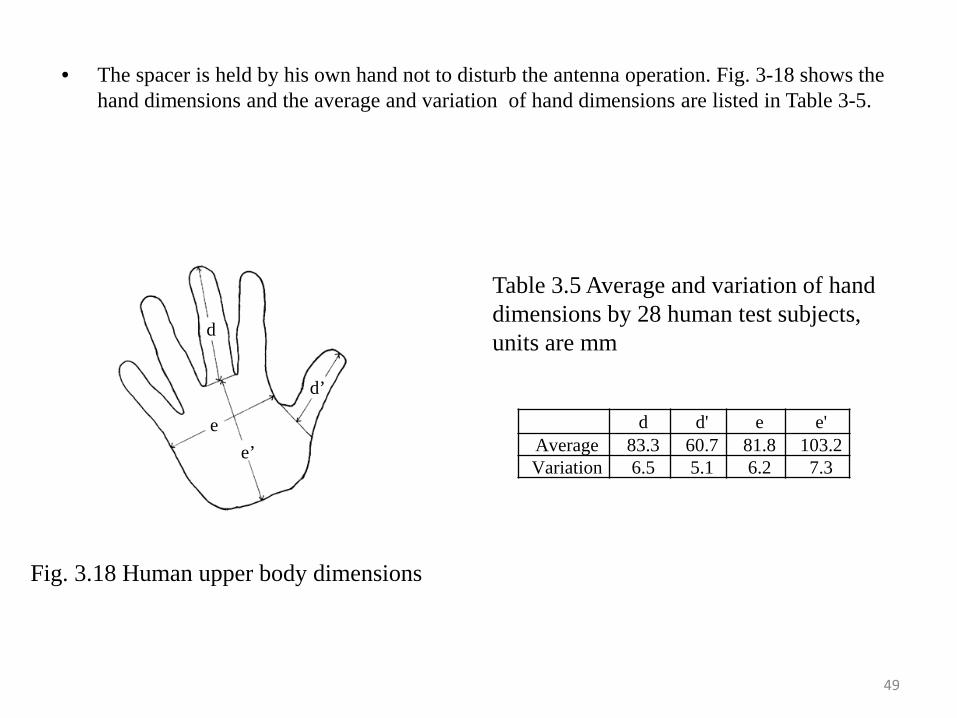
• The spacer is held by his own hand not to disturb the antenna operation. Fig. 3-18 shows the hand dimensions and the average and variation of hand dimensions are listed in Table 3-5.
e’e
d
d’
Fig. 3.18 Human upper body dimensions
d d' e e'Average 83.3 60.7 81.8 103.2 Variation 6.5 5.1 6.2 7.3
Table 3.5 Average and variation of hand dimensions by 28 human test subjects, units are mm
49
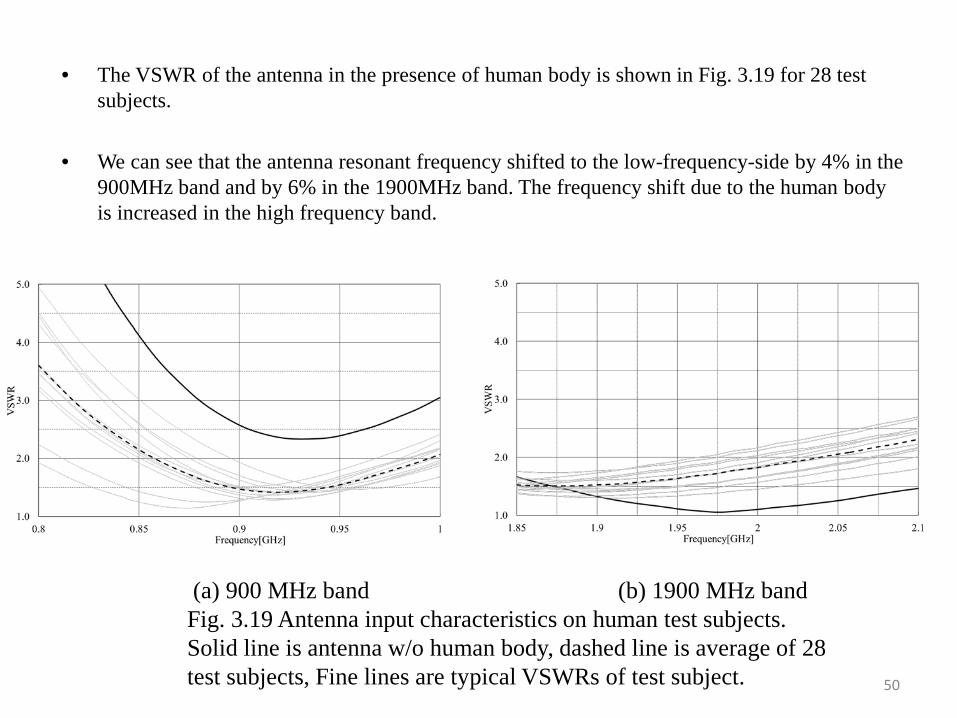
• The VSWR of the antenna in the presence of human body is shown in Fig. 3.19 for 28 test subjects.
• We can see that the antenna resonant frequency shifted to the low-frequency-side by 4% in the 900MHz band and by 6% in the 1900MHz band. The frequency shift due to the human body is increased in the high frequency band.
(a) 900 MHz band (b) 1900 MHz bandFig. 3.19 Antenna input characteristics on human test subjects. Solid line is antenna w/o human body, dashed line is average of 28 test subjects, Fine lines are typical VSWRs of test subject. 50
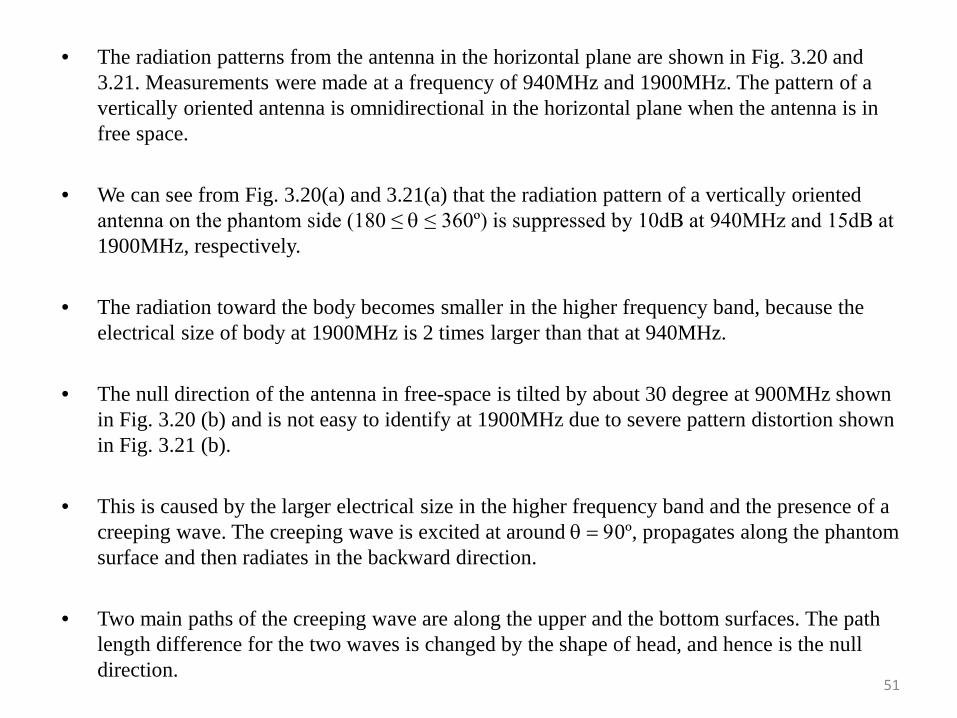
• The radiation patterns from the antenna in the horizontal plane are shown in Fig. 3.20 and 3.21. Measurements were made at a frequency of 940MHz and 1900MHz. The pattern of a vertically oriented antenna is omnidirectional in the horizontal plane when the antenna is in free space.
• We can see from Fig. 3.20(a) and 3.21(a) that the radiation pattern of a vertically oriented antenna on the phantom side (180 ≤ θ ≤ 360º) is suppressed by 10dB at 940MHz and 15dB at 1900MHz, respectively.
• The radiation toward the body becomes smaller in the higher frequency band, because the electrical size of body at 1900MHz is 2 times larger than that at 940MHz.
• The null direction of the antenna in free-space is tilted by about 30 degree at 900MHz shown in Fig. 3.20 (b) and is not easy to identify at 1900MHz due to severe pattern distortion shown in Fig. 3.21 (b).
• This is caused by the larger electrical size in the higher frequency band and the presence of a creeping wave. The creeping wave is excited at around θ = 90º, propagates along the phantom surface and then radiates in the backward direction.
• Two main paths of the creeping wave are along the upper and the bottom surfaces. The path length difference for the two waves is changed by the shape of head, and hence is the null direction.
51
(a) Vertical polarization (b) Horizontal polarization
Fig. 3.20 Radiation patterns in the horizontal plane at 940 MHz. The solid line represents the antenna with a phantom. The fine line is a typical pattern among 28 subjects. The dotted line is the average of 28 subjects.
52

(a) Vertical polarization (b) Horizontal polarization
Fig. 3.21 Radiation patterns in the horizontal plane at 1900 MHz. The solid line represents the antenna with a phantom. The fine line is a typical pattern among 28 subjects. The dotted line is the average of 28 subjects.
53
3.3.2 Measurement examples using a sphere-shaped wet phantom
• Examples of measurements using a spherical wet phantom of 10 cm radius and with a dielectric constant of εr = 52 + j19 are shown in this section.
• The parameters to be fixed during the measurement procedure are (1) the direction of the antenna towards the phantom and (2) the distance between the phantom and the antenna.
• For the measurements, a standard dipole antenna was used and two specific measurements were made (1) the position of the maximum radiation from the antenna towards the phantom and (2) the position of the null in the radiation pattern, as shown in Fig. 3-22.
• The measurements were made at a frequency of 2.5 GHz. The radiation patterns from the antenna in the E- and H-planes are shown in Fig. 3-23 (a) and (b) respectively.
• The pattern for only the E-plane of Fig. 3-23(b) is also shown in Fig. 3-24, because this antenna position is axial symmetrical about the antenna. The H-plane pattern is omnidirectional for all the parameters.
54
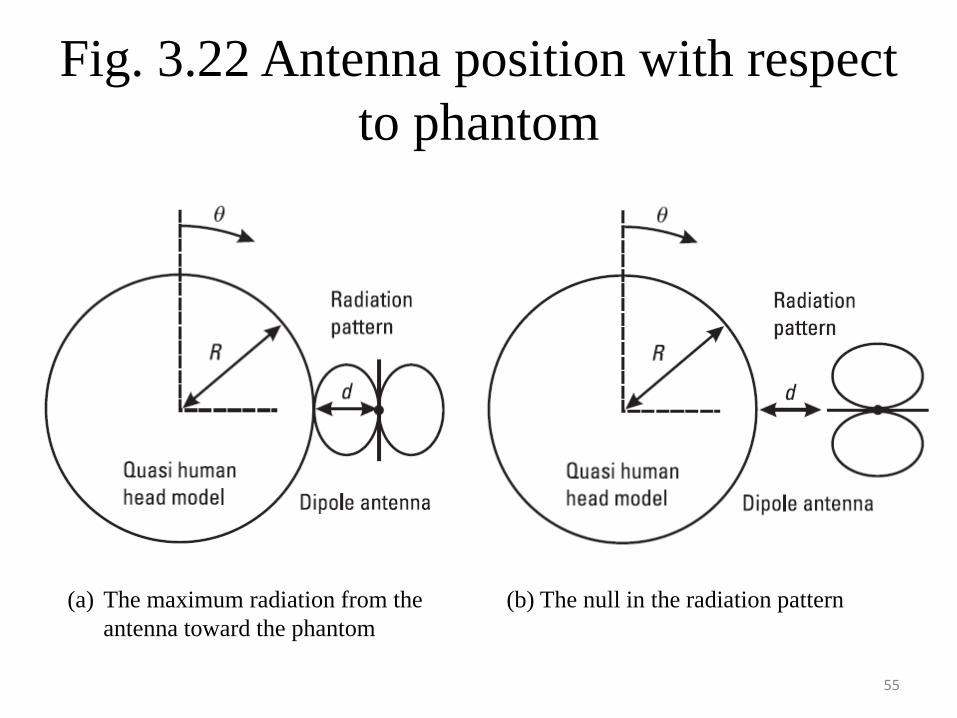
Fig. 3.22 Antenna position with respect to phantom
(a) The maximum radiation from the (b) The null in the radiation patternantenna toward the phantom
55
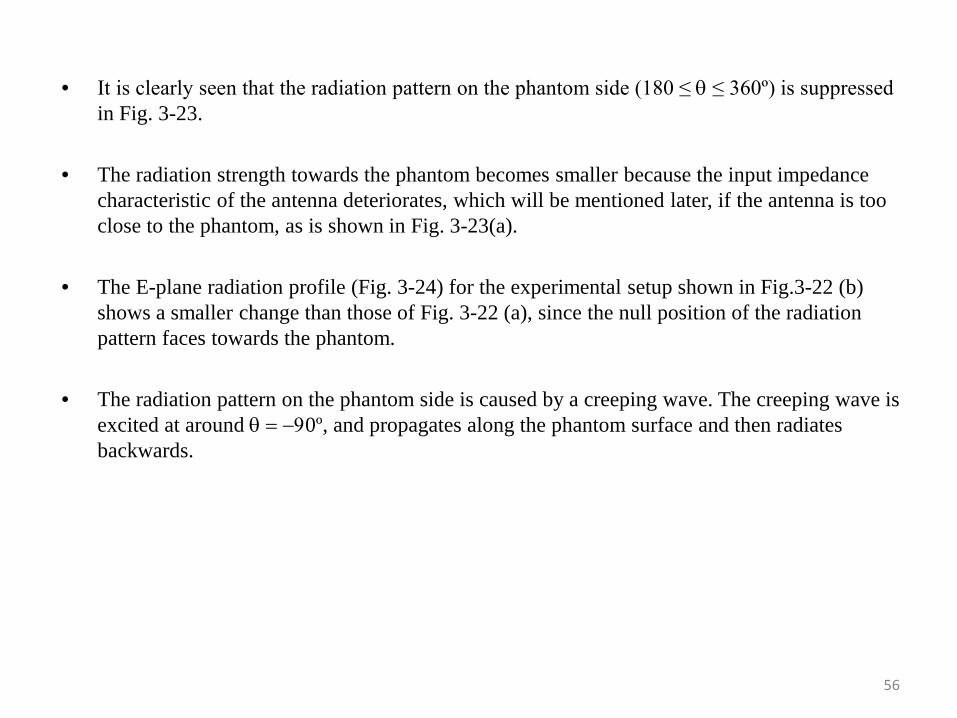
• It is clearly seen that the radiation pattern on the phantom side (180 ≤ θ ≤ 360º) is suppressed in Fig. 3-23.
• The radiation strength towards the phantom becomes smaller because the input impedance characteristic of the antenna deteriorates, which will be mentioned later, if the antenna is too close to the phantom, as is shown in Fig. 3-23(a).
• The E-plane radiation profile (Fig. 3-24) for the experimental setup shown in Fig.3-22 (b) shows a smaller change than those of Fig. 3-22 (a), since the null position of the radiation pattern faces towards the phantom.
• The radiation pattern on the phantom side is caused by a creeping wave. The creeping wave is excited at around θ = −90º, and propagates along the phantom surface and then radiates backwards.
56
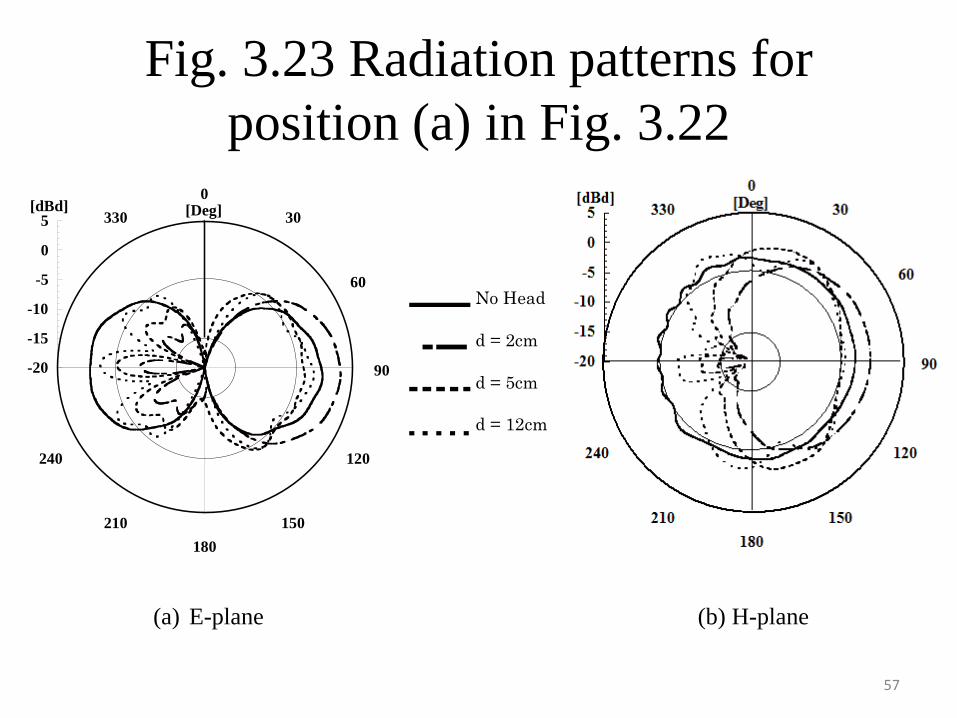
Fig. 3.23 Radiation patterns for position (a) in Fig. 3.22
-20
-15
-10
-5
0
5
030
60
90
120
150180
210
240
330 [Deg][dBd]
No Head
d = 2cm
d = 5cm
d = 12cm
(a) E-plane (b) H-plane
57
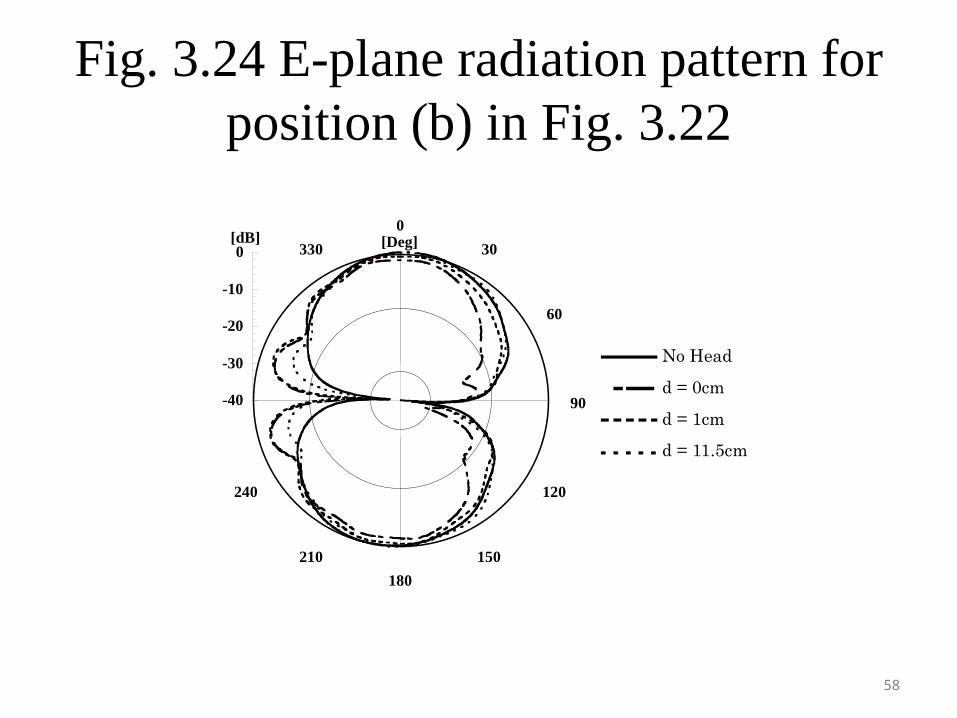
Fig. 3.24 E-plane radiation pattern for position (b) in Fig. 3.22
-40
-30
-20
-10
0
030
60
90
120
150180
210
240
330 [Deg][dB]
No Head
d = 0cm
d = 1cm
d = 11.5cm
58

• The return loss characteristic of the antenna is also shown in Fig. 3-25 for varying distance between the antenna and the phantom and also for both antenna orientations towards the phantom.
• It can be seen that the antenna resonant frequency decreases, and the matching condition at the feed point deteriorates when the antenna is in close proximity to the phantom, except for the curve for d = 1 cm in Fig. 3-22 (a).
• The resonant frequency for d = 0 in Fig. 3-22 (a), i.e. with the antenna feed point attached to the phantom, shifted to the high frequency side. In this case, part of the antenna current flows to the phantom and results in a different tendency with respect to the other parameters.
• If the antenna distance from the phantom is greater than 1 wavelength for the orientation shown in Fig. 3-22(a), then the return loss characteristic is the same as when there is no phantom present.
• For an antenna orientation as shown in Fig. 3-22(b), the influence of the phantom may be neglected if the antenna is at a distance greater than a quarter wavelength.
59

Fig. 3.25 Dependence of input characteristics on the relative position ofantenna and phantom for varying antenna positions
F ree Space 0cm 1cm 2cm 5cm 7cm
2 2.2 2.4 2.6 2.8 3-50
-40
-30
-20
-10
0
frequency (GHz)
S11 (dB) F ree Space 0cm 1cm 2cm
2 2.2 2.4 2.6 2.8 3-50
-40
-30
-20
-10
0
frequency (GHz)
S11 (dB)
(a) Antenna orientation shown in Fig. 3.22(a) (b) Antenna orientation shown in Fig. 3.22(b)
60

3.3.3 Measurement examples using an upper body model dry phantom
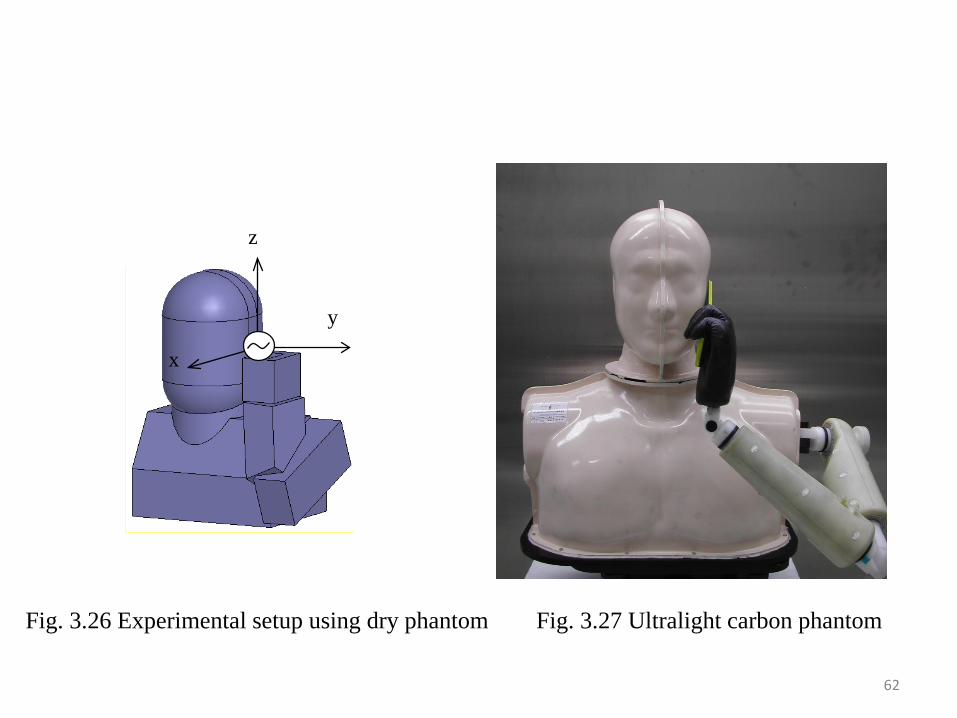
• This section presents a measurement example using a dry phantom shaped like the upper half of the human body.
• Fig. 3-26 shows the experimental setup used to examine the horizontal and vertical antenna orientations.
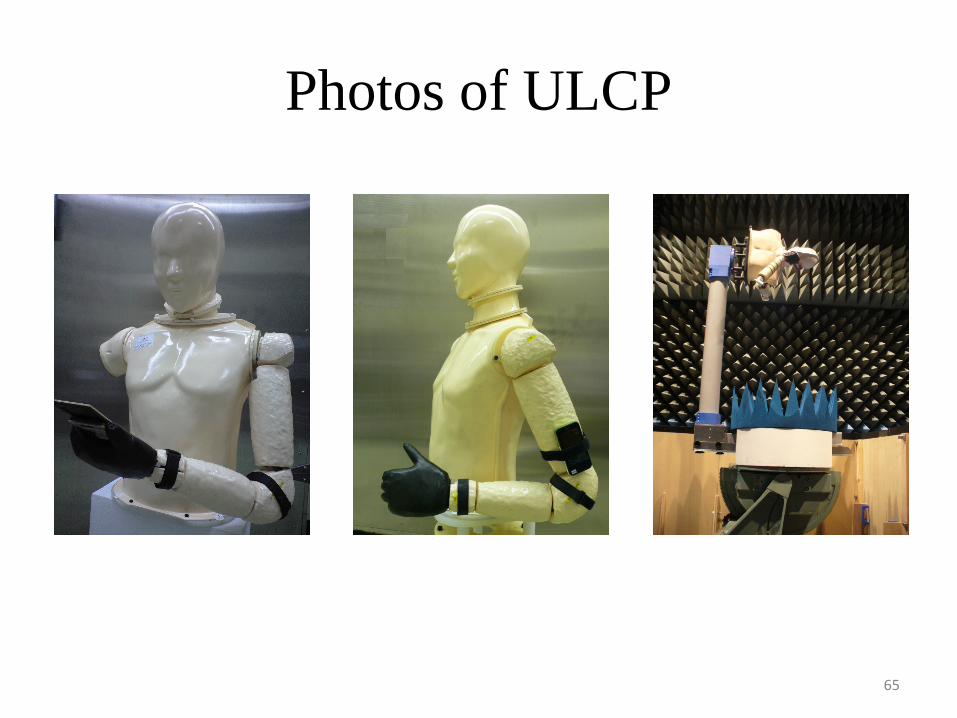
• An electromagnetic-equivalent phantom Ultra-Light Carbon Phantom (ULCP) is shown in Fig. 3-27. The ULCP consists of a head and upper body without hands and arms. The shell of the ULCP is made of a low-dielectric resin. An electromagnetic wave absorbing sheet is put on the inside of the shell and the ULCP itself is empty.
• Although the weight of the head and upper body of the specific anthropomorphic mannequin (SAM) phantoms is greater than 20 kg, that of the ULCP is 3.6 kg. Therefore, the ULCP can be easily installed on a simple 3-D rotary positioner with azimuth and roll axes when using the great circle cut measurement system.
61
x
y
z
Fig. 3.26 Experimental setup using dry phantom Fig. 3.27 Ultralight carbon phantom
62

• As with the previous experiment, the radiation pattern from vertically and horizontally oriented dipole antennas are measured at 940MHz and 1900MHz.
• The radiation patterns from the antenna in the presence of typical human body are also presented. This measurement has almost the same average radiation pattern in Sec. 3-2-1.
• As shown in Fig. 3-28 (a) and (b), the radiation patterns using the phantom well agreed with the patterns in the presence of human body.
• The pattern suppression toward the phantom is agreed well for the vertically oriented antenna and the number of nulls is the same for both orientations at each frequency.
63
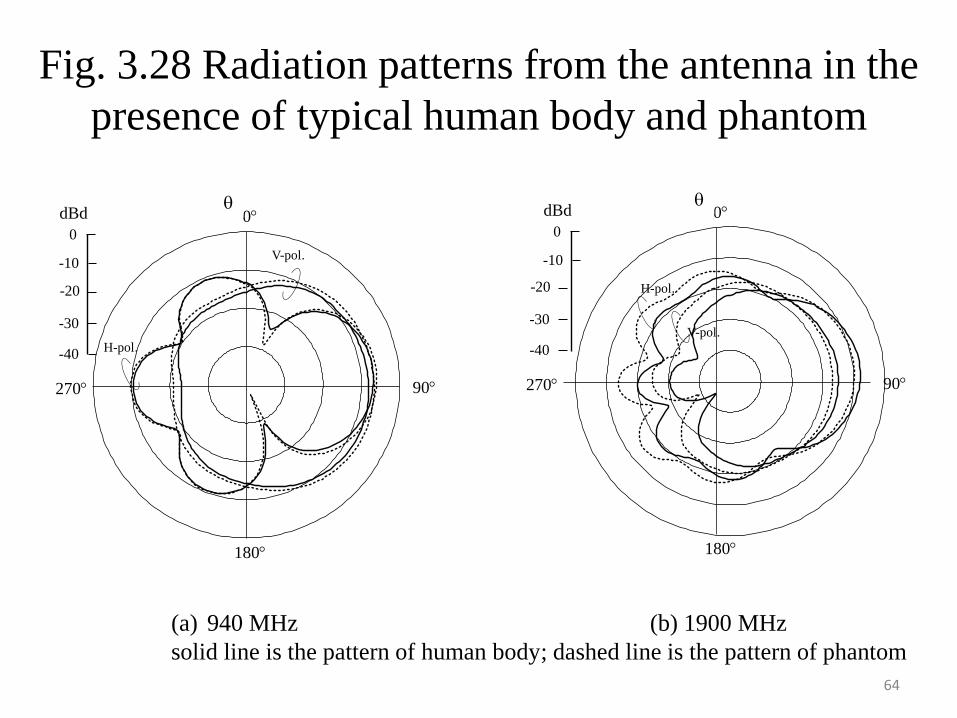
Fig. 3.28 Radiation patterns from the antenna in the presence of typical human body and phantom
0°
90°
180°
270°
dBd θ
0
-10
-20
-30
-40 H-pol.
V-pol.
0°
90°
180°
270°
dBdθ
0
-10
-20
-30
-40
H-pol.
V-pol.
θ θ
(a) 940 MHz (b) 1900 MHzsolid line is the pattern of human body; dashed line is the pattern of phantom
64
Photos of ULCP
65
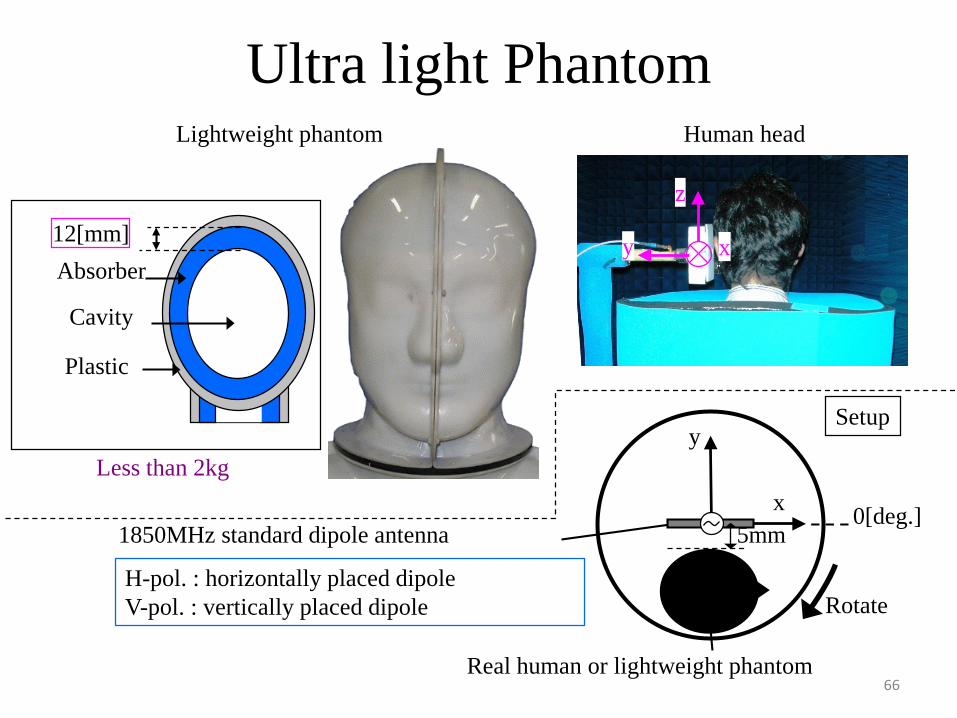
Ultra light Phantom
1850MHz standard dipole antenna 5mm
y
x 0[deg.]
Real human or lightweight phantom
Rotate
Lightweight phantom
H-pol. : horizontally placed dipoleV-pol. : vertically placed dipole
Human head
Absorber12[mm]
Plastic
Cavity
Setup
Less than 2kg
y
z
x
66
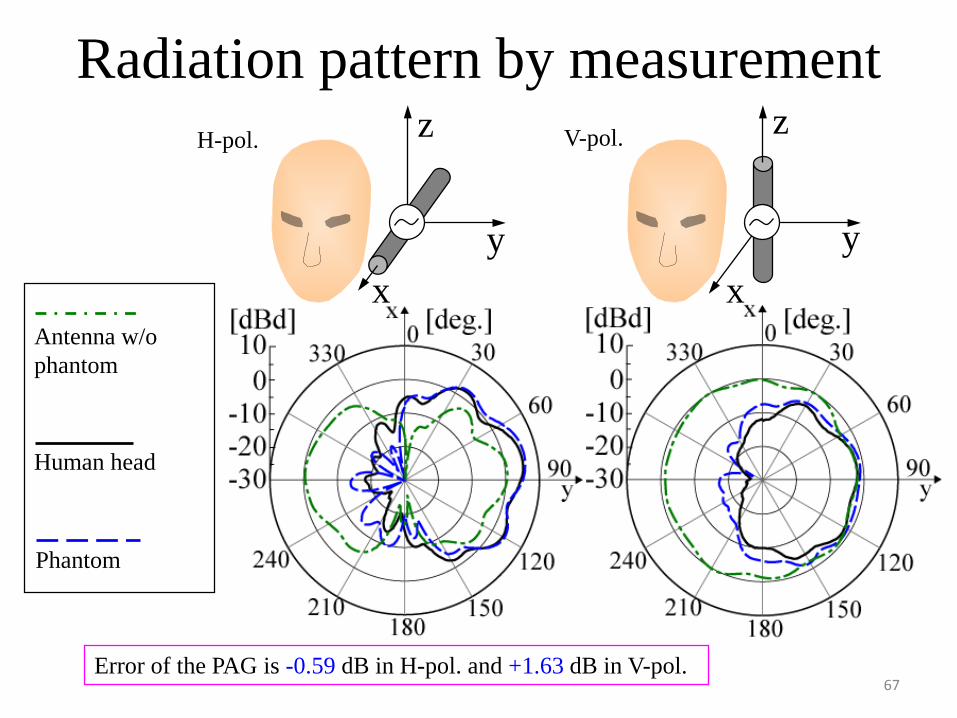
Radiation pattern by measurement
Antenna w/ophantom
Human head
Phantom
xy
z
xy
zH-pol. V-pol.
Error of the PAG is -0.59 dB in H-pol. and +1.63 dB in V-pol. 67

3.3.4 Effect of user hand• The presence of the user hand also changes the radiation performance of mobile terminals,
and the hand has greater influence on antenna radiation performance than the head.
• Therefore, a hand phantom needs to be included in the evaluation of the RF performance of a mobile terminal. In this section, the RF performance of a dipole antenna and a mobile terminal with a ULCP hand is presented in comparison with several human test subjects.
• The VSWR and radiation performance of a dipole antenna with the ULCP hand and 3 human test subjects were measured in an anechoic chamber. The measurement system is shown in Fig. 3-29.
• In order to measure performance influenced by only the hand of the human test subjects, each subject was placed in a cylindrical box made with electromagnetic wave absorbing sheet. The box and ULCP or one of the human test subjects sat on a horizontal-plane azimuth positioner, and a λ/2-dipole antenna was attached to a resin pole on the box.
• Polystyrene foam was attached to the λ/2-dipole antenna as a spacer. To ensure clear evaluations, the human test subject stuck his fingers out of the box and with his fingers together, and positioned his hand to align with the position of the knuckle of the middle finger to that of the center of the antenna. 68

Fig. 3.29 Experimental setup for hand effect measurement
Network analyzer
Azimuth-axispositioner
ElectromagneticWave absorber
Test subject
Antenna
Anechoicchamber
Formed polystyrenespacer (5mm thickness) Hand
69
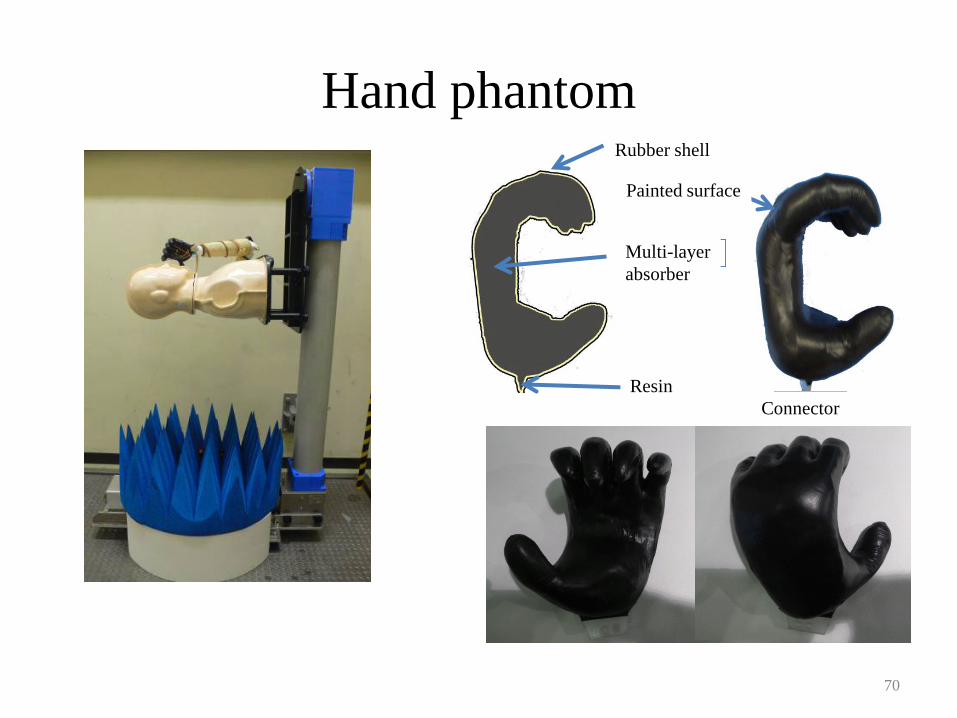
Hand phantom
多層吸収体
表面:塗装
PP樹脂
外殻:ニトリルゴム
接続部
Rubber shell
Painted surface
Multi-layerabsorber
Resin Connector
70
• The VSWR performance of the antenna with the hands in the 800 MHz and 2 GHz bands are shown in Fig. 3-30 (a) and (b), respectively.
• Compared to the VSWR performance without test subjects, the matching frequencies in the 800 MHz and 2 GHz bands with human test subjects are shifted by more than 40 MHz and 80 MHz, respectively.
• The VSWR performances with the ULCP are virtually equivalent to those with human test subjects in these frequency bands.
• Measured radiation patterns in the horizontal plane are shown in Figs 3-31 and 3-32. Each pattern is normalized by the peak of the radiation pattern without a test subject.
• Therefore, it can be concluded that the ULCP achieves almost the same radiation pattern as the human test subjects. All the radiation patterns are reduced in magnitude regardless of the direction because of the VSWR losses induced by the hand.
• The VSWR losses at 840 MHz are more than those at 1970 MHz because the electrical distance between the antenna and hand at 840 MHz is shorter. The radiated power at 1970 MHz are reduced in the direction shaded by the hand because of less diffraction in the higher frequency band.
71
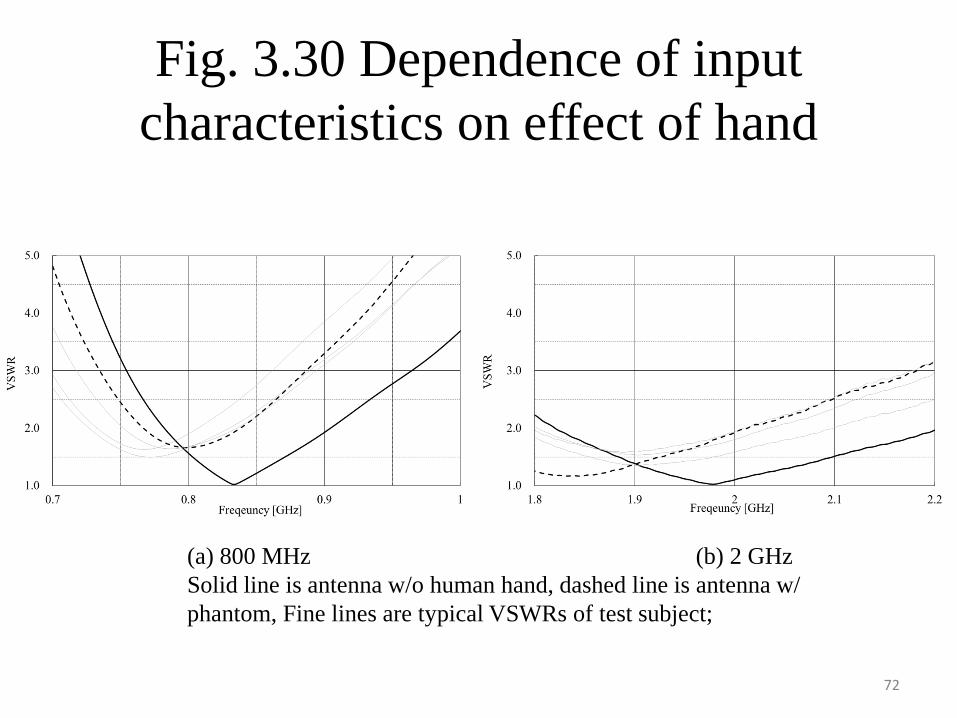
Fig. 3.30 Dependence of input characteristics on effect of hand
(a) 800 MHz (b) 2 GHzSolid line is antenna w/o human hand, dashed line is antenna w/ phantom, Fine lines are typical VSWRs of test subject;
72
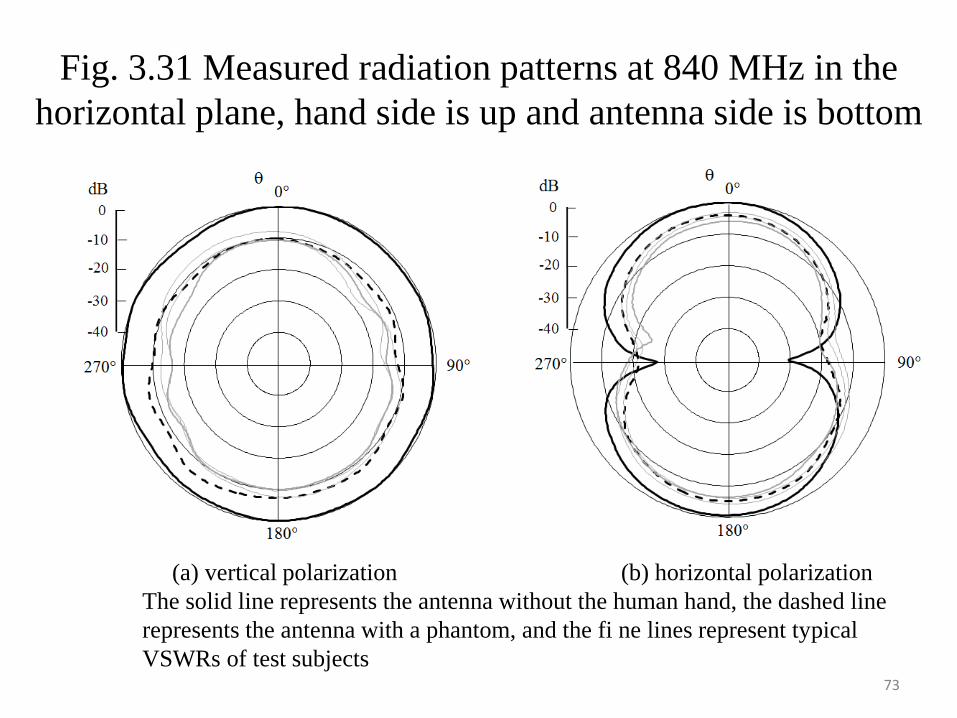
Fig. 3.31 Measured radiation patterns at 840 MHz in the horizontal plane, hand side is up and antenna side is bottom
(a) vertical polarization (b) horizontal polarizationThe solid line represents the antenna without the human hand, the dashed line represents the antenna with a phantom, and the fi ne lines represent typicalVSWRs of test subjects
73
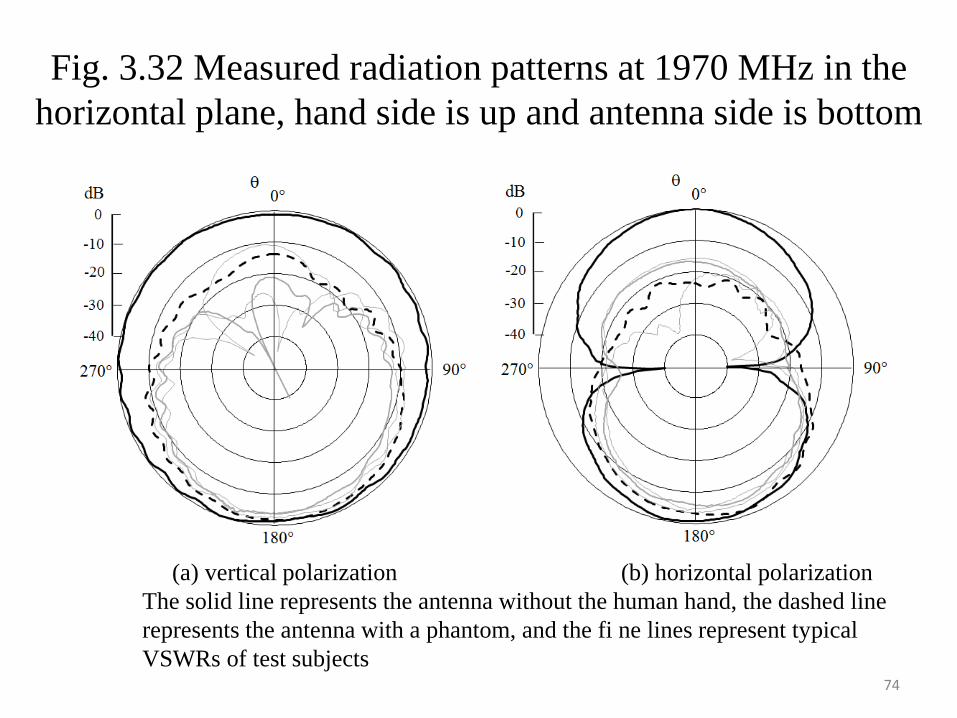
Fig. 3.32 Measured radiation patterns at 1970 MHz in the horizontal plane, hand side is up and antenna side is bottom
(a) vertical polarization (b) horizontal polarizationThe solid line represents the antenna without the human hand, the dashed line represents the antenna with a phantom, and the fi ne lines represent typicalVSWRs of test subjects
74
3.4 SAR Measurement using a phantom• This section presents examples of the regulation standard of Specific Absorption Ratio (SAR)
as a safety standard for electromagnetic wave irradiation of the human body.
• The detailed definition of SAR and its measurement method using a phantom are also presented together with an example of electric field distribution measurement inside a spherical wet phantom.
3.4.1 Standard value of SAR
• The SAR (in W/kg) is used as a safety standard for the irradiation level of electromagnetic waves on living bodies. The SAR is a measure of the heat energy absorpted in unit time by a living body.
• There are three definitions of the SAR: (i) the absorption ratio by short pulse waves, (ii) the whole body average SAR, and (iii) the localized SAR. The latter two are defined as a mean value during a given time.
• When the temperature rise is more than 1° C due to an external heat source, it is assumed that there is some influence on the living body. The corresponding whole body average SAR is then 2 W/kg. 75
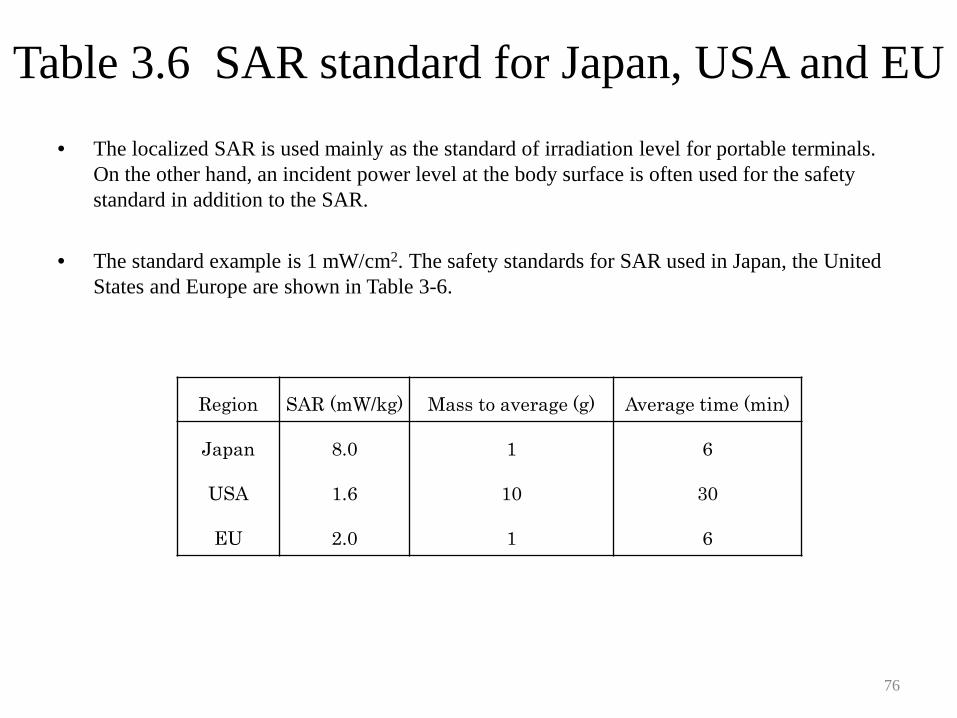
Table 3.6 SAR standard for Japan, USA and EU• The localized SAR is used mainly as the standard of irradiation level for portable terminals.
On the other hand, an incident power level at the body surface is often used for the safety standard in addition to the SAR.
• The standard example is 1 mW/cm2. The safety standards for SAR used in Japan, the United States and Europe are shown in Table 3-6.
Region SAR (mW/kg) Mass to average (g) Average time (min)
Japan
USA
EU
8.0
1.6
2.0
1
10
1
6
30
6
76

3.4.2 Definition of SAR and the Measurement Method
• To evaluate the influence of electromagnetic (EM) wave irradiation on the living body, the SAR is defined as an amount of EM energy absorption in a unit mass as follows:
(3.5)• where the conductivity, the effective electric field amplitude and the material density are
denoted by is σ (S/m), E (V/m), and ρ (kg/m3), respectively.
• Therefore, the SAR at the measurement point is obtained from the internal electric field distribution.
• The phantom should be allowed to warm up for a period of more than 30 minutes in the measurement environment, as shown in the Fig. 3.33, so that the temperature distribution inside the phantom may become uniform.
• After that, the phantom is irradiated by the antenna installed in the neighborhood of the phantom for 10∼100 seconds. A standard dipole antenna is widely used in this type of measurement.
• The irradiation time used is the time required to increase the temperature of the phantom by more than 1 C°.
ρσ 2ESAR =
77
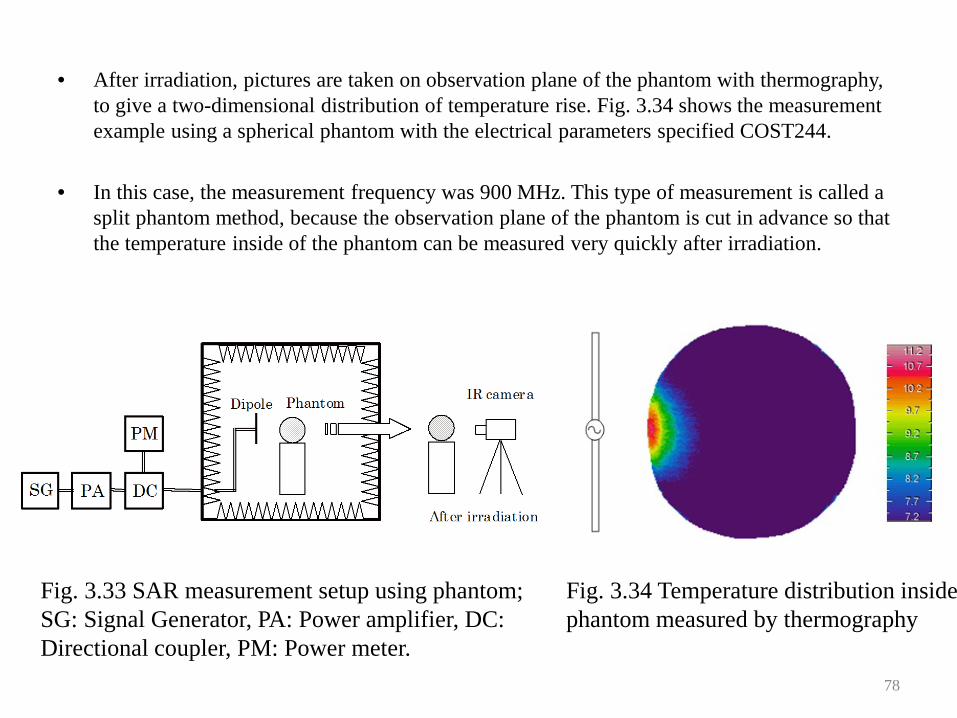
• After irradiation, pictures are taken on observation plane of the phantom with thermography, to give a two-dimensional distribution of temperature rise. Fig. 3.34 shows the measurement example using a spherical phantom with the electrical parameters specified COST244.
• In this case, the measurement frequency was 900 MHz. This type of measurement is called a split phantom method, because the observation plane of the phantom is cut in advance so that the temperature inside of the phantom can be measured very quickly after irradiation.
Fig. 3.33 SAR measurement setup using phantom; SG: Signal Generator, PA: Power amplifier, DC: Directional coupler, PM: Power meter.
Fig. 3.34 Temperature distribution inside phantom measured by thermography
78

3.4.3 SAR measurement method• Because the SAR is based on a temperature rise in unit time, the heat diffusion from the
sample during the measurement time can be neglected.
• The SAR at any time is defined by the specific heat capacity c (J/kg K) and the temperature rise ∆T (C°) at the observation point of the sample during the measurement time ∆t.
(3.5)• For the SAR measurement using this definition, the electromagnetic waves are generated with
the antenna installed either inside or the outside the liquid phantom, and the temperature rise inside the liquid can be measured directly with a thermometer.
• An internationally standardized method for measuring spatial-average SAR is available. In these standard SAR methods, an electric field probe (E-probe) scans in a liquid phantom.
• The internal SAR can be measured accurately because the interior of the phantom can be scanned in three dimensions using an E-probe as shown in Fig. 3-35.
• A tested mobile handset is controlled by a signal from base station simulator during the SAR measurement.
tTcSAR
∆∆
=
79
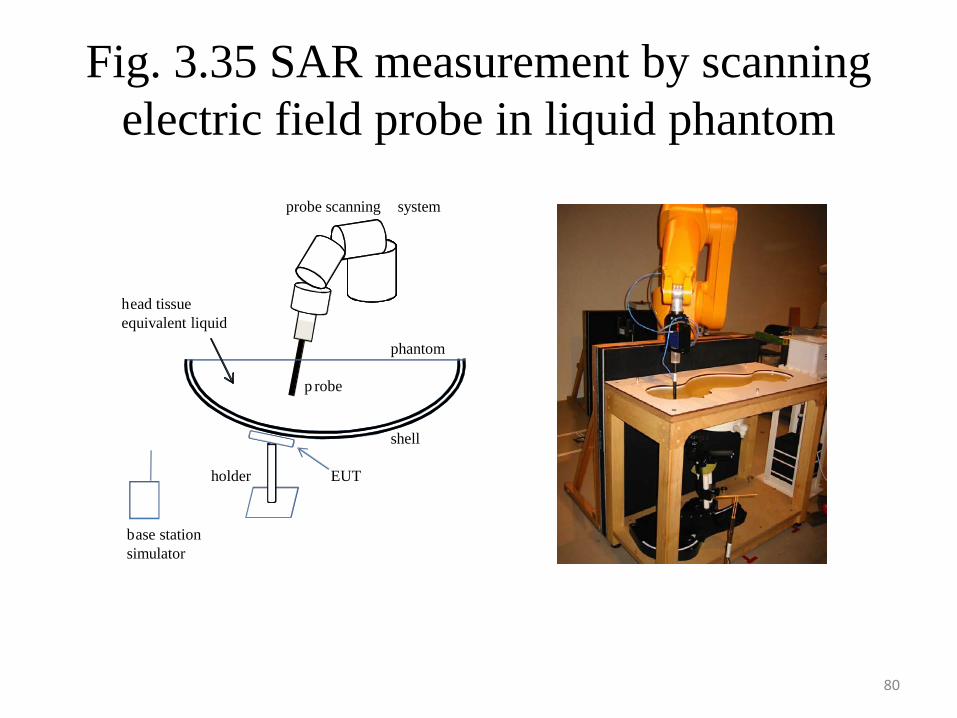
Fig. 3.35 SAR measurement by scanning electric field probe in liquid phantom
p robe
probe scanning system
head tissueequivalent liquid
shell
phantom
holder EUT
base stationsimulator
80
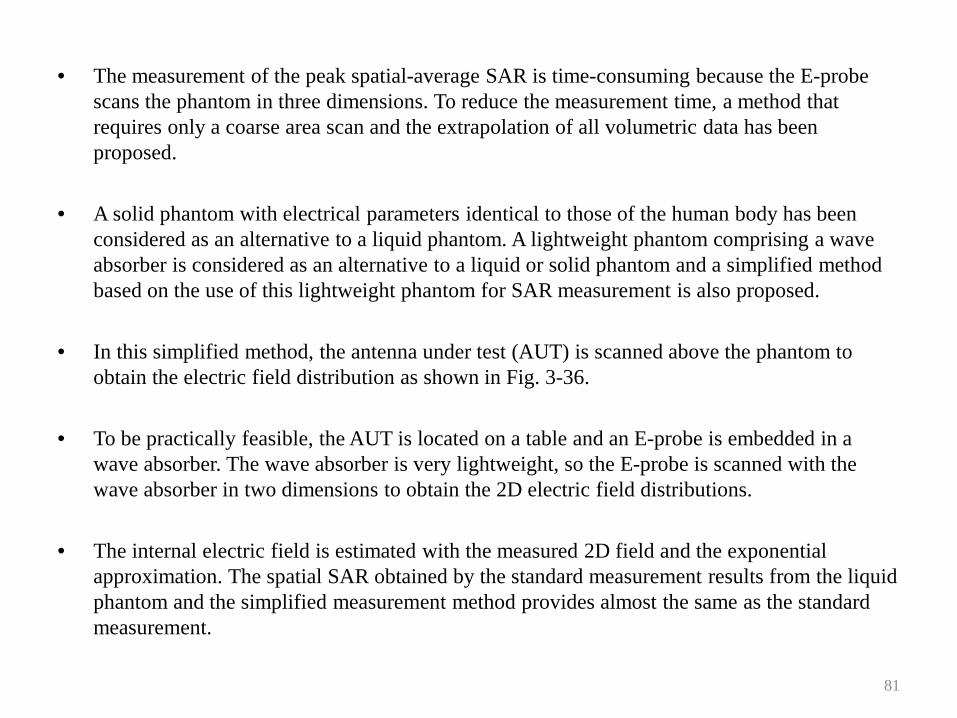
• The measurement of the peak spatial-average SAR is time-consuming because the E-probe scans the phantom in three dimensions. To reduce the measurement time, a method that requires only a coarse area scan and the extrapolation of all volumetric data has been proposed.
• A solid phantom with electrical parameters identical to those of the human body has been considered as an alternative to a liquid phantom. A lightweight phantom comprising a wave absorber is considered as an alternative to a liquid or solid phantom and a simplified method based on the use of this lightweight phantom for SAR measurement is also proposed.
• In this simplified method, the antenna under test (AUT) is scanned above the phantom to obtain the electric field distribution as shown in Fig. 3-36.
• To be practically feasible, the AUT is located on a table and an E-probe is embedded in a wave absorber. The wave absorber is very lightweight, so the E-probe is scanned with the wave absorber in two dimensions to obtain the 2D electric field distributions.
• The internal electric field is estimated with the measured 2D field and the exponential approximation. The spatial SAR obtained by the standard measurement results from the liquid phantom and the simplified measurement method provides almost the same as the standard measurement.
81
E-probe
Planar solid phantom
Antenna
mounting fixture
2-D scanner
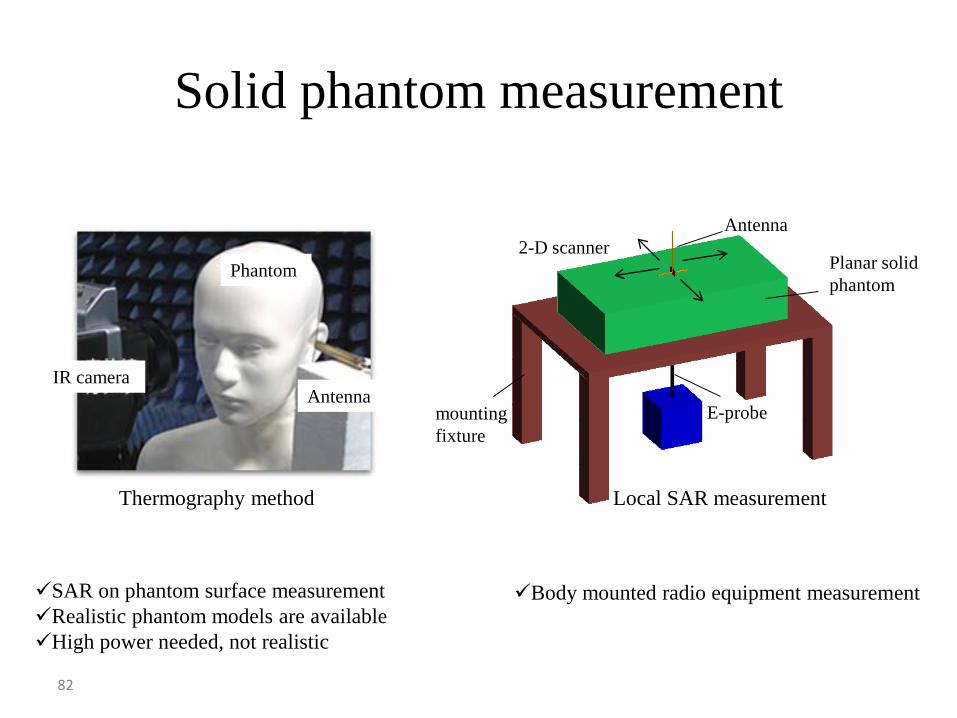
SAR on phantom surface measurementRealistic phantom models are available High power needed, not realistic
Body mounted radio equipment measurement
Thermography method Local SAR measurement
Phantom
Antenna IR camera
Solid phantom measurement
82
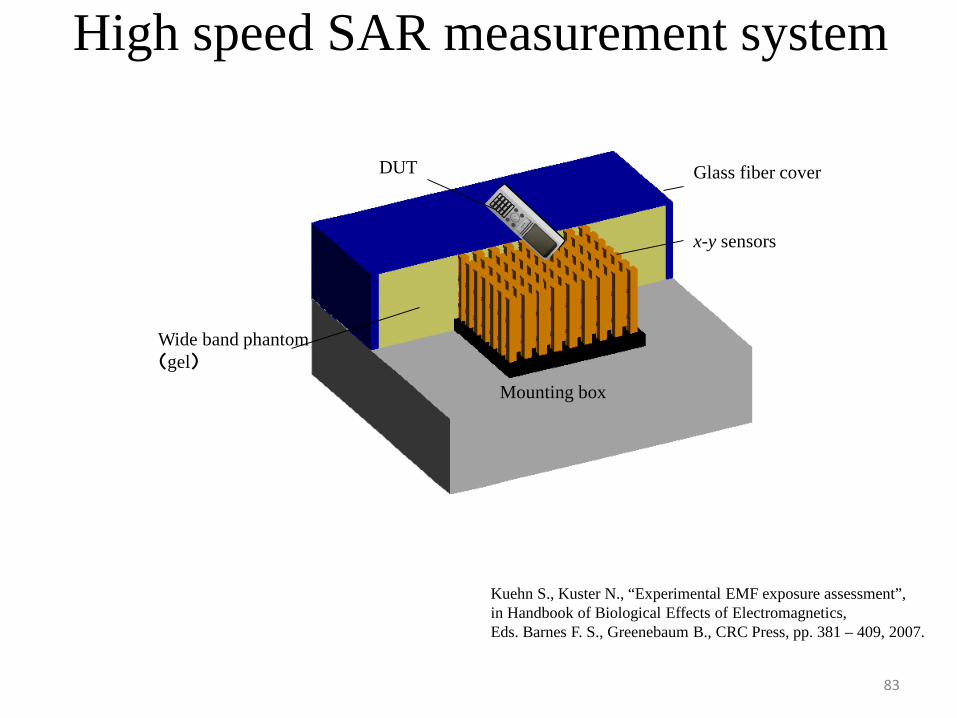
High speed SAR measurement system
Glass fiber cover
Wide band phantom(gel)
Mounting box
x-y sensors
DUT
Kuehn S., Kuster N., “Experimental EMF exposure assessment”, in Handbook of Biological Effects of Electromagnetics, Eds. Barnes F. S., Greenebaum B., CRC Press, pp. 381 – 409, 2007.
83

Fig. 3.36 Simplified SAR measurement system
84

Procedure
(1) E-field inside lightweight phantom (ex. z = 5 mm)
(2) Surface E-field estimation (3) E-field liquid phantom estimation(ex. z = 5 mm)
[V/m] Antenna (fixed)
Wave absorber E-probe
Scan 2D Scanner
Offset~
Liquid phantom Lightweight phantom(MS-L26)
Simulated electric field distribution on phantom surface
10 g local SAR Liquid phantom 9.78
Lightweight phantom 10.67
[V/m]
225 mm
100 mm
Liquid phantom 19.95
Lightweight phanto 20.58
Inverted-F shaped antenna Dipole antenna
85

References1. K. Hirasawa and M. Haneishi, “Analysis, Design, and Measurement of Small and Low-Profile Antennas,” Chapter 1, Artech House, 1992.2. S. Sekine and T. Maeda, “The Radiation Pattern Characteristics of a λ/4-Monopole Antenna Mounted on a Conducting Body With a Notch,”
Proc. IEEE AP/S Symp. pp. 65-69, 1992.3. Fukasawa, T., Shimomura, K., Ohtuska, M., “Accurate Measurement Method for Characteristics of an Antenna on a Portable Telephone,” Trans.
of the IEICE, Japan, Vol. J86-B, no. 9, pp. 1895-1905, Sept. 2003 (in Japanese).4. ANSI‘665. IEEE: “American National Standard Safety Levels with respect to Human Exposure to Radio Frequency Electromagnetic Fields, 3 kHz to 300
GHz,” IEEE C.95.1-1991, 1992.6. Hiroyuki Arai, Nobuhiro Igi, and Hirokazu Hanaoka, “Antenna-Gain Measurement of Handheld Terminals at 900 MHz,” IEEE Trans. Veh.
Technol., vol. 46, no.3. pp. 537-543, Aug. 1997.7. d’Inzeo, “Proposal for numerical canonical models in mobile communications,” Proc., COST 244 Meeting on Reference Models for
Bioelectromagnetic Test of Mobile Communication Systems, pp. 1-7, Non. 1994.8. A.H. Hizal and Y.K. Baykal, “Heat Potential Distribution in an Inhomogeneous Spherical Method of a Cranial Structure Exposed to Microwave
Due to Loop or dipole Antenna,” IEEE Trans. Microwave Theory and Tech., MTT-26, pp. 607-612, 1978.9. Y. Amemiya and S. Uebayashi, “The Distribution of Absorbed Power Inside a Sphere Simulating Humna Head in the Near Field of a λ/2
Dipole Antenna,” Trans. IECE Japan, J66-B, 9, pp.1115-1122, 1982.10. W.T. Jones and R.J. Spiegel, “Rresonace Absorption of Microwave by the Human Skull,” IEEE Tran. Bio-med. Eng., BME-22, 6, pp.457-463,
1975.11. M. Sullivan, O. P. Gandhi, and A. Taflove, “Use of the finite-difference time-doain method for calculating EM absorption in man models,”
IEEE Trans. Biomed. Eng., vol. 35, no. 3, pp. 179-185, 1988.12. Nagaoka T., Watanabe S., Sakurai K., Kunieda E., Watanabe S., Taki M., and Yamanaka Y., “Development of realistic high-resolution whole-
body voxel models of Japanese adult male and female of average height and weight, and application of models to radio-frequency electromagnetic-field dosimetry,” Physics in Medicine and Biology, vol.49, pp.1-15, 2004.
13. Nagaoka T., Togashi T., Saito K., Takahashi M., Ito K., and Watanabe S., “An anatomically realistic whole-body pregnant-woman model and specific absorption rates for pregnant-woman exposure to electromagnetic plane waves from 10 MHz to 2 GHz,” Physics in Medicine and Biology, vol.52, pp.6731-6745, 2007.
14. V. Hombach, K. Meier, M. Burkhardt and E. Kuhn, “The Dependence of EM Energy Absorption Upon Human Head Modeling at 900 MHz,” IEEE Trans. Microwave Theory and Tech., Vol. MTT-44, No. 10, 1996, pp. 1865-1873.
15. http://www.nlm.nih.gov/research/visible/visible_human.html16. http://www.fcc.gov/fcc-bin/dielec.sh17. Cook, H.F. “The Dielectric Behavior of Some Types of Human Tissues at Microwave Frequencies,” British Journal of Applied Physics, 2, pp.
292-300, 1951.18. Itoh K, “Human Models for the Research of Antennas and Propagation,” Journal of the IEICE, vol. J 82, no. 9, 1999, pp. 956-966.19. Kobayashi T., et. al, “Dry Phantom Composed of Ceramics and Its Application to SAR Estimation,” IEEE Trans. Microwave Theory and Tech.,
Vol. MTT-41, No. 1, 1993, pp. 136-140.20. Chan K.W. “Microwave phantoms,” Proc. COST 244 Meeting on Reference Models for Bio-electromagnetic Test of Mobile Communication
System, Nov. 1994, pp. 27-31.86
21. Takimoto, T. et. al, “Evaluation on biological tissue equivalent agar-based solid phantoms up to 10 GHz - aiming at measurement of characteristics of antenna for UWB communications -,” Proceedings of the 2005 International Symposium on Antennas and Propagation (Seoul, Korea), vol. 2, pp. 483-486, Aug. 2005.
22. Itoh K., at. Al., “Development and the Characteristics of a Biological Tissue-euivalent Phantom for Microwaves,” Trans. of the IEICE, Japan, B-II, vol. J81-B-II, no. 12, 1998, pp. 1126-1135 (in Japanese).
23. Nakano M., et. al., “Fundamental Investigation of Radiation Pattern of the Hand-hel Terminal Antenna with Human Body Effect,” IEICE Technical Report, AP2008-100, pp. 33-38, Oct., 2008 (in Japanese).
24. Yamaguchi, H. at. al., “Lightweight Tissue-equivalent Phantom for Evaluation of Antenna Performances,” Proc. of Asia-Pacific Microwave Conference, G2-3, Hong Kong, Dec. 2008.
25. Amano, Y., et. al., “Ultra Light Carbon Phantom in RF Performance Test System for Mobile Terminals", Prof. of International Symposium on Antennas and Propagation (ISAP 2009), pp.1131-1134, Bangkok, Oct. 2009.
26. Amano, Y., et. al., "Ultra Light Carbon Phantom Hand for RF Performance Evaluation of Mobile Terminals", Proc. of Asia-Pacific Microwave Conference, TU4H-2 (#1485) , Singapore, Dec. 2009.
27. C95.1b-2004 - IEEE Standard for Safety Levels With Respect to Human Exposure to Radio Frequency Electromagnetic Fields, 3 kHz to 300 GHz Amendment 2: Specific Absorption Rate (SAR) Limits for the Pinna.
28. Sauders R.D., et. al, “Biological Effects of Exposure to Non-ionizing Electromagnetic Fields and Radiation, III. Radio frequency and Microwave Radiation,” Nat. Radiol. Prot. Board, Rep. NRPB-R240, 1991.
29. Guy W., Chou C., and Neuhaus B., “Average SAR and SAR distributions in man exposed to 450-MHz radio frequency radiation,” IEEE Trans. Microwave Theory and Tech., vol. MTT-32, no. 8, pp. 752-762, 1984.
30. Kaouk Z., et. al, “A Finite Element Model of a Microwave Catheter for Cadiac Ablation,” IEEE Trans. Microwave Theory and Tech., Vol. MTT-44, No. 10, 1996, pp. 1848-1854.
31. Human exposure to radio frequency fields from hand-held and body-mounted wireless communication devices -- Human models, instrumentation, and procedures -- Part 1: Procedure to determine the specific absorption rate (SAR) for hand-held devices used in close proximity to the ear (frequency range of 30 MHz to 3 GHz), IEC 62209-1, First Edition, 2005.
32. Human exposure to radio frequency fields from hand-held and body-mounted wireless communication devices -- Human models, instrumentation, and procedures -- Part 2: Procedure to determine the specific absorption rate (SAR) for wireless communication devices used in close proximity to the human body (frequency range of 30 MHz to 6 GHz), IEC 62209-2, First Edition, 2010.
33. Kanda, M.Y., et. al. “Faster determination of mass-averaged SAR from 2-D area scans,” IEEE Trans. Microw. Theory Tech., vol.52, no.8, pp.2013-2020, Sept. 2004.
34. Iyama, T., et. al., “Mass-averaged SAR measurement in the SAR estimation using flat-plane solid phantom,” in IEEE AP-S Int. Symp., Monterey, June 2004, pp. 3597-3600.
35. Watanabe, T., Michishita, N. and Yamada, Y. “Simplified method for measuring SAR by using phantom composed of wave absorber,” in Proc. 40th European Microwave Conf., Paris, France, Sept. 2010, pp. 216-219.
36. Watanabe, T. , et. al., “Estimation of peak spatial-average SAR of inverted F-antenna on metal plate using lightweight phantom composed of wave absorber,” in 5th European Conf. on Antennas and Propagation, Rome, Italy, April 2011, pp.74-78.
87