3 final air pollution and odd-even for sc
TRANSCRIPT
1
1
Status of air pollution during winter of 2015-16 and the impact of odd-even car rationing scheme on air quality Environment Pollution (Prevention and Control) Authority January 21, 2016 1. Overall pollution level this winter is higher than last winter. This demands emergency action This winter has witnessed extremely high level of pollution. Typical winter conditions -- cold temperature, lower mixing height of air, calm and no-wind conditions trap air and pollution. As a result, pollution builds up very quickly and peaks. This is why winter months require tougher emergency action to reduce pollution. Weather is an important constraint in pollution management. The winter months of November and December 2015 show higher number of days in severe category-four times the safe standard – which is the worst category according to the National Air Quality Index. November 2015 had 73% cent of days in severe category against 53% in November, 2014. December 2015 has 67% of days in severe category as against 65% in December 2014. December 2014 at least had 3% of days in good and satisfactory category but December 2015 has none. There has not been a single good air quality day this winter. On several consecutive days, the PM2.5 levels have remained in the worst category according to the national air quality index. The odd and even programme has been implemented as an emergency action to arrest the high emergency peak when the overall pollution levels have gone 5 to 6 times higher than the standards. This is needed to protect public health in a city where every third child has impaired lungs. This is also not the only action that is being taken in the city to arrest runaway air pollution. The Supreme Court has taken firm steps to check heavy commercial vehicles from entering Delhi; it has issued directions on enforcement of construction and road dust as well as garbage burning. The Delhi government is also bringing action against the Badarpur Thermal Power Plant. The odd-even scheme is designed for immediate relief as it takes off the roads almost half the private cars, which contribute to pollution from their tailpipe and pollution because of congestion.

2. The othe prev This winsevere clowest. Tdip and much lowrapid buprogramThis vali Graph 1
Source:
odd-even svious high
nter out of acategory) thThis showswestern diswer. The ea
uild up compmme. This pidates the i
1: Drop in i
CSE analy
scheme ha smog epis
all the severhe peak pols that despitsturbance, arlier smogpared to the
proves redumportance
intensity o
ysis of DPC
s resulted sodes this
re smog epllution durinte the hostithe peak po
g episodes he rise that hced traffic vof emerge
of smog ep
CC real time
in the lows winter
pisodes so fng odd and ile weather ollution durhave seen happened dvolume hasncy action.
pisodes du
e pollution m
west polluti
far (with seveven progrconditions
ring odd andmuch highe
during the fs arrested t
ring odd-e
monitoring d
on peak co
veral conseramme has- no wind, d even scher peaks anfirst week ohe peaking
even fortnig
data
ompared to
ecutive days been the temperatureme has bend much mf odd and e
g of pollution
ght
2
2
o
ys in
re een ore
even n.
Graph 22: in weaverage
3. Durinfaster d It is alsosome dait is notaincreaseeven schscheme data are
2: Faster ceek 2 of ode PM 2.5 le
ng odd-evedrop in poll
o clearly eviays during oable that dued when wiheme on thsucceeded
e from the D
learing of sd-even, wi
evels were
en programlution
ident from todd and ev
uring days bnd speed w
he pollution d in arrestinDelhi Polluti
smog episind speed still lower
mme day-ho
the air polluven schemebefore the pwas low. Th
levels. Eveng the upwaion Control
sodes durinwas lower
ours even
ution data the, pollution programmehis brings ouen when wiard trend. Bmonitoring
ng odd-ever than last w
with lower
hat despite has fallen d was starteut the clearnd was not
Both the reag stations.
en programweek of De
r wind spe
the lower wduring thoseed pollution r impact of tt there to blal time pollu
mme in weecember, b
eed has sho
wind speede hours. In levels had the odd andow it away
ution and w
3
3
eek but
own
d in fact,
d the
wind

Graph 3pollutio
Source: 4. SatelNCR duless tha Scientiststudied scatterincorrespoa very hhave fouBut in arsaw 35%
3: Odd andon levels de
CSE analy
lite imageruring odd-ean neighbo
ts of Deparaerosol optng light andonds to an azy conditi
und that thisreas border% worsenin
d even dayseclined as
ysis of DPC
ry shows ‘even fortniouring regi
rtment of Putical depth o
d prevent diextremely con. An aves improvedring the capg.
s in Delhi sopposed t
CC real time
lighteningght and stons in the
ublic Healthor how pollrect sunlighclean atmosrage aeros in Delhi afpital and the
show that to pre-sche
e pollution d
’ of pollutitudies show odd-even
h Sciences,ution in theht from reacsphere, andol optical d
fter the odde surroundi
even on deme days
data
on over Dew that Delhfortnight
, Universitye air block sching the gd a value oepth for the-even scheing NCR th
ays withou
elhi as comhi pollutio
y of Miami, sunlight by around. A va
of 0.4 woulde U.S. is 0.eme was imere was no
ut wind
mpared to n level was
US have absorbing oalue of 0.01d correspon1 to 0.15. T
mplementedo effect, and
4
4
s
or by 1 nd to They d. d

5
5
Figure 1: Comparison in pre-and-during odd-even road rationing programme in Delhi NCR on AOD (Aerosol Optical Depth) levels AOD: Pre Odd-Even Trial AOD: During Odd-Even Trial
December 18 to 31, 2015 January 1 to 15, 2016 Legends: Good Bad 0 to 0.3 0.3 to 0.45 0.45 to 0.60 0.60 to 0.75 0.75 to 0.90 > 0.90
Source: Department of Public Health Sciences, University of Miami, US Another assessment by a team of researchers from University of Chicago and University of Harvard also finds that the odd-even programme has helped to improve air quality in Delhi1 -- by reducing particulate air pollution concentrations by 10-13 per cent in the period. This study found the following:
a. Starting January 1, while absolute pollution levels increased both inside and outside Delhi (for atmospheric reasons, as noted by other commentators), the increase in fine particulates in Delhi was significantly less than in the surrounding region. Overall it was a 10-13 relative decline in Delhi.
b. During the 8 am to 8 pm period – when the scheme was implemented – the impact is even more visible. Around 8 am the gap between Delhi’s pollution and its neighbouring regions begins to form and steadily increases until mid-afternoon. Then as temperatures begin to fall and air pollutants are less likely to disperse, this gap starts to close. When focusing on just the hours that the odd-even policy was in effect, the estimate of the authors is that particulate pollution declined by 18 per cent because of the pilot.
1 Michael Greenstone et al, Yes Delhi it worked, in Indian Express January 19, 2016
Boundary of NCT Delhi
Boundary of NCT Delhi
6
6
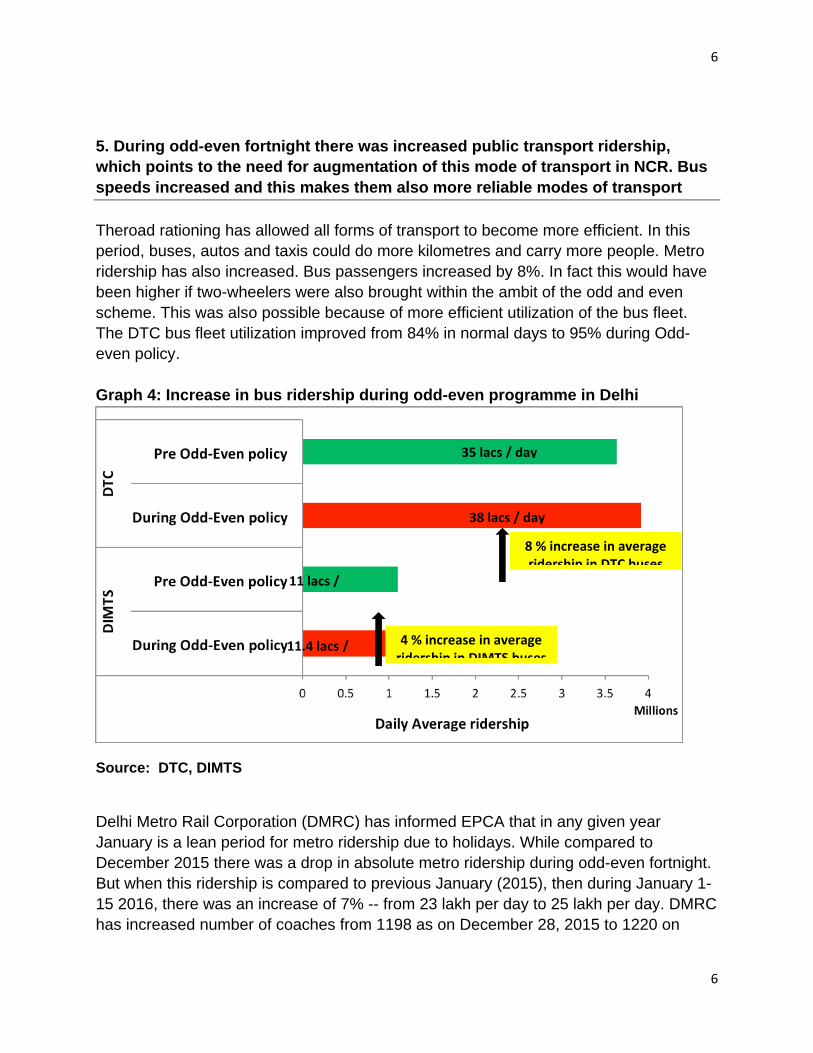
5. During odd-even fortnight there was increased public transport ridership, which points to the need for augmentation of this mode of transport in NCR. Bus speeds increased and this makes them also more reliable modes of transport Theroad rationing has allowed all forms of transport to become more efficient. In this period, buses, autos and taxis could do more kilometres and carry more people. Metro ridership has also increased. Bus passengers increased by 8%. In fact this would have been higher if two-wheelers were also brought within the ambit of the odd and even scheme. This was also possible because of more efficient utilization of the bus fleet. The DTC bus fleet utilization improved from 84% in normal days to 95% during Odd-even policy. Graph 4: Increase in bus ridership during odd-even programme in Delhi
Source: DTC, DIMTS
Delhi Metro Rail Corporation (DMRC) has informed EPCA that in any given year January is a lean period for metro ridership due to holidays. While compared to December 2015 there was a drop in absolute metro ridership during odd-even fortnight. But when this ridership is compared to previous January (2015), then during January 1-15 2016, there was an increase of 7% -- from 23 lakh per day to 25 lakh per day. DMRC has increased number of coaches from 1198 as on December 28, 2015 to 1220 on
8 % increase in average ridership in DTC buses
4 % increase in average ridership in DIMTS buses
35 lacs / day
38 lacs / day
11 lacs /
11.4 lacs /

7
7
January 1 2016. DMRC also increased number of trips and rescheduled the frequency of trains in peak and off-peak hours. Graph 5: Comparison of average ridership of metro for January 2015 and January 2016 (data till January 13, 2016)
Source: Delhi Metro Rail Corporation 6. During odd-even fortnight there was a dip in sale of petrol and diesel, which in turn will result in lower pollution Data from Petrol Dealers Association shows that the overall petrol and diesel sales have dropped by 4.7% and 7.8% from December 2015 to January 2016. 7. During odd-even fortnight, studies show dramatic impact in terms of reduced congestion. There is a clear correlation between congestion and pollution The data available from the ‘Traffic Survey and Travel Attributes Study’ conducted by the School of Planning and Architecture’ Department of Transport Planning during odd-even scheme show substantial reduction in traffic volume and congestion. The survey was carried out in 11 locations along different major arterial roads of Delhi like Gurgaon Expressway, Mathura Road, NH-24, NH-1, Bahadurgarh Road and Ring Road. It found that the average journey speed was as high as 50 kmph during odd and even period as against 20-25 kmph speed on regular days. This is due to reduction in share of cars on the road during that period. In West and North West Delhi (Punjabi Bagh, Peeragarhi, Rajaouri Garden, Janakpuri, etc)the improvement in speed was not so considerable. The study observed that this
8
8
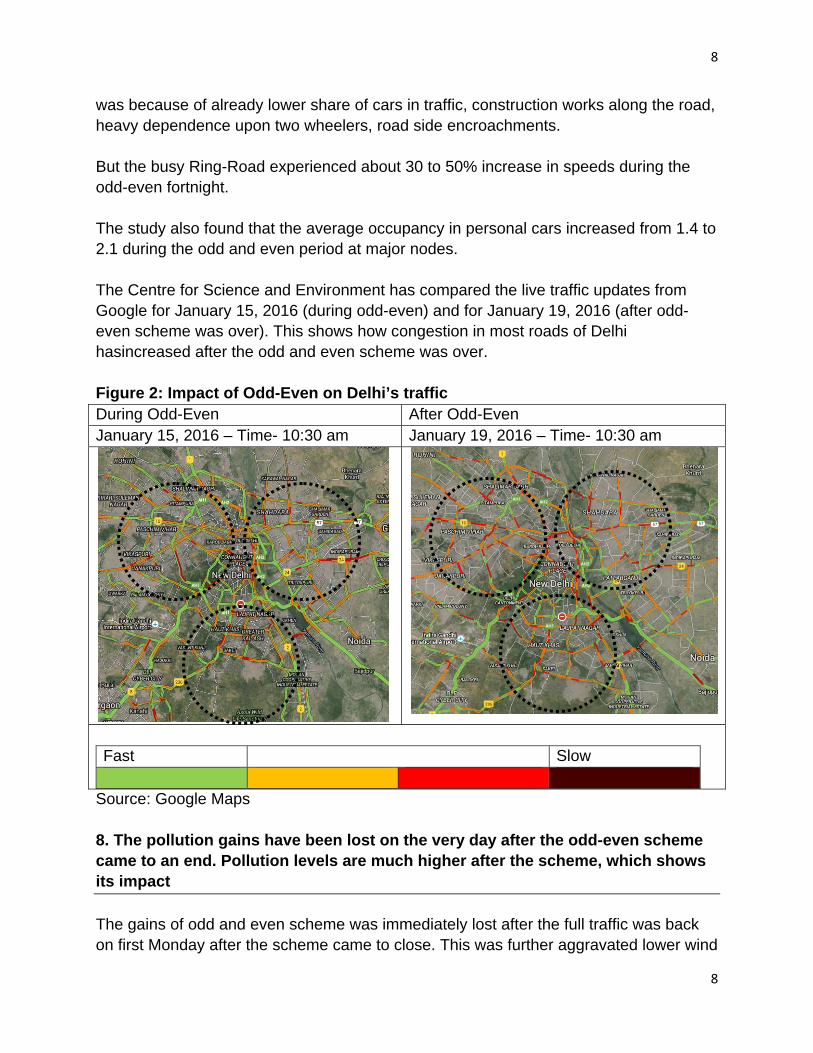
was because of already lower share of cars in traffic, construction works along the road, heavy dependence upon two wheelers, road side encroachments. But the busy Ring-Road experienced about 30 to 50% increase in speeds during the odd-even fortnight. The study also found that the average occupancy in personal cars increased from 1.4 to 2.1 during the odd and even period at major nodes. The Centre for Science and Environment has compared the live traffic updates from Google for January 15, 2016 (during odd-even) and for January 19, 2016 (after odd- even scheme was over). This shows how congestion in most roads of Delhi hasincreased after the odd and even scheme was over. Figure 2: Impact of Odd-Even on Delhi’s traffic During Odd-Even After Odd-Even January 15, 2016 – Time- 10:30 am January 19, 2016 – Time- 10:30 am
Fast Slow
Source: Google Maps 8. The pollution gains have been lost on the very day after the odd-even scheme came to an end. Pollution levels are much higher after the scheme, which shows its impact The gains of odd and even scheme was immediately lost after the full traffic was back on first Monday after the scheme came to close. This was further aggravated lower wind

speed. Oof Mond In absolJanuarypollutionwere on 9. Polludown d Both parodd andcome fro This indroad sidimpact opopulatiresearchlevel on times higto the re Graph 6schemeParticul
Source:
On Mondayday and onc
ute numbery 18 was ben spike on J the roads.
tion load furing odd
rticulate and even progom reductio
icates redue. It is estim
of vehicularon live withhers of Univthe road agher than t
eduction in e
6: Particulae late Load
Centre for
y, January 1ce again ros
rs PM2.5 leetter than JaJanuary 1 w
from cars aand even
d nitrogen ramme – b
on in diesel
uced exposumated by thr pollution ishin that zonversity of Cnd close tohe ambientexposure to
ate and nit
Science an
18, 2016, thse to sever
evels rose banuary 1 whwas 44% wa
are lower; programm
oxide load by as much
cars as is
ure to toxiche US bases upto 500 e. This has
California, B road side at concentrao toxic fume
rogen oxid
nd Environm
he PM2.5 lere category
by 25%. It mhen odd anas lower th
per capita me
from the caas 40%. Halso eviden
pollution fred Health Emeters from
s serious puBerkeley havare at leasttion. This pes.
de load red
Nitrog
ment
evels shot u.
may be notend even schan the Janu
emissions
ars has redigher sharent from the
rom vehicleffect Institu
m road sideublic health ve shown tt 1.5 times programme
duction fro
gen oxide
up by 57%
ed the windheme was iuary 18 wh
s of car us
uced subste of pollutiosale of dies
es on roadsute that the e and 55% o
implicationhat in Delhhigher and has therefo
om cars du
Load
within 24 h
d speed on ntroduced. en all vehic
sers is also
tantially durn benefits hsel in the ci
s and close maximum of Delhi’s ns. Studiesi the pollutiopeaks 15
ore contribu
uring odd-e
9
9
ours
But cles
o
ring have ity.
to
s by on
uted
even
10
10
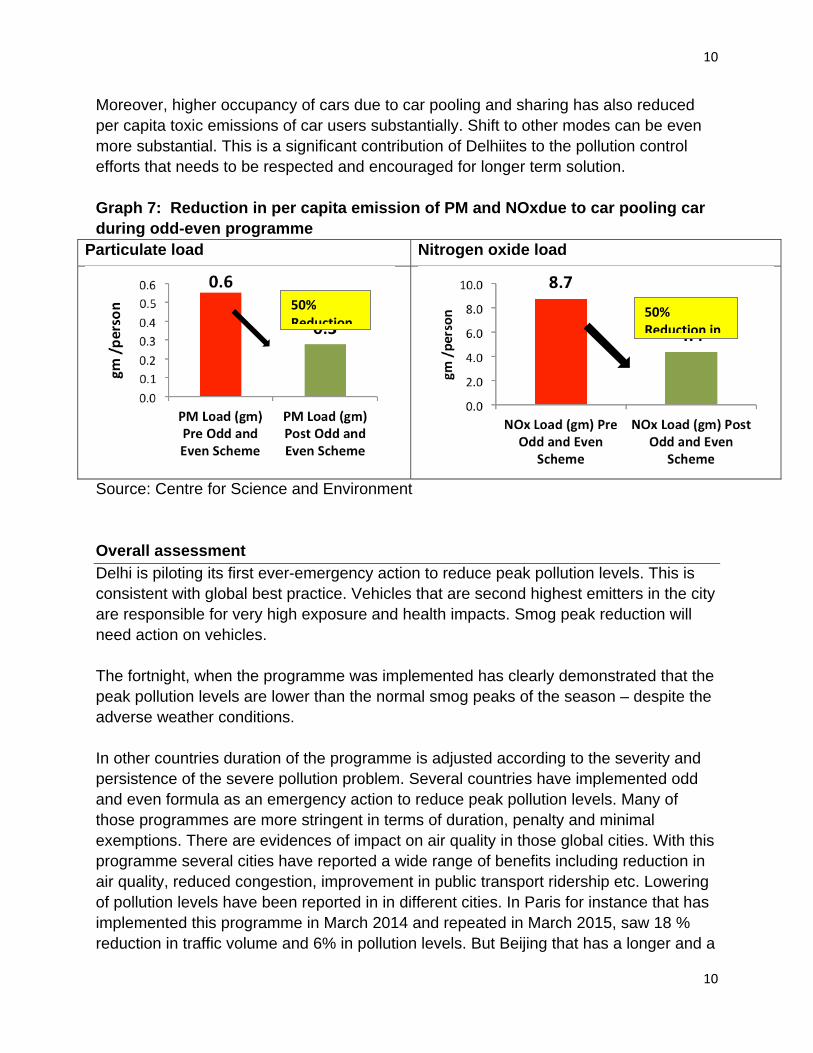
Moreover, higher occupancy of cars due to car pooling and sharing has also reduced per capita toxic emissions of car users substantially. Shift to other modes can be even more substantial. This is a significant contribution of Delhiites to the pollution control efforts that needs to be respected and encouraged for longer term solution. Graph 7: Reduction in per capita emission of PM and NOxdue to car pooling car during odd-even programme
Particulate load Nitrogen oxide load
Source: Centre for Science and Environment Overall assessment Delhi is piloting its first ever-emergency action to reduce peak pollution levels. This is consistent with global best practice. Vehicles that are second highest emitters in the city are responsible for very high exposure and health impacts. Smog peak reduction will need action on vehicles. The fortnight, when the programme was implemented has clearly demonstrated that the peak pollution levels are lower than the normal smog peaks of the season – despite the adverse weather conditions. In other countries duration of the programme is adjusted according to the severity and persistence of the severe pollution problem. Several countries have implemented odd and even formula as an emergency action to reduce peak pollution levels. Many of those programmes are more stringent in terms of duration, penalty and minimal exemptions. There are evidences of impact on air quality in those global cities. With this programme several cities have reported a wide range of benefits including reduction in air quality, reduced congestion, improvement in public transport ridership etc. Lowering of pollution levels have been reported in in different cities. In Paris for instance that has implemented this programme in March 2014 and repeated in March 2015, saw 18 % reduction in traffic volume and 6% in pollution levels. But Beijing that has a longer and a
50% Reduction in
50% Reduction

11
11
more stringent programme has shown 38% reduction in PM10. This indicates that even this percentage reduction is necessary and is possible in the short term to reduce smog peaks. Given the current pollution levels and adverse weather conditions it is recommended that the Delhi Government should develop this programme further. The government should be able to create the right template for the programme to be able to roll it out as and when needed. This is needed to protect public health, given the pollution emergency of the city. It is also important to note that the people of Delhi and neighbouring states have followed the rule – it shows their cooperation and their desire to be part of the solution to check this toxic and deadly air pollution. It is clear that we need to do more and not less to arrest air pollution and also make this scheme more successful, by reducing exceptions. It also means that the government of Delhi must now work to greatly augment public transport so that the city can go car-free more often and as a general practice. This will be the big transition that the city needs for truly effective and durable action against deadly and toxic air pollution.