3 eduventures presentation the higher education philanthropic landscape development committee...
TRANSCRIPT

Administrative Athletics
Adult/Lifelong Learning COBI
Communication/Arts Engineering
Health Sciences Lang/Liter/SocSci
Law Medicine/Life Science
Natural Science and Math Nursing
Pharm/Pharm Science Soc Justice/Human Svc
Other - HSCOther - Main Campus
Other - MC & HSC Honors
Education/HerbLibraries
Rocket Fund Special Purpose
Unrestricted
$141,934 $1,755,767
$6,154$691,373
$36,749$465,959
$39,384$30,510
$947,888$900,105
$89,144$114,481
$231,174$14,365$26,577
$370,246$30,000
$59,320$79,188
$1,875$343,265
$59,557$112,307
THE UNIVERSITY OF TOLEDO As of December 8, 2014REVENUE BY COLLEGE $6,548,613
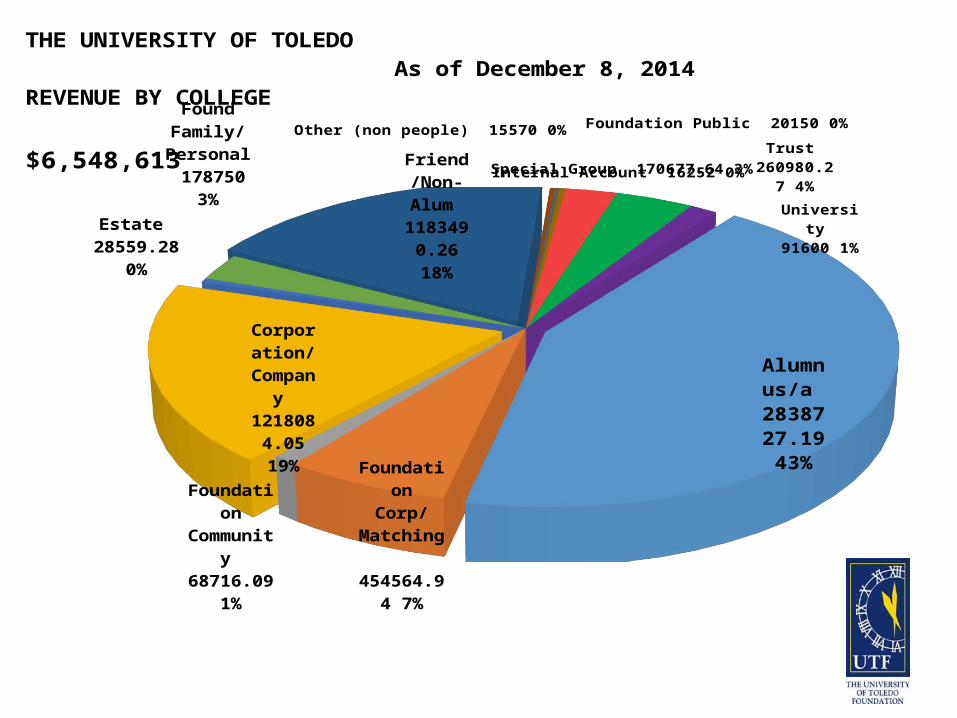
Alum-nus/a
2838727.19 43%
Founda-tion
Corp/Matching 454564.94
7%
Founda-tion
Commu-nity
68716.09 1%
Corpo-ration/Com-pany
1218084.05 19%
Estate 28559.28
0%
Found Family/
Personal 178750 3% Friend/
Non-Alum
1183490.26 18%
Internal Account 16252 0%
Other (non people) 15570 0% Foundation Public 20150 0%
Special Group 170677.64 3%
Trust 260980.27
4%
University 91600 1%
THE UNIVERSITY OF TOLEDO As of December 8, 2014REVENUE BY COLLEGE $6,548,613

3
Eduventures Presentation
The Higher Education Philanthropic Landscape
Development CommitteePresentation

4
Development Committee
EDUVENTURESTrends in Higher Education/The Philanthropic Landscape
1. Positive Outlook for Giving to Higher Education2. Publics and Privates are on Equal Footing3. Mega Gifts Stay Strong Year-to-Year4. Where Does the Money Go?5. Alumni Participation Continues its Decline6. Student Debt Impacts Giving7. Alumni Want Career-Related Engagement and Services 8. Investing in Engagement Does Pay Off9. Key Trends Are Impacting Major Gifts Work10. Partnership is Essential

2007 2008 2009 2010 2011 2012 2013$20
$25
$30
$35
$260
$280
$300
$320
$340
$360
$380
$400
$29.8
$31.6
$27.9 $28.0
$30.3$31.0
$33.9
$314$308
$280$287
$298
$316
$335
Higher Education Total Philanthropy
Giving to Higher Ed
(in billions)
Total Philanthropic
Giving (in billions)
1 – Positive Outlook for Giving to Higher Education
UTF FY13 Gift Revenue $16.2M ~ UTF FY14 Gift Revenue $19.2M
5
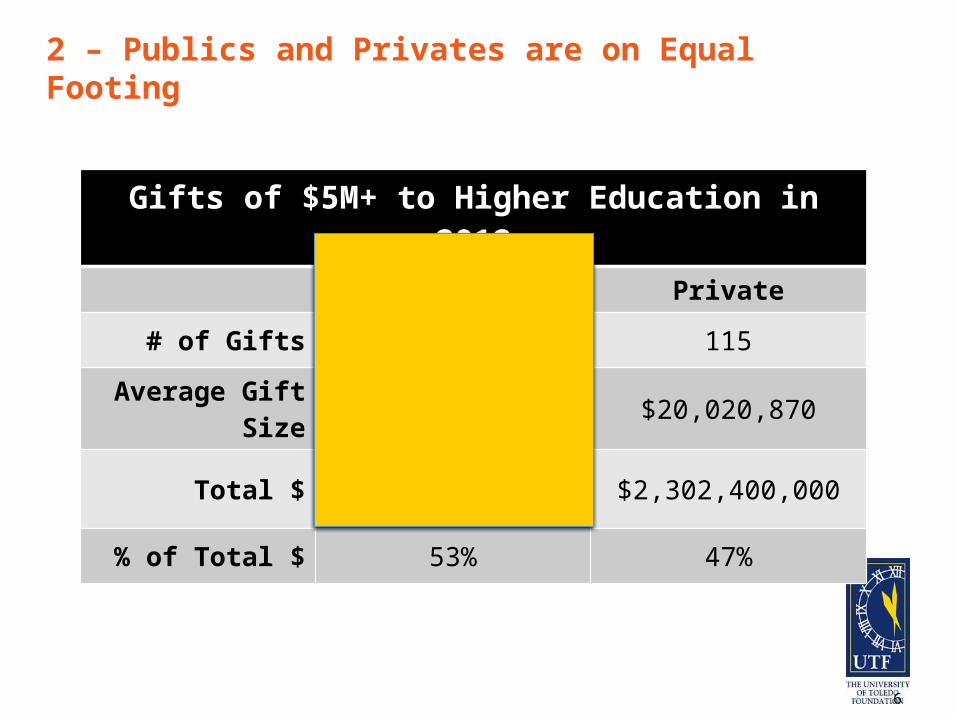
2 – Publics and Privates are on Equal Footing
6
Gifts of $5M+ to Higher Education in 2012
Public Private
# of Gifts 123 115
Average Gift Size $20,832,033 $20,020,870
Total $ $2,562,340,000 $2,302,400,000
% of Total $ 53% 47%

3 – Mega Gifts Stay Strong Year-to-Year
7
$100M+ Gifts 2006-2012
Year Total Dollar N % of Total $1M+ Dollars
2012 $1.721 B 9 30%
2011 $2.735 B 17 34%
2010 $400 M 3 5%
2009 $1.07 B 8 13%
2008 $1.632 B 12 14%
2007 $3.258 B 23 25%
2006 $1.797 B 12 19%

4 - Where Does the Money Go?
8
Academic research and programs
Scholarships/financial aid
Professorship Studentsupport*
Athletics Specifiedpurpose**
Campaign/Unspecified
$3.4 B
$769.9 M$450.1 M
$262.2 M $237.5 M $177.2 M $106.1 M
Distribution of 2012 $1M+ Gifts to Higher Education by Purpose
UTF

5 – Alumni Participation Continues its Decline
9
*Source: Voluntary Support of Education survey results, 2001-2013. Represents all institutions that participated in the survey, including a small number of 2-year colleges and graduate degreed-alumni. Also represents all types of alumni, including non-degreed alumni and graduate degreed alumni.

6 – Student Debt Impacts Giving
10
Amount of Student Loan Debt
Debt at these levels significantly impacts alumni giving.
National average $29.4K in student loan debt

6 – Student Debt Impacts Giving
11
• College debt is on the rise among Toledo alumni – a factor that is predictive of a lower likelihood of giving among alumni nationally.
– 72% of Toledo’s young alumni incurred debt to finance their education while compared with 66% of young alumni nationally and 50% of all Toledo alumni. Additionally, 48% of Toledo’s young alumni graduated with $20,000 or more in debt (vs. 25% of all Toledo alumni).
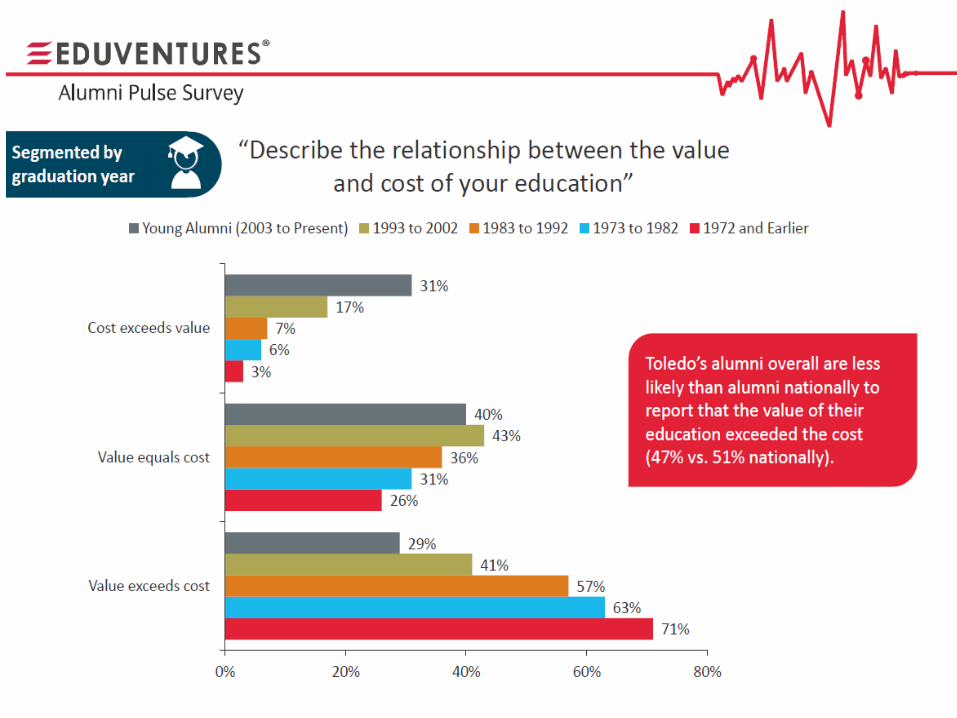
– Among this young alumni cohort there is also a growing feeling that the value of their college education is misaligned with the cost: only 29% of young alumni believe the value exceeds cost, a drop from 71% of 1972-and-earlier graduates.
• College debt is higher and perceptions of value are lower among Toledo's young alumni. Are key University leaders and stakeholders aware of this trend? Is Advancement a part of a campus-wide conversation about the perception value among constituents? What Advancement-specific strategies are in place to manage alumni perceptions and drive giving?
6 – Student Debt Impacts Giving
12

7 – Alumni Want Career-Related Engagement and Services
13
Alumni Event Ranking: Last Year’s Event Attendance vs. Next Year’s Event Preference
Rank Last Year AttendanceRan
kNext Year Preference Positi
on#1 Athletic events #1 Regional alumni events
#2 Campus visits #2 Athletic events
#3 Regional alumni events #3 Networking events
#4 Reunions #4 Professional seminars
#5 Homecoming #5 Career development for current students
#6 Networking events #6 Faculty lectures or webinars
#7 Recruitment of prospective students #7 Reunions
#8 Career development for current students #8 Campus visits
#9 Volunteer activities #9 Recruitment of prospective students
#10 University-sponsored conference #10 Volunteer activities

5 – Alumni Participation Continues its Decline
14
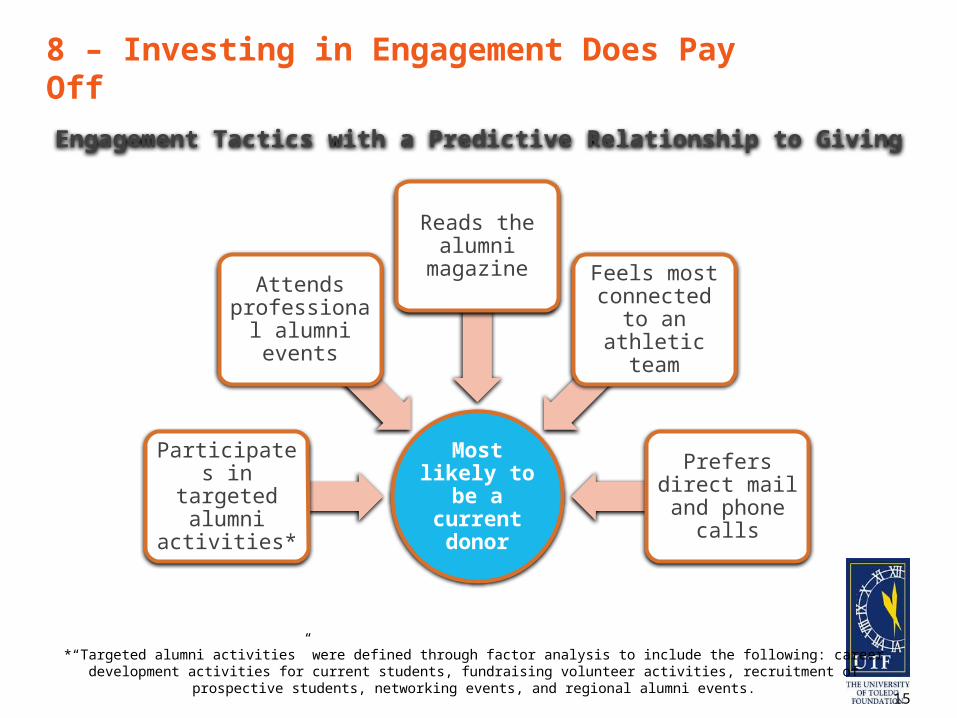
8 – Investing in Engagement Does Pay Off
15
Most likely to be a current donor
Participates in targeted alumni
activities*
Attends professional
alumni events
Reads the alumni magazine
Feels most connected to an
athletic team
Prefers direct mail and phone
calls
Engagement Tactics with a Predictive Relationship to Giving
*“Targeted alumni activities” were defined through factor analysis to include the following: career development activities for current students, fundraising volunteer activities, recruitment of prospective students, networking events, and
regional alumni events.

9 – Key Trends Are Impacting Major Gifts Work
Change in goal-setting processes; more realistic and
strategicRealization about
the impact of retention on productivity
Real data on the critical role
campus partners play in fundraising
results New and improved tools and software
providing real-time data
Increased focused investment in training and
mentoring gift officers More
development-based HR/professional
development positions
Trend towards smaller portfolios; focus on quarterly movement of top
25
16

10 – Partnership is Essential in Major Gifts Work
17
Type of partner
Involved in cultivation
Present at solicitation
Made the ask
Trustee
President
Provost
Dean
Department head or program leader
VP of Development
Chief Development Officer
Planned Gift Officer
$
$
$
$$
$
$$
$
$
$
%%%
= Linked to larger gift size
= Linked to greater percentage of ask received %
$
$$$ %

Eduventures is the industry leader in research, data, consulting, and advisory services for the higher education community. For 20 years, college and university leaders and education industry providers have looked to Eduventures for innovative and forward-looking ideas, for insights into best practices, and for help with making the strategic and operational decisions vital to their success. More about Eduventures can be found at www.eduventures.com.
About Eduventures
18