3 cape bridgewater unsewered - glenelg shire council · cape bridgewater is in a rural conservation...
TRANSCRIPT

van de Graaff and Associates, and Geocode, 2009 - 1 - Adopted by Glenelg Shire Council on 25 June 2009
C A P E B R I D G E W A T E R
T O W N R E P O R T
M a r c h 2 0 0 9
INTRODUCTORY COMMENTS
Cape Bridgewater is a very small town 19 km (20 minutes) west of Portland. There is no
reticulated water, sewerage or gas. There are a number of bores that are used to supplement
drinking water requirements. Other than a kiosk, there are no shops or services. No census
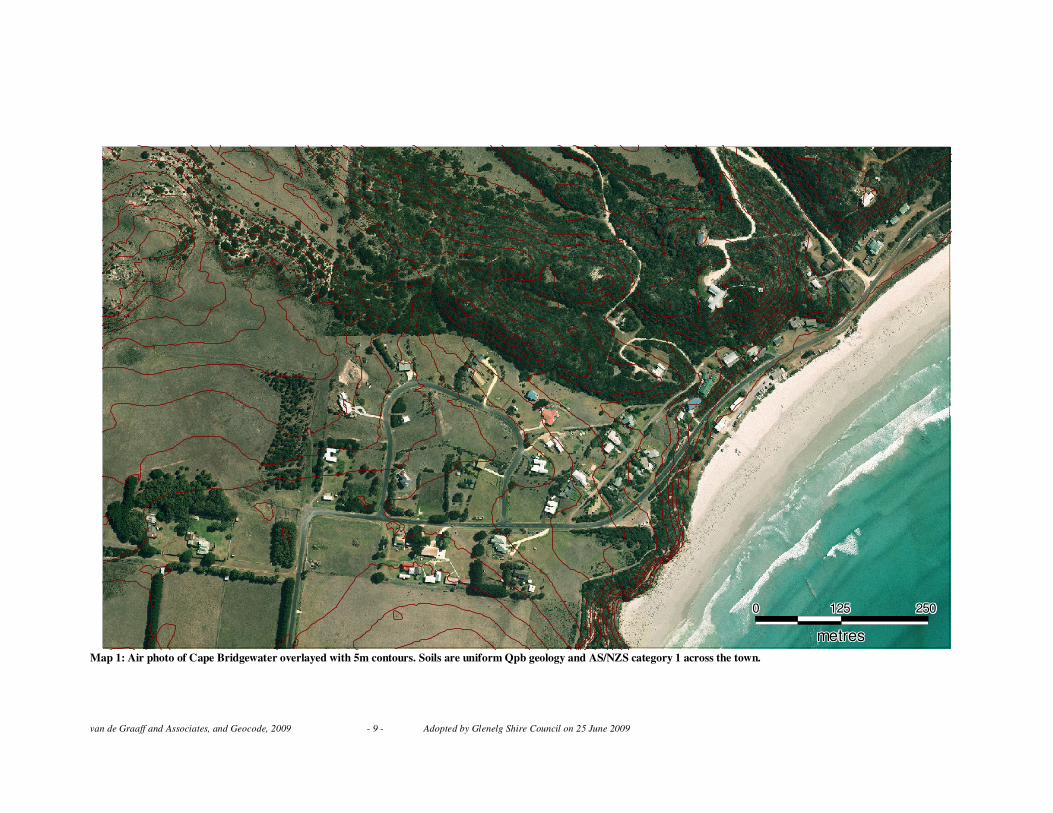
statistics are available for Cape Bridgewater. Perusal of air photos (Map 1) reveals that there
are 42 dwellings and 25 undeveloped parcels. This seems to be traditionally a holiday destination but tending to more permanent occupation, and the presence of a life saving club
would suggest this is a popular destination over the summer months.
The landscape at Cape Bridgewater is one of steep dune slopes. There are no watercourses in close proximity. The soils in the area (dune sand, dune limestone soils and volcanic ash) are
not mapped individually because for domestic wastewater purposes all the soils are AS/NZS
category 1.
Cape Bridgewater is in a Rural Conservation (schedule 1) planning zone. The township has two
distinct subdivision patterns. The Panoramic drive environ is characterised by blocks exceeding
2000m2 while in the remainder of the town parcel the typical parcel size is around 600m
2. There
are only few places where residential development has spread over multiple titles.
Cape Bridgewater is a holiday destination with a mix of housing stock. Many homes will be
using all-waste systems with trench technologies for effluent disposal. A serious wastewater
impact relates to groundwater. Category 1 soils are so permeable and soil percolation rates so
rapid that while they are undoubtedly effectively disposing of septic effluent (unless trench
systems are supported by a dosing pump and uniform effluent distribution little effluent
treatment would be occurring in the soil). Therefore the bulk of microbial and chemical
contaminants may well reach the groundwater table and pollute the groundwater. Hence the
most likely wastewater impact relates to groundwater, and only in extreme circumstances
would offsite effects such as overland flow of effluent into adjoining public and private
spaces be important. For this reason Council needs to pay close attention to the onsite effluent
disposal technologies being used in Cape Bridgewater.
It is our belief that no further trench systems should be permitted in Cape Bridgewater. Efforts
should be made to ensure trench systems in the Panoramic Drive area are using dosing pumps.
Blocks in the foreshore road / Flinders Street area are too small to sustainably deal with
wastewater onsite and should be sewered.

van de Graaff and Associates, and Geocode, 2009 - 2 - Adopted by Glenelg Shire Council on 25 June 2009
WASTEWATER MAPPING
Maps 3 thru 10 apply the AS/NZS and Code Of Practice in various ways to Cape
Bridgewater.
Development density series
Map 3 thru map 5 represent the current capacity for local areas to deal with wastewater onsite,
and the likelihood that if fully developed they could deal with wastewaters onsite using trench
and irrigation systems.
• Using trench systems a three bedroom home would require at least 1122 m2 to adequately
deal with its wastewater on AS/NZS category 1 soils (ie. 450m2 of impervious surfaces
plus 336m2 disposal area plus 336m
2 reserve area - see table 6 in the report introduction).
No new trench systems should be allowed in Cape Bridgewater. We have modelled this
theme only for the purpose of understanding the sustainability of existing onsite systems.
• Using irrigation systems a three bedroom home would require at least 635 m2 to
adequately deal with its wastewater on AS/NZS category 1 soils (ie. 450m2 of impervious
surfaces plus 185m2 disposal area - see table 3.1).
Map 3 assumes that trench systems are used throughout Cape Bridgewater and so represents
the present of sustainability of onsite systems in areas. Assuming dosing pumps are in use, only
the foreshore road / Flinders Street area is unlikely to be dealing with onsite wastewater to an
acceptable standard.
Map 4 represents the sustainability of areas if all parcels were to be developed using trench
systems. Three areas along the foreshore change status to red, meaning that on average they
would be unable to deal with wastewater if fully developed with three bedroom homes.
Map 5 represents the sustainability of onsite systems in Cape Bridgewater if all parcels were
to be developed and all developments were to make use of irrigation technology. Only one
area along the foreshore area remains a problem.
Constraints
Map 6 shows slope and stream buffer constraints in relation to properties and parcels. The
Code of Practice (EPA 2008) prohibits the consideration of land for wastewater absorption
fields if within 6 metres upslope or 3 metres downslope of an adjacent allotment. Buffer
distances from adjoining allotments are reduced by up to 50% if irrigation systems are used.
Allotments are buffered by 3m for input into the trench system models (red) and 1.5m for
input into the irrigation system models (pink) on the basis of our recommendation that all
wastewater systems should be pressurised. Also, the Land Capability Assessment for Onsite
Domestic Wastewater document (EPA 2003) suggests that slopes exceeding 20% are
constrained. We show slopes as three classes (0-17% is unconstrained, 18-22% requires
inspection and >22% is constrained).
Trench performance series
The trench system series (Map 7 and Map 8) gives some indication how existing systems might
be performing in terms of surface runoff potential and does not account for impacts on
groundwater, which will be greater where dosing pumps are not in use.
Map 7 shows that there are a significant number of properties with limited development
potential, particularly in the foreshore road / Flinders Street area. Most of these are already
developed, and many are clustered suggesting that there are probably already wastewater
problems in this area of the town. Such clusters represent areas where point sources are most
concentrated, and by inference are the areas of most pressing concern.
Map 8 shows that many parcels in the foreshore road / Flinders Street area have limited
development potential if trench technology is used. Severe problems could emerge if all parcels
were to be developed and trench systems were to be used.
van de Graaff and Associates, and Geocode, 2009 - 3 - Adopted by Glenelg Shire Council on 25 June 2009
Irrigation performance series
The irrigation system series (map 9 and map 10) shows that only a small number of blocks
constrained when trench systems are used, are not constrained when irrigation technologies are
used. This situation arises because many blocks are too small for onsite wastewater systems.
Map 9 represent the present ability of the local soils to deal with wastewater onsite should all
existing development be upgraded to irrigation systems. There are some improvements when
compared to trench systems (Map 7), however the foreshore road / Flinders Street area remains
a problem.
Map 10 represents the overall effect of using irrigation technology should all parcels be
developed in the future. There are a number of additional blocks that would be unable to deal
with wastewaters onsite when compared to map 9. Once again these are in the foreshore road /
Flinders Street area.
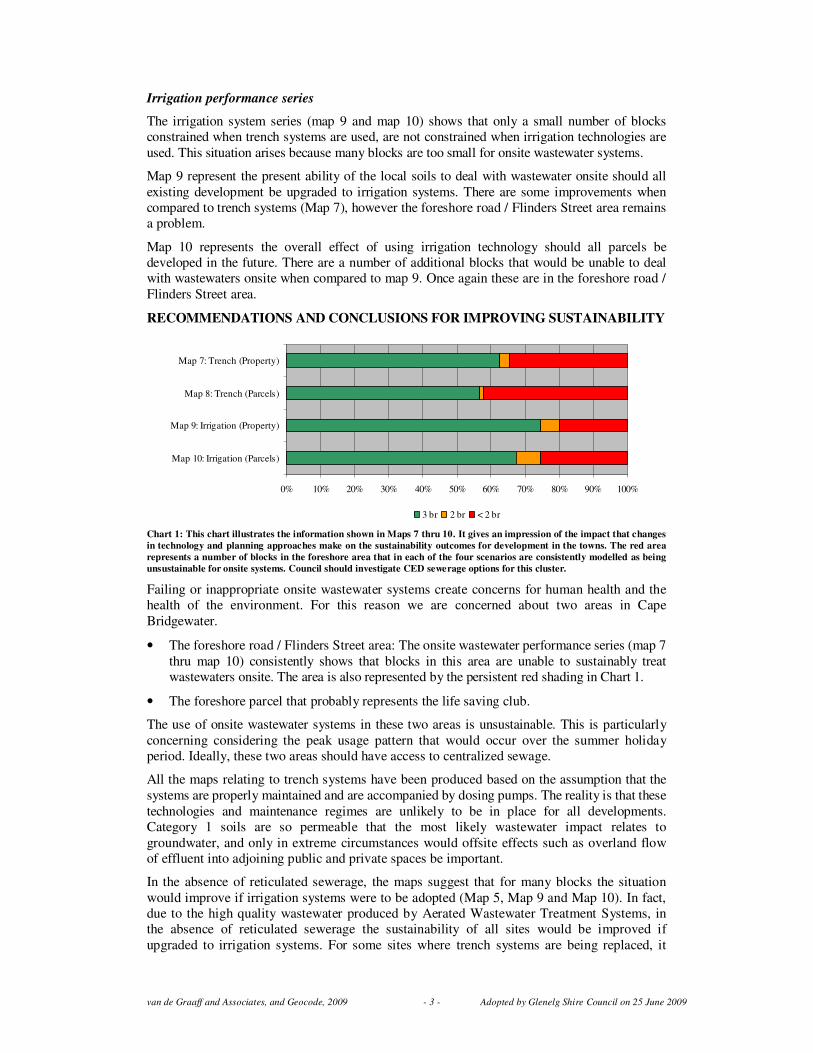
RECOMMENDATIONS AND CONCLUSIONS FOR IMPROVING SUSTAINABILITY
0% 10% 20% 30% 40% 50% 60% 70% 80% 90% 100%
Map 7: Trench (Property)
Map 8: Trench (Parcels)
Map 9: Irrigation (Property)
Map 10: Irrigation (Parcels)
3 br 2 br < 2 br
Chart 1: This chart illustrates the information shown in Maps 7 thru 10. It gives an impression of the impact that changes
in technology and planning approaches make on the sustainability outcomes for development in the towns. The red area
represents a number of blocks in the foreshore area that in each of the four scenarios are consistently modelled as being
unsustainable for onsite systems. Council should investigate CED sewerage options for this cluster.
Failing or inappropriate onsite wastewater systems create concerns for human health and the
health of the environment. For this reason we are concerned about two areas in Cape
Bridgewater.
• The foreshore road / Flinders Street area: The onsite wastewater performance series (map 7
thru map 10) consistently shows that blocks in this area are unable to sustainably treat
wastewaters onsite. The area is also represented by the persistent red shading in Chart 1.
• The foreshore parcel that probably represents the life saving club.
The use of onsite wastewater systems in these two areas is unsustainable. This is particularly
concerning considering the peak usage pattern that would occur over the summer holiday
period. Ideally, these two areas should have access to centralized sewage.
All the maps relating to trench systems have been produced based on the assumption that the
systems are properly maintained and are accompanied by dosing pumps. The reality is that these
technologies and maintenance regimes are unlikely to be in place for all developments.
Category 1 soils are so permeable that the most likely wastewater impact relates to
groundwater, and only in extreme circumstances would offsite effects such as overland flow
of effluent into adjoining public and private spaces be important.
In the absence of reticulated sewerage, the maps suggest that for many blocks the situation
would improve if irrigation systems were to be adopted (Map 5, Map 9 and Map 10). In fact,
due to the high quality wastewater produced by Aerated Wastewater Treatment Systems, in
the absence of reticulated sewerage the sustainability of all sites would be improved if
upgraded to irrigation systems. For some sites where trench systems are being replaced, it

van de Graaff and Associates, and Geocode, 2009 - 4 - Adopted by Glenelg Shire Council on 25 June 2009
may be necessary to re-use existing trenches for AWTS treated water, or to install irrigation
lines within existing trench areas.
Recommendation: The maps indicate that wastewater issues should be approached
differently in different areas of Cape Bridgewater. We suggest three approaches to dealing
with this. Our most preferred is Approach 1 and our least preferred is Approach 3.
• Approach 1:
o The Flinders Street / foreshore area should be sewered. A Common Effluent Drainage
system would be the most practical.
o Ensure trench systems in the Panoramic Drive area are using dosing pumps.
• Approach 2:
o Upgrade all trench systems to be irrigation systems in the Flinders Street / foreshore area. Initial focus should be on those developed properties shaded red in map 7.
o Ensure trench systems in the Panoramic Drive area are using dosing pumps.
• Approach 3: Adopt a policy that would:
o Lead to the long term upgrading of trench systems in the Flinders Street / foreshore area
to irrigation systems. Permit approval might be the trigger for this. Priorities should be
blocks:
� Using onsite systems that would not currently be approved (eg. soakage pits,
blackwater only systems).
� Mapped as being unable to sustain a three bedroom house.
o Ensure trench systems in the Panoramic Drive area are using dosing pumps.
o Manage remaining problems.
Notes on Approaches
Problems to manage
• Audit of existing systems in areas shaded red in map 7.
o Document onsite technology being used
o Initial desludging of all tanks
o Establish system to monitor future desludging
• Begin a community awareness campaign to encourage:
o The use of water saving devices and practices. The motivation for this is wastewater
reduction rather than reduced water consumption.
o The maintenance and care of septic tanks.
o Effective operation of trenches through the installation of dosing pumps.
• Full Land Capability Assessment to be undertaken for development proposals that deviate
from the wastewater technologies discussed in this document, or are shown to be
unsustainable in Map 9 or Map 10.
• Ensure the regular maintenance of AWTS in accordance with certificate of approval.
• Where bores exist, the water could become contaminated from wastewater and health
problems result.
o Observe setback distances between disposal fields and bores that are set out in the
Code Of Practice.
o Discourage use of bore water for potable supply.
o Promote secondary treatment and disinfection
van de Graaff and Associates, and Geocode, 2009 - 5 - Adopted by Glenelg Shire Council on 25 June 2009
Notes on upgrading existing septic tank systems
• Irrigation technology is the preferred option and implies the installation of AWTS.
Wastewater should be treated to a 20/30 standard.
• A professionally designed and constructed sand filter would be an acceptable alternative
technology.
• A dosing pump provides intermittent loading and uniform distribution of effluent. It is a
relatively inexpensive option that would give immediate benefit to most blocks. It will not
make a trench system more sustainable, but rather will ensure that it is performing the best
it possibly can. A dosing pump might be connected to existing trenches or extended
trenches.
• Aerated Wastewater Treatment System (AWTS) in combination with extended trenches and
a dosing pump would be another option.
REFERENCES
Australian / New Zealand Standard, On-site domestic-wastewater management – AS/NZS
1547:2000, 2000
EPA, Guidelines for Environmental Management – Septic Tanks Code of Practice,
Publication 891.2, December 2008
EPA, Land Capability Assessment for Onsite Domestic Wastewater, Publication 746.1,
March 2003
ACKNOWLEDGEMENT
Extensive use has been made of an earlier wastewater report produced by Mr Larry White.
van de Graaff and Associates, and Geocode, 2009 - 6 - Adopted by Glenelg Shire Council on 25 June 2009
CAPE BRIDGEWATER PREFERRED MANAGEMENT OPTIONS
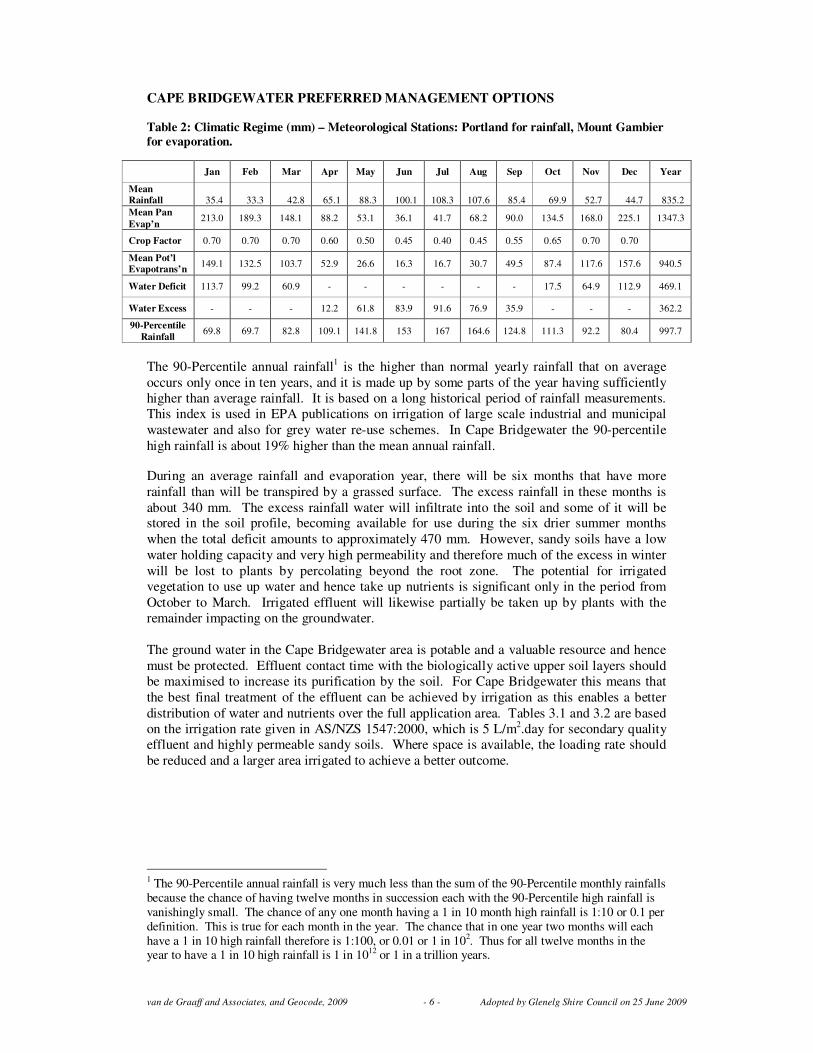
Table 2: Climatic Regime (mm) – Meteorological Stations: Portland for rainfall, Mount Gambier
for evaporation.
Jan Feb Mar Apr May Jun Jul Aug Sep Oct Nov Dec Year
Mean
Rainfall 35.4 33.3 42.8 65.1 88.3 100.1 108.3 107.6 85.4 69.9 52.7 44.7 835.2
Mean Pan
Evap’n 213.0 189.3 148.1 88.2 53.1 36.1 41.7 68.2 90.0 134.5 168.0 225.1 1347.3
Crop Factor 0.70 0.70 0.70 0.60 0.50 0.45 0.40 0.45 0.55 0.65 0.70 0.70
Mean Pot’l
Evapotrans’n 149.1 132.5 103.7 52.9 26.6 16.3 16.7 30.7 49.5 87.4 117.6 157.6 940.5
Water Deficit 113.7 99.2 60.9 - - - - - - 17.5 64.9 112.9 469.1
Water Excess - - - 12.2 61.8 83.9 91.6 76.9 35.9 - - - 362.2
90-Percentile
Rainfall 69.8 69.7 82.8 109.1 141.8 153 167 164.6 124.8 111.3 92.2 80.4 997.7
The 90-Percentile annual rainfall1 is the higher than normal yearly rainfall that on average
occurs only once in ten years, and it is made up by some parts of the year having sufficiently
higher than average rainfall. It is based on a long historical period of rainfall measurements.
This index is used in EPA publications on irrigation of large scale industrial and municipal
wastewater and also for grey water re-use schemes. In Cape Bridgewater the 90-percentile
high rainfall is about 19% higher than the mean annual rainfall.
During an average rainfall and evaporation year, there will be six months that have more
rainfall than will be transpired by a grassed surface. The excess rainfall in these months is
about 340 mm. The excess rainfall water will infiltrate into the soil and some of it will be stored in the soil profile, becoming available for use during the six drier summer months
when the total deficit amounts to approximately 470 mm. However, sandy soils have a low
water holding capacity and very high permeability and therefore much of the excess in winter
will be lost to plants by percolating beyond the root zone. The potential for irrigated
vegetation to use up water and hence take up nutrients is significant only in the period from
October to March. Irrigated effluent will likewise partially be taken up by plants with the
remainder impacting on the groundwater.
The ground water in the Cape Bridgewater area is potable and a valuable resource and hence
must be protected. Effluent contact time with the biologically active upper soil layers should
be maximised to increase its purification by the soil. For Cape Bridgewater this means that
the best final treatment of the effluent can be achieved by irrigation as this enables a better
distribution of water and nutrients over the full application area. Tables 3.1 and 3.2 are based
on the irrigation rate given in AS/NZS 1547:2000, which is 5 L/m2.day for secondary quality
effluent and highly permeable sandy soils. Where space is available, the loading rate should
be reduced and a larger area irrigated to achieve a better outcome.
1 The 90-Percentile annual rainfall is very much less than the sum of the 90-Percentile monthly rainfalls
because the chance of having twelve months in succession each with the 90-Percentile high rainfall is
vanishingly small. The chance of any one month having a 1 in 10 month high rainfall is 1:10 or 0.1 per
definition. This is true for each month in the year. The chance that in one year two months will each
have a 1 in 10 high rainfall therefore is 1:100, or 0.01 or 1 in 102. Thus for all twelve months in the
year to have a 1 in 10 high rainfall is 1 in 1012
or 1 in a trillion years.
van de Graaff and Associates, and Geocode, 2009 - 7 - Adopted by Glenelg Shire Council on 25 June 2009
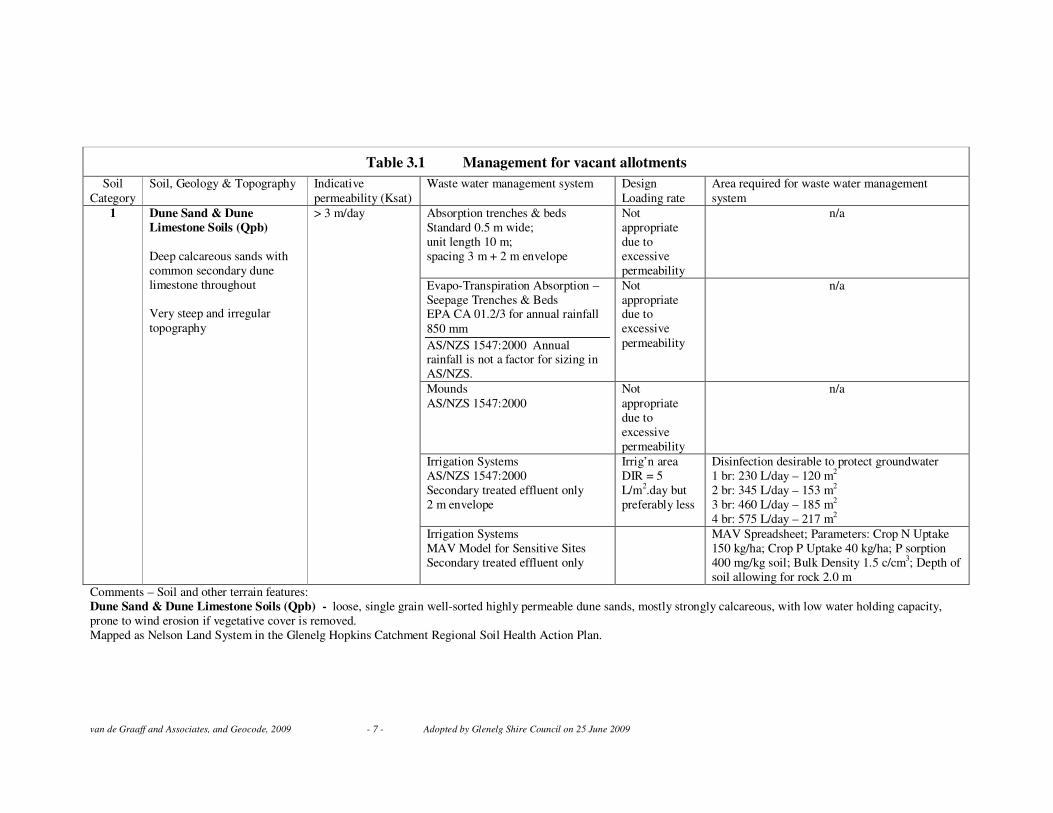
Table 3.1 Management for vacant allotments
Soil
Category
Soil, Geology & Topography Indicative
permeability (Ksat)
Waste water management system Design
Loading rate
Area required for waste water management
system
Absorption trenches & beds
Standard 0.5 m wide;
unit length 10 m;
spacing 3 m + 2 m envelope
Not
appropriate
due to
excessive
permeability
n/a
Evapo-Transpiration Absorption –
Seepage Trenches & Beds EPA CA 01.2/3 for annual rainfall
850 mm
AS/NZS 1547:2000 Annual rainfall is not a factor for sizing in
AS/NZS.
Not
appropriate due to
excessive
permeability
n/a
Mounds
AS/NZS 1547:2000
Not
appropriate
due to
excessive
permeability
n/a
Irrigation Systems
AS/NZS 1547:2000
Secondary treated effluent only
2 m envelope
Irrig’n area
DIR = 5
L/m2.day but
preferably less
Disinfection desirable to protect groundwater
1 br: 230 L/day – 120 m2
2 br: 345 L/day – 153 m2
3 br: 460 L/day – 185 m2
4 br: 575 L/day – 217 m2
1 Dune Sand & Dune
Limestone Soils (Qpb)
Deep calcareous sands with
common secondary dune
limestone throughout
Very steep and irregular
topography
> 3 m/day
Irrigation Systems
MAV Model for Sensitive Sites
Secondary treated effluent only
MAV Spreadsheet; Parameters: Crop N Uptake
150 kg/ha; Crop P Uptake 40 kg/ha; P sorption
400 mg/kg soil; Bulk Density 1.5 c/cm3; Depth of
soil allowing for rock 2.0 m
Comments – Soil and other terrain features:
Dune Sand & Dune Limestone Soils (Qpb) - loose, single grain well-sorted highly permeable dune sands, mostly strongly calcareous, with low water holding capacity,
prone to wind erosion if vegetative cover is removed.
Mapped as Nelson Land System in the Glenelg Hopkins Catchment Regional Soil Health Action Plan.

van de Graaff and Associates, and Geocode, 2009 - 8 - Adopted by Glenelg Shire Council on 25 June 2009
Table 3.2 Management for existing premises
Soil
Category
Soil, Geology & Topography Indicative
permeability (Ksat)
Waste water management system Design
Loading rate
Area required for waste water management
system
Absorption trenches & beds
Standard 0.5 m wide;
unit length 10 m;
spacing 2 m + 2 m envelope
5 mm/day,
35 mm/week
Upgrade by installing an AWTS, and extend
trenches to maximum possible, install pressurised
dose loading and install water saving appliances,
disinfection desirable to protect groundwater
Evapo-Transpiration Absorption –
Seepage Trenches & Beds
EPA CA 01.2/3 for annual rainfall 850 mm
--------------------
AS/NZS 1547:2000 Annual
rainfall is not a factor for sizing in
AS/NZS.
Loading Rate
as per EPA
CA 01.2/3.
------------------
Calculate
Water Balance
as per AS/NZS
Appendix
4.2D for each
month and full
year.
Upgrade by installing an AWTS, and extend
trenches to maximum possible, install pressurised
dose loading and install water saving appliances
Mounds
AS/NZS 1547:2000
5 L/m2.day Upgrade by installing an AWTS, and extend
trenches to maximum possible, install pressurised
dose loading and install water saving appliances
Irrigation Systems AS/NZS 1547:2000
Secondary treated effluent only
Irrig’n area DIR = 5
L/m2.day or
less
1 Dune Sand & Dune
Limestone Soils (Qpb)
Deep calcareous sands with
common secondary dune
limestone throughout
Very steep and irregular
topography
> 3 m/day
Irrigation Systems
MAV Model for Sensitive Sites
Secondary treated effluent only
Extend irrigation area where possible and reduce loading rate; install water saving appliances,
disinfection desirable to protect groundwater
Comments – Soil and other terrain features:
Dune Sand & Dune Limestone Soils (Qpb) - loose, single grain well-sorted highly permeable dune sands, mostly strongly calcareous, with low water holding capacity,
prone to wind erosion if vegetative cover is removed.
Mapped as Nelson Land System in the Glenelg Hopkins Catchment Regional Soil Health Action Plan.
van de Graaff and Associates, and Geocode, 2009 - 9 - Adopted by Glenelg Shire Council on 25 June 2009
250250250250250250250250250125125125125125125125125125000000000
metresmetresmetresmetresmetresmetresmetresmetresmetres
Map 1: Air photo of Cape Bridgewater overlayed with 5m contours. Soils are uniform Qpb geology and AS/NZS category 1 across the town.
van de Graaff and Associates, and Geocode, 2009 - 10 - Adopted by Glenelg Shire Council on 25 June 2009
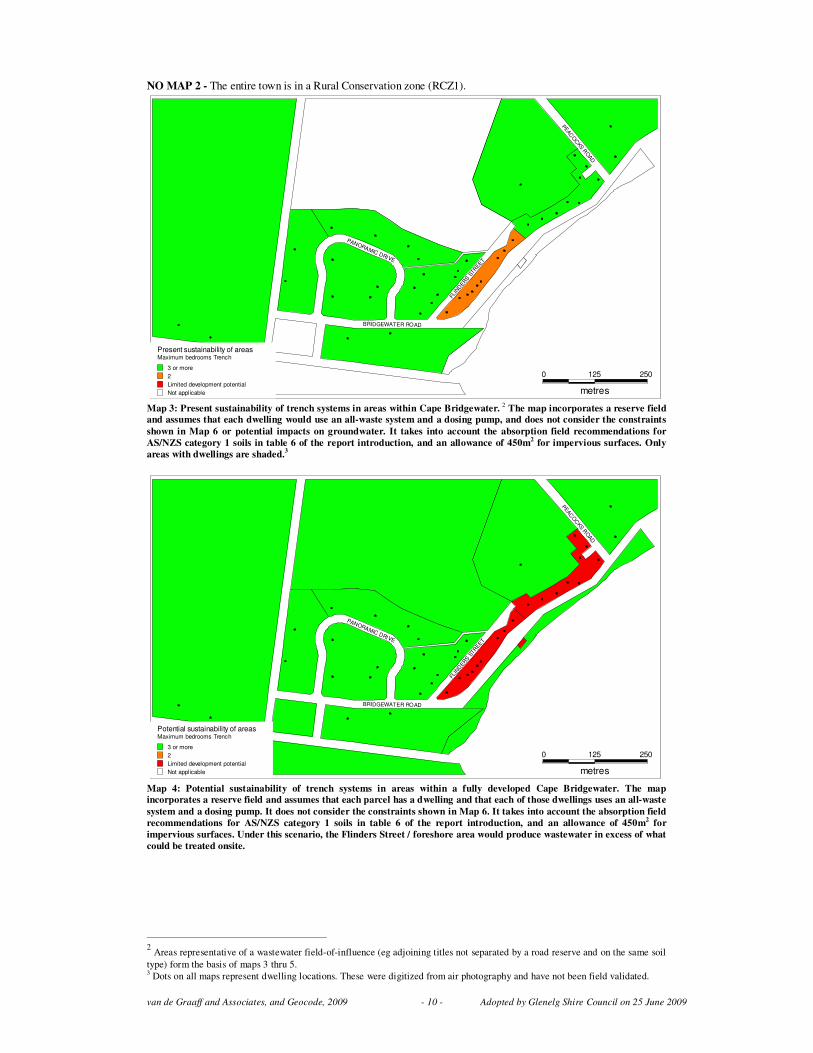
NO MAP 2 - The entire town is in a Rural Conservation zone (RCZ1).
250250250250250250250250250125125125125125125125125125000000000
metresmetresmetresmetresmetresmetresmetresmetresmetres
PANORAMIC DRIVE
PANORAMIC DRIVE
PANORAMIC DRIVE
PANORAMIC DRIVE
PANORAMIC DRIVE
PANORAMIC DRIVE
PANORAMIC DRIVE
PANORAMIC DRIVE
PANORAMIC DRIVE
FLIN
DER
S S
TREET
FLIN
DERS S
TREE
T
FLIN
DER
S S
TREET
FLIN
DER
S S
TREET
FLIN
DER
S S
TREET
FLIN
DER
S S
TREET
FLIN
DERS S
TREE
T
FLIN
DER
S S
TREET
FLIN
DERS
STR
EET
PEAC
OC
KS R
OAD
PEAC
OC
KS R
OAD
PEAC
OC
KS R
OAD
PEAC
OC
KS R
OAD
PEAC
OC
KS R
OAD
PEAC
OC
KS R
OAD
PEAC
OC
KS R
OAD
PEAC
OC
KS R
OAD
PEAC
OC
KS R
OAD
BRIDGEWATER ROADBRIDGEWATER ROADBRIDGEWATER ROADBRIDGEWATER ROADBRIDGEWATER ROADBRIDGEWATER ROADBRIDGEWATER ROADBRIDGEWATER ROADBRIDGEWATER ROAD
Present sustainability of areasMaximum bedrooms Trench
3 or more
2
Limited development potential
Not applicable
Map 3: Present sustainability of trench systems in areas within Cape Bridgewater.
2 The map incorporates a reserve field
and assumes that each dwelling would use an all-waste system and a dosing pump, and does not consider the constraints
shown in Map 6 or potential impacts on groundwater. It takes into account the absorption field recommendations for
AS/NZS category 1 soils in table 6 of the report introduction, and an allowance of 450m2 for impervious surfaces. Only
areas with dwellings are shaded.3
250250250250250250250250250125125125125125125125125125000000000
metresmetresmetresmetresmetresmetresmetresmetresmetres
PANORAMIC DRIVE
PANORAMIC DRIVE
PANORAMIC DRIVE
PANORAMIC DRIVE
PANORAMIC DRIVE
PANORAMIC DRIVE
PANORAMIC DRIVE
PANORAMIC DRIVE
PANORAMIC DRIVE
FLIN
DER
S S
TREET
FLIN
DERS S
TREE
T
FLIN
DER
S S
TREET
FLIN
DER
S S
TREET
FLIN
DER
S S
TREET
FLIN
DER
S S
TREET
FLIN
DERS S
TREE
T
FLIN
DER
S S
TREET
FLIN
DERS
STR
EET
PEAC
OC
KS R
OAD
PEAC
OC
KS R
OAD
PEAC
OC
KS R
OAD
PEAC
OC
KS R
OAD
PEAC
OC
KS R
OAD
PEAC
OC
KS R
OAD
PEAC
OC
KS R
OAD
PEAC
OC
KS R
OAD
PEAC
OC
KS R
OAD
BRIDGEWATER ROADBRIDGEWATER ROADBRIDGEWATER ROADBRIDGEWATER ROADBRIDGEWATER ROADBRIDGEWATER ROADBRIDGEWATER ROADBRIDGEWATER ROADBRIDGEWATER ROAD
Potential sustainability of areasMaximum bedrooms Trench
3 or more
2
Limited development potential
Not applicable
Map 4: Potential sustainability of trench systems in areas within a fully developed Cape Bridgewater. The map
incorporates a reserve field and assumes that each parcel has a dwelling and that each of those dwellings uses an all-waste
system and a dosing pump. It does not consider the constraints shown in Map 6. It takes into account the absorption field
recommendations for AS/NZS category 1 soils in table 6 of the report introduction, and an allowance of 450m2 for
impervious surfaces. Under this scenario, the Flinders Street / foreshore area would produce wastewater in excess of what
could be treated onsite.
2 Areas representative of a wastewater field-of-influence (eg adjoining titles not separated by a road reserve and on the same soil
type) form the basis of maps 3 thru 5. 3 Dots on all maps represent dwelling locations. These were digitized from air photography and have not been field validated.
van de Graaff and Associates, and Geocode, 2009 - 11 - Adopted by Glenelg Shire Council on 25 June 2009
250250250250250250250250250125125125125125125125125125000000000
metresmetresmetresmetresmetresmetresmetresmetresmetres
PANORAMIC DRIVE
PANORAMIC DRIVE
PANORAMIC DRIVE
PANORAMIC DRIVE
PANORAMIC DRIVE
PANORAMIC DRIVE
PANORAMIC DRIVE
PANORAMIC DRIVE
PANORAMIC DRIVE
FLIN
DERS
STR
EET
FLIN
DER
S S
TREET
FLIN
DERS
STR
EET
FLIN
DERS
STR
EET
FLIN
DERS
STR
EET
FLIN
DERS
STR
EET
FLIN
DER
S S
TREET
FLIN
DERS
STR
EET
FLIN
DER
S S
TREET
PEACO
CKS R
OAD
PEAC
OC
KS R
OAD
PEAC
OC
KS R
OAD
PEACO
CKS R
OAD
PEAC
OC
KS R
OAD
PEACO
CKS R
OAD
PEAC
OC
KS R
OAD
PEAC
OC
KS R
OAD
PEAC
OC
KS R
OAD
BRIDGEWATER ROADBRIDGEWATER ROADBRIDGEWATER ROADBRIDGEWATER ROADBRIDGEWATER ROADBRIDGEWATER ROADBRIDGEWATER ROADBRIDGEWATER ROADBRIDGEWATER ROAD
Potential sustainability of areasMaximum bedrooms Irrigation
3 or more
2
Limited development potential
Not applicable
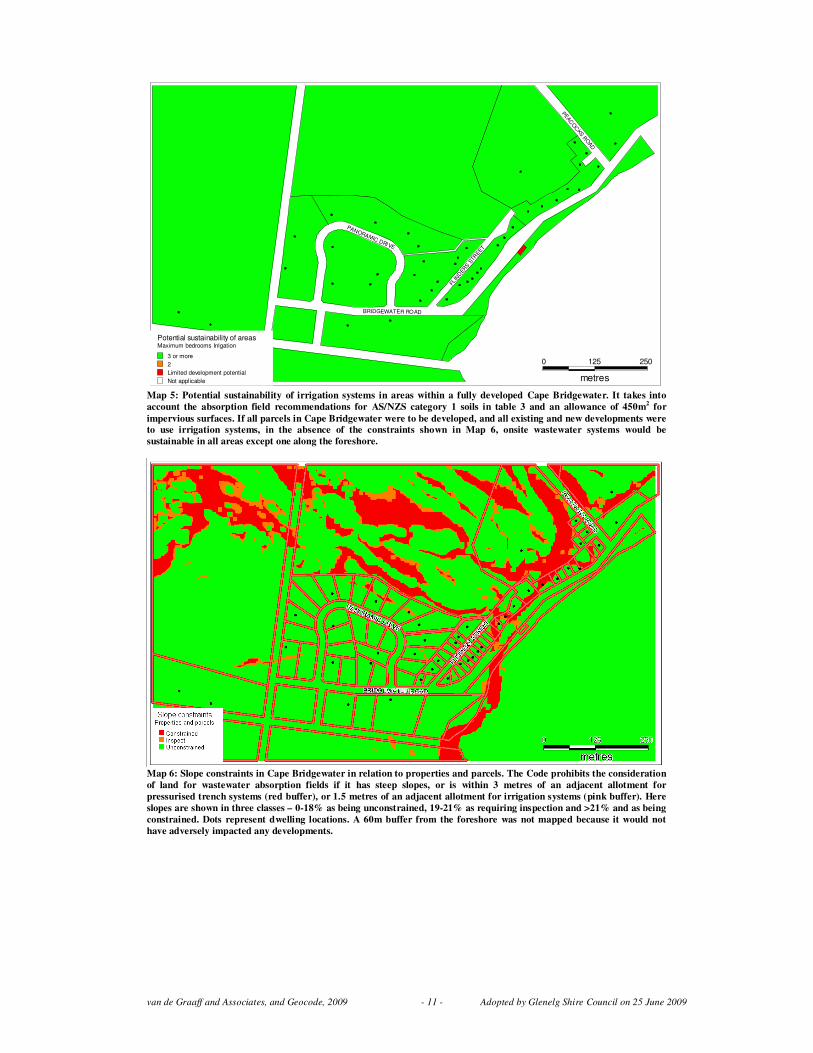
Map 5: Potential sustainability of irrigation systems in areas within a fully developed Cape Bridgewater. It takes into
account the absorption field recommendations for AS/NZS category 1 soils in table 3 and an allowance of 450m2 for
impervious surfaces. If all parcels in Cape Bridgewater were to be developed, and all existing and new developments were
to use irrigation systems, in the absence of the constraints shown in Map 6, onsite wastewater systems would be
sustainable in all areas except one along the foreshore.
Map 6: Slope constraints in Cape Bridgewater in relation to properties and parcels. The Code prohibits the consideration
of land for wastewater absorption fields if it has steep slopes, or is within 3 metres of an adjacent allotment for
pressurised trench systems (red buffer), or 1.5 metres of an adjacent allotment for irrigation systems (pink buffer). Here
slopes are shown in three classes – 0-18% as being unconstrained, 19-21% as requiring inspection and >21% and as being
constrained. Dots represent dwelling locations. A 60m buffer from the foreshore was not mapped because it would not
have adversely impacted any developments.
van de Graaff and Associates, and Geocode, 2009 - 12 - Adopted by Glenelg Shire Council on 25 June 2009
250250250250250250250250250125125125125125125125125125000000000
metresmetresmetresmetresmetresmetresmetresmetresmetres
PANORAMIC DRIVE
PANORAMIC DRIVE
PANORAMIC DRIVE
PANORAMIC DRIVE
PANORAMIC DRIVE
PANORAMIC DRIVE
PANORAMIC DRIVE
PANORAMIC DRIVE
PANORAMIC DRIVE
FLIN
DERS S
TREET
FLIN
DERS
STR
EET
FLIN
DER
S S
TREET
FLIN
DERS S
TREET
FLIN
DER
S S
TREET
FLIN
DERS S
TREET
FLIN
DERS
STR
EET
FLIN
DER
S S
TREET
FLIN
DERS
STR
EET
PEAC
OCKS R
OAD
PEA
CO
CKS R
OAD
PEACO
CKS R
OAD
PEAC
OCKS R
OAD
PEACO
CKS R
OAD
PEAC
OCKS R
OAD
PEA
CO
CKS R
OAD
PEACO
CKS R
OAD
PEA
CO
CKS R
OAD
BRIDGEWATER ROADBRIDGEWATER ROADBRIDGEWATER ROADBRIDGEWATER ROADBRIDGEWATER ROADBRIDGEWATER ROADBRIDGEWATER ROADBRIDGEWATER ROADBRIDGEWATER ROAD
Present sustainability of propertiesMaximum bedrooms Trench
3 or more
2
Limited development potential
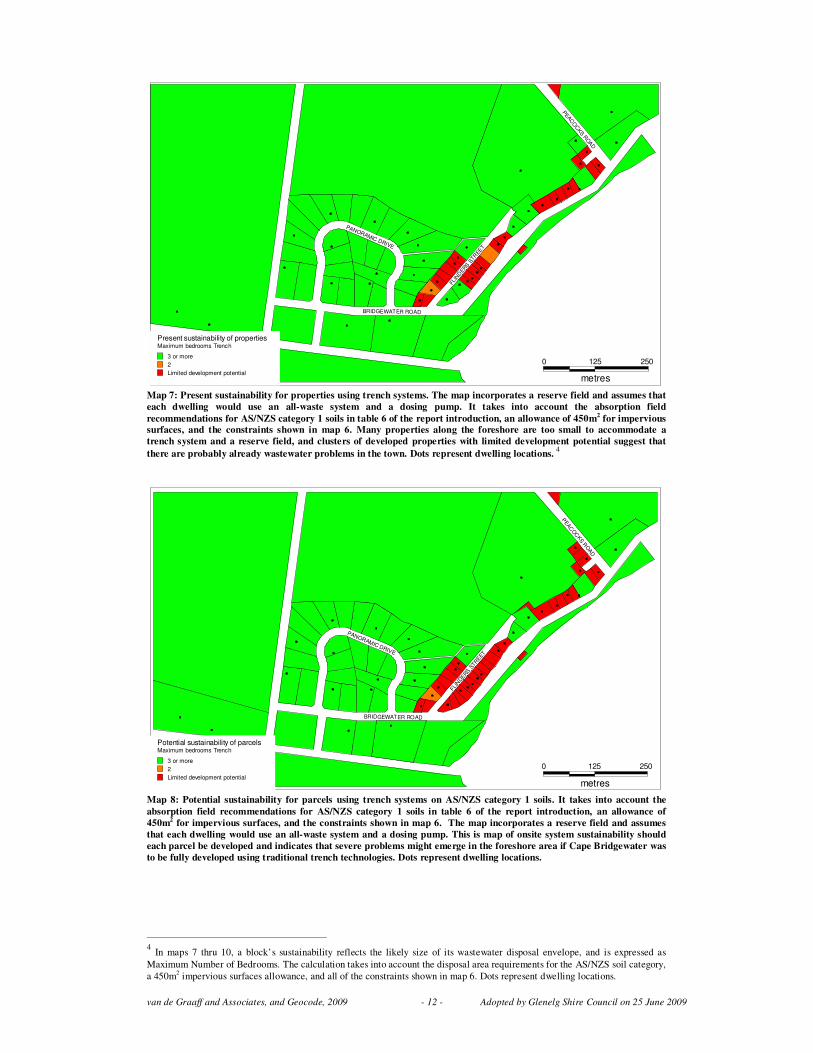
Map 7: Present sustainability for properties using trench systems. The map incorporates a reserve field and assumes that
each dwelling would use an all-waste system and a dosing pump. It takes into account the absorption field
recommendations for AS/NZS category 1 soils in table 6 of the report introduction, an allowance of 450m2 for impervious
surfaces, and the constraints shown in map 6. Many properties along the foreshore are too small to accommodate a
trench system and a reserve field, and clusters of developed properties with limited development potential suggest that
there are probably already wastewater problems in the town. Dots represent dwelling locations. 4
250250250250250250250250250125125125125125125125125125000000000
metresmetresmetresmetresmetresmetresmetresmetresmetres
PANORAMIC DRIVE
PANORAMIC DRIVE
PANORAMIC DRIVE
PANORAMIC DRIVE
PANORAMIC DRIVE
PANORAMIC DRIVE
PANORAMIC DRIVE
PANORAMIC DRIVE
PANORAMIC DRIVE
FLIN
DER
S S
TREET
FLIN
DERS S
TREET
FLIN
DERS
STR
EET
FLIN
DER
S S
TREET
FLIN
DERS
STR
EET
FLIN
DER
S S
TREET
FLIN
DERS
STREET
FLIN
DERS
STR
EET
FLIN
DERS S
TREET
PEA
CO
CKS R
OAD
PEAC
OC
KS R
OAD
PEA
CO
CKS
RO
AD
PEA
CO
CKS R
OAD
PEA
CO
CKS
RO
AD
PEA
CO
CKS R
OAD
PEAC
OC
KS R
OAD
PEA
CO
CKS
RO
AD
PEAC
OC
KS R
OAD
BRIDGEWATER ROADBRIDGEWATER ROADBRIDGEWATER ROADBRIDGEWATER ROADBRIDGEWATER ROADBRIDGEWATER ROADBRIDGEWATER ROADBRIDGEWATER ROADBRIDGEWATER ROAD
Potential sustainability of parcelsMaximum bedrooms Trench
3 or more
2
Limited development potential
Map 8: Potential sustainability for parcels using trench systems on AS/NZS category 1 soils. It takes into account the
absorption field recommendations for AS/NZS category 1 soils in table 6 of the report introduction, an allowance of
450m2 for impervious surfaces, and the constraints shown in map 6. The map incorporates a reserve field and assumes
that each dwelling would use an all-waste system and a dosing pump. This is map of onsite system sustainability should
each parcel be developed and indicates that severe problems might emerge in the foreshore area if Cape Bridgewater was
to be fully developed using traditional trench technologies. Dots represent dwelling locations.
4 In maps 7 thru 10, a block’s sustainability reflects the likely size of its wastewater disposal envelope, and is expressed as
Maximum Number of Bedrooms. The calculation takes into account the disposal area requirements for the AS/NZS soil category,
a 450m2 impervious surfaces allowance, and all of the constraints shown in map 6. Dots represent dwelling locations.
van de Graaff and Associates, and Geocode, 2009 - 13 - Adopted by Glenelg Shire Council on 25 June 2009
250250250250250250250250250125125125125125125125125125000000000
metresmetresmetresmetresmetresmetresmetresmetresmetres
PANORAMIC DRIVE
PANORAMIC DRIVE
PANORAMIC DRIVE
PANORAMIC DRIVE
PANORAMIC DRIVE
PANORAMIC DRIVE
PANORAMIC DRIVE
PANORAMIC DRIVE
PANORAMIC DRIVE
FLIN
DERS S
TREET
FLIN
DERS
STR
EET
FLIN
DER
S S
TREET
FLIN
DERS S
TREET
FLIN
DER
S S
TREET
FLIN
DERS S
TREET
FLIN
DERS
STR
EET
FLIN
DER
S S
TREET
FLIN
DERS
STR
EET
PEAC
OCKS R
OAD
PEA
CO
CKS R
OAD
PEACO
CKS R
OAD
PEAC
OCKS R
OAD
PEACO
CKS R
OAD
PEAC
OCKS R
OAD
PEA
CO
CKS R
OAD
PEACO
CKS R
OAD
PEA
CO
CKS R
OAD
BRIDGEWATER ROADBRIDGEWATER ROADBRIDGEWATER ROADBRIDGEWATER ROADBRIDGEWATER ROADBRIDGEWATER ROADBRIDGEWATER ROADBRIDGEWATER ROADBRIDGEWATER ROAD
Potential sustainability of propertiesMaximum bedrooms Irrigation
3 or more
2
Limited development potential
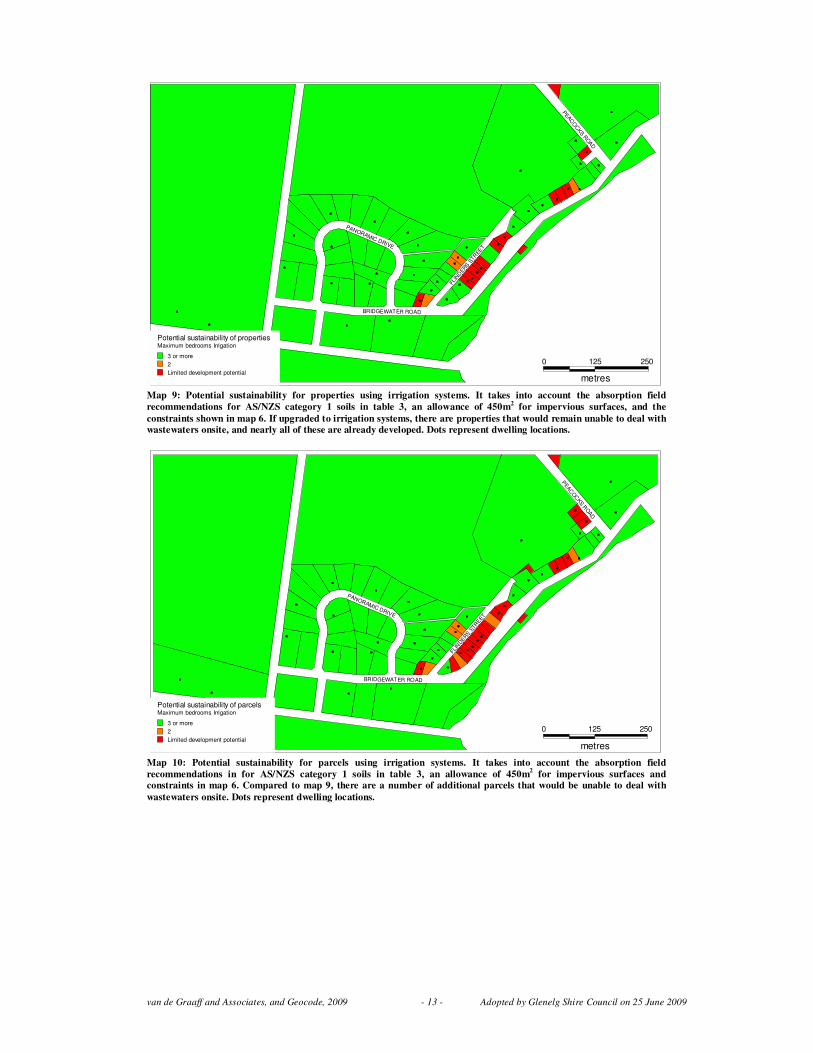
Map 9: Potential sustainability for properties using irrigation systems. It takes into account the absorption field
recommendations for AS/NZS category 1 soils in table 3, an allowance of 450m2 for impervious surfaces, and the
constraints shown in map 6. If upgraded to irrigation systems, there are properties that would remain unable to deal with
wastewaters onsite, and nearly all of these are already developed. Dots represent dwelling locations.
250250250250250250250250250125125125125125125125125125000000000
metresmetresmetresmetresmetresmetresmetresmetresmetres
PANORAMIC DRIVE
PANORAMIC DRIVE
PANORAMIC DRIVE
PANORAMIC DRIVE
PANORAMIC DRIVE
PANORAMIC DRIVE
PANORAMIC DRIVE
PANORAMIC DRIVE
PANORAMIC DRIVE
FLIN
DER
S S
TREET
FLIN
DERS S
TREET
FLIN
DERS
STR
EET
FLIN
DER
S S
TREET
FLIN
DERS
STR
EET
FLIN
DER
S S
TREET
FLIN
DERS
STREET
FLIN
DERS
STR
EET
FLIN
DERS S
TREET
PEA
CO
CKS R
OAD
PEAC
OC
KS R
OAD
PEA
CO
CKS
RO
AD
PEA
CO
CKS R
OAD
PEA
CO
CKS
RO
AD
PEA
CO
CKS R
OAD
PEAC
OC
KS R
OAD
PEA
CO
CKS
RO
AD
PEAC
OC
KS R
OAD
BRIDGEWATER ROADBRIDGEWATER ROADBRIDGEWATER ROADBRIDGEWATER ROADBRIDGEWATER ROADBRIDGEWATER ROADBRIDGEWATER ROADBRIDGEWATER ROADBRIDGEWATER ROAD
Potential sustainability of parcelsMaximum bedrooms Irrigation
3 or more
2
Limited development potential
Map 10: Potential sustainability for parcels using irrigation systems. It takes into account the absorption field
recommendations in for AS/NZS category 1 soils in table 3, an allowance of 450m2 for impervious surfaces and
constraints in map 6. Compared to map 9, there are a number of additional parcels that would be unable to deal with
wastewaters onsite. Dots represent dwelling locations.