3. autonomous buoyancy-driven underwater...
TRANSCRIPT
“chap03” — 2002/8/3 — 18:25 — page 37 — #1
3. AUTONOMOUS BUOYANCY-DRIVENUNDERWATER GLIDERS
RUSS E. DAVISa, CHARLES C. ERIKSENb and CLAYTON P. JONESc
aScripps Institution of Oceanography, La Jolla, CA 92093-0230, USA,bSchool of Oceanography, University of Washington, Seattle, WA 98195-5351, USA and
cWebb Research Corporation, Falmouth, MA 02536, USA
3.1 INTRODUCTION
Historically, the interior ocean has been mainly observed using instruments loweredfrom research ships or, later, suspended from moorings. Typical ship cruises lasta month or two while moorings may last a year or two. The relatively high cost of theseobservation platforms has limited their number and, consequently, the spatial andtemporal density at which the ocean has been observed. Initially this may not haveseemed a serious hindrance because the ocean’s circulation was thought to be largelysteady with broad spatial scales outside a few concentrated boundary currents. Overthe last 30 years, however, satellite remote sensing and intensive experimental oceanobservations have belied this view and shown that the ocean is highly variable on timescales that are somewhat longer than those of the atmosphere and space scales of tensof kilometers, much smaller than those of the atmosphere. Even before the fullnessof ocean variability was known, Stommel (1955) likened the oceanographic obser-vational approach to meteorologists observing the atmosphere using ‘‘half a dozenautomobiles and kites to which air sounding instruments were attached and doing alltheir work on dark moonless nights when they could not see what was happening intheir medium.’’
The advent of satellite navigation and communication made possible a class of small,inexpensive instrument platforms that are changing the way the ocean is observed.Much as satellite remote sensing led to a quantum jump in our understanding of theocean’s surface, these new platforms provide a view of the interior ocean with muchhigher spatial and temporal resolution than is possible with conventional shipboardand moored instruments. Increased resolution is important in solving problems fromthe management of coastal resources to the prediction of climate change. Surfacedrifters are now mapping the changing surface circulation and reporting global seasurface temperatures as they vary on mesoscale and climatic time scales (Niiler, 2001).Autonomous profiling floats (Davis et al., 1991) have already shown an ability to returnroutine real-time observations from all parts of the ice-free ocean at a low cost madepossible by minimal dependence on research vessels. The international Argo program(Wilson, 2000) is now building up a global array of 3000 profiling floats, each of whichwill report an ocean profile every 10 days providing a synoptic view of the oceanmuch as the World Weather Watch provides global weather information. A featureof both surface drifters and profiling floats is that they drift with the ocean currents,
37
“chap03” — 2002/8/3 — 18:25 — page 38 — #2
38 RUSS E. DAVIS et al.
allowing the reliable measurement of these currents but making the location of thesemeasurements uncontrollable and difficult to predict.
Even before the first autonomous floats were operating, Stommel (1989) envisioneda world ocean observing system based on ‘‘a fleet of small neutrally-buoyant floatscalled Slocums’’ that ‘‘migrate vertically through the ocean by changing ballast, andthey can be steered horizontally by gliding on wings at about a 35 degrees angle. . . During brief moments at the surface, they transmit their accumulated data andreceive instructions . . . Their speed is generally about 0.5 knot.’’ This chapter describesa class of autonomous underwater vehicles (AUVs) that are realizing Stommel’s vision.Because they can be constructed for the cost of a few days ship time, can be reused, arelight enough to be handled from small boats, can operate for a year or more while cov-ering thousands of kilometers, and report measurements almost immediately whilebeing directed from shore, these vehicles can make subsurface ocean observationsat a fraction of the costs of conventional instrument platforms. This cost reductionmakes feasible a proliferation of instruments to substantially increase spatial and tem-poral density of ocean observations and, consequently, the range of scales that can beresolved.
The vehicles described here, autonomous underwater gliders, change their volumeand buoyancy to cycle vertically in the ocean and use lift on wings to convert thisvertical velocity into forward motion. Wing-lift drives forward motion both as thevehicles ascend and descend, so they follow sawtooth paths. The shallowest pointson the sawtooth are at the surface where satellite navigation and communication arecarried out, eliminating the need for in-situ tracking networks. Four basic samplingmodes for gliders have presented themselves. If forward motion is used to counterambient currents and maintain position, gliders can sample virtually as a verticalarray of moored instruments with a single sensor package. Moving from place toplace yields a highly resolved section, although the slowness of advance mixes timeand spatial variability. Gliders controlled remotely from a research vessel can forman array to describe the spatial and temporal context in which intensive shipboardmeasurements were embedded. Finally, the long operating lives and ability to sampledensely suit gliders to missions where unusual events are sought and then studiedintensely when found. With ranges of thousands of kilometers, durations of O (year),and control and global data relay through satellite many new missions are anticipated.
This class of vehicles is distinguished by four inter-related operating characteristics:the use of buoyancy propulsion, a sawtooth operating pattern, long duration, andrelatively slow operating speeds. At a fundamental level, generating forward motionfrom wings is similar to propulsion by propellor thrust. In gliders, electric or thermalenergy is converted to pressure--volume work to change vehicle volume and generaterelative motion that is converted to forward thrust by wing lift. In propellor vehicles,internal energy is converted to shaft rotation that provides the relative motion so thatpropellor blades can generate lift and vehicle propulsion thrust. Buoyancy propulsionis well suited to the performance objectives of this class of vehicle. It provides thevertical sampling needed in the stratified ocean where variability along a horizontalpath often results mainly from vertical migration of patterns. Typical glide slopes, ofthe order 1:4, are much steeper than the slope of oceanic distributions, so each leg ofa glider sawtooth produces the equivalent of an ocean profile. As Stommel envisioned,a primary objective of gliders is to observe ocean variability, which spans the energetic
“chap03” — 2002/8/3 — 18:25 — page 39 — #3
AUTONOMOUS BUOYANCY-DRIVEN UNDERWATER GLIDERS 39
time scales from days to seasons that characterize meteorologically forced, mesoscale,and interannual variability. This demands operational lifetimes of months that requireefficient conversion of energy to motion and minimization of hydrodynamic drag.Much of AUV drag is caused by forward motion of the hull and can be minimizedonly by streamlining and operating at slow speeds. The significant drag associatedwith lift can be reduced by using long, slender wings (or propellor blades) with highlift-to-drag ratios (see Chapter 7). While the high power-to-volume ratios neededfor high speeds are easier to achieve with propellor systems, high lift-to-drag andhigh efficiency is more easily achieved in the simpler hydrodynamic environmentof wings.
The underwater gliders discussed here were designed to fit into a particular sam-pling niche. They are small enough to be handled by a crew of 1--3 on small boatswithout the power assistance generally available on research or survey vessels. They areinexpensive enough that individual projects might afford several -- this translates toconstruction costs equal to that of a very few days of research ship time or a small moor-ing. They can sample frequently enough to resolve phenomena such as internal waves,fronts, the diurnal cycle, coastal variability and biological patchiness -- spanning depthranges of O (1 km) in a few hours requires vertical speeds of O (0.1 m s−1). Collectinglong time series is made feasible by amortizing the costs of deployment/recovery overlong operational durations of O (year). A high operating speed would, of course, bedesirable, but this conflicts with the primary goals of low cost, small size and long dura-tion. Yet, if gliders are to maintain station or occupy prescribed sections they must haveoperating speeds that are at least comparable to typical sustained large-scale currentsaveraged over the glider’s operating depth. Localized currents may exceed 1 m s−1
while currents of O (0.2 m s−1) are common. Depth-averaged currents are generallyweaker than surface currents and gliders can operate in localized strong currents bydrifting downstream as they cross and then make up lost ground in parallel regionsof weak flow. Nevertheless, long periods operating at O (0.2 m s−1) are needed andhigher peak speeds would expand the operating area. Accurate on-surface navigation,the ability to accept simple commands from shore and to relay kilobytes of data toshore, reliable control of gliding performance and the ability to process data in situwere additional design requirements.
The functional design goals roughly translate to:
• endurance of O (year) at operating speeds of O (0.2 m s−1) and vertical velocitiesof O (0.1 m s−1);
• mass of O (50 kg), length of O (2 m), and maximum operating depths fromO (100 m) to O (1,000 m);
• GPS navigation, an ability to receive simple commands and transmit kilobytesper day of data, and PC-level internal data processing; and
• construction cost of O ($50,000) and refueling cost of O ($3,000).
The technology developed to meet these objectives is very new. In Section 2, wedescribe four field-tested gliders, none of which was operational much before theyear 2000. Each glider embodies a particular set of solutions to the major design chal-lenges and evaluation of these solutions is not yet complete. It is likely that differentcombinations of features will appear in future vehicles. For this reason, the discussion
“chap03” — 2002/8/3 — 18:25 — page 40 — #4
40 RUSS E. DAVIS et al.
in Section 3 focuses on specific design challenges and comparison of how they havebeen addressed. Section 4 describes observations from a few glider operations to givea flavor for what can be accomplished. This chapter concludes with some thoughtson suitable sensors and the future.
3.2 THE GLIDERS OF 2001
Twenty years after Stommel’s futuristic article anticipating Slocums (named forJoshua Slocum, the first solo global circumnavigator), there exist three ocean-provenelectric-powered gliders and a field-tested thermal-powered glider. The Universityof Washington (UW) ‘‘Seaglider’’ and Scripps Institution of Oceanography (SIO)‘‘Spray’’ ( Joshua Slocum’s boat was named ‘‘Spray’’) are electric-powered vehicles opti-mized for use in the deep ocean where long duration is paramount. Webb ResearchCorp (WRC) optimized ‘‘Slocum Battery’’ for missions in shallow coastal environmentsand ‘‘Slocum Thermal’’ for long duration missions in waters with a well-developedthermocline.
3.2.1 Spray and Slocum Battery
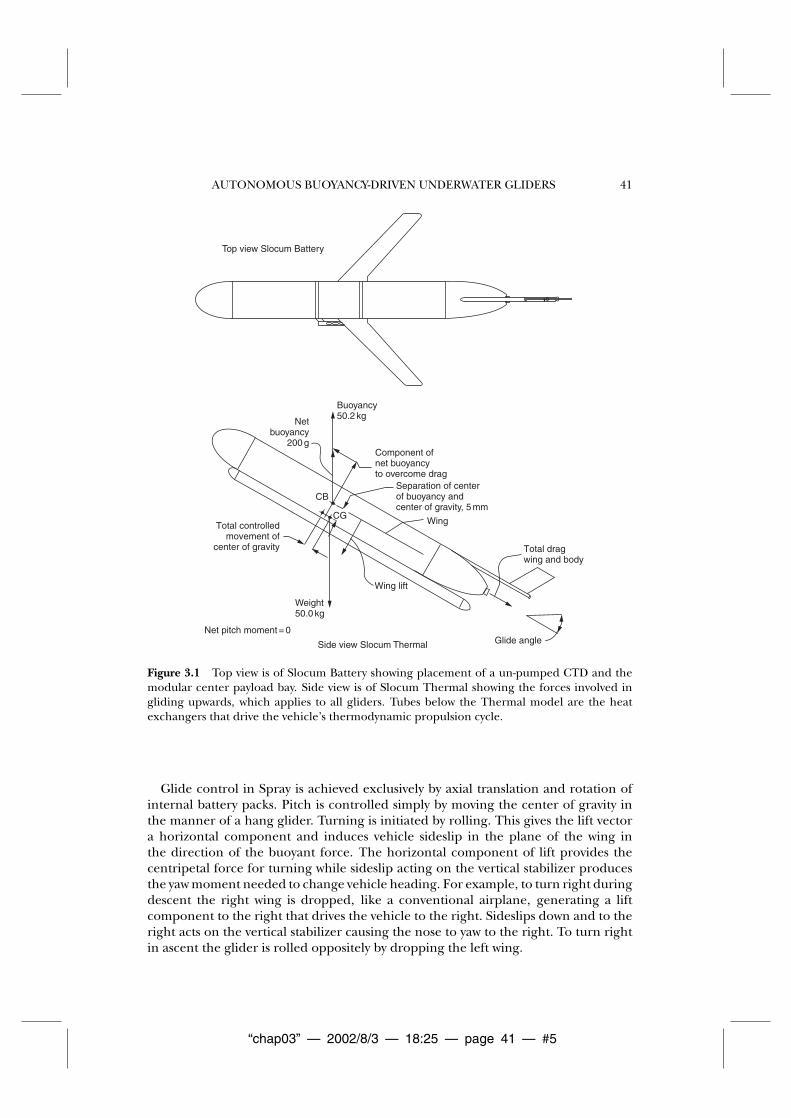
Slocum Battery (Webb et al., 2001) and Spray (Sherman et al., 2001) are the sim-plest gliders described here. Both employ battery-powered buoyancy engines andaluminium pressure hulls that are shaped for low hydrodynamic drag. Figure 3.1shows Slocum and the forces involved in gliding. Figure 3.6 is a photograph of Slocum.Spray is shown in Figures 3.2 and 3.3.
Slocum Battery is optimized for shallow-water coastal operation, where rapid turn-ing and vertical velocity changes are needed. It has a shallow pressure rating and usesa large-volume single-stroke pump to push water in and out of a port in the nose forrapid volume control. This pump is more efficient in shallow operation than are thepumps designed for deep operation. Primary pitch control is achieved by the move-ment of water for buoyancy control and pitch is trimmed by moving internal mass.An operable rudder controls the turning rate while maintaining a level attitude foran acoustic altimeter. Antennas are housed in a vertical stabilizer that is raised abovethe surface when the vehicle is pitched forward for navigation or communication.Pitch moment and surface buoyancy are augmented by inflating an airbladder at thesurface. Sensors are mounted in a modular center payload bay.
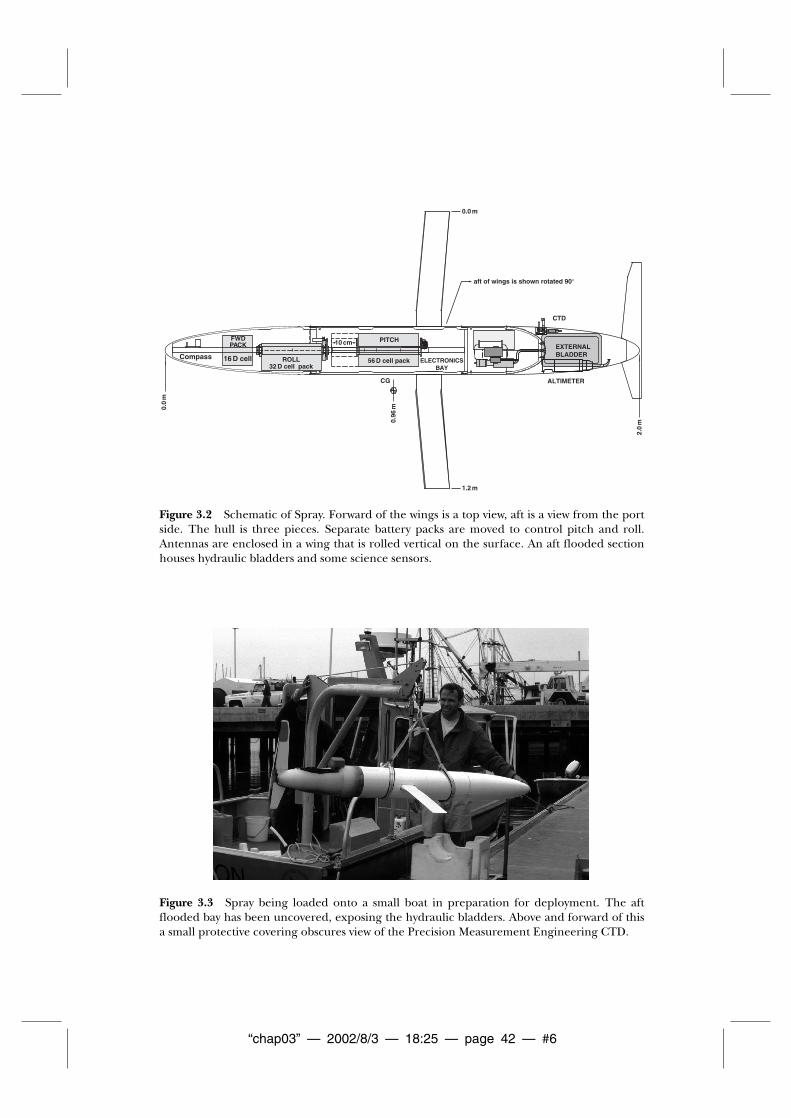
Spray is optimized for long-duration, long-range, and deep-ocean use where theemphasis is on energy efficiency. The hull employs a finer entry shape than the SlocumBattery glider hull, which has about 50% higher drag (Sherman et al., 2001). Sprayemploys a high-pressure wobble-plate reciprocating pump and external bladders inthe same hydraulic configuration as ALACE floats (Davis et al., 1991). GPS and satellitecommunication antennas are housed in a wing that is rolled vertical during navigationand communication. The vertical stabilizer houses an emergency-recovery antenna.Scientific sensors may be mounted on the hull (as is the CTD in Figure 3.2) or aftof the pressure hull in the flooded compartment that supports the vertical stabilizer.Extra room for sensors can be obtained by lengthening this compartment.
“chap03” — 2002/8/3 — 18:25 — page 41 — #5
AUTONOMOUS BUOYANCY-DRIVEN UNDERWATER GLIDERS 41
Top view Slocum Battery
Side view Slocum Thermal
Net pitch moment = 0
Buoyancy 50.2 kg
Netbuoyancy
200 g
Weight 50.0 kg
Component of net buoyancy to overcome drag
Separation of centerof buoyancy and center of gravity, 5 mm
Wing
CB
CG
Wing lift
Total controlled movement of
center of gravity Total drag wing and body
Glide angle
Figure 3.1 Top view is of Slocum Battery showing placement of a un-pumped CTD and themodular center payload bay. Side view is of Slocum Thermal showing the forces involved ingliding upwards, which applies to all gliders. Tubes below the Thermal model are the heatexchangers that drive the vehicle’s thermodynamic propulsion cycle.
Glide control in Spray is achieved exclusively by axial translation and rotation ofinternal battery packs. Pitch is controlled simply by moving the center of gravity inthe manner of a hang glider. Turning is initiated by rolling. This gives the lift vectora horizontal component and induces vehicle sideslip in the plane of the wing inthe direction of the buoyant force. The horizontal component of lift provides thecentripetal force for turning while sideslip acting on the vertical stabilizer producesthe yaw moment needed to change vehicle heading. For example, to turn right duringdescent the right wing is dropped, like a conventional airplane, generating a liftcomponent to the right that drives the vehicle to the right. Sideslips down and to theright acts on the vertical stabilizer causing the nose to yaw to the right. To turn rightin ascent the glider is rolled oppositely by dropping the left wing.
“chap03” — 2002/8/3 — 18:25 — page 42 — #6
EXTERNAL BLADDER
10 cm
56 D cell packROLL 32 D cell pack
aft of wings is shown rotated 90°
PITCHFWD PACK
Compass ELECTRONICS BAY
0.0
m
0.96
m
2.0
m
16 D cell
0.0 m
1.2 m
ALTIMETER
CTD
CG
Figure 3.2 Schematic of Spray. Forward of the wings is a top view, aft is a view from the portside. The hull is three pieces. Separate battery packs are moved to control pitch and roll.Antennas are enclosed in a wing that is rolled vertical on the surface. An aft flooded sectionhouses hydraulic bladders and some science sensors.
Figure 3.3 Spray being loaded onto a small boat in preparation for deployment. The aftflooded bay has been uncovered, exposing the hydraulic bladders. Above and forward of thisa small protective covering obscures view of the Precision Measurement Engineering CTD.
“chap03” — 2002/8/3 — 18:25 — page 43 — #7
AUTONOMOUS BUOYANCY-DRIVEN UNDERWATER GLIDERS 43
3.2.2 Seaglider
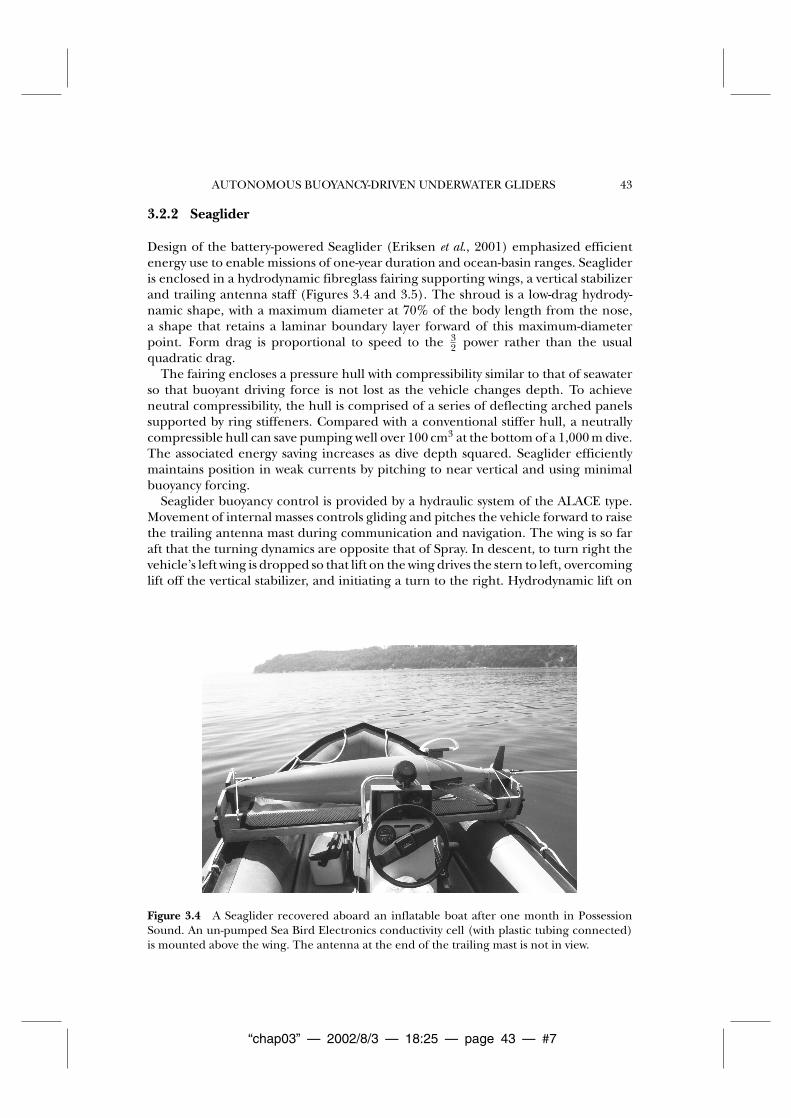
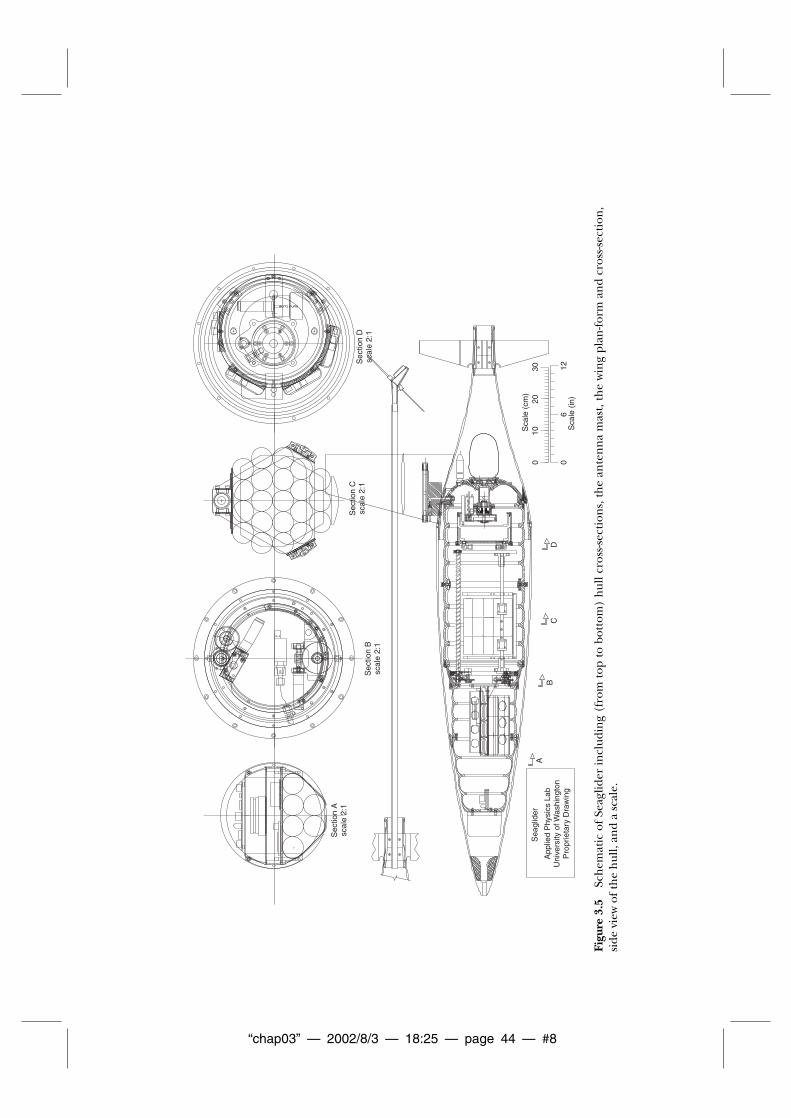
Design of the battery-powered Seaglider (Eriksen et al., 2001) emphasized efficientenergy use to enable missions of one-year duration and ocean-basin ranges. Seaglideris enclosed in a hydrodynamic fibreglass fairing supporting wings, a vertical stabilizerand trailing antenna staff (Figures 3.4 and 3.5). The shroud is a low-drag hydrody-namic shape, with a maximum diameter at 70% of the body length from the nose,a shape that retains a laminar boundary layer forward of this maximum-diameterpoint. Form drag is proportional to speed to the 3
2 power rather than the usualquadratic drag.
The fairing encloses a pressure hull with compressibility similar to that of seawaterso that buoyant driving force is not lost as the vehicle changes depth. To achieveneutral compressibility, the hull is comprised of a series of deflecting arched panelssupported by ring stiffeners. Compared with a conventional stiffer hull, a neutrallycompressible hull can save pumping well over 100 cm3 at the bottom of a 1,000 m dive.The associated energy saving increases as dive depth squared. Seaglider efficientlymaintains position in weak currents by pitching to near vertical and using minimalbuoyancy forcing.
Seaglider buoyancy control is provided by a hydraulic system of the ALACE type.Movement of internal masses controls gliding and pitches the vehicle forward to raisethe trailing antenna mast during communication and navigation. The wing is so faraft that the turning dynamics are opposite that of Spray. In descent, to turn right thevehicle’s left wing is dropped so that lift on the wing drives the stern to left, overcominglift off the vertical stabilizer, and initiating a turn to the right. Hydrodynamic lift on
Figure 3.4 A Seaglider recovered aboard an inflatable boat after one month in PossessionSound. An un-pumped Sea Bird Electronics conductivity cell (with plastic tubing connected)is mounted above the wing. The antenna at the end of the trailing mast is not in view.
“chap03” — 2002/8/3 — 18:25 — page 44 — #8
Sec
tion
A
scal
e 2:
1
Sec
tion
B
scal
e 2:
1
Sec
tion
C
scal
e 2:
1S
ectio
n D
sc
ale
2:1
Sca
le (
cm)
Sca
le (
in)
010
20
0D
CB
AA
pplie
d P
hysi
cs L
ab
Uni
vers
ity o
f Was
hing
ton
Pro
prie
tary
Dra
win
g
Sea
glid
er
61230
Figu
re3.
5Sc
hem
atic
ofSe
aglid
erin
clud
ing
(fro
mto
pto
bott
om)
hul
lcro
ss-s
ecti
ons,
the
ante
nn
am
ast,
the
win
gpl
an-fo
rman
dcr
oss-
sect
ion
,si
devi
ewof
the
hul
l,an
da
scal
e.
“chap03” — 2002/8/3 — 18:25 — page 45 — #9
AUTONOMOUS BUOYANCY-DRIVEN UNDERWATER GLIDERS 45
the sideslipping hull produces the centripetal force to curve the course. Conversely,in ascent a roll to the left produces a left turn.
3.2.3 Slocum Thermal
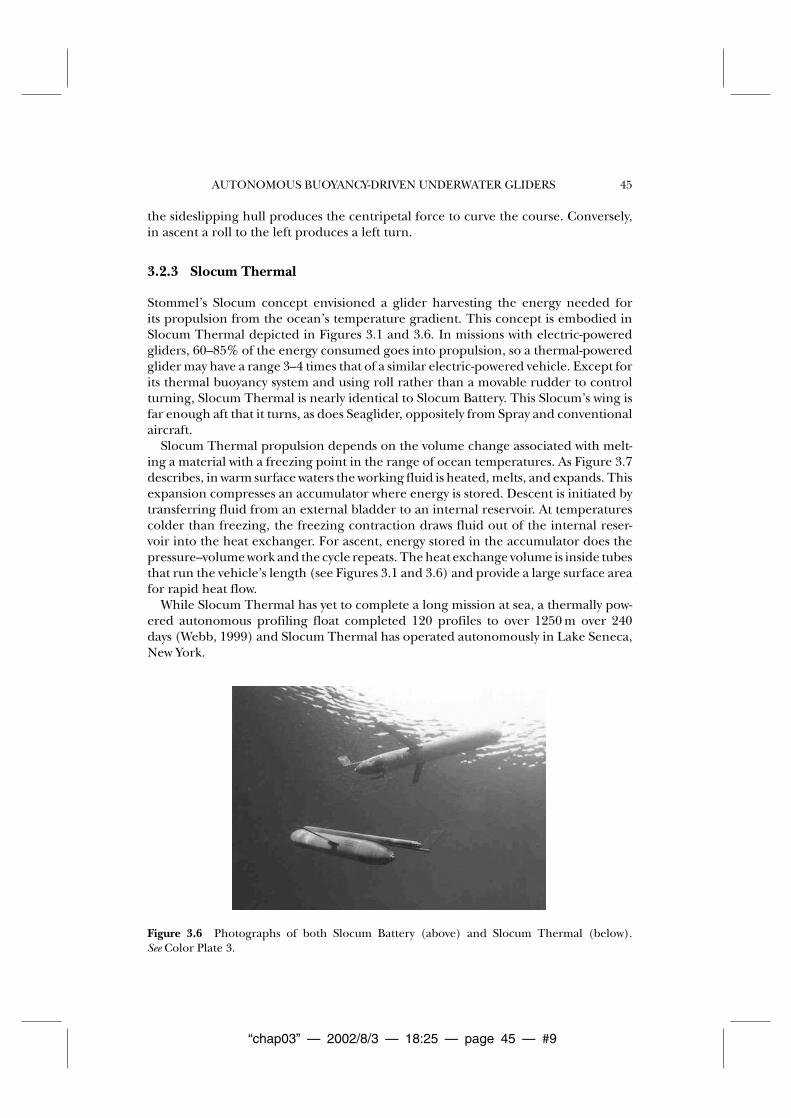
Stommel’s Slocum concept envisioned a glider harvesting the energy needed forits propulsion from the ocean’s temperature gradient. This concept is embodied inSlocum Thermal depicted in Figures 3.1 and 3.6. In missions with electric-poweredgliders, 60--85% of the energy consumed goes into propulsion, so a thermal-poweredglider may have a range 3--4 times that of a similar electric-powered vehicle. Except forits thermal buoyancy system and using roll rather than a movable rudder to controlturning, Slocum Thermal is nearly identical to Slocum Battery. This Slocum’s wing isfar enough aft that it turns, as does Seaglider, oppositely from Spray and conventionalaircraft.
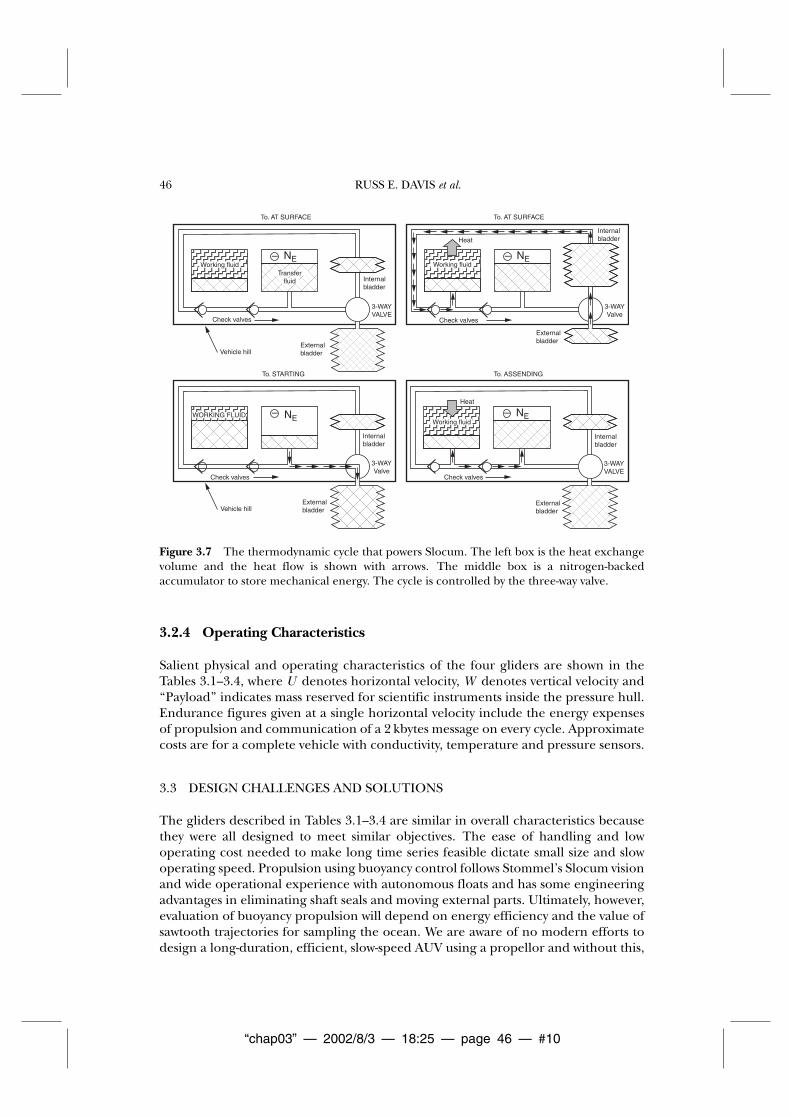
Slocum Thermal propulsion depends on the volume change associated with melt-ing a material with a freezing point in the range of ocean temperatures. As Figure 3.7describes, in warm surface waters the working fluid is heated, melts, and expands. Thisexpansion compresses an accumulator where energy is stored. Descent is initiated bytransferring fluid from an external bladder to an internal reservoir. At temperaturescolder than freezing, the freezing contraction draws fluid out of the internal reser-voir into the heat exchanger. For ascent, energy stored in the accumulator does thepressure--volume work and the cycle repeats. The heat exchange volume is inside tubesthat run the vehicle’s length (see Figures 3.1 and 3.6) and provide a large surface areafor rapid heat flow.
While Slocum Thermal has yet to complete a long mission at sea, a thermally pow-ered autonomous profiling float completed 120 profiles to over 1250 m over 240days (Webb, 1999) and Slocum Thermal has operated autonomously in Lake Seneca,New York.
Figure 3.6 Photographs of both Slocum Battery (above) and Slocum Thermal (below).See Color Plate 3.
“chap03” — 2002/8/3 — 18:25 — page 46 — #10
46 RUSS E. DAVIS et al.
– NE
To. AT SURFACE
Check valves
Vehicle hillExternalbladder
Internalbladder
3-WAYVALVE
– NE
To. STARTING
Check valves
Vehicle hillExternalbladder
Internalbladder
3-WAYValve
– NE
To. ASSENDING
Check valves
Externalbladder
Internalbladder
3-WAYVALVE
– NE
To. AT SURFACE
Check valves
Externalbladder
Internalbladder
3-WAYValve
Heat
Heat
Transferfluid
Working fluid
WORKING FLUIDWorking fluid
Working fluid
Figure 3.7 The thermodynamic cycle that powers Slocum. The left box is the heat exchangevolume and the heat flow is shown with arrows. The middle box is a nitrogen-backedaccumulator to store mechanical energy. The cycle is controlled by the three-way valve.
3.2.4 Operating Characteristics
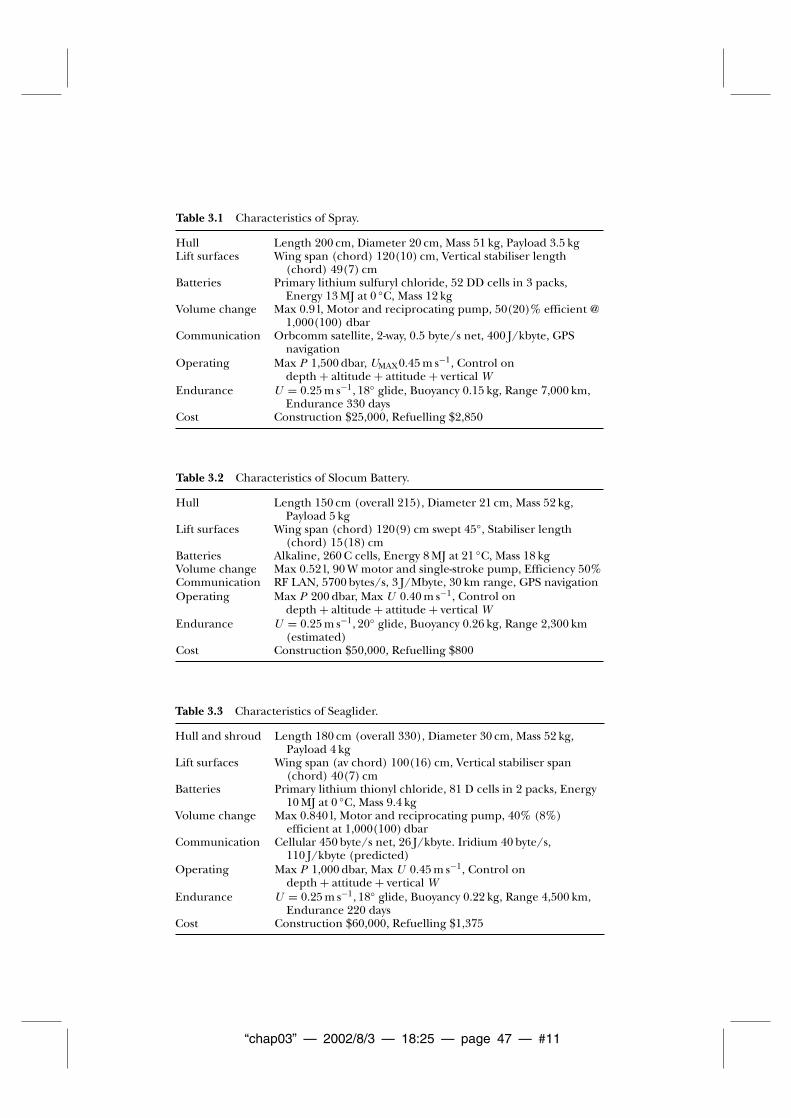
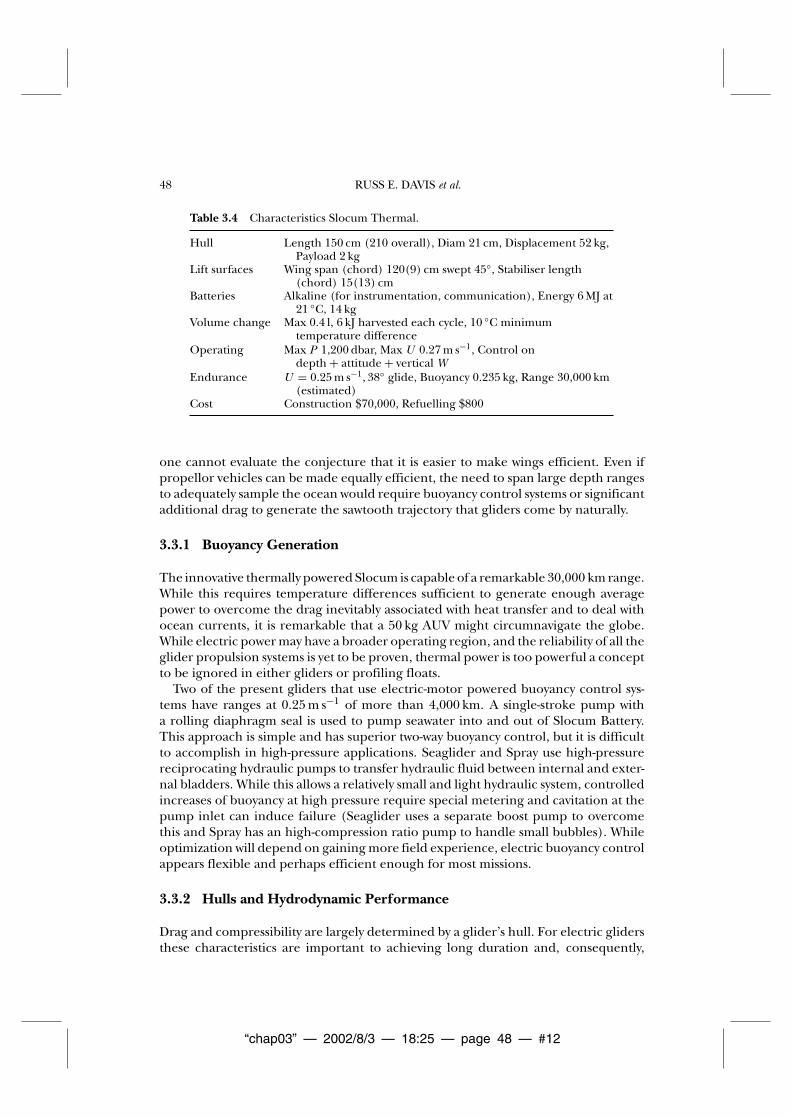
Salient physical and operating characteristics of the four gliders are shown in theTables 3.1--3.4, where U denotes horizontal velocity, W denotes vertical velocity and‘‘Payload’’ indicates mass reserved for scientific instruments inside the pressure hull.Endurance figures given at a single horizontal velocity include the energy expensesof propulsion and communication of a 2 kbytes message on every cycle. Approximatecosts are for a complete vehicle with conductivity, temperature and pressure sensors.
3.3 DESIGN CHALLENGES AND SOLUTIONS
The gliders described in Tables 3.1--3.4 are similar in overall characteristics becausethey were all designed to meet similar objectives. The ease of handling and lowoperating cost needed to make long time series feasible dictate small size and slowoperating speed. Propulsion using buoyancy control follows Stommel’s Slocum visionand wide operational experience with autonomous floats and has some engineeringadvantages in eliminating shaft seals and moving external parts. Ultimately, however,evaluation of buoyancy propulsion will depend on energy efficiency and the value ofsawtooth trajectories for sampling the ocean. We are aware of no modern efforts todesign a long-duration, efficient, slow-speed AUV using a propellor and without this,
“chap03” — 2002/8/3 — 18:25 — page 47 — #11
Table 3.1 Characteristics of Spray.
Hull Length 200 cm, Diameter 20 cm, Mass 51 kg, Payload 3.5 kgLift surfaces Wing span (chord) 120(10) cm, Vertical stabiliser length
(chord) 49(7) cmBatteries Primary lithium sulfuryl chloride, 52 DD cells in 3 packs,
Energy 13 MJ at 0 ◦C, Mass 12 kgVolume change Max 0.9 l, Motor and reciprocating pump, 50(20)% efficient @
1,000(100) dbarCommunication Orbcomm satellite, 2-way, 0.5 byte/s net, 400 J/kbyte, GPS
navigationOperating Max P 1,500 dbar, UMAX0.45 m s−1, Control on
depth + altitude + attitude + vertical WEndurance U = 0.25 m s−1, 18◦ glide, Buoyancy 0.15 kg, Range 7,000 km,
Endurance 330 daysCost Construction $25,000, Refuelling $2,850
Table 3.2 Characteristics of Slocum Battery.
Hull Length 150 cm (overall 215), Diameter 21 cm, Mass 52 kg,Payload 5 kg
Lift surfaces Wing span (chord) 120(9) cm swept 45◦, Stabiliser length(chord) 15(18) cm
Batteries Alkaline, 260 C cells, Energy 8 MJ at 21 ◦C, Mass 18 kgVolume change Max 0.52 l, 90 W motor and single-stroke pump, Efficiency 50%Communication RF LAN, 5700 bytes/s, 3 J/Mbyte, 30 km range, GPS navigationOperating Max P 200 dbar, Max U 0.40 m s−1, Control on
depth + altitude + attitude + vertical WEndurance U = 0.25 m s−1, 20◦ glide, Buoyancy 0.26 kg, Range 2,300 km
(estimated)Cost Construction $50,000, Refuelling $800
Table 3.3 Characteristics of Seaglider.
Hull and shroud Length 180 cm (overall 330), Diameter 30 cm, Mass 52 kg,Payload 4 kg
Lift surfaces Wing span (av chord) 100(16) cm, Vertical stabiliser span(chord) 40(7) cm
Batteries Primary lithium thionyl chloride, 81 D cells in 2 packs, Energy10 MJ at 0 ◦C, Mass 9.4 kg
Volume change Max 0.840 l, Motor and reciprocating pump, 40% (8%)efficient at 1,000(100) dbar
Communication Cellular 450 byte/s net, 26 J/kbyte. Iridium 40 byte/s,110 J/kbyte (predicted)
Operating Max P 1,000 dbar, Max U 0.45 m s−1, Control ondepth + attitude + vertical W
Endurance U = 0.25 m s−1, 18◦ glide, Buoyancy 0.22 kg, Range 4,500 km,Endurance 220 days
Cost Construction $60,000, Refuelling $1,375
“chap03” — 2002/8/3 — 18:25 — page 48 — #12
48 RUSS E. DAVIS et al.
Table 3.4 Characteristics Slocum Thermal.
Hull Length 150 cm (210 overall), Diam 21 cm, Displacement 52 kg,Payload 2 kg
Lift surfaces Wing span (chord) 120(9) cm swept 45◦, Stabiliser length(chord) 15(13) cm
Batteries Alkaline (for instrumentation, communication), Energy 6 MJ at21 ◦C, 14 kg
Volume change Max 0.4 l, 6 kJ harvested each cycle, 10 ◦C minimumtemperature difference
Operating Max P 1,200 dbar, Max U 0.27 m s−1, Control ondepth + attitude + vertical W
Endurance U = 0.25 m s−1, 38◦ glide, Buoyancy 0.235 kg, Range 30,000 km(estimated)
Cost Construction $70,000, Refuelling $800
one cannot evaluate the conjecture that it is easier to make wings efficient. Even ifpropellor vehicles can be made equally efficient, the need to span large depth rangesto adequately sample the ocean would require buoyancy control systems or significantadditional drag to generate the sawtooth trajectory that gliders come by naturally.
3.3.1 Buoyancy Generation
The innovative thermally powered Slocum is capable of a remarkable 30,000 km range.While this requires temperature differences sufficient to generate enough averagepower to overcome the drag inevitably associated with heat transfer and to deal withocean currents, it is remarkable that a 50 kg AUV might circumnavigate the globe.While electric power may have a broader operating region, and the reliability of all theglider propulsion systems is yet to be proven, thermal power is too powerful a conceptto be ignored in either gliders or profiling floats.
Two of the present gliders that use electric-motor powered buoyancy control sys-tems have ranges at 0.25 m s−1 of more than 4,000 km. A single-stroke pump witha rolling diaphragm seal is used to pump seawater into and out of Slocum Battery.This approach is simple and has superior two-way buoyancy control, but it is difficultto accomplish in high-pressure applications. Seaglider and Spray use high-pressurereciprocating hydraulic pumps to transfer hydraulic fluid between internal and exter-nal bladders. While this allows a relatively small and light hydraulic system, controlledincreases of buoyancy at high pressure require special metering and cavitation at thepump inlet can induce failure (Seaglider uses a separate boost pump to overcomethis and Spray has an high-compression ratio pump to handle small bubbles). Whileoptimization will depend on gaining more field experience, electric buoyancy controlappears flexible and perhaps efficient enough for most missions.
3.3.2 Hulls and Hydrodynamic Performance
Drag and compressibility are largely determined by a glider’s hull. For electric glidersthese characteristics are important to achieving long duration and, consequently,
“chap03” — 2002/8/3 — 18:25 — page 49 — #13
AUTONOMOUS BUOYANCY-DRIVEN UNDERWATER GLIDERS 49
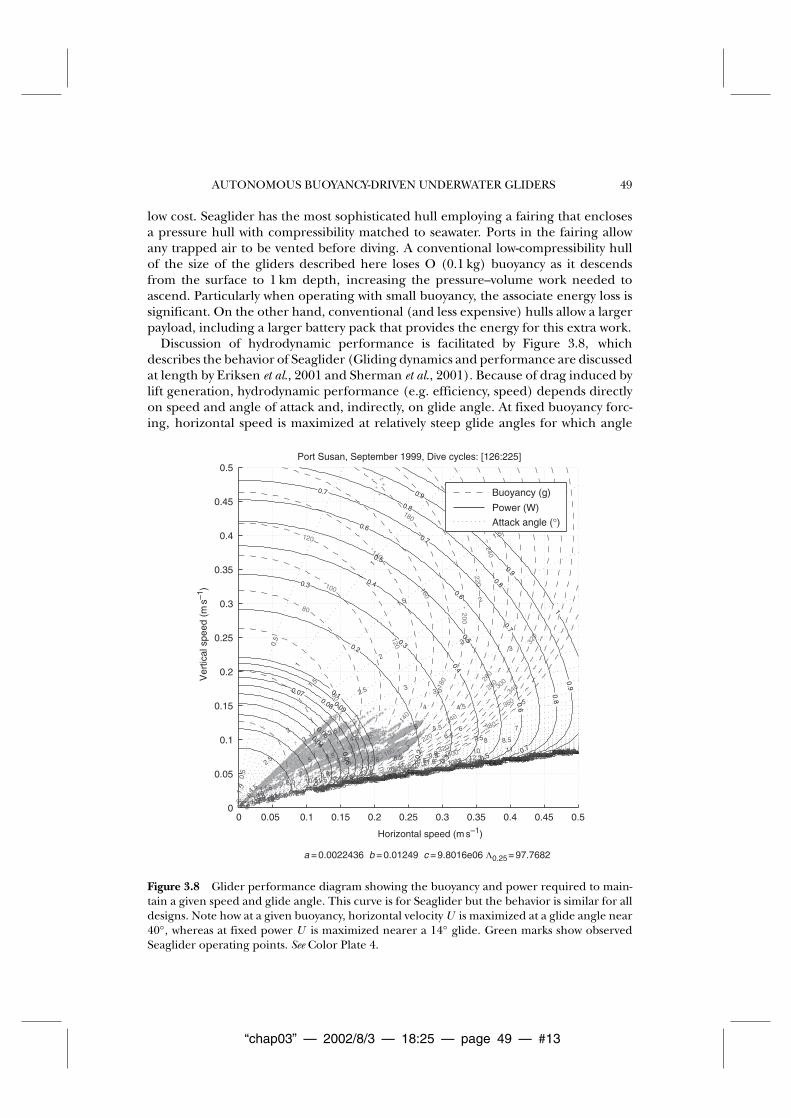
low cost. Seaglider has the most sophisticated hull employing a fairing that enclosesa pressure hull with compressibility matched to seawater. Ports in the fairing allowany trapped air to be vented before diving. A conventional low-compressibility hullof the size of the gliders described here loses O (0.1 kg) buoyancy as it descendsfrom the surface to 1 km depth, increasing the pressure--volume work needed toascend. Particularly when operating with small buoyancy, the associate energy loss issignificant. On the other hand, conventional (and less expensive) hulls allow a largerpayload, including a larger battery pack that provides the energy for this extra work.
Discussion of hydrodynamic performance is facilitated by Figure 3.8, whichdescribes the behavior of Seaglider (Gliding dynamics and performance are discussedat length by Eriksen et al., 2001 and Sherman et al., 2001). Because of drag induced bylift generation, hydrodynamic performance (e.g. efficiency, speed) depends directlyon speed and angle of attack and, indirectly, on glide angle. At fixed buoyancy forc-ing, horizontal speed is maximized at relatively steep glide angles for which angle
0 0.05 0.1 0.15 0.2 0.25 0.3 0.35 0.4 0.45 0.50
0.05
0.1
0.15
0.2
0.25
0.3
0.35
0.4
0.45
0.5Port Susan, September 1999, Dive cycles: [126:225]
Ver
tical
spe
ed (
ms–1
)
Horizontal speed (m s–1)
20
20
20
40
40
40
60
60
60
60
80
80
80
80
100
100
100
100
120
120
120120
120
140
140
140
140
160
160
160
160
180
180
180
180
180
200
200
200
200
220
220
220
220
240
240
240
240
260
260 260
260
280
280 280
280
300
300 300
300
320
320
320
320
340
340 340
360
360360
380
380
380400
400
0.01
0.01
0.01
0.02
0.02
0.03
0.03
0.03
0.04
0.04
0.04
0.05
0.05
0.05
0.06
0.06
0.06
0.07
0.07
0.07
0.07
0.08
0.08
0.08
0.09
0.09
0.09
0.1
0.1
0.1
0.2
0.2
0.2
0.3
0.3
0.3 0.3
0.4
0.4
0.4
0.5
0.5
0.50.5
0.6
0.6
0.6
0.6
0.7
0.7
0.7
0.7
0.8
0.8
0.8
0.8
0.9
0.9
0.9
0.9
1
1
0.5
0.5
0.5
0.5
0.5
1
1
1
1
1
1
1.5
1.5
1.5
1.5 1.5
1.5
1.5
2
2
2
2
2
2
2.5
2.5
2.5
2.5
2.5
2.5
3
3
3
3
3
3
3.5
3.5
3.5
3.5
3.5
3.5
4
4
4
4
4
4
4.5
4.5
4.5 4.5
4.5
4.5
5
5
5
5
5
5
5.5
5.5
5.5
5.5
5.5
5.5
6
6
6 6
6
6
6.5
6.5
6.5
6.5
6.5
6.5
7
7
7
7
7
7
7.5
7.5
7.5 7.5
7.5
7.5
8
8
8 8
8
8
8.5
8.5
8.5
8.5
8.5
8.5 9
9
9
9
9
9 9.5
9.5
9.5
9.5
9.5
9.5 10
10
10 10
10
1010.5
10.5
10.5
10.5
10.5
11
11
11 11
11
1111.5
11.5
11.5
11.5
11.5 12
12
12
12
12
1212.5
12.5
12.512.5
12.5
12.5 13
13
13
13
1313.5
13.5
13.5
13.5
13.5
14
14 14
14
1414.5
14.514.5
14.5 15
1515.5
a = 0.0022436 b = 0.01249 c = 9.8016e06 Λ0.25= 97.7682
Buoyancy (g)
Power (W)
Attack angle (°)
Figure 3.8 Glider performance diagram showing the buoyancy and power required to main-tain a given speed and glide angle. This curve is for Seaglider but the behavior is similar for alldesigns. Note how at a given buoyancy, horizontal velocity U is maximized at a glide angle near40◦, whereas at fixed power U is maximized nearer a 14◦ glide. Green marks show observedSeaglider operating points. See Color Plate 4.
“chap03” — 2002/8/3 — 18:25 — page 50 — #14
50 RUSS E. DAVIS et al.
of attack and induced drag are minimized. At fixed power, however, speed peaks ata much shallower glide angle where induced drag is significant. All the gliders weredesigned with an objective of long range, which depends on the speed to power ratio,and, consequently, they use wings with high aspect ratios and high lift to induced-dragratios.
It should be noted that the drag considerations differ somewhat between electricpropulsion, where energy is limited, and thermal propulsion, where energy is unlim-ited but power is limited by the achievable heat transfer rate. An electric glider willtypically operate near the shallow glide angle that maximizes range and at the min-imum buoyant forcing to meet speed requirements. Heat flow and thermal powerare, on the other hand, maximized by rapid cycling between depths with differingtemperatures (overall speed affects the thermal resistance very little). For this reason,thermal gliders operate at relatively steep glide angles to increase vertical velocity. Inthese conditions low hull-drag is still highly desirable, but angle of attack and induceddrag are low so that efficient, high-aspect-ratio wings are much less important thanwhen energy is limiting.
Seaglider’s uniquely shaped hull attempts to maximize the area over which theboundary layer in laminar. Spray has a conventional shape but efforts were madeto find a low drag shape. Slocum, relying on the unlimited energy available withthermal power, uses a hull shape that simplifies construction and maximizes packingefficiency. Bio-fouling may increase vehicle drag significantly, as suggested by per-formance analysis on a one-month Seaglider mission in a fjord. In light of this andother uncertainties, the conditions under which each approach to hull design is tobe preferred remains to be found through field experience.
3.3.3 Communication
Accurate navigation, the ability to transmit O(kilobyte) datasets quickly, and the abilityto receive short messages adjusting operation are essential to autonomous operation.All the gliders described here use GPS navigation, which meets performance objectivesadmirably. Low-earth-orbit Orbcomm satellite (Spray), radio frequency Local AreaNetwork communication (Slocum Battery) and Circuit Switched Cellular (Seaglider)communication have been used in the field, and System Argos is useful at least foremergency backup and locating. Low-earth-orbit systems have up to 5 orders greaterspeed and 3 orders better energy efficiency than Argos and additional systems (Irid-ium, Globalstar) are being implemented. These promise higher data rates and lowercommunication costs than are possible with Orbcomm. We are hopeful that at leastone satellite system will survive the present economic competition.
Maintaining antennas clear of the surface in a seaway is the main technical challengefor communication and our gliders use different systems to achieve this. Seaglider andSlocums employ trailing antenna staffs that house the needed antennas. When on thesurface these gliders pitch forward to raise these antenna staffs and Slocums employ anexternal bladder inflated by a small air pump to increase surface buoyancy and pitchmoment. Spray’s antennas are contained in a wing that is rolled vertical for navigationand communication. All systems are subject to loss of performance in high sea-statesso adequate internal storage is necessary for several days of message buffering.
“chap03” — 2002/8/3 — 18:25 — page 51 — #15
AUTONOMOUS BUOYANCY-DRIVEN UNDERWATER GLIDERS 51
3.3.4 Gliding Control
Glider control involves monitoring performance, adjusting glide angle by controllingpitch and/or buoyancy, and adjusting heading by controlling roll or (for Slocum Bat-tery) rudder position. All the gliders described here use Precision Navigation TCM2attitude sensors to sense heading, pitch and roll and pressure sensors to measuredepth and, from pressure rate, vertical velocity. Spray and Slocum measure altitudeusing an acoustic altimeter while Seaglider estimates altitude from measured gliderdepth and a digitally stored map of water depth.
A movable rudder gives Slocum Battery the tightest turning radius (approximately7 m) and allows turning without significant roll so that the acoustic altimeter, criticalin shallow-water operations, remains accurate. The other gliders, intended for deepwater, typically roll about 30◦ to achieve turning radii of 20--30 m. Because glide angleand performance are sensitively linked, gliding is generally more closely controlledthan turning. In normal gliding Spray adjusts pitch around a set point using propor-tional control on O (60 s) intervals while infrequently adjusting buoyancy to maintainvertical velocity within an operating range. Seaglider operates similarly, controllinggliding on a longer interval of O (300 s) and uses buoyancy adjustment as a pri-mary control. Both vehicles accelerate control at the minimum and maximum depthswhere buoyancy and pitch are changed significantly. Seaglider is unique in using anonboard Kalman filter to estimate currents and adjust target heading and glide angleto compensate for them.
3.3.5 Sensors
Scientific payloads for gliders are limited by size, flow disturbance, and power require-ment considerations. Sensor systems must fit within the payload fraction of O (50)-lvehicle and, because gliding involves modest buoyancy forces (∼0.2--4 N), ballast andtrim are paramount considerations. Sensors must be hydrodynamically inobtrusive,lest they spoil gliding performance by adding drag. For example, wind tunnel tests ofSeaglider demonstrated that appending a toroidal conductivity sensor with 2% of thevehicle’s frontal area added more than 25% to its drag. Streamlining can be achievedby using sensors that are small or mounted flush to the vehicle hull. Outward-lookingacoustic and optical sensors conveniently fit this requirement and have been used onthe gliders described here.
The overall power consumption of the four gliders discussed here is O (1 W). Achiev-ing this requires low-power electronics and sampling schemes that limit the duty cycleof sensors. Slow glider speeds allow sampling intervals of O (10 s) to achieve verticalresolution of O (1 m) but sensors with limited energy usage are still important tothe overall power budget. For example, sampling temperature and salinity consumesroughly 0.1 J, dissolved oxygen about 0.4 J, and fluorescence and optical backscatterabout 2 J. Glider controllers use O (0.1 W) when not in low-power sleep mode andparticularly for low throughput systems, data transmission is also a significant factorin the power budget.
Like autonomous floats, gliders achieve their economy by having moderate con-struction costs and long operational lifetimes. Achieving this economy therefore
“chap03” — 2002/8/3 — 18:25 — page 52 — #16
52 RUSS E. DAVIS et al.
requires scientific sensors that are stable over many months. The primary challengeto stability is bio-fouling. Compared with floats using Argos communication, gliderscan reduce fouling by spending little time on the surface and in the euphotic zone.Avoidance of exposure to the sea surface itself also avoids surfactants which affectconductivity sensors, so keeping instrumentation submerged while gliders communi-cate is presumably helpful. Stability of temperature, conductivity (Bacon et al., 2001;Riser and Swift, 2002) and optical sensors over many months has been achieved byprofiling floats (Davis et al., 2001), and a glider’s exposure to the euphotic zone isonly slightly worse.
3.3.6 Operating Costs
The principal operating costs of gliders are vehicle preparation (including energycost), deployment and recovery, and communication. The small size and long rangeof the gliders described here implies low logistic overhead for operations comparedto reliance on research vessels. Nearshore launch and recovery from small boats indaylight and fair weather by a crew of one or two is sufficient for glider access tomost of the ice-free ocean. Communications costs depend strongly on method. Costsfor global coverage range from O ($10/kbyte) for Orbcomm to O ($0.30/kbyte) forIridium. Battery costs are of the O ($1) per deep-ocean vertical cycle. Thus even withconstruction costs amortized over a few deployments, the operating costs for a missionreporting hundreds of multivariable samples in each of a thousand dive cycles is about$10,000, about the same as one day of research-ship time. In perspective, gliders cancollect several multivariable (e.g. temperature, salinity, velocity, oxygen, fluorescence,optical backscatter, etc.) profiles for the cost of a single expendable bathythermograph(XBT) probe.
3.4 EXAMPLES OF OBSERVATIONS
Glider technology is new and its capabilities have yet to be fully demonstrated infield experience. Nevertheless, the three battery-powered vehicles have all produceddatasets that begin to sketch out how gliders can be used. They have been success-fully used with, in various combinations, temperature, conductivity, dissolved oxygen,fluorescence and optical backscatter sensors. They have been used in single- andmulti-vehicle arrays to collect time series of up to one-month length, time series ofshort sections, and a 270 km section over 13 days. This section describes some ofthat data.
All the gliders have also been used to measure vertically averaged currents fromthe difference between dead reckoning and GPS navigation. Dead reckoning is basedmeasured headings and speed through the water based on measured vertical veloc-ity, pitch and buoyancy. A model is used to infer angle of attack from buoyancyand pitch (assuming ocean vertical velocity is negligible). With measured pitch, theangle of gliding is calculated and from this vertical velocity determines horizontalspeed through the water. Considering the main errors (vertical ocean velocities anderrors in the angle of attack), depth-average current measurements are accurate toO (1 cm s−1) over O (1 h) time intervals. When data from many depth cycles are
“chap03” — 2002/8/3 — 18:25 — page 53 — #17
AUTONOMOUS BUOYANCY-DRIVEN UNDERWATER GLIDERS 53
combined, the measurement of depth-average velocity becomes quite accurate, andwhen coupled with sections of ocean density, allows gliders to accurately estimateabsolute geostrophic currents. Thus gliders can attack the long-standing problem ofhydrography: properly referencing geostrophic shear. The velocity estimates also pro-vide accurate measurements of gliding performance. The performance figures forSpray and Seaglider given in Section 2 are based on these analyses; performance forSlocum is predicted.
3.4.1 Time Series (Virtual Moorings)
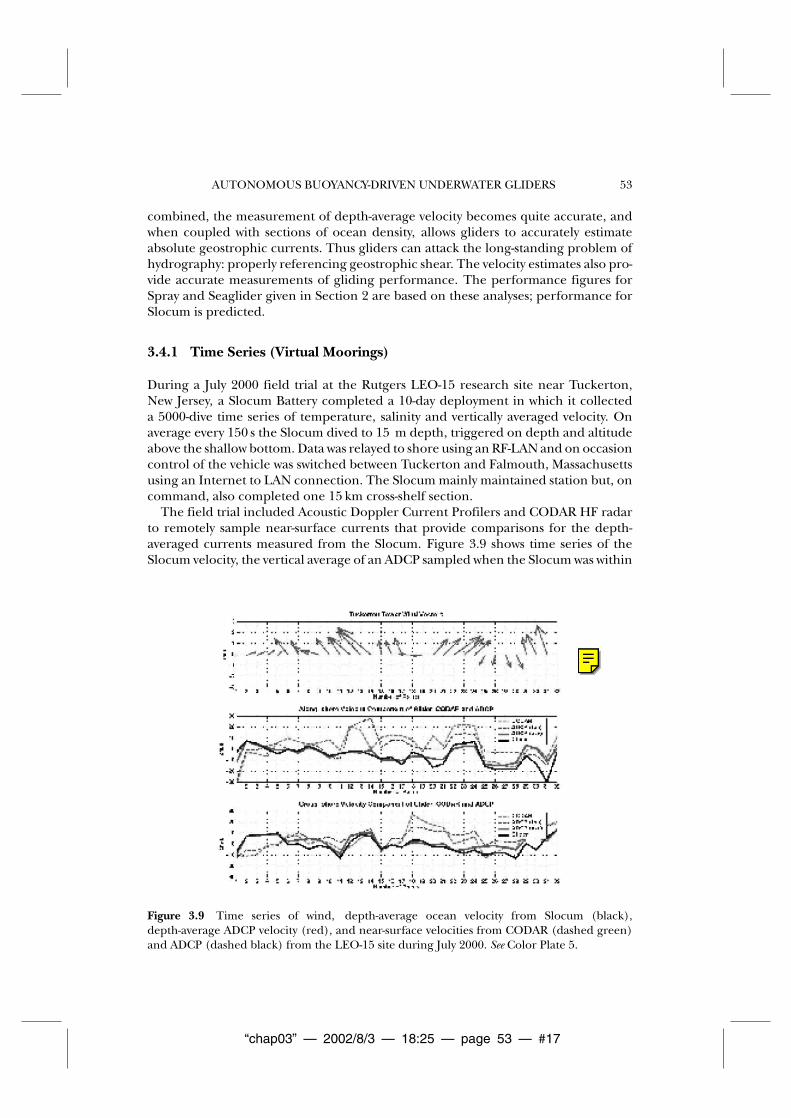
During a July 2000 field trial at the Rutgers LEO-15 research site near Tuckerton,New Jersey, a Slocum Battery completed a 10-day deployment in which it collecteda 5000-dive time series of temperature, salinity and vertically averaged velocity. Onaverage every 150 s the Slocum dived to 15 m depth, triggered on depth and altitudeabove the shallow bottom. Data was relayed to shore using an RF-LAN and on occasioncontrol of the vehicle was switched between Tuckerton and Falmouth, Massachusettsusing an Internet to LAN connection. The Slocum mainly maintained station but, oncommand, also completed one 15 km cross-shelf section.
The field trial included Acoustic Doppler Current Profilers and CODAR HF radarto remotely sample near-surface currents that provide comparisons for the depth-averaged currents measured from the Slocum. Figure 3.9 shows time series of theSlocum velocity, the vertical average of an ADCP sampled when the Slocum was within
Figure 3.9 Time series of wind, depth-average ocean velocity from Slocum (black),depth-average ADCP velocity (red), and near-surface velocities from CODAR (dashed green)and ADCP (dashed black) from the LEO-15 site during July 2000. See Color Plate 5.
“chap03” — 2002/8/3 — 18:25 — page 54 — #18
54 RUSS E. DAVIS et al.
2 km, as well as surface velocities inferred from CODAR and the ADCP’s 3-m depth bin.There is substantial vertical variability but the Slocum and vertically averaged ADCPcompare well with an rms difference similar to that between ADCP measurements at3 and 6 m at the same site or between sites separated across-shelf by 4 km. Some of theADCP-Slocum difference likely also results from lateral variability. One can imaginemore complex depth vs. time patterns that would allow measurement of the verticallyaveraged flow in vertically stacked depth ranges.
Seaglider and Spray participated in Office of Naval Research supported multi-vehicle sea trials in Monterey Bay during the summers of 1999 and 2000. In 1999the Spray prototype was virtually moored in 450 m depth in Monterey Canyon for10 days (see Sherman et al., 2001). An acoustic altimeter established the bottom ofprofiles within a few meters of the bottom. The temperature and salinity time seriesshowed internal wave motion to be bottom intensified in the canyon. In the face ofinternal-wave motions of O (15 cm s−1) and a mean current measured to be about3 cm s−1 up-canyon and to the south, surface position was maintained with standarddeviation near 500 m.
Starting in June 2000, a Seaglider was virtually moored for a month in PossessionSound, a 3 km wide fjord in western Washington. In April 2001, two Seagliders werevirtually moored at 1.5 km separation for a week across the Sound. Comparison ofvelocity computed from geostrophic shear and measured depth-averaged flow com-pared well with surface currents, showing that the exchange flow is largely geostrophic(Chiodi and Eriksen, 2002). These operations show how accurately positioned virtualmoorings can be easily established.
3.4.2 A 270-km Section
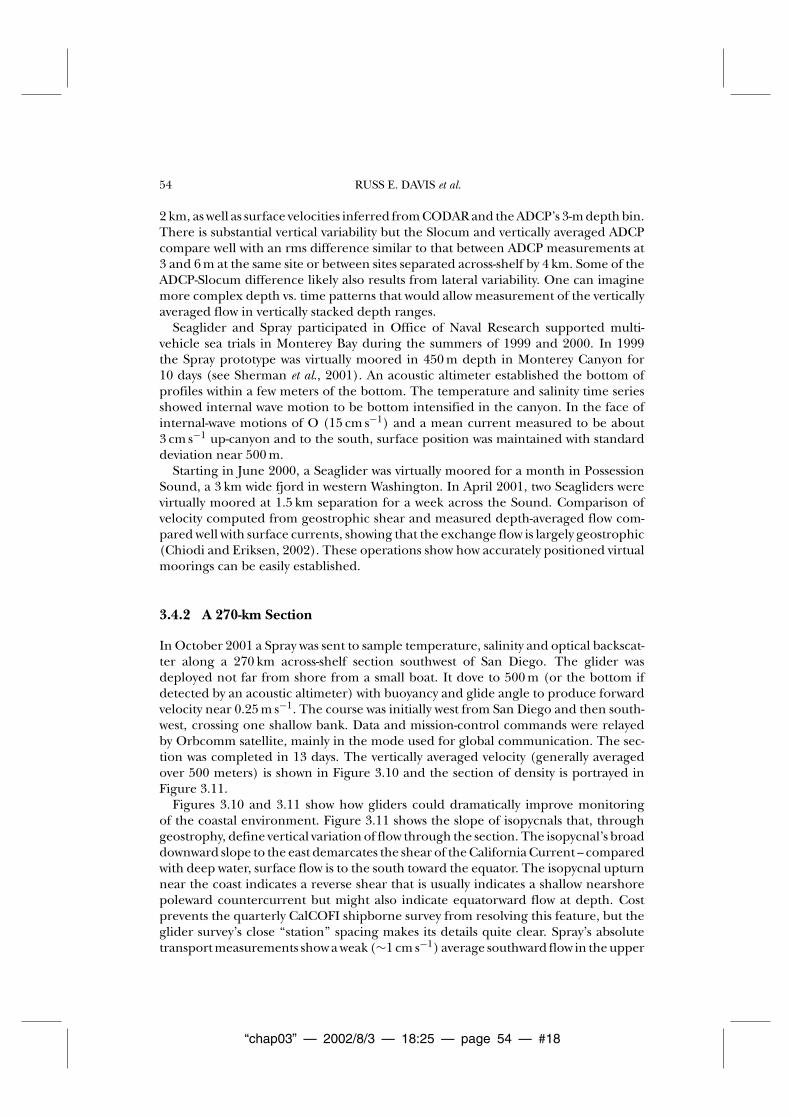
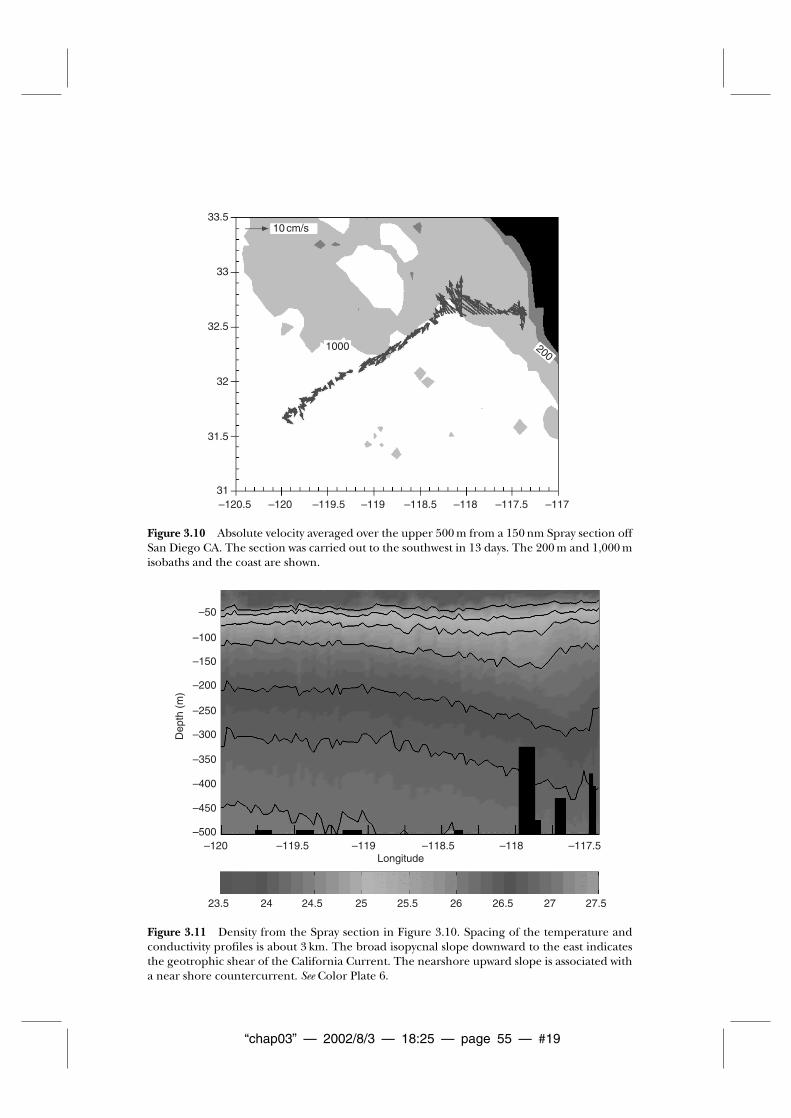
In October 2001 a Spray was sent to sample temperature, salinity and optical backscat-ter along a 270 km across-shelf section southwest of San Diego. The glider wasdeployed not far from shore from a small boat. It dove to 500 m (or the bottom ifdetected by an acoustic altimeter) with buoyancy and glide angle to produce forwardvelocity near 0.25 m s−1. The course was initially west from San Diego and then south-west, crossing one shallow bank. Data and mission-control commands were relayedby Orbcomm satellite, mainly in the mode used for global communication. The sec-tion was completed in 13 days. The vertically averaged velocity (generally averagedover 500 meters) is shown in Figure 3.10 and the section of density is portrayed inFigure 3.11.
Figures 3.10 and 3.11 show how gliders could dramatically improve monitoringof the coastal environment. Figure 3.11 shows the slope of isopycnals that, throughgeostrophy, define vertical variation of flow through the section. The isopycnal’s broaddownward slope to the east demarcates the shear of the California Current -- comparedwith deep water, surface flow is to the south toward the equator. The isopycnal upturnnear the coast indicates a reverse shear that is usually indicates a shallow nearshorepoleward countercurrent but might also indicate equatorward flow at depth. Costprevents the quarterly CalCOFI shipborne survey from resolving this feature, but theglider survey’s close ‘‘station’’ spacing makes its details quite clear. Spray’s absolutetransport measurements show a weak (∼1 cm s−1) average southward flow in the upper
“chap03” — 2002/8/3 — 18:25 — page 55 — #19
33.5
33
32.5
1000 200
10 cm/s
32
31.5
31–120.5 –119.5 –118.5 –117.5–120 –119 –118 –117
Figure 3.10 Absolute velocity averaged over the upper 500 m from a 150 nm Spray section offSan Diego CA. The section was carried out to the southwest in 13 days. The 200 m and 1,000 misobaths and the coast are shown.
–50
–100
–150
–200
–250
–300
–350
–400
–450
Dep
th (
m)
–500–120
23.5 24 25 26 2724.5 25.5 26.5 27.5
–119.5 –118.5Longitude
–119 –118 –117.5
Figure 3.11 Density from the Spray section in Figure 3.10. Spacing of the temperature andconductivity profiles is about 3 km. The broad isopycnal slope downward to the east indicatesthe geotrophic shear of the California Current. The nearshore upward slope is associated witha near shore countercurrent. See Color Plate 6.
“chap03” — 2002/8/3 — 18:25 — page 56 — #20
56 RUSS E. DAVIS et al.
500 m west of 118.5◦W as expected from the California Current. The structure of thepoleward flow, concentrated some 50 km off the coast, however, could not be antici-pated from geostrophic shear and this emphasizes the importance of glider velocitymeasurements. Highly resolved hydrographic surveys with velocity references and theability to identify barotropic and/or ageostrophic flows make gliders a powerful wayto observe the coastal ocean. For example, a pair of gliders could, at quite feasiblecost, produce a time series of sections like those in Figures 3.10 and 3.11 with anaverage sampling interval of one week.
3.4.3 Repeated Multi-vehicle Sections
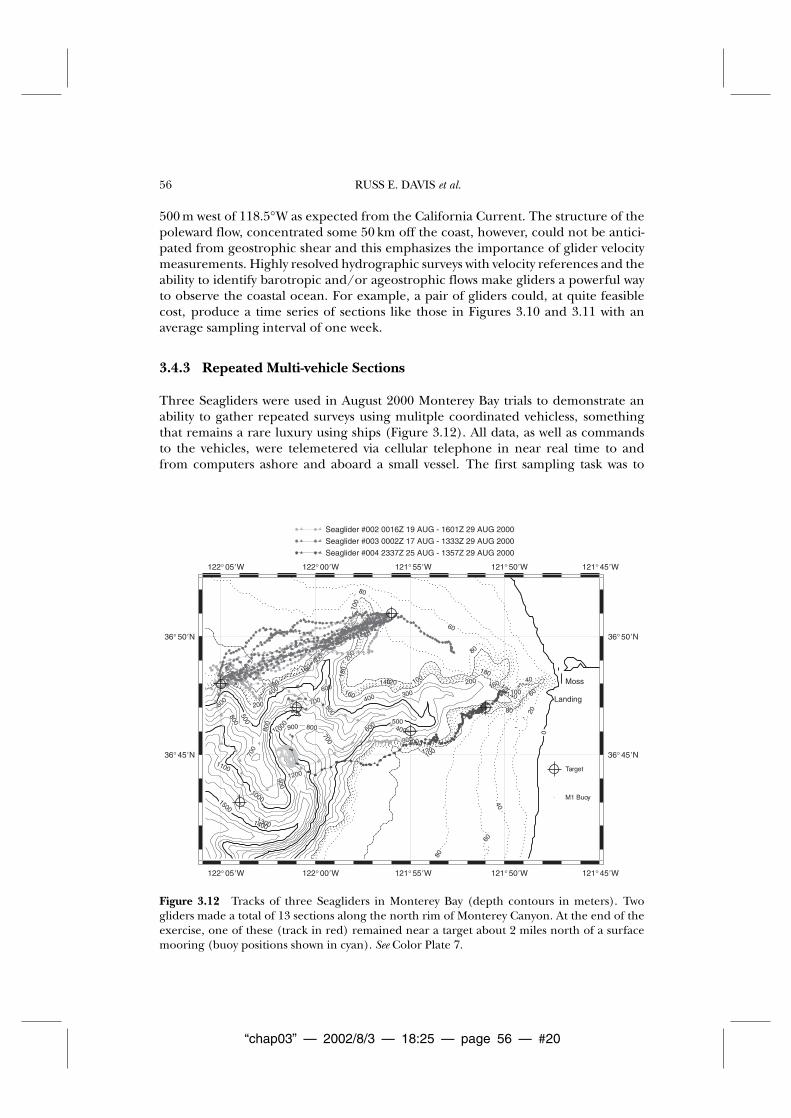
Three Seagliders were used in August 2000 Monterey Bay trials to demonstrate anability to gather repeated surveys using mulitple coordinated vehicless, somethingthat remains a rare luxury using ships (Figure 3.12). All data, as well as commandsto the vehicles, were telemetered via cellular telephone in near real time to andfrom computers ashore and aboard a small vessel. The first sampling task was to
122° 05�W 122° 00�W 121° 55�W 121° 50�W 121° 45�W
36° 50�N
36° 45�N
36° 50�N
36° 45�N
20
40
40
60
60
60
80
80
80
80
100
100
100
100
100
100
120
120120
120
140
140
140
140
160
160160
160
180
180180
180
200
200
200
200
0
100
100
100
100
100
100
200
200
200
200
300
300
300
400
400400
500
500500
600
600
600
700
700
700
800800
800
900
900
1000
1000
1100
11001200
13001400
1500
0
500
500500
1000
10001500
Target
M1 Buoy
Moss
Landing
Seaglider #002 0016Z 19 AUG - 1601Z 29 AUG 2000
Seaglider #003 0002Z 17 AUG - 1333Z 29 AUG 2000
Seaglider #004 2337Z 25 AUG - 1357Z 29 AUG 2000
122° 05�W 122° 00�W 121° 55�W 121° 50�W 121° 45�W
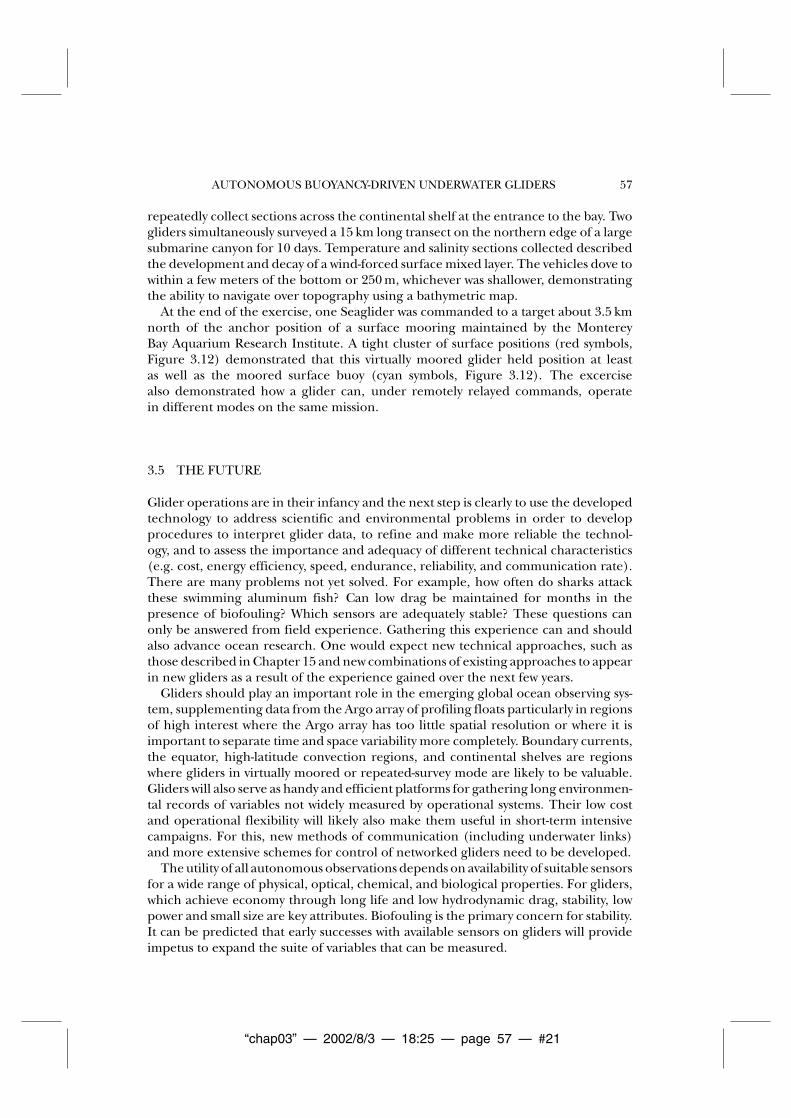
Figure 3.12 Tracks of three Seagliders in Monterey Bay (depth contours in meters). Twogliders made a total of 13 sections along the north rim of Monterey Canyon. At the end of theexercise, one of these (track in red) remained near a target about 2 miles north of a surfacemooring (buoy positions shown in cyan). See Color Plate 7.
“chap03” — 2002/8/3 — 18:25 — page 57 — #21
AUTONOMOUS BUOYANCY-DRIVEN UNDERWATER GLIDERS 57
repeatedly collect sections across the continental shelf at the entrance to the bay. Twogliders simultaneously surveyed a 15 km long transect on the northern edge of a largesubmarine canyon for 10 days. Temperature and salinity sections collected describedthe development and decay of a wind-forced surface mixed layer. The vehicles dove towithin a few meters of the bottom or 250 m, whichever was shallower, demonstratingthe ability to navigate over topography using a bathymetric map.
At the end of the exercise, one Seaglider was commanded to a target about 3.5 kmnorth of the anchor position of a surface mooring maintained by the MontereyBay Aquarium Research Institute. A tight cluster of surface positions (red symbols,Figure 3.12) demonstrated that this virtually moored glider held position at leastas well as the moored surface buoy (cyan symbols, Figure 3.12). The excercisealso demonstrated how a glider can, under remotely relayed commands, operatein different modes on the same mission.
3.5 THE FUTURE
Glider operations are in their infancy and the next step is clearly to use the developedtechnology to address scientific and environmental problems in order to developprocedures to interpret glider data, to refine and make more reliable the technol-ogy, and to assess the importance and adequacy of different technical characteristics(e.g. cost, energy efficiency, speed, endurance, reliability, and communication rate).There are many problems not yet solved. For example, how often do sharks attackthese swimming aluminum fish? Can low drag be maintained for months in thepresence of biofouling? Which sensors are adequately stable? These questions canonly be answered from field experience. Gathering this experience can and shouldalso advance ocean research. One would expect new technical approaches, such asthose described in Chapter 15 and new combinations of existing approaches to appearin new gliders as a result of the experience gained over the next few years.
Gliders should play an important role in the emerging global ocean observing sys-tem, supplementing data from the Argo array of profiling floats particularly in regionsof high interest where the Argo array has too little spatial resolution or where it isimportant to separate time and space variability more completely. Boundary currents,the equator, high-latitude convection regions, and continental shelves are regionswhere gliders in virtually moored or repeated-survey mode are likely to be valuable.Gliders will also serve as handy and efficient platforms for gathering long environmen-tal records of variables not widely measured by operational systems. Their low costand operational flexibility will likely also make them useful in short-term intensivecampaigns. For this, new methods of communication (including underwater links)and more extensive schemes for control of networked gliders need to be developed.
The utility of all autonomous observations depends on availability of suitable sensorsfor a wide range of physical, optical, chemical, and biological properties. For gliders,which achieve economy through long life and low hydrodynamic drag, stability, lowpower and small size are key attributes. Biofouling is the primary concern for stability.It can be predicted that early successes with available sensors on gliders will provideimpetus to expand the suite of variables that can be measured.

“chap03” — 2002/8/3 — 18:25 — page 58 — #22
58 RUSS E. DAVIS et al.
In looking back on Stommel’s 1989 article anticipating autonomous gliders, wemarvel at how much of what followed he had predicted. While lacking his vision, weare confident that this approach to ocean observation is just now reaching the limitof what he foresaw and that new innovation will soon carry us to areas we cannotsee now.

Annotations from Chap03.pdf
Page 17
Annotation 1; Label: Newgen; Date: 05-08-2002 10:11:36 AMAuthor Query: Poor quality artwork. Please supply better quality artwork.