3-0 week 2 lecture 2 ross, westerfield and jordan 7e chapter 3 financial statements, taxes and cash...
TRANSCRIPT

3-1
Week 2
Lecture 2
Ross, Westerfield and Jordan 7e
Chapter 3
Financial Statements, Taxes and Cash Flows
Chapter 5
Introduction to Valuation: The Time Value for Money
3-2
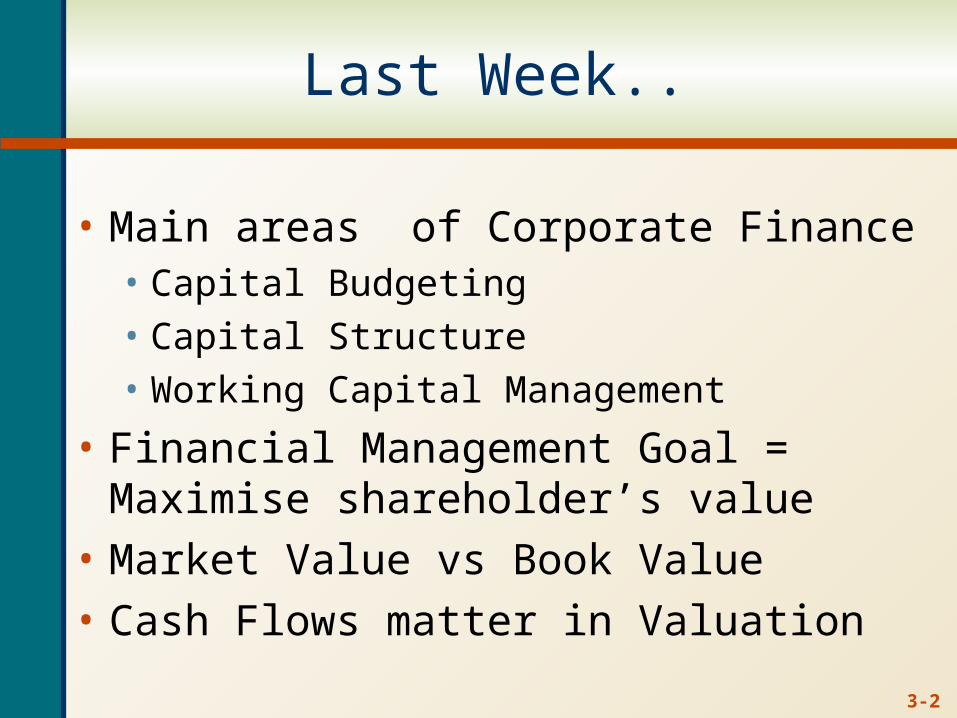
Last Week..
• Main areas of Corporate Finance• Capital Budgeting• Capital Structure• Working Capital Management
• Financial Management Goal = Maximise shareholder’s value
• Market Value vs Book Value
• Cash Flows matter in Valuation

3-3
Chapter 3 Outline
• Cash Flow and Financial Statements: A Closer Look
• Standardized Financial Statements
• Ratio Analysis
• The DuPont Identity
• Using Financial Statement Information

3-4
Sample Balance Sheet
2003 2002 2003 2002
Cash 696 58 A/P 307 303
A/R 956 992 N/P 26 119
Inventory 301 361 Other CL 1,662 1,353
Other CA 303 264 Total CL 1,995 1,775
Total CA 2,256 1,675 LT Debt 843 1,091
Net FA 3,138 3,358 Equity 2,556 2,167
Total Assets
5,394 5,033 Total Liab. & Equity
5,394 5,033
Numbers in millions
3-5
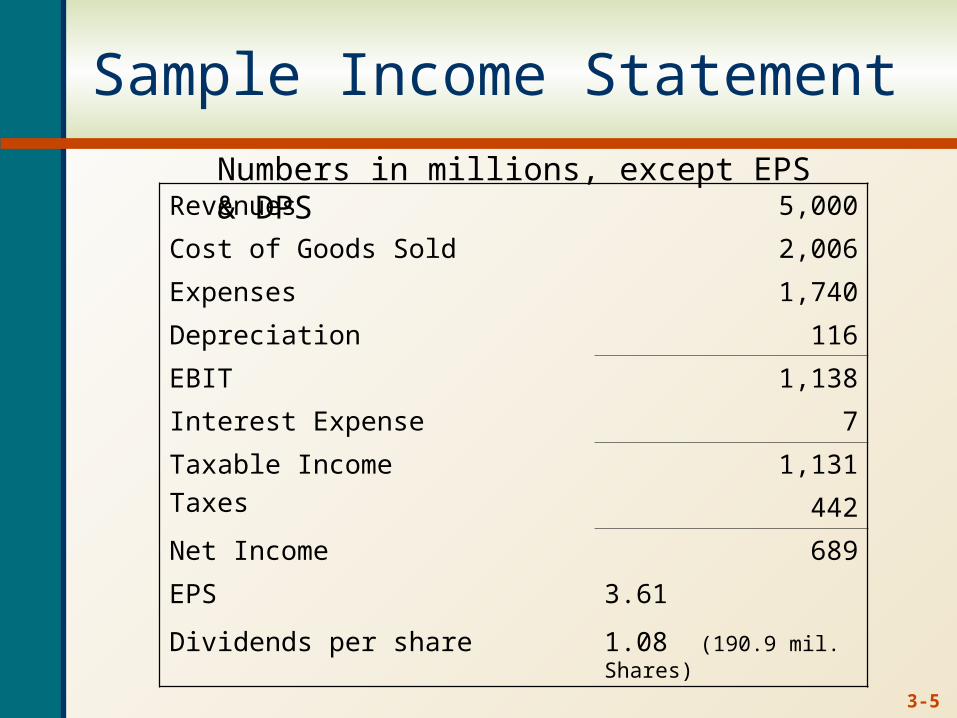
Sample Income Statement
Revenues 5,000
Cost of Goods Sold 2,006
Expenses 1,740
Depreciation 116
EBIT 1,138
Interest Expense 7
Taxable Income 1,131
Taxes 442
Net Income 689
EPS 3.61
Dividends per share 1.08 (190.9 mil. Shares)
Numbers in millions, except EPS & DPS

3-6
Sources and Uses
• Sources• Cash inflow – occurs when we “sell” something• Decrease in asset account (Sample B/S)
• Accounts receivable, inventory, and net fixed assets
• Increase in liability or equity account• Accounts payable, other current liabilities, and common stock
• Uses• Cash outflow – occurs when we “buy” something• Increase in asset account
• Accounts receivable, and other current assets
• Decrease in liability or equity account• Notes payable and long-term debt

3-7
Statement of Cash Flows
• Statement that summarizes the sources and uses of cash
• Changes divided into three major categories• Operating Activity – includes net income and
changes in most current accounts• Investment Activity – includes changes in fixed
assets• Financing Activity – includes changes in notes
payable, long-term debt and equity accounts as well as dividends

3-8
Sample Statement of Cash Flows
Cash, beginning of year 58 Financing Activity
Operating Activity Decrease in Notes Payable (u) -93
Net Income 689 Decrease in LT Debt (u) -248
Plus: Depreciation 116 Decrease in Eq (minus RE) (u) -94
Decrease in A/R (s) 36 Dividends Paid (u) -206
Decrease in Inventory (s) 60 Net Cash from Financing -641
Increase in A/P (s) 4 Net Increase in Cash (1175+104-641) 638
Increase in Other CL (s) 309 Cash End of Year (58+638) 696
Less: Increase in CA (u) -39
Net Cash from Operations 1,175
Investment Activity Change in RE 689 – 206 = 483
Sale of Fixed Assets (s) 104 Decrease in Equity 2556-2167-483= -94
Net Cash from Investments 104
Numbers in millions
Sale of FA: 3138-3358+116= -104

3-9
Standardized Financial Statements
• Common-Size Balance Sheets - Table 3.5• Compute all accounts as a percent of total assets
• Common-Size Income Statements - Table 3.6• Compute all line items as a percent of sales
• Standardized statements make it easier to compare financial information, particularly as the company grows
• They are also useful for comparing companies of different sizes, particularly within the same industry

3-10
Ratio Analysis
• Ratios also allow for better comparison through time or between companies
• Ratios are used both internally and externally
• Be aware!• There is a large number of possible ratios• Different people compute ratios in different
ways

3-11
Categories of Financial Ratios
• Short-term solvency or liquidity ratios
• Long-term solvency or financial leverage ratios
• Asset management or turnover ratios
• Profitability ratios
• Market value ratios

3-12
Computing Liquidity Ratios
• Current Ratio = CA / CL• 2256 / 1995 = 1.13 times
• Quick Ratio = (CA – Inventory) / CL• (2256 – 301) / 1995 = .98 times
• Cash Ratio = Cash / CL• 696 / 1995 = .35 times
• NWC to Total Assets = NWC / TA• (2256 – 1995) / 5394 = .05
• Interval Measure = CA / average daily operating costs• 2256 / ((2006 + 1740)/365) = 219.8 days

3-13
Computing Long-term Solvency Ratios(Financial Leverage Ratios)
• Total Debt Ratio = (TA – TE) / TA = TD/TA• (5394 – 2556) / 5394 = 52.61%
• Debt/Equity = TD / TE = D/E• (5394 – 2556) / 2556 = 1.11 times
• Equity Multiplier = TA / TE = A/E = 1 + D/E• 5394 / 2556 = 2.11• 1 + 1.11 = 2.11
• Long-term debt ratio = LTD / (LTD + TE)• 843 / (843 + 2556) = 24.80%

3-14
Computing Coverage Ratiospart of Long Term Solvency Ratios
• Times Interest Earned = EBIT / Interest• 1138 / 7 = 162.57 times
• Cash Coverage = (EBIT + Depreciation) / Interest• (1138 + 116) / 7 = 179.14 times

3-15
Computing Inventory Ratiospart of Asset Management Ratios
• Inventory Turnover = Cost of Goods Sold / Inventory• 2006 / 301 = 6.66 times
• Days’ Sales in Inventory = 365 / Inventory Turnover• 365 / 6.66 = 55 days

3-16
Computing Receivables Ratiospart of Asset Management Ratios
• Receivables Turnover = Sales / Accounts Receivable• 5000 / 956 = 5.23 times
• Days’ Sales in Receivables = 365 / Receivables Turnover
• 365 / 5.23 = 70 days

3-17
Computing Total Asset Turnoverpart of Asset Management Ratios
• Total Asset Turnover = Sales / Total Assets• 5000 / 5394 = .9269• It is not unusual for TAT < 1, especially if a
firm has a large amount of fixed assets
• NWC Turnover = Sales / NWC• 5000 / (2256 – 1995) = 19.16 times
• Fixed Asset Turnover = Sales / NFA• 5000 / 3138 = 1.59 times
3-18
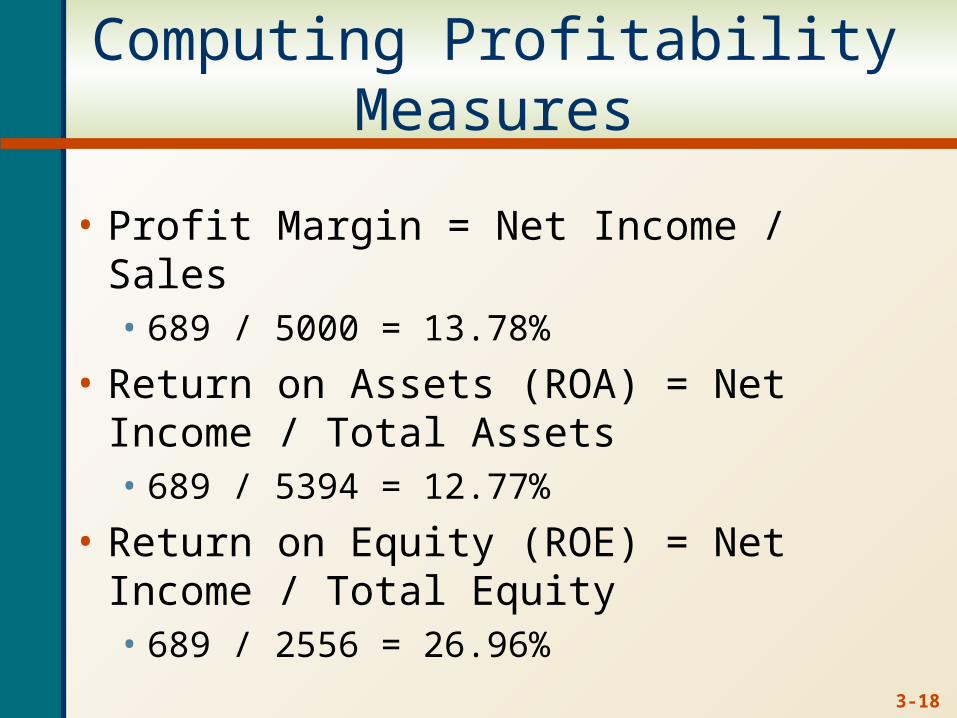
Computing Profitability Measures
• Profit Margin = Net Income / Sales• 689 / 5000 = 13.78%
• Return on Assets (ROA) = Net Income / Total Assets• 689 / 5394 = 12.77%
• Return on Equity (ROE) = Net Income / Total Equity• 689 / 2556 = 26.96%

3-19
Computing Market Value Measures
• Market Price = $87.65 per share
• Shares outstanding = 190.9 million
• PE Ratio = Price per share / Earnings per share• 87.65 / 3.61 = 24.28 times
• Market-to-book ratio = market value per share / book value per share• 87.65 / (2556 / 190.9) = 6.56 times
3-20
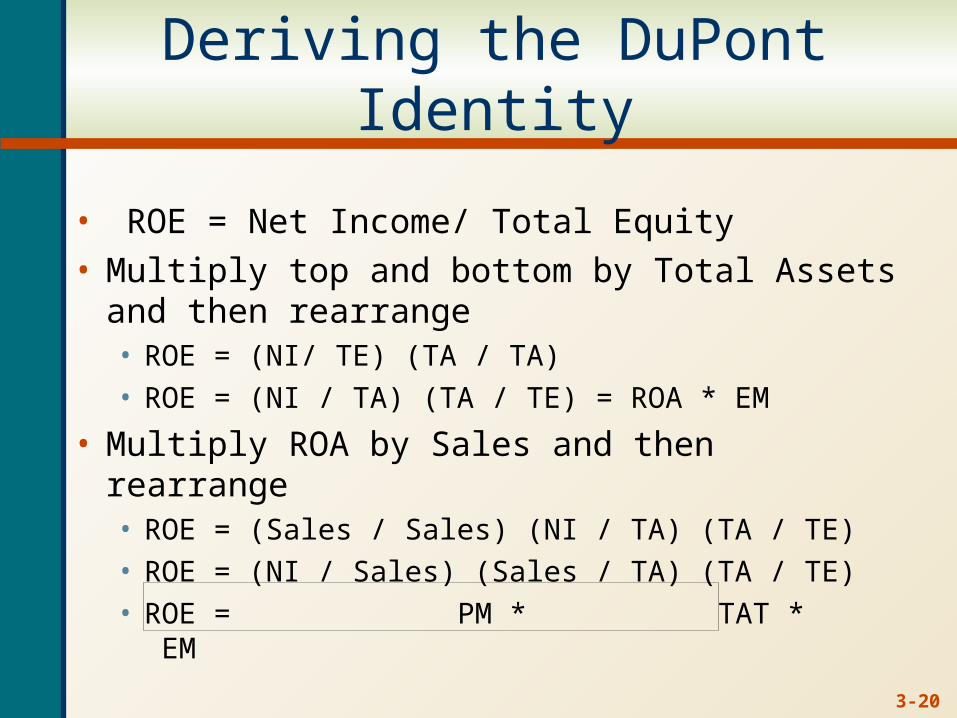
Deriving the DuPont Identity
• ROE = Net Income/ Total Equity• Multiply top and bottom by Total Assets and
then rearrange• ROE = (NI/ TE) (TA / TA)• ROE = (NI / TA) (TA / TE) = ROA * EM
• Multiply ROA by Sales and then rearrange• ROE = (Sales / Sales) (NI / TA) (TA / TE)• ROE = (NI / Sales) (Sales / TA) (TA / TE)• ROE = PM * TAT * EM

3-21
Using the DuPont Identity
• ROE = PM * TAT * EM• PM - Profit margin is a measure of the firm’s
operating efficiency – how well does it control costs
• TAT - Total asset turnover is a measure of the firm’s asset use efficiency – how well does it manage its assets
• EM - Equity multiplier is a measure of the firm’s financial leverage
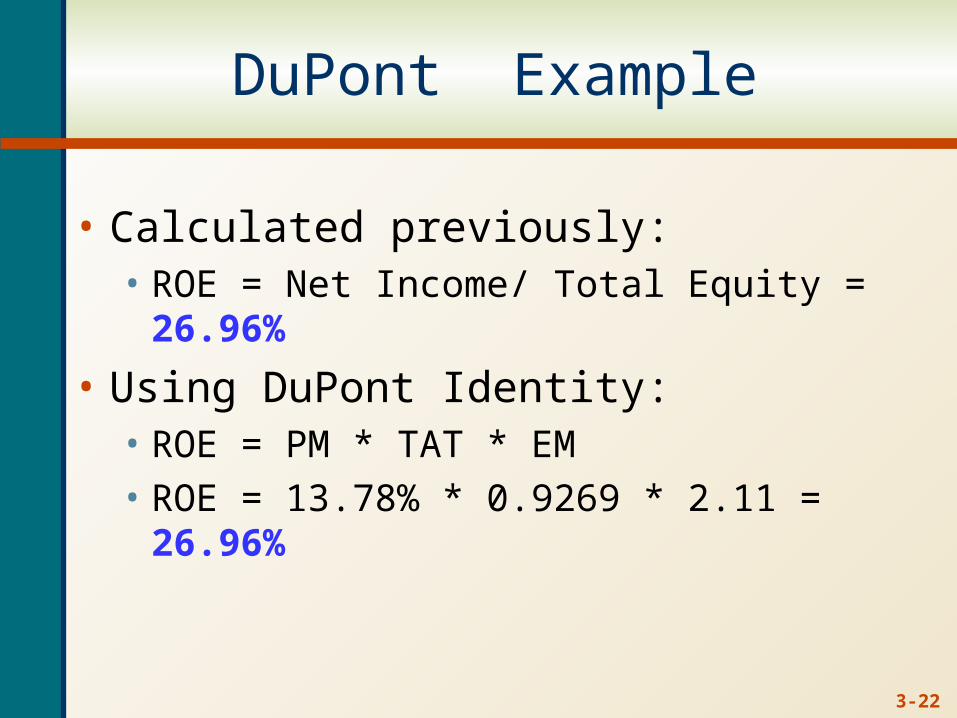
3-22
DuPont Example
• Calculated previously:• ROE = Net Income/ Total Equity = 26.96%
• Using DuPont Identity:• ROE = PM * TAT * EM• ROE = 13.78% * 0.9269 * 2.11 = 26.96%

3-23
Why Evaluate Financial Statements?
• Internal uses• Performance evaluation – compensation and
comparison between divisions• Planning for the future – guide in estimating
future cash flows
• External uses• Creditors• Suppliers• Customers• Stockholders

3-24
Benchmarking
• Ratios are not very helpful by themselves; they need to be compared to something
• Time-Trend Analysis• Used to see how the firm’s performance is
changing through time
• Peer Group Analysis• Compare to similar companies or with the
industry

3-25
Potential Problems
• There is no underlying theory, so there is no way to know which ratios are most relevant
• Benchmarking is difficult for diversified firms• Globalization and international competition makes
comparison more difficult because of differences in accounting regulations
• Varying accounting procedures, i.e. FIFO vs. LIFO• Different fiscal years• Extraordinary events

3-26
End of Chapter 3
3-27
Week 2
Lecture 2
Ross, Westerfield and Jordan 7e
Chapter 5
Introduction to Valuation:
The Time Value for Money

3-28
Chapter 5 Outline
• Future Value and Compounding
• Present Value and Discounting
• More on Present and Future Values• Determine the return on an investment• Calculate the number of periods• Use excel to solve problems

3-29
Future Values
• Suppose you invest $1000 for one year at 5% per year. What is the future value in one year?• Interest = 1000(.05) = 50• Value in one year = principal + interest
= 1000 + 50 = 1050• Future Value (FV) = 1000 +1000(.05)
= 1000 (1+.05) = 1050• Suppose you leave the money in for another year.
How much will you have two years from now?• FV = 1000(1.05)(1.05) = 1000(1.05)2 = 1102.50
3-30
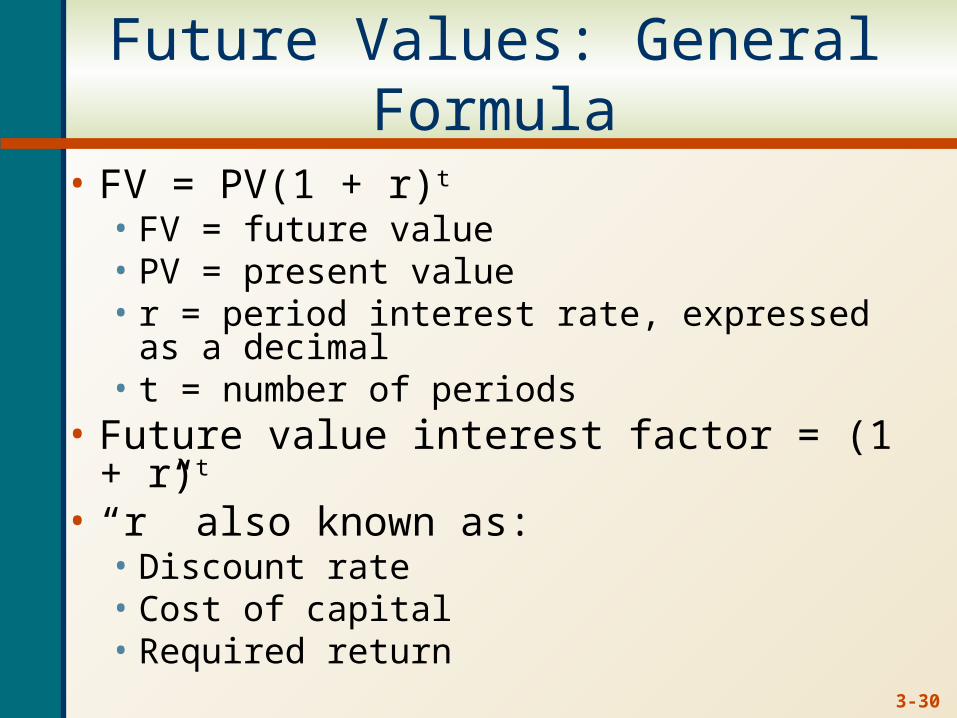
Future Values: General Formula
• FV = PV(1 + r)t
• FV = future value• PV = present value• r = period interest rate, expressed as a
decimal• t = number of periods
• Future value interest factor = (1 + r)t
• “r” also known as:• Discount rate• Cost of capital• Required return

3-31
Simple vs Compound Interest
• Simple interest• interest earned each period only on the principal
• Compound interest• Interest is reinvested each period – interest on interest
• Consider the previous example• FV with simple interest = 1000 + 50 + 50 = 1100
1000+1000(.05)+1000(.05)• FV with compound interest=1000 + 50 + 52.50 = 1102.5
1000+1000(.05)+1050(.05)• The extra 2.50 comes from the interest of .05(50) = 2.50
earned on the first interest payment

3-32
Future Values – Example 2
• Suppose you invest the $1000 from the previous example at 5% per year, for 5 years. How much would you have at the end of 5 years?• FV = 1000(1.05)5 = 1276.28
• The effect of compounding is small for a small number of periods, but increases as the number of periods increases.
• What would be the future value using simple interest ?

3-33
Future Values – Example 3
• Suppose you had a relative deposit $10 at 5.5% pa interest 200 years ago. How much would the investment be worth today?• FV = 10(1.055)200 = 447,189.84
• What is the effect of compounding?• Simple interest = 10 + 200(10)(.055) = 120.00• Compounding added $447,069.84 to the value
of the investment

3-34
Quick Quiz – Part I
• What is the difference between simple interest and compound interest?
• Suppose you have $500 to invest and you believe that you can earn 8% per year over the next 15 years.• How much would you have at the end of 15
years using compound interest?• How much would you have using simple
interest?

3-35
Present Values
• How much do I have to invest today to have some amount in the future?• FV = PV(1 + r)t
• Rearrange to solve for PV = FV / (1 + r)t
• PVIF = 1/(1+r)t
• When we talk about discounting, we mean finding the present value of some future amount.
• PV = the current value of future cash flows discounted at the appropriate discount rate

3-36
Present Value – Examples
• Suppose you need $10,000 in one year for the down
payment on a new car. If you can earn 7% annually, how
much do you need to invest today?
• PV = 10,000 / (1.07)1 = 9345.79
• You want to begin saving for your child’s education and
you estimate that the cost will be $150,000 in 17 years.
You feel confident that you can earn 8% per year, how
much do you need to invest today?
• PV = 150,000 / (1.08)17 = 40,540.34

3-37
Present Value – Important Relationships
• For a given interest rate – the longer the time period, the lower the present value• What is the present value of $500 to be received in 5
years? 10 years? The discount rate is 10%• 5 years: PV = 500 / (1.1)5 = 310.46• 10 years: PV = 500 / (1.1)10 = 192.77
• For a given time period – the higher the interest rate, the smaller the present value• What is the present value of $500 received in 5 years if
the interest rate is 10%? 15%?• Rate = 10%: PV = 500 / (1.1)5 = 310.46• Rate = 15%; PV = 500 / (1.15)5 = 248.59

3-38
Quick Quiz – Part II
• What is the mathematical relationship between present value and future value?
• Suppose you need $15,000 in 3 years. If you can earn 6% annually, how much do you need to invest today?
• If you could invest the money at 8%, would you have to invest more or less than at 6%? How much?

3-39
Future and Present Values
• FV = PV (1+r)t
• PV = FV / (1 + r)t
= FV(1+r)-t
• There are four parts to these equations• PV, FV, r and t• If we know any three,
we can solve for the fourth
To find r• FV = PV(1 + r)t
• (FV/PV) = (1+r)t
• 1+r = (FV/PV)1/t
• r = (FV/PV)1/t – 1
To find t• FV = PV(1 + r)t
• (FV/PV) = (1 + r)t
• LN(FV/PV) = t x LN(1+r)• t = LN(FV/PV)/LN(1 + r)

3-40
Finding the Rate r – Example 1
• You are looking at an investment that will pay $1200 in 5 years if you invest $1000 today. What is the implied rate of interest?• FV = PV(1+r)t
• 1200 = 1000(1+r)5
• 1200/1000 = (1+r)5
• (1200/1000)1/5 = 1+r• r = (1200 / 1000)1/5 – 1
= (1.2)1/5 – 1= 1.03714 -1 = .03714 = 3.714%

3-41
Finding r – More Examples
• Suppose you are offered an investment that will allow you to double your money in 6 years. You have $10,000 to invest. What is the implied rate of interest?
• r = (20,000 / 10,000)1/6 – 1 = .122462 = 12.25%
• Suppose you have a 1-year old son and you want to provide $75,000 in 17 years towards his college education. You currently have $5000 to invest. What interest rate must you earn to have the $75,000 when you need it?
• r = (75,000 / 5,000)1/17 – 1 = .172688 = 17.27%

3-42
Finding the Number of Periods t – Example 1
• You want to purchase a new car and you are willing to pay $20,000. If you can invest at 10% per year and you currently have $15,000, how long will it be before you have enough money to pay cash for the car?• FV = PV(1 + r)t
• 20000 = 15000(1+.1)t
• 20000/15000 = (1.1)t
• LN(20,000 / 15,000) = t x LN(1.1)• t = LN(20,000 / 15,000) / LN(1.1) • t = LN(1.3333)/ LN(1.1) = 0.2876 / 0.0953 = 3.02 years

3-43
Number of Periods – Example 2
• Suppose you want to buy a new house. You currently have $15,000 and you figure you need to have a 10% deposit plus an additional 5% of the loan amount for loan fees. Assume the type of house you want will cost about $150,000 and you can earn 7.5% per year, how long will it be before you have enough money for the deposit and fees?

3-44
Number of Periods – Example 2 Continued
• How much do you need to have in the future?• Deposit = .1(150,000) = 15,000• Loan becomes = 150000-15000 = 135000• Fees = .05(135000) = 6,750• Total needed = 15,000 + 6,750 = 21,750
• Compute the number of periods• PV = 15,000 21,750 = 15,000(1+0.075)t
• FV = 21,750 21,750/15,000 = (1.075)t
• r = 7.5% • Solving for the number of periods:
• t = LN(21,750 / 15,000) / LN(1.075) = 5.14 years
3-45
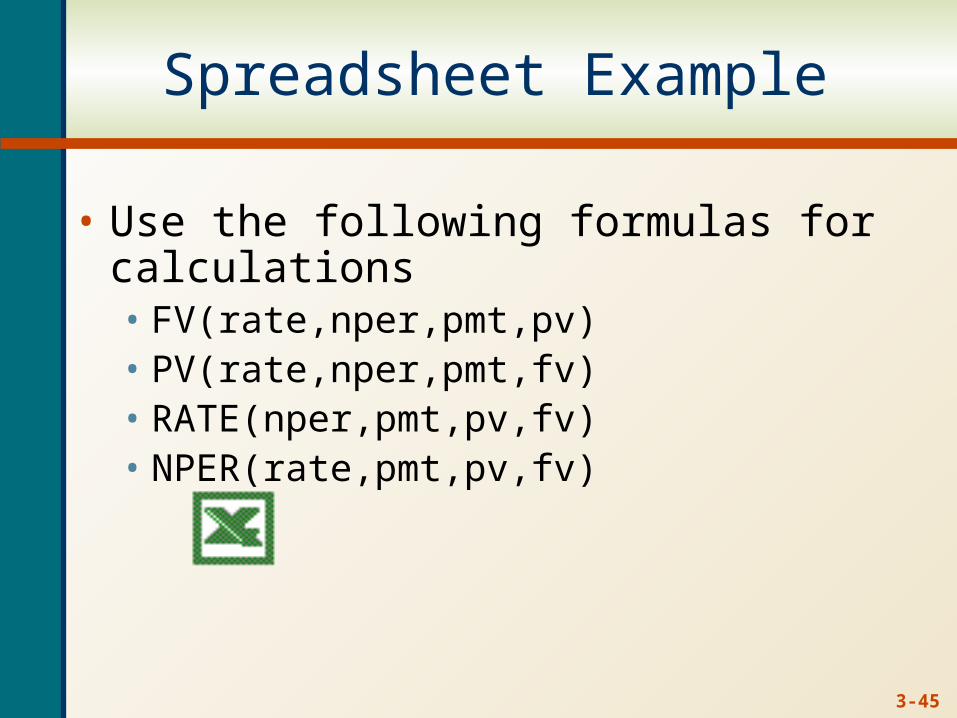
Spreadsheet Example
• Use the following formulas for calculations• FV(rate,nper,pmt,pv)• PV(rate,nper,pmt,fv)• RATE(nper,pmt,pv,fv)• NPER(rate,pmt,pv,fv)

3-46
Work the Web Example
• Many financial calculators are available online
• Go to Investopedia’s web site and work the following example:• You need $50,000 in 10 years. If you can earn
6% interest, how much do you need to invest today?
• You should get $27,919.74www.investopedia.com/
calculator
3-47
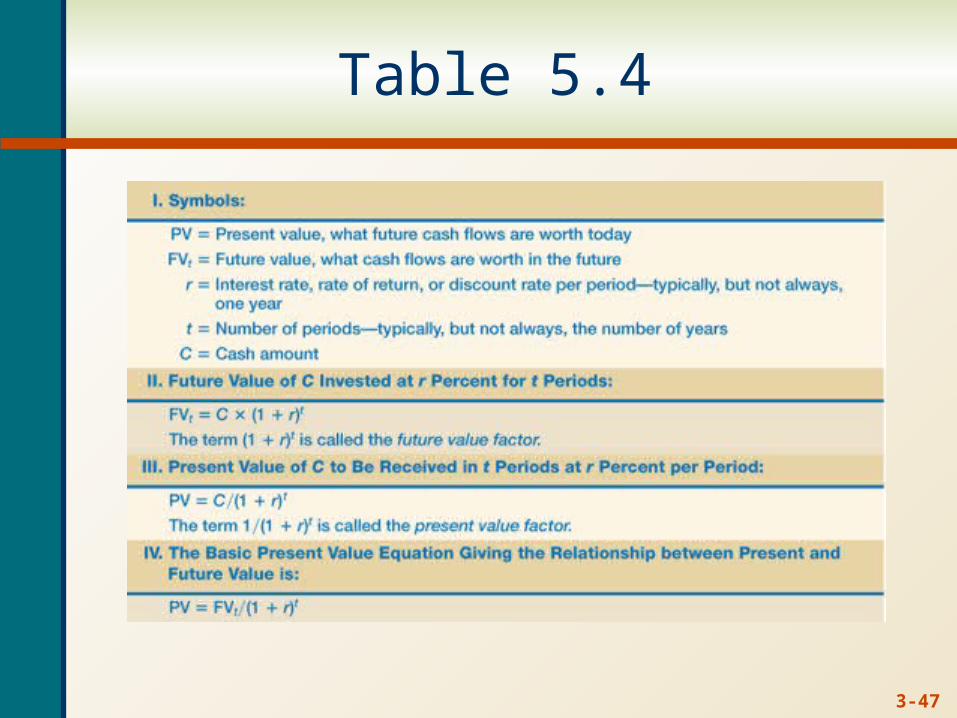
Table 5.4

3-48
End of Lecture 2