2q2018 report - epm.com.co · alternative for the sealing of the rdt: • filtration plugging from...
TRANSCRIPT
2Q2018 Report
Included in The Sustainabilty Yearbook 2018
Agenda
2
Relevant events
Energy market
Update on the contingency presented at the
Ituango Hydroelectric Project
Financial results as of June 2018
Note: please, see disclaimer at the end of the presentation.
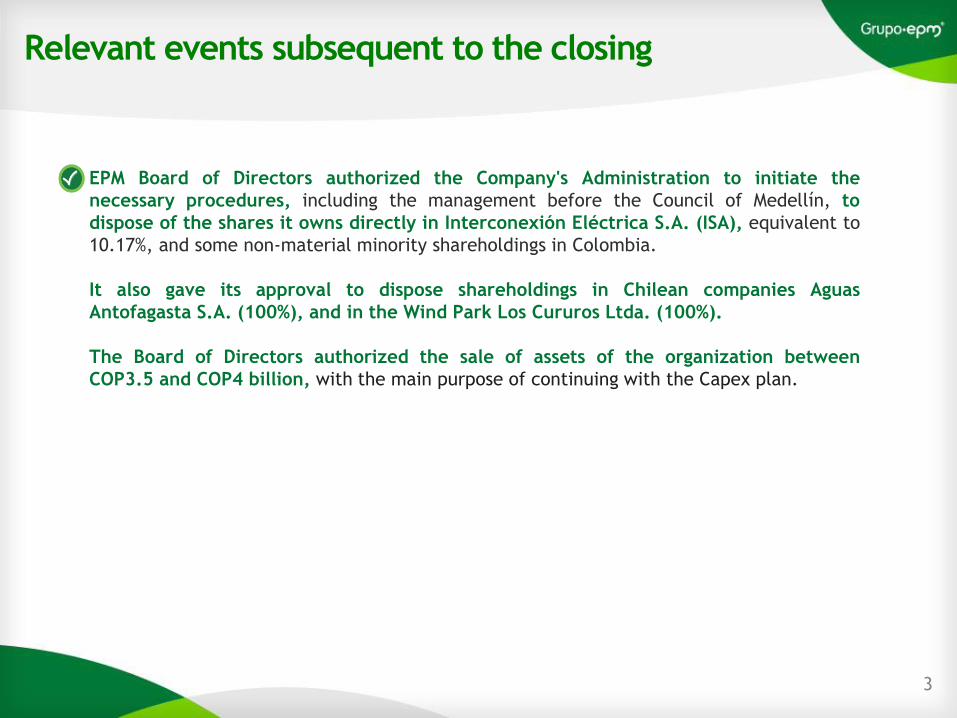
Relevant events subsequent to the closing
3
EPM Board of Directors authorized the Company's Administration to initiate the
necessary procedures, including the management before the Council of Medellín, to
dispose of the shares it owns directly in Interconexión Eléctrica S.A. (ISA), equivalent to
10.17%, and some non-material minority shareholdings in Colombia.
It also gave its approval to dispose shareholdings in Chilean companies Aguas
Antofagasta S.A. (100%), and in the Wind Park Los Cururos Ltda. (100%).
The Board of Directors authorized the sale of assets of the organization between
COP3.5 and COP4 billion, with the main purpose of continuing with the Capex plan.
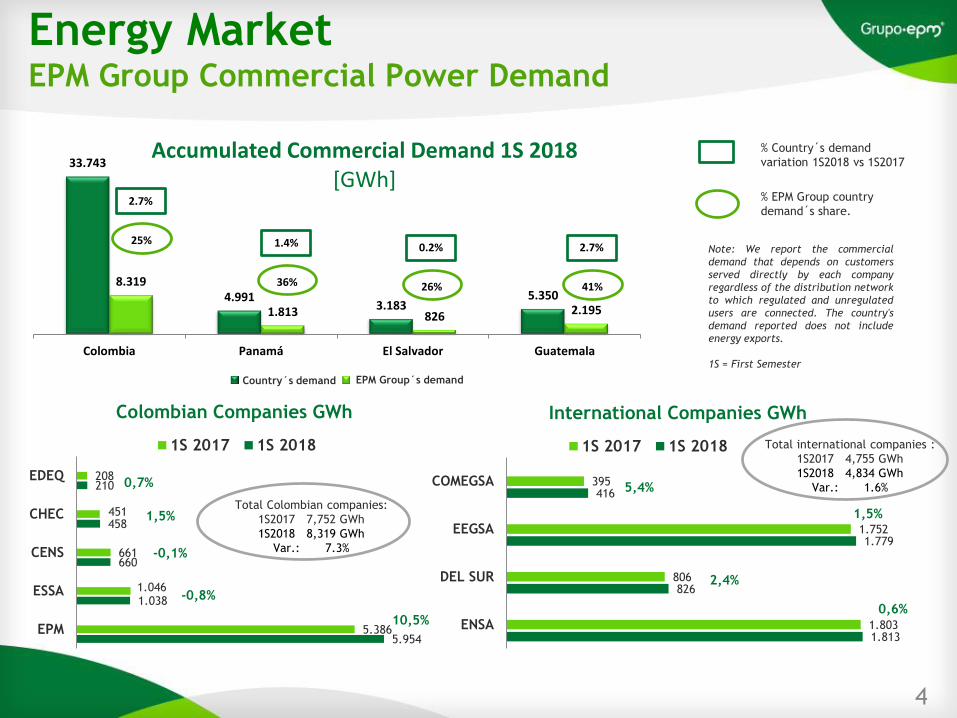
Energy MarketEPM Group Commercial Power Demand
4
Note: We report the commercial
demand that depends on customers
served directly by each company
regardless of the distribution network
to which regulated and unregulated
users are connected. The country's
demand reported does not include
energy exports.
1S = First Semester
5.954
1.038
660
458
210
5.386
1.046
661
451
208
10,5%
-0,8%
-0,1%
1,5%
0,7%
EPM
ESSA
CENS
CHEC
EDEQ
Colombian Companies GWh
1S 2017 1S 2018
1.813
826
1.779
416
1.803
806
1.752
395
0,6%
2,4%
1,5%
5,4%
ENSA
DEL SUR
EEGSA
COMEGSA
International Companies GWh
1S 2017 1S 2018
33.743
4.9913.183
5.3508.319
1.813 826 2.195
Colombia Panamá El Salvador Guatemala
Accumulated Commercial Demand 1S 2018[GWh]
Demanda País Demanda Grupo
25%
2.7%
36%
1.4%
26%
0.2%
41%
2.7%
Total international companies :
1S2017 4,755 GWh
1S2018 4,834 GWh
Var.: 1.6%
Total Colombian companies:
1S2017 7,752 GWh
1S2018 8,319 GWh
Var.: 7.3%
Country´s demand EPM Group´s demand
% Country´s demand
variation 1S2018 vs 1S2017
% EPM Group country
demand´s share.
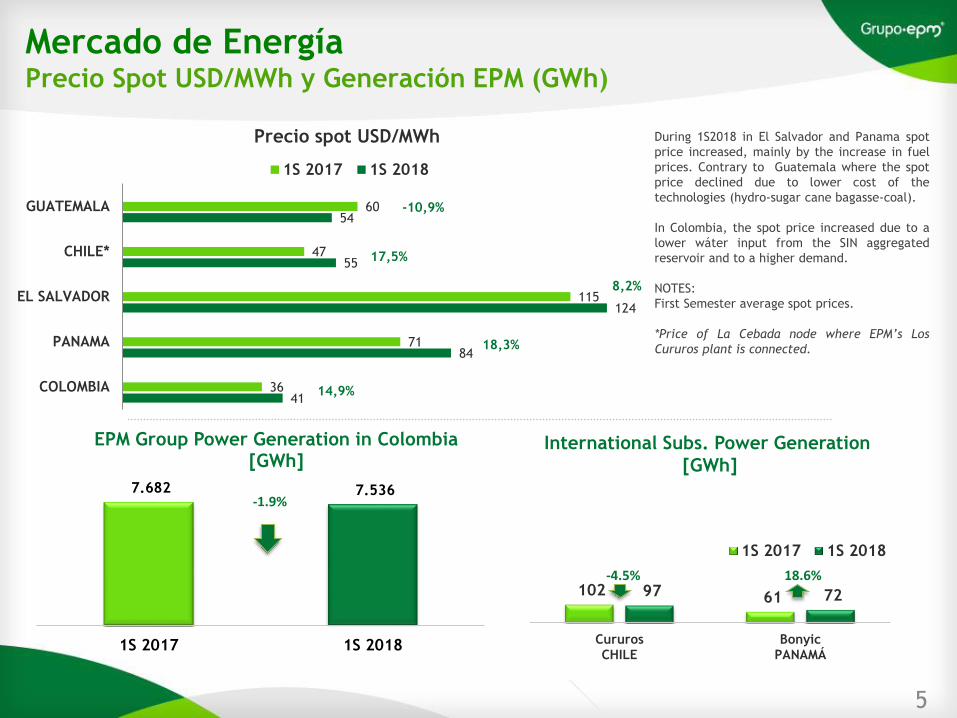
Mercado de EnergíaPrecio Spot USD/MWh y Generación EPM (GWh)
During 1S2018 in El Salvador and Panama spot
price increased, mainly by the increase in fuel
prices. Contrary to Guatemala where the spot
price declined due to lower cost of the
technologies (hydro-sugar cane bagasse-coal).
In Colombia, the spot price increased due to a
lower wáter input from the SIN aggregated
reservoir and to a higher demand.
NOTES:
First Semester average spot prices.
*Price of La Cebada node where EPM’s Los
Cururos plant is connected.
5
7.682 7.536
1S 2017 1S 2018
EPM Group Power Generation in Colombia[GWh]
-1.9%
102 61 97 72
CururosCHILE
BonyicPANAMÁ
1S 2017 1S 2018
-4.5% 18.6%
41
84
124
55
54
36
71
115
47
60
14,9%
18,3%
8,2%
17,5%
-10,9%
COLOMBIA
PANAMA
EL SALVADOR
CHILE*
GUATEMALA
Precio spot USD/MWh
1S 2017 1S 2018
International Subs. Power Generation
[GWh]
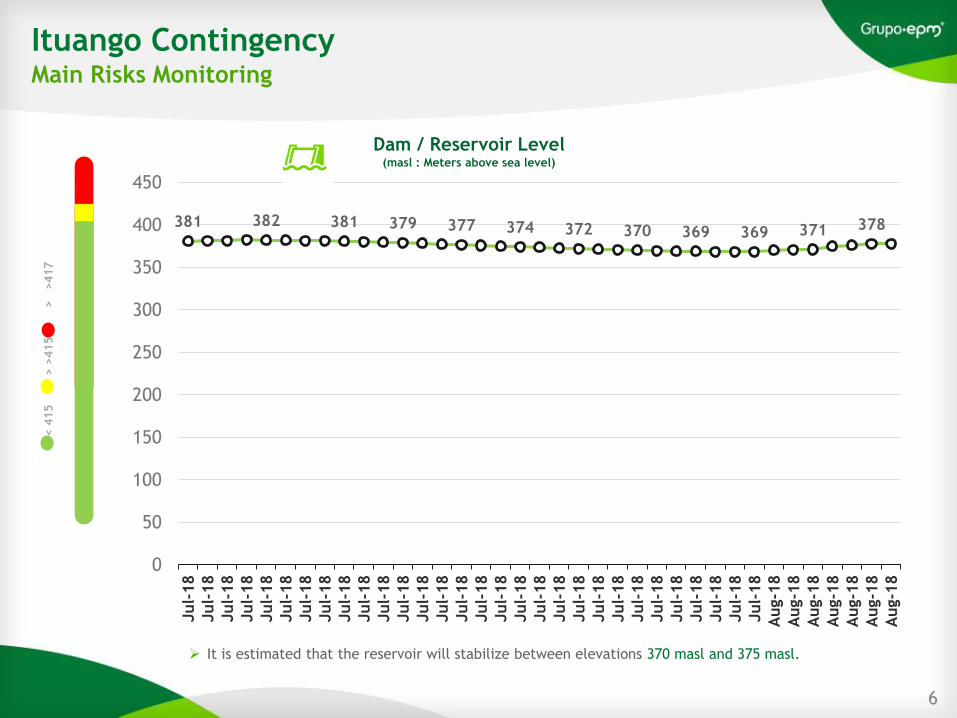
Ituango ContingencyMain Risks Monitoring
6
➢ It is estimated that the reservoir will stabilize between elevations 370 masl and 375 masl.
381 382 381 379 377 374 372 370 369 369 371 378
0
50
100
150
200
250
300
350
400
450Jul-
18
Jul-
18
Jul-
18
Jul-
18
Jul-
18
Jul-
18
Jul-
18
Jul-
18
Jul-
18
Jul-
18
Jul-
18
Jul-
18
Jul-
18
Jul-
18
Jul-
18
Jul-
18
Jul-
18
Jul-
18
Jul-
18
Jul-
18
Jul-
18
Jul-
18
Jul-
18
Jul-
18
Jul-
18
Jul-
18
Jul-
18
Jul-
18
Jul-
18
Jul-
18
Aug-1
8
Aug-1
8
Aug-1
8
Aug-1
8
Aug-1
8
Aug-1
8
Aug-1
8
Dam / Reservoir Level(masl : Meters above sea level)
< 4
15
> >
415
>
>417
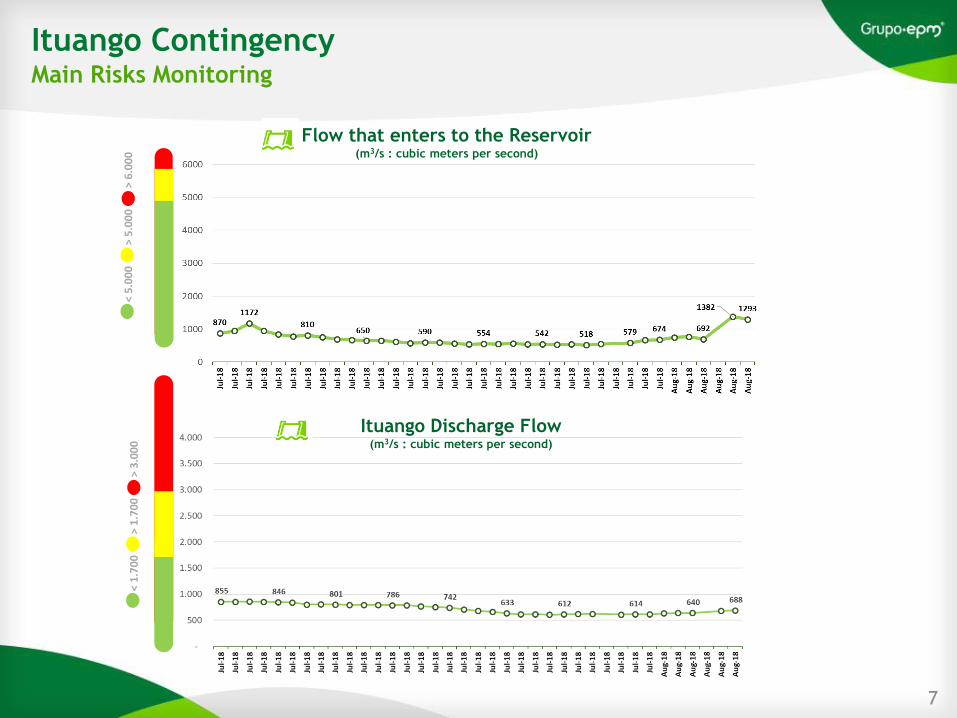
Ituango ContingencyMain Risks Monitoring
7
Flow that enters to the Reservoir(m3/s : cubic meters per second)
< 5
.00
0
>
5.0
00
> 6
.00
0<
1.7
00
> 1
.70
0
>
3.0
00
Ituango Discharge Flow(m3/s : cubic meters per second)
8
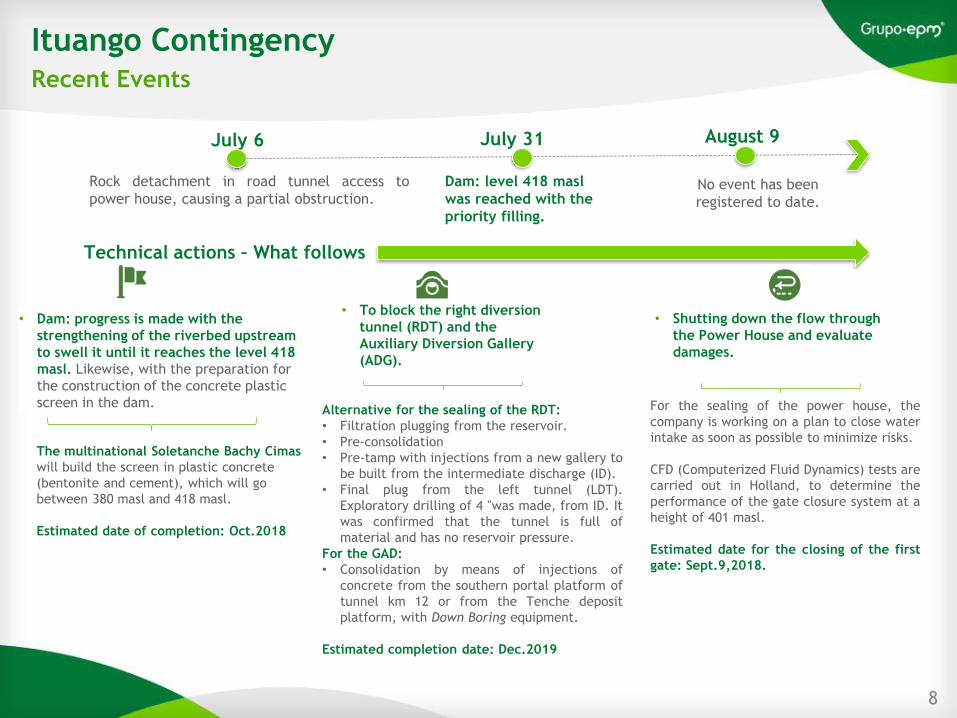
Ituango ContingencyRecent Events
Rock detachment in road tunnel access to
power house, causing a partial obstruction.
July 6
Technical actions – What follows
• Dam: progress is made with the
strengthening of the riverbed upstream
to swell it until it reaches the level 418
masl. Likewise, with the preparation for
the construction of the concrete plastic
screen in the dam.
• To block the right diversion
tunnel (RDT) and the
Auxiliary Diversion Gallery
(ADG).
For the sealing of the power house, the
company is working on a plan to close water
intake as soon as possible to minimize risks.
CFD (Computerized Fluid Dynamics) tests are
carried out in Holland, to determine the
performance of the gate closure system at a
height of 401 masl.
Estimated date for the closing of the first
gate: Sept.9,2018.
The multinational Soletanche Bachy Cimas
will build the screen in plastic concrete
(bentonite and cement), which will go
between 380 masl and 418 masl.
Estimated date of completion: Oct.2018
Alternative for the sealing of the RDT:
• Filtration plugging from the reservoir.
• Pre-consolidation
• Pre-tamp with injections from a new gallery to
be built from the intermediate discharge (ID).
• Final plug from the left tunnel (LDT).
Exploratory drilling of 4 "was made, from ID. It
was confirmed that the tunnel is full of
material and has no reservoir pressure.
For the GAD:
• Consolidation by means of injections of
concrete from the southern portal platform of
tunnel km 12 or from the Tenche deposit
platform, with Down Boring equipment.
Estimated completion date: Dec.2019
July 31
Dam: level 418 masl
was reached with the
priority filling.
• Shutting down the flow through
the Power House and evaluate
damages.
No event has been
registered to date.
August 9
9
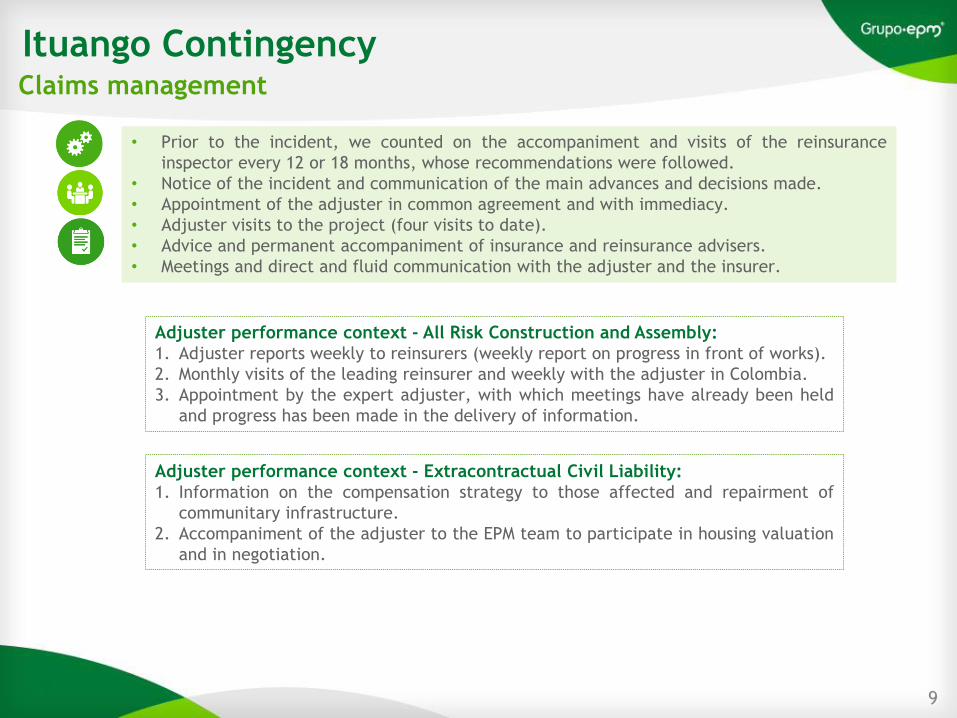
• Prior to the incident, we counted on the accompaniment and visits of the reinsurance
inspector every 12 or 18 months, whose recommendations were followed.
• Notice of the incident and communication of the main advances and decisions made.
• Appointment of the adjuster in common agreement and with immediacy.
• Adjuster visits to the project (four visits to date).
• Advice and permanent accompaniment of insurance and reinsurance advisers.
• Meetings and direct and fluid communication with the adjuster and the insurer.
Claims management
Adjuster performance context - All Risk Construction and Assembly:1. Adjuster reports weekly to reinsurers (weekly report on progress in front of works).
2. Monthly visits of the leading reinsurer and weekly with the adjuster in Colombia.
3. Appointment by the expert adjuster, with which meetings have already been held
and progress has been made in the delivery of information.
Adjuster performance context - Extracontractual Civil Liability:1. Information on the compensation strategy to those affected and repairment of
communitary infrastructure.
2. Accompaniment of the adjuster to the EPM team to participate in housing valuation
and in negotiation.
Ituango Contingency
9
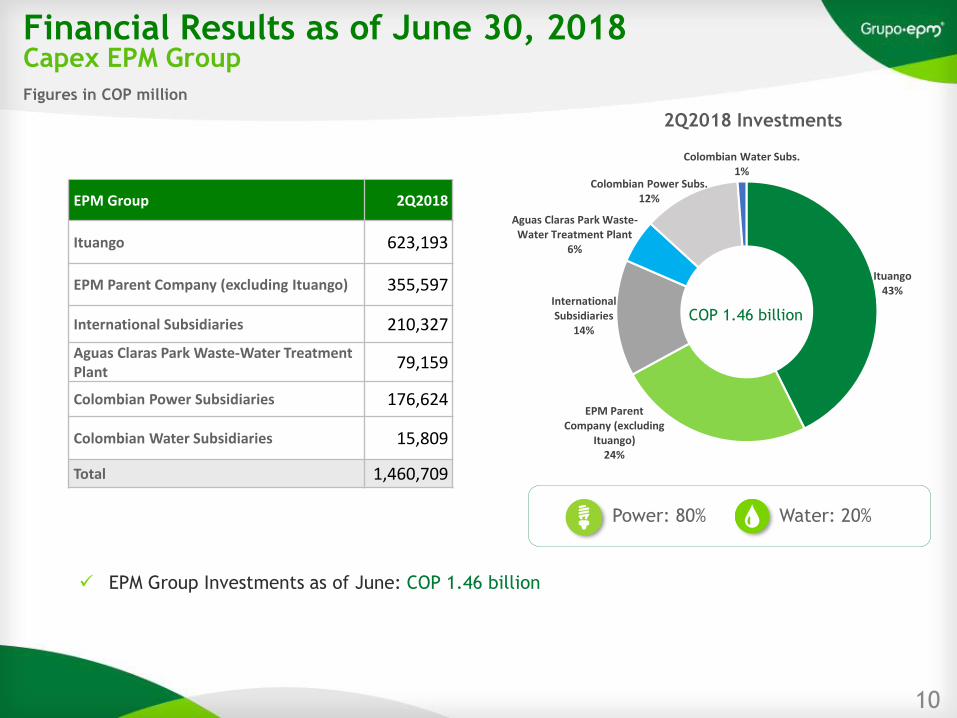
Financial Results as of June 30, 2018Capex EPM Group
Figures in COP million
✓ EPM Group Investments as of June: COP 1.46 billion
EPM Group 2Q2018
Ituango 623,193
EPM Parent Company (excluding Ituango) 355,597
International Subsidiaries 210,327
Aguas Claras Park Waste-Water TreatmentPlant
79,159
Colombian Power Subsidiaries 176,624
Colombian Water Subsidiaries 15,809
Total 1,460,709
Power: 80% Water: 20%
COP 1.46 billion
10
Ituango43%
EPM Parent Company (excluding
Ituango)24%
International Subsidiaries
14%
Aguas Claras Park Waste-Water Treatment Plant
6%
Colombian Power Subs.12%
Colombian Water Subs.1%
2Q2018 Investments
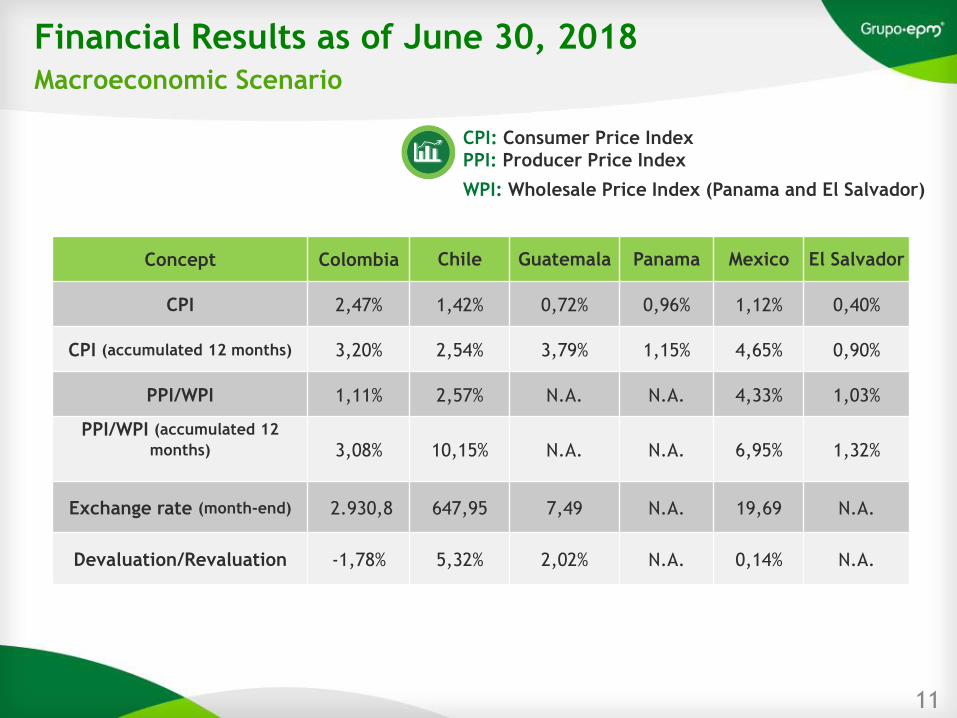
Financial Results as of June 30, 2018Macroeconomic Scenario
CPI: Consumer Price Index
PPI: Producer Price Index
WPI: Wholesale Price Index (Panama and El Salvador)
Concept Colombia Chile Guatemala Panama Mexico El Salvador
CPI 2,47% 1,42% 0,72% 0,96% 1,12% 0,40%
CPI (accumulated 12 months) 3,20% 2,54% 3,79% 1,15% 4,65% 0,90%
PPI/WPI 1,11% 2,57% N.A. N.A. 4,33% 1,03%
PPI/WPI (accumulated 12
months) 3,08% 10,15% N.A. N.A. 6,95% 1,32%
Exchange rate (month-end) 2.930,8 647,95 7,49 N.A. 19,69 N.A.
Devaluation/Revaluation -1,78% 5,32% 2,02% N.A. 0,14% N.A.
11
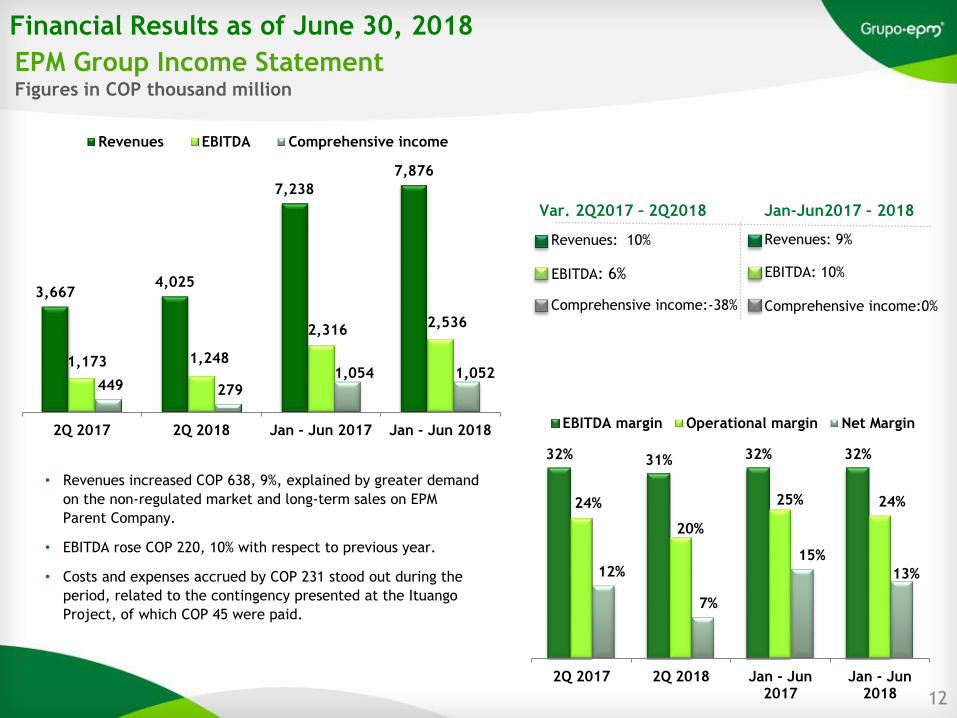
Financial Results as of June 30, 2018
12
EPM Group Income Statement Figures in COP thousand million
Jan-Jun2017 – 2018Var. 2Q2017 – 2Q2018
Revenues: 9%
EBITDA: 10%
Comprehensive income:0%
Revenues: 10%
EBITDA: 6%
Comprehensive income:-38%
• Revenues increased COP 638, 9%, explained by greater demand
on the non-regulated market and long-term sales on EPM
Parent Company.
• EBITDA rose COP 220, 10% with respect to previous year.
• Costs and expenses accrued by COP 231 stood out during the
period, related to the contingency presented at the Ituango
Project, of which COP 45 were paid.
3,6674,025
7,238
7,876
1,173 1,248
2,3162,536
449 279 1,054 1,052
2Q 2017 2Q 2018 Jan - Jun 2017 Jan - Jun 2018
Revenues EBITDA Comprehensive income
32% 31% 32% 32%
24%
20%
25% 24%
12%
7%
15%
13%
2Q 2017 2Q 2018 Jan - Jun2017
Jan - Jun2018
EBITDA margin Operational margin Net Margin
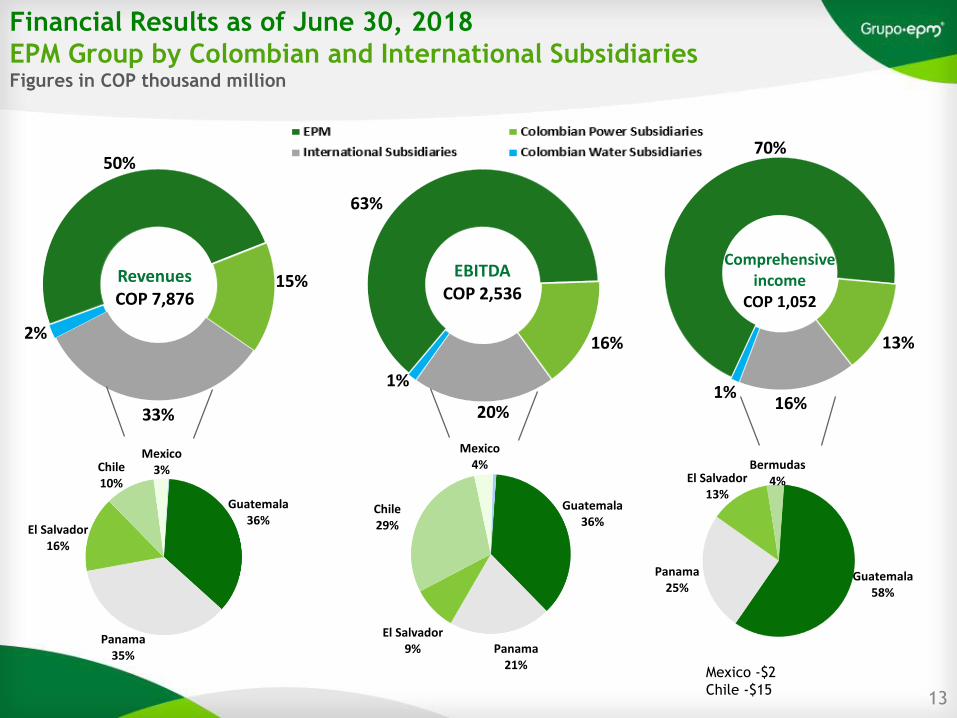
50%
15%
33%
2%
RevenuesCOP 7,876
70%
13%
16%1%
Comprehensive income
COP 1,052
63%
16%
20%
1%
EBITDACOP 2,536
13
Financial Results as of June 30, 2018
EPM Group by Colombian and International SubsidiariesFigures in COP thousand million
Guatemala58%
Panama25%
El Salvador13%
Bermudas4%
Mexico -$2
Chile -$15
Guatemala36%
Panama35%
El Salvador16%
Chile10%
Mexico3%
Guatemala36%
Panama21%
El Salvador9%
Chile29%
Mexico4%
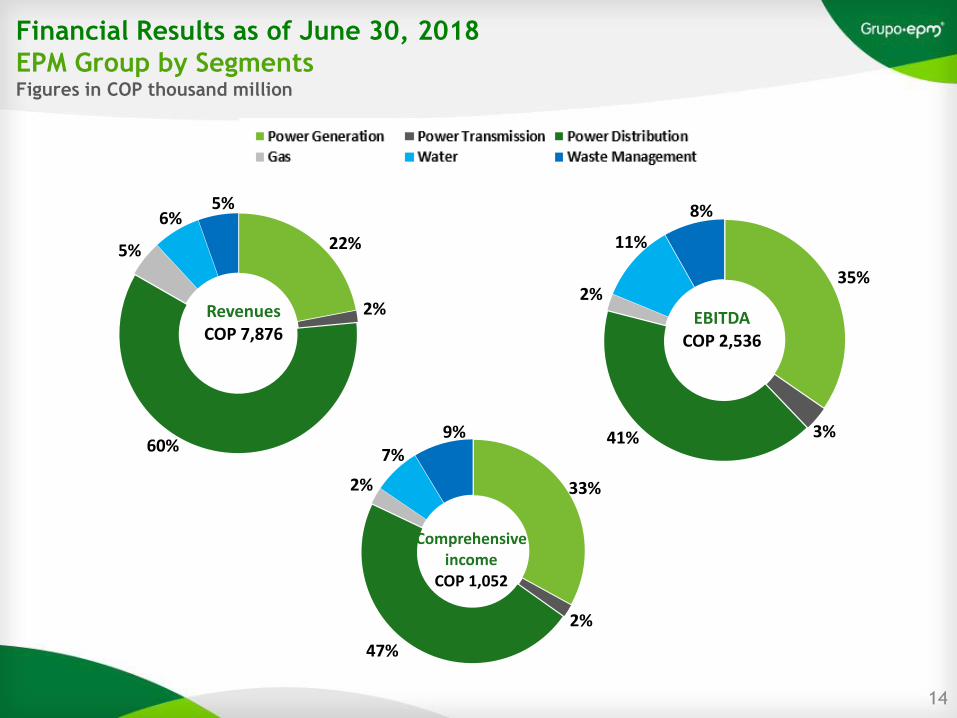
Financial Results as of June 30, 2018
EPM Group by SegmentsFigures in COP thousand million
14
22%
2%
60%
5%
6%5%
RevenuesCOP 7,876
35%
3%41%
2%
11%
8%
EBITDACOP 2,536
33%
2%
47%
2%
7%9%
Comprehensiveincome
COP 1,052
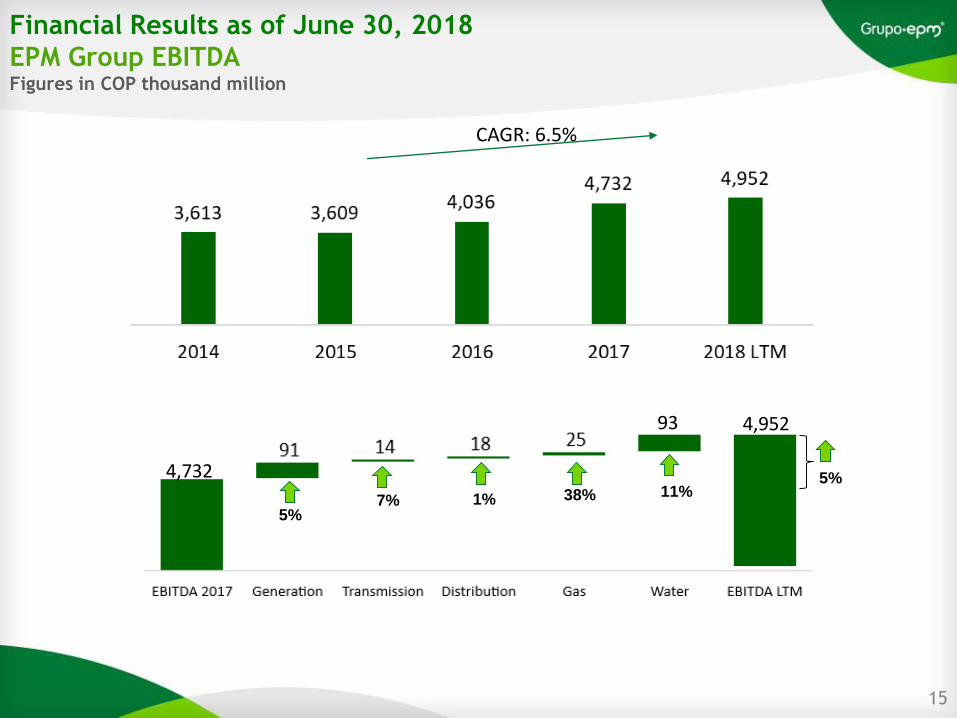
Financial Results as of June 30, 2018
EPM Group EBITDAFigures in COP thousand million
15
CAGR: 6.5%
5%
5%
11%1% 38%7%
4,732
4,95293
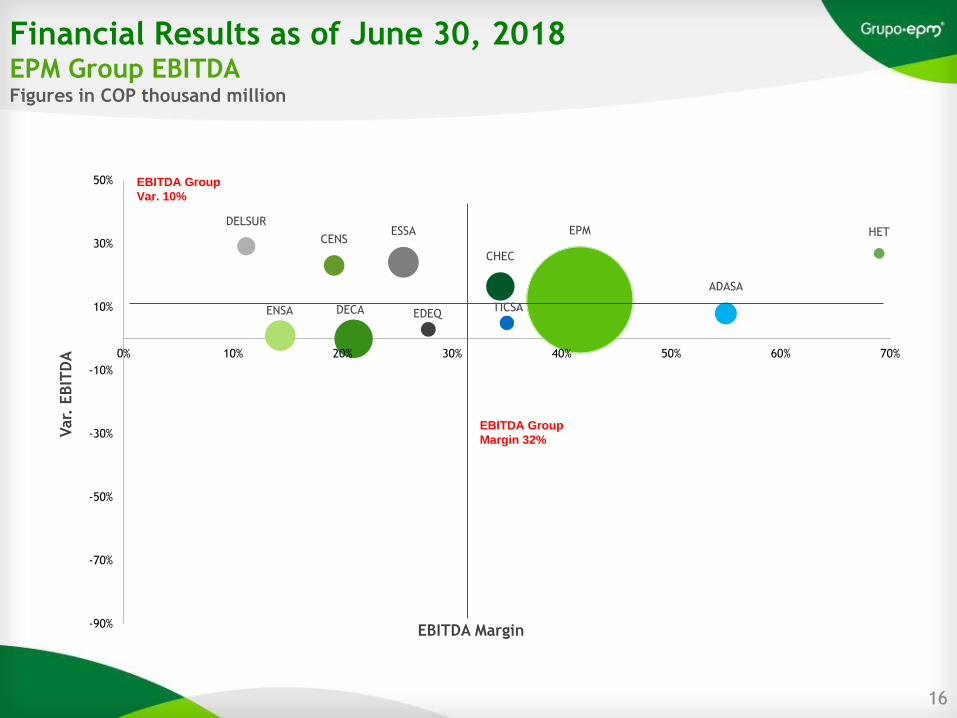
EPMESSACENS
CHEC
EDEQDECA
DELSUR
ENSA
HET
TICSA
ADASA
-90%
-70%
-50%
-30%
-10%
10%
30%
50%
0% 10% 20% 30% 40% 50% 60% 70%
Var.
EBIT
DA
EBITDA Margin
EBITDA Group
Margin 32%
EBITDA Group
Var. 10%
Financial Results as of June 30, 2018EPM Group EBITDAFigures in COP thousand million
16
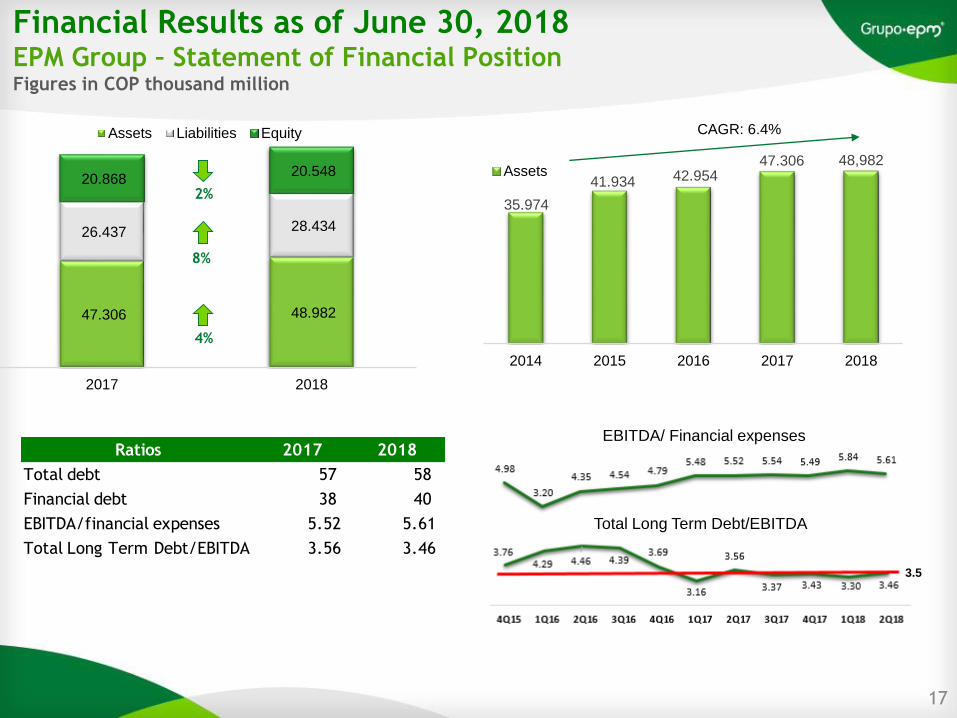
47.306 48.982
26.437 28.434
20.868 20.548
2017 2018
Assets Liabilities Equity
2%
8%
4%
CAGR: 6.4%
17
3.5
Financial Results as of June 30, 2018EPM Group – Statement of Financial PositionFigures in COP thousand million
35.974
41.934 42.954 47.306 48,982
2014 2015 2016 2017 2018
Assets
Ratios 2017 2018
Total debt 57 58
Financial debt 38 40
EBITDA/financial expenses 5.52 5.61
Total Long Term Debt/EBITDA 3.56 3.46
Total Long Term Debt/EBITDA
EBITDA/ Financial expenses
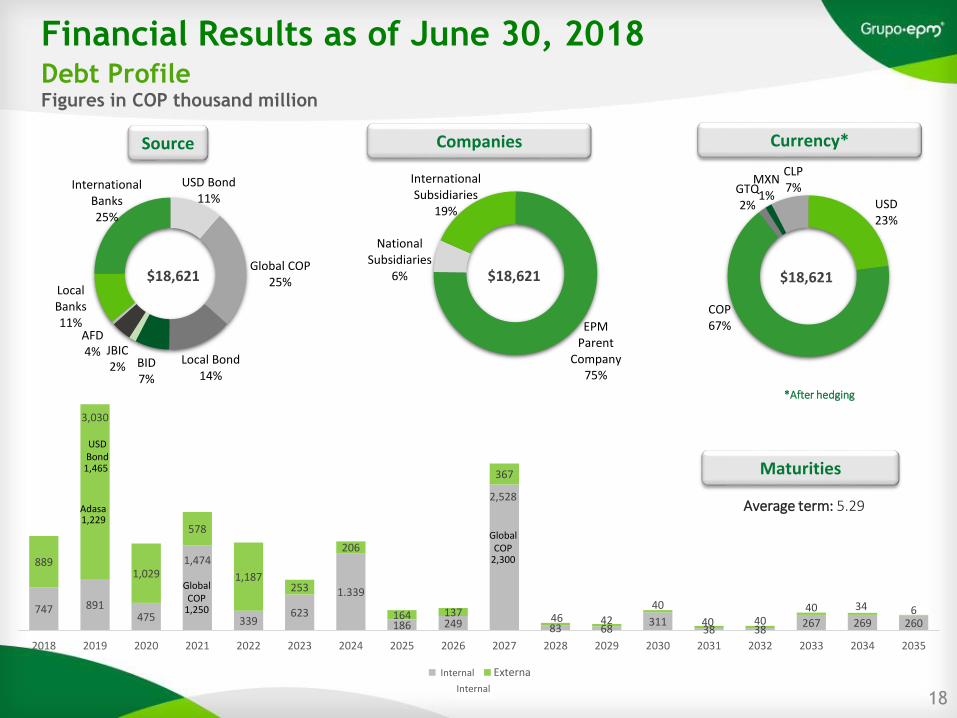
747 891475
1,474
339623
1.339
186 249
2,528
83 68311
38 38267 269 260
889
3,030
1,029
578
1,187253
206
164 137
367
46 42
40
40 4040 34 6
2018 2019 2020 2021 2022 2023 2024 2025 2026 2027 2028 2029 2030 2031 2032 2033 2034 2035
Interna Externa
1,229
1,465
Adasa
USDBond
Financial Results as of June 30, 2018Debt ProfileFigures in COP thousand million
Maturities
Average term: 5.29
*After hedging
$18,621 $18,621$18,621
Source Currency*Companies
USD Bond11%
Global COP25%
Local Bond14%
BID7%
JBIC2%
AFD4%
Local Banks11%
International Banks25%
USD23%
COP67%
GTQ2%
MXN1%
CLP7%
EPM Parent
Company75%
National Subsidiaries
6%
International Subsidiaries
19%
18
1,250
GlobalCOP
GlobalCOP
2,300
Internal
Internal
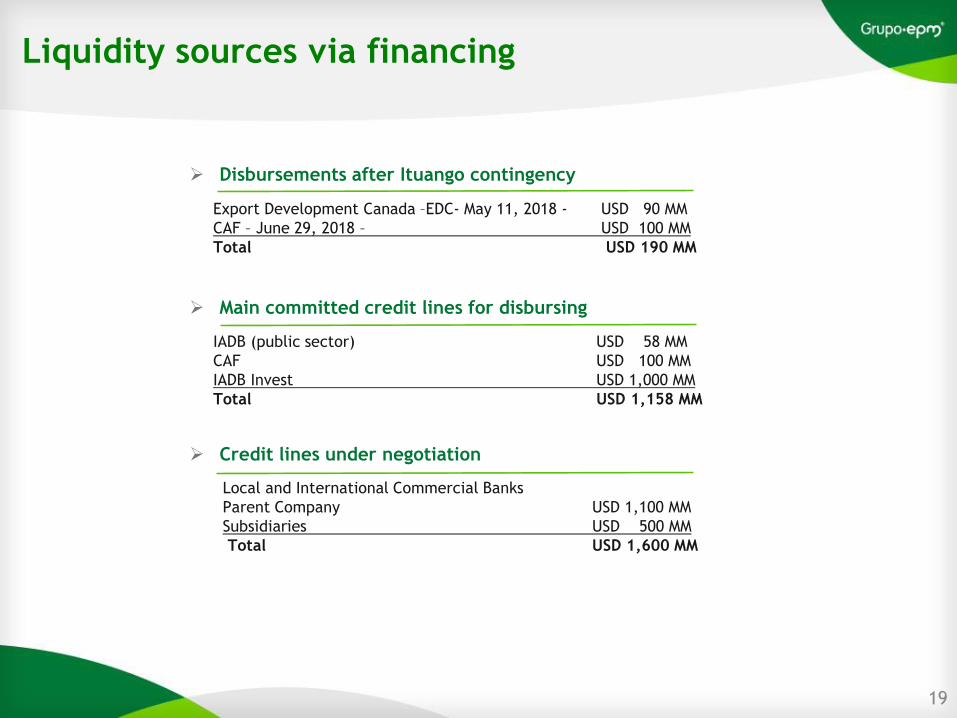
Liquidity sources via financing
19
➢ Disbursements after Ituango contingency
Export Development Canada –EDC- May 11, 2018 - USD 90 MM
CAF – June 29, 2018 – USD 100 MM
Total USD 190 MM
➢ Main committed credit lines for disbursing
IADB (public sector) USD 58 MM
CAF USD 100 MM
IADB Invest USD 1,000 MM
Total USD 1,158 MM
➢ Credit lines under negotiation
Local and International Commercial Banks
Parent Company USD 1,100 MM
Subsidiaries USD 500 MM
Total USD 1,600 MM
Disclaimer
o Below is a general information presentation about Empresas Públicas de Medellín ESP and its Subsidiaries, as on the date of
presentation. The materials herein contained have been summarized and do not intend to be complete.
o This presentation contains forward-looking statements which are subject to several risks, uncertainties and circumstances
relative to the operations and business environments of EPM. These factors could cause actual results to materially differ
from any future result, expressed or implied, in such forward-looking statements. Accordingly, EPM cannot guarantee any
results or future events. EPM expressly states that it will be under no obligation to update the forward-looking statements
or any other information herein contained.
o This presentation does not constitute any offer or invitation to offer, or a recommendation to enter into any transaction,
agreement or contract with EPM. This presentation is for debate only and shall be referred to considering only the verbal
information supplied by EPM, otherwise it would be incomplete. Neither this nor any of its contents may be used for any
other purpose without the prior written consent of EPM.
o Only for information matters and reader's convenience, figures in COP were translated in this presentation into their USD
equivalent using the exchange rate of COP/USD $2,930.8 as of June 30, 2018, issued by the Colombian Financial
Superintendence. Such translations do not agree with US GAAP and have not been audited. Also, they shall not be
interpreted as representation of the amounts in Colombian Pesos, which could be translated into US Dollars at this or at any
other rate.

http://www.epm.com.co/site/inversionistas/Inversionistas.aspx