2h 2020 - effectv
TRANSCRIPT
2 H 2 0 2 0


CONTENTS
Executive Summary 4
Introduction 7
Time Spent with TV 8
How Viewers View 14
Effectv Insights: The Rise of Live 19
Summary 24
Contributors 25
P.3 - THE TV VIEWERSHIP REPORT - TablE Of CONTENTS© 2021 COMCAST. ALL RIGHTS RESERVED. COMCAST CONFIDENTIAL AND PROPRIETARY INFORMATION.
EXECUTIVE SUMMARY THE CURRENT STaTE Of TV VIEWING aCROSS THE COMCaST fOOTPRINT
In this edition of The TV Viewership Report, we explore viewership trends for the second half of 2020 (2H ‘20), with some comparisons to the same time period in the previous year.
As with the previous Q2 special edition report, TV viewership remained high, particularly with cable and live TV. The impacts of our “new normal” have shaped viewership patterns and behaviors overall, however the recorded shift toward live TV is significant—especially when you consider the stop, starts and re-starts of live and tentpole events last year.
Pent up anticipation for live sports and entertainment, as well as the need for up-to-date news and information during a historic election cycle and evolving global health crisis, can be attributed to fueling the increase in live cable TV viewing.
P.4 - THE TV VIEWERSHIP REPORT - ExECUTIVE SUMMaRy© 2021 COMCAST. ALL RIGHTS RESERVED. COMCAST CONFIDENTIAL AND PROPRIETARY INFORMATION.

2H 2020 KEy fINDINGS
01 Cable TV viewing saw its highest share of time spent in Q3 ‘20,
with 71% of all time being spent with cable.
02 Comcast households (HHs) saw a shift toward live TV in
2H ’20, accounting for 89% of daily viewership. There was a 16-minute year-over-year (YoY) increase in live viewing for Q3, and a 10-minute YoY increase in Q4.
03 Over the last three full years of viewing data, time
spent with cable networks and live viewing has been up or flat YoY every quarter.
04 Cable TV news drove a large percentage of the increase
in time spent with live TV in 2H ‘20 at 25%, up from just 16% the same time the previous year.
P.5 - THE TV VIEWERSHIP REPORT - KEy fINDINGS© 2021 COMCAST. ALL RIGHTS RESERVED. COMCAST CONFIDENTIAL AND PROPRIETARY INFORMATION.


INTRODUCTION TIME SPENT WITH CablE & lIVE TV UP aS VIEWERS WaTCH ENTERTaINMENT PROGRaMMING & NEWS
In 2020, Cable TV saw its highest share of time spent—compared to previous quarters of recorded data— with 71% of time spent being with cable versus broadcast and premium networks in Q3.
While viewership patterns and behaviors are changing for a myriad of reasons, the recorded shift toward live cable TV viewing during the second half of the year is significant.
A recorded sixteen-minute increase YoY in live TV viewing for Q3 ‘20 and a ten-minute increase in Q4 show a trend in audiences spending more time with live content over other viewing experiences.
Cable news drove a large proportion of the live tune-in increase, however there are other network genres like sports, entertainment, and lifestyle driving live TV growth as well. While cable news kept viewers informed, entertainment served as a welcome respite for audiences: entertainment made up 38% of live viewing share and cable news accounted for 25% in 2H ‘20.
The data in this report will look at how and where TV audiences are spending their time by aggregating data from more than 17 million Comcast HHs across 65 markets. Additionally, the data is based on 16.3 billion hours of viewing.
This report, published bi-annually, provides insights to help marketers use TV’s reach and precision to be more effective in delivering results than ever before.
P.7 - THE TV VIEWERSHIP REPORT - INTRODUCTION© 2021 COMCAST. ALL RIGHTS RESERVED. COMCAST CONFIDENTIAL AND PROPRIETARY INFORMATION.

TIME SPENT WITH TV TIME SPENT WITH TV SHIfTS TOWaRDS lIVE VIEWING
+16 MINUTE VIEWING SHIFT FOR LIVE TV IN Q3 & +10 MINUTE SHIFT IN Q4
In the second half of 2020 there was an increase of +16 minutes in viewing time per day in Q3 ‘20 versus 2019 and an increase of 10+ minutes in Q4 ‘20 versus 2019. Live TV viewing accounted for 89% of daily viewing time, with VOD/DVR accounting for 11% across Comcast HHs for 2H ‘20. In Q3 ‘20 there was an average of 6 hours and 18 minutes of time spent with TV per day and in Q4 ‘20 there was an average of 6 hours and 31 minutes.
Comcast Aggregate Household Viewership Data. Average daily time spent with live and time-shifted (DVR/VOD) viewing. Time period as indicated in chart.
Q3 2020
6:18
Time spent per day
Q4 2020
6:31
Time spent per day
VOD / DVR 0:42 Hours Daily
VOD / DVR 0:42 Hours Daily
Live 5:36 Hours Daily
Live 5:49 Hours Daily
P.8 - THE TV VIEWERSHIP REPORT - TIME SPENT WITH TV© 2021 COMCAST. ALL RIGHTS RESERVED. COMCAST CONFIDENTIAL AND PROPRIETARY INFORMATION.

TIME SPENT WITH TV lIVE VIEWING SHaRE GROWS IN 2H ‘20
Looking at the full-year trend of live viewing share, Q1 and Q2 remained relatively stable, but Q3 and Q4 saw large spikes in growth versus the previous year.
Comcast Aggregate Household Viewership Data. Shift in live share of total viewing. Q1 2019 – Q4 2020.
20202019
Q1
86% 86%
Q2
86% 86%
Q3
87%
89%
Q4
87%
89%
P.9 - THE TV VIEWERSHIP REPORT - TIME SPENT WITH TV© 2021 COMCAST. ALL RIGHTS RESERVED. COMCAST CONFIDENTIAL AND PROPRIETARY INFORMATION.
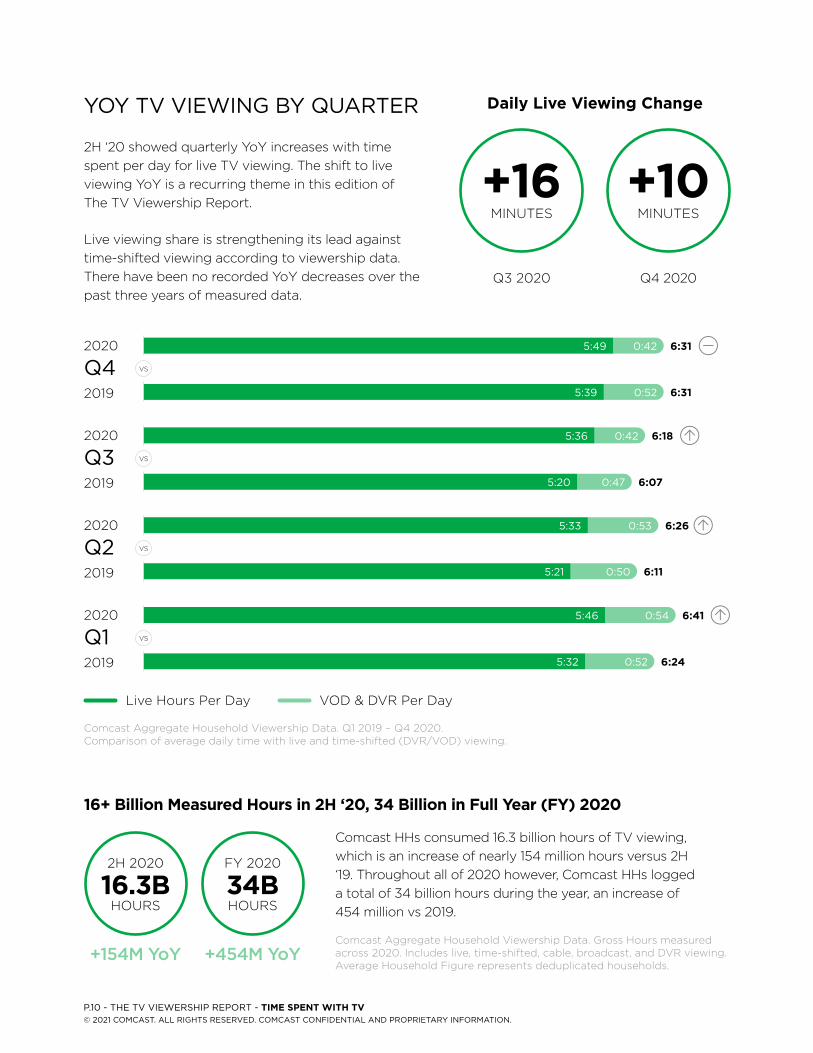
YOY TV VIEWING BY QUARTER
2H ‘20 showed quarterly YoY increases with time spent per day for live TV viewing. The shift to live viewing YoY is a recurring theme in this edition of The TV Viewership Report.
Live viewing share is strengthening its lead against time-shifted viewing according to viewership data. There have been no recorded YoY decreases over the past three years of measured data.
16+ billion Measured Hours in 2H ‘20, 34 billion in full year (fy) 2020
Comcast Aggregate Household Viewership Data. Q1 2019 – Q4 2020. Comparison of average daily time with live and time-shifted (DVR/VOD) viewing.
Live Hours Per Day VOD & DVR Per Day
5:21 0:50 6:11
Q22020
2019
VS
5:33 0:53 6:26
Comcast HHs consumed 16.3 billion hours of TV viewing, which is an increase of nearly 154 million hours versus 2H ‘19. Throughout all of 2020 however, Comcast HHs logged a total of 34 billion hours during the year, an increase of 454 million vs 2019.
Comcast Aggregate Household Viewership Data. Gross Hours measured across 2020. Includes live, time-shifted, cable, broadcast, and DVR viewing. Average Household Figure represents deduplicated households.
Q12020
2019
VS
5:46 0:54 6:41
6:245:32 0:52
Q32020
2019
VS
5:36 0:42 6:18
6:075:20 0:47
Q42020
2019
VS
5:49 0:42 6:31
6:315:39 0:52
+16MINUTES
+10MINUTES
Q3 2020 Q4 2020
Daily live Viewing Change
16.3b 34bHOURS HOURS
2H 2020 FY 2020
+154M YoY +454M YoY
P.10 - THE TV VIEWERSHIP REPORT - TIME SPENT WITH TV© 2021 COMCAST. ALL RIGHTS RESERVED. COMCAST CONFIDENTIAL AND PROPRIETARY INFORMATION.
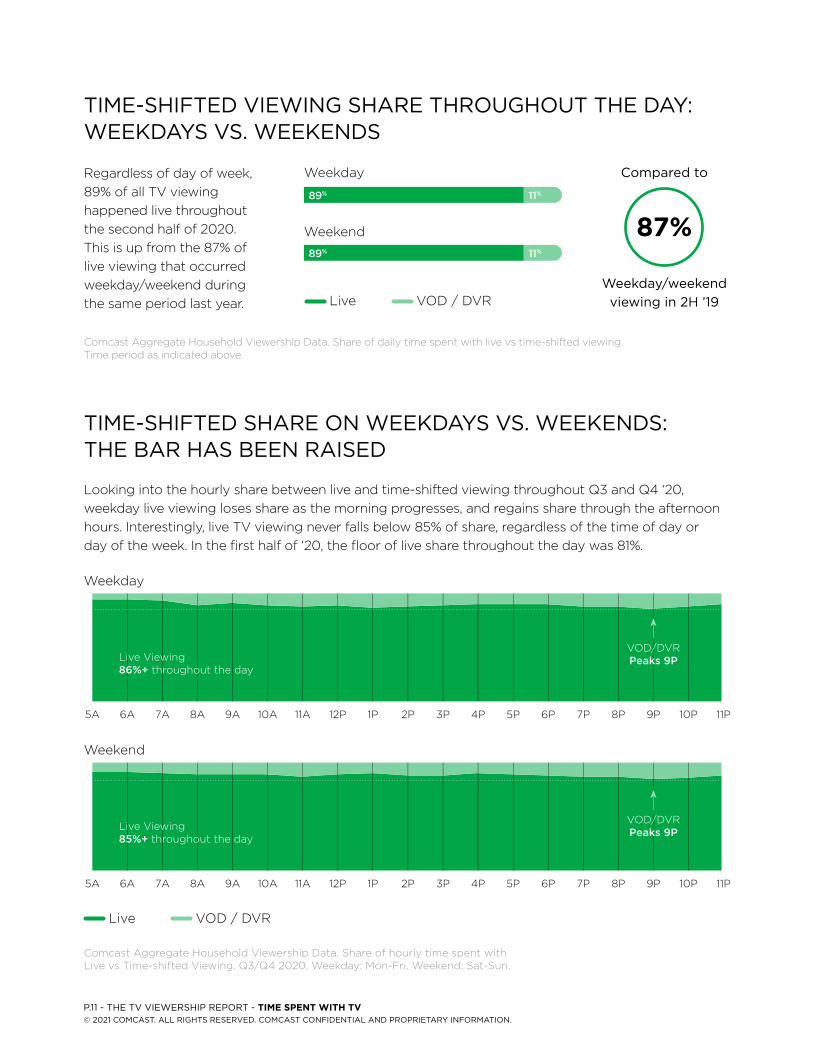
Regardless of day of week, 89% of all TV viewing happened live throughout the second half of 2020. This is up from the 87% of live viewing that occurred weekday/weekend during the same period last year.
Comcast Aggregate Household Viewership Data. Share of daily time spent with live vs time-shifted viewing. Time period as indicated above.
TIME-SHIFTED VIEWING SHARE THROUGHOUT THE DAY: WEEKDAYS VS. WEEKENDS
VOD / DVRLive
Weekday
Weekend
89% 11%
11%89%
Looking into the hourly share between live and time-shifted viewing throughout Q3 and Q4 ‘20, weekday live viewing loses share as the morning progresses, and regains share through the afternoon hours. Interestingly, live TV viewing never falls below 85% of share, regardless of the time of day or day of the week. In the first half of ‘20, the floor of live share throughout the day was 81%.
TIME-SHIFTED SHARE ON WEEKDAYS VS. WEEKENDS: THE BAR HAS BEEN RAISED
VOD / DVRLive
Comcast Aggregate Household Viewership Data. Share of hourly time spent with Live vs Time-shifted Viewing. Q3/Q4 2020. Weekday: Mon-Fri. Weekend: Sat-Sun.
Weekday
12P 3P6A 6P9A 9P1P 4P7A 7P10A 10P2P5A 5P8A 8P11A 11P
VOD/DVR Peaks 9PLive Viewing
86%+ throughout the day
Weekend
12P 3P6A 6P9A 9P1P 4P7A 7P10A 10P2P5A 5P8A 8P11A 11P
Live Viewing 85%+ throughout the day
VOD/DVR Peaks 9P
Weekday/weekend viewing in 2H ’19
Compared to
87%
P.11 - THE TV VIEWERSHIP REPORT - TIME SPENT WITH TV© 2021 COMCAST. ALL RIGHTS RESERVED. COMCAST CONFIDENTIAL AND PROPRIETARY INFORMATION.

VIDEO ON DEMAND CONTENT CONTINUES GROWTH
While time spent with VOD decreased slightly during 2H ‘20 (a decrease of 3 minutes in Q3 and 6 minutes in Q4 ‘20), the majority of Comcast HHs (79%) watched VOD in 2H 2020. Moreover, there are more titles being watched than ever before: the average number of VOD titles watched monthly increased +10% YoY and +40% from just two years ago.
Number of VOD Titles Watched Per Month
Source: Comcast Aggregate Household Viewership Data. Average VOD titles watched monthly.*2016 based on Oct-Dec.
*VOD titles: TV shows and movies watched.Comcast Aggregate Household Viewership data. Time period includes total Q3/Q4 viewing, unless indicated otherwise.
2020 116,000
105,000
82,800
76,000
52,700
2019
2018
2017
2016*
79%
HHs watched VOD Decrease in daily time spent with VOD
Q3: (0:21 in ‘20 vs. 0:24 in ‘19) Q4: (0:19 in ‘20 vs. 0:25 in ’19)
Avg. number watched by HHs during 2H 2020
VOD content YoY growth
(116K titles in ‘20 vs. 105K in ‘19)
+10% -4MINUTES
40VOD TITLES*
P.12 - THE TV VIEWERSHIP REPORT - TIME SPENT WITH TV© 2021 COMCAST. ALL RIGHTS RESERVED. COMCAST CONFIDENTIAL AND PROPRIETARY INFORMATION.


DIVERSE VIEWING PaTTERNS
aDDITIONal faCTS
311Top
Networks
33Different Networks
When looking at the networks with the most viewing per household, there were 311 different “most-watched” networks across Comcast HHs during 2H ‘20.
Choice and new ways to discover content means consumers continue to watch a diverse set of channels. HHs watched an average of 33 different networks in 2H ‘20.
Comcast Aggregate Household Viewership Data. 2H 2020. Number of most watched networks across 17m households. Minimum of 100 households in threshold.
Comcast Aggregate Household Viewership Data. Average number of networks viewed per month during Q3 and Q4.
*Comcast Aggregate Household Viewership Data. 2H 2020. Percentage of viewing occurring outside the house of 7p-11p. Average per quarter.**Comcast Aggregate Household Viewership Data. Q2 2020. Percentage that top 5 viewed networks made up in terms of share of total viewing per quarter.
Households watch different networks and view throughout the day. 71% of live viewing occurs outside of primetime.*
As all households watch differently, advertisers can’t rely on the “most-watched” networks alone to achieve scale. The top 5 networks accounted for 33% of all viewing in H2 ‘20.**
HOW VIEWERS VIEW
P.14 - THE TV VIEWERSHIP REPORT - HOW VIEWERS VIEW© 2021 COMCAST. ALL RIGHTS RESERVED. COMCAST CONFIDENTIAL AND PROPRIETARY INFORMATION.

*Comcast Aggregate Household Viewership Data. Percentage share of viewing between Cable, Broadcast, and Premium network categories. Categories defined above. Time period as indicated.** Source: Comcast Aggregate Household Viewership Data. Trend of cable networks share of viewing. 2019-2020.
Cable
Traditional cable networks that do not fall into the premium cable, broadcast affiliate, independent or Spanish-language broadcast categories
broadcast
“Big Four” networks (ABC, FOX, CBS, NBC) plus independent broadcast networks and Spanish-language broadcast
Premium
All premium non-ad supported cable networks (e.g., HBO, Showtime, Starz, Epix, Cinemax etc.)
Cable
Broadcast
Premium
CABLE TV CROSSES 70% SHARE FOR FIRST TIME
In 2H ‘20, the share of viewing for cable networks was slightly higher than normal. Cable viewing reached 71% share in Q3 ‘20 for the first time in recorded data.*
71%
27%
2%
Q3 2020
68%
31%
1%
Q4 2020
CABLE SHARE SHOWS STRONG GROWTH IN 2H 2020
The yearly trend for cable TV’s share shows how it shifts overall in terms of seasonality, with 2020 share showing strong growth versus 2019 for each quarter.**
20202019
Q1
Q2
Q3
Q4 64%
68%
68%
71%
65%
66%
67%
68%
P.15 - THE TV VIEWERSHIP REPORT - HOW VIEWERS VIEW© 2021 COMCAST. ALL RIGHTS RESERVED. COMCAST CONFIDENTIAL AND PROPRIETARY INFORMATION.

VIEWING SHARE QUARTER BY QUARTER
Cable TV viewing share remained strong over 2H ‘20. Looking back at full year comparisons for 2019 and 2020, the share of time spent with cable networks has increased throughout every quarter of 2020.
Source: Comcast Aggregate Household Viewership Data. Q1 2019 – Q4 2020. Shift in share of viewing between cable, broadcast, and premium networks. Categories defined above.
BroadcastCable Premium
Q12020
2019
VS
67% 28% 5%
65% 30% 5%
Q4 VS
201967% 28% 5%
202068% 31% 1%
Q22020
2019
VS
67% 28% 5%
68% 29% 3%
Q3 VS
202071% 27% 2%
201968% 28% 4%
P.16 - THE TV VIEWERSHIP REPORT - HOW VIEWERS VIEW© 2021 COMCAST. ALL RIGHTS RESERVED. COMCAST CONFIDENTIAL AND PROPRIETARY INFORMATION.
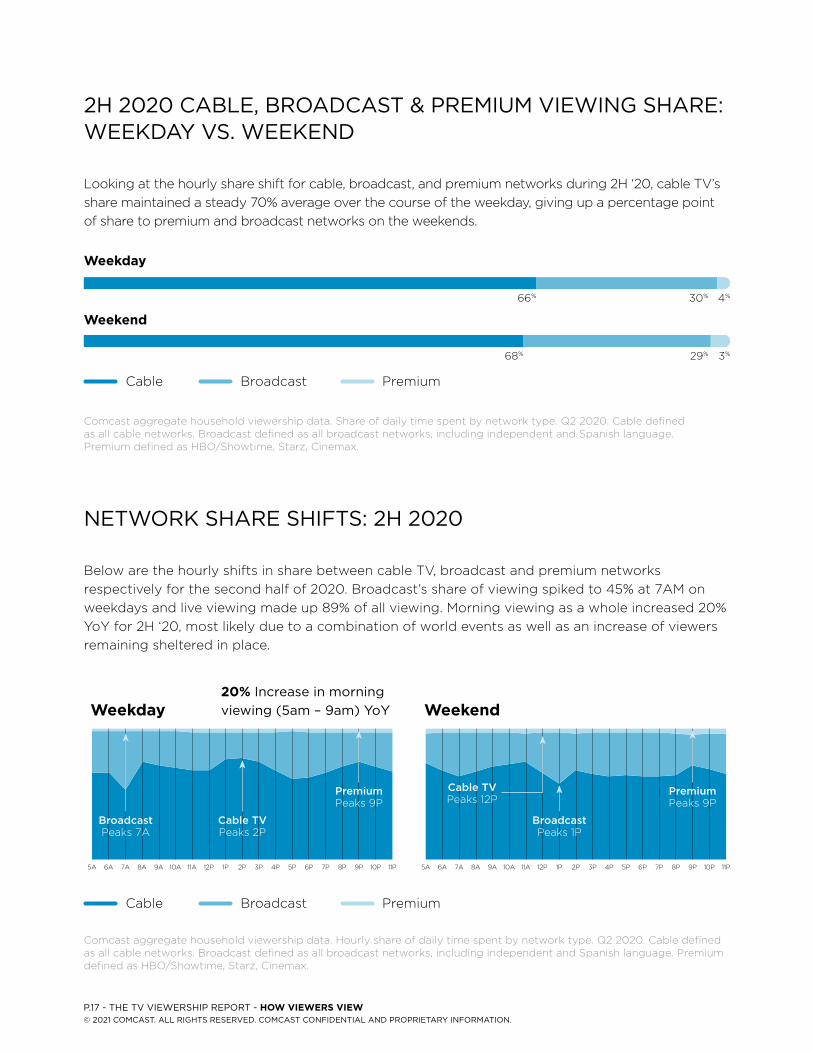
2H 2020 CABLE, BROADCAST & PREMIUM VIEWING SHARE: WEEKDAY VS. WEEKEND
Looking at the hourly share shift for cable, broadcast, and premium networks during 2H ‘20, cable TV’s share maintained a steady 70% average over the course of the weekday, giving up a percentage point of share to premium and broadcast networks on the weekends.
NETWORK SHARE SHIFTS: 2H 2020
Below are the hourly shifts in share between cable TV, broadcast and premium networks respectively for the second half of 2020. Broadcast’s share of viewing spiked to 45% at 7AM on weekdays and live viewing made up 89% of all viewing. Morning viewing as a whole increased 20% YoY for 2H ‘20, most likely due to a combination of world events as well as an increase of viewers remaining sheltered in place.
Comcast aggregate household viewership data. Hourly share of daily time spent by network type. Q2 2020. Cable defined as all cable networks. Broadcast defined as all broadcast networks, including independent and Spanish language. Premium defined as HBO/Showtime, Starz, Cinemax.
Comcast aggregate household viewership data. Share of daily time spent by network type. Q2 2020. Cable defined as all cable networks. Broadcast defined as all broadcast networks, including independent and Spanish language. Premium defined as HBO/Showtime, Starz, Cinemax.
Weekday
66% 30% 4%
Weekend
68% 29% 3%
BroadcastCable Premium
BroadcastCable Premium
Weekend
12P 3P6A 6P9A 9P1P 4P7A 7P10A 10P2P5A 5P8A 8P11A 11P
Cable TV Peaks 12P
Broadcast Peaks 1P
Premium Peaks 9P
Weekday
12P 3P6A 6P9A 9P1P 4P7A 7P10A 10P2P5A 5P8A 8P11A 11P
Broadcast Peaks 7A
Cable TV Peaks 2P
Premium Peaks 9P
20% Increase in morning viewing (5am – 9am) YoY
P.17 - THE TV VIEWERSHIP REPORT - HOW VIEWERS VIEW© 2021 COMCAST. ALL RIGHTS RESERVED. COMCAST CONFIDENTIAL AND PROPRIETARY INFORMATION.

EFFECTV INSIGHTS DISSECTING 2H 2020 VIEWING
P.18 - THE TV VIEWERSHIP REPORT - EffECTV INSIGHTS© 2021 COMCAST. ALL RIGHTS RESERVED. COMCAST CONFIDENTIAL AND PROPRIETARY INFORMATION.
THE RISE Of lIVEThe postponements, starts and re-starts of sporting events, a historic and turbulent political season, social and racial unrest, an unprecedented global health crisis... the list goes on. The year 2020 was a wild ride for many reasons. As consumers were faced with stay-at-home orders, they relied on the latest news and craved escape in the form of new and exciting entertainment. Significant changes in viewership and behavior were to be expected.
However, the way in which audiences tuned in presented new trends in recorded data, which will provide the focus of a deeper analysis in this section of the report. The many key moments and macro factors during 2020 certainly contributed to the trends associated with various networks and select genres.
The increase in live cable TV viewing against the backdrop of increasing libraries of VOD content is certainly interesting. So, what do these shifts look like and how do they differ by programming genre?
EFFECTV INSIGHTS
P.19 - THE TV VIEWERSHIP REPORT - EffECTV INSIGHTS© 2021 COMCAST. ALL RIGHTS RESERVED. COMCAST CONFIDENTIAL AND PROPRIETARY INFORMATION.
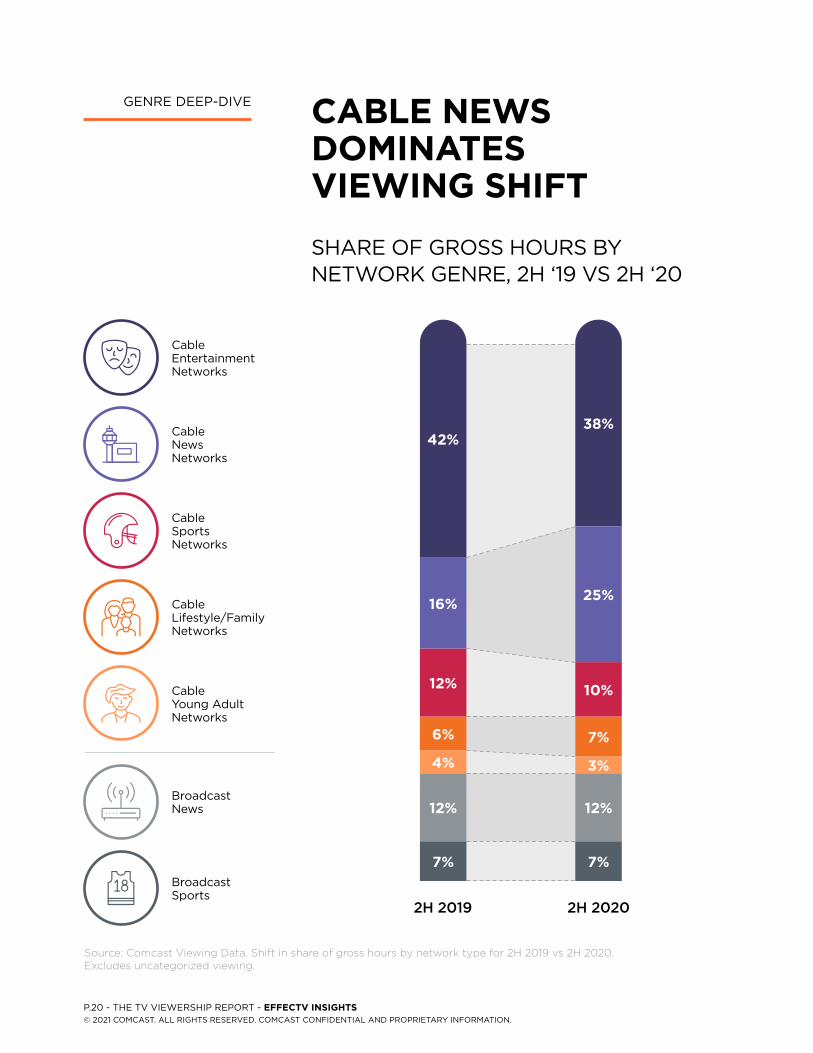
GENRE DEEP-DIVE CablE NEWS DOMINaTES VIEWING SHIfT
SHARE OF GROSS HOURS BY NETWORK GENRE, 2H ‘19 VS 2H ‘20
Source: Comcast Viewing Data. Shift in share of gross hours by network type for 2H 2019 vs 2H 2020. Excludes uncategorized viewing.
Cable Entertainment Networks
Cable Young Adult Networks
Cable Sports Networks
Broadcast Sports
Cable News Networks
Broadcast News
Cable Lifestyle/Family Networks
2H 2019
42%
16%
12%
6%
4%
12%
7%
2H 2020
38%
25%
10%
7%
3%
12%
7%
P.20 - THE TV VIEWERSHIP REPORT - EffECTV INSIGHTS© 2021 COMCAST. ALL RIGHTS RESERVED. COMCAST CONFIDENTIAL AND PROPRIETARY INFORMATION.

GENRE DEEP-DIVE DISSECTING 2H VIEWING by INCOME lEVElSAs household income levels increase, viewing shifts away from entertainment networks, and toward news and sports networks for cable. Also, share for broadcast programming (news and sports) declines as income increases.
Source: Comcast Viewing Data. Shift in share of gross hours by network type 2H 2020 by income levels. Household Income Segments courtesy of Experian. Excludes uncategorized viewing.
Cable Entertainment Networks
Cable Young Adult Networks
Cable Sports Networks
Broadcast Sports
Cable News Networks
Broadcast News
Cable Lifestyle/Family Networks
41%
24%
8%
6%
3%
13%
6%
<$50K
38%
25%
9%
7%
3%
12%
6%
$50K–$100K
33%
28%
12%
7%
3%
11%
8%
$100K+
P.21 - THE TV VIEWERSHIP REPORT - EffECTV INSIGHTS© 2021 COMCAST. ALL RIGHTS RESERVED. COMCAST CONFIDENTIAL AND PROPRIETARY INFORMATION.

GENRE DEEP-DIVE DISSECTING 2H ‘20 VIEWING by PROGRaMMING GENRE
Entertainment 42% 38% Viewing Share Although nearly 60% of scripted series experienced delayed production* as a result of the global health crisis, networks with programming related to reality television or scripted series still maintained the highest share of viewing. This slight shift in share offsets a stronger decrease in availability, with a -9% decrease in available programming in 2020.*
News 16% 25% Viewing Share With live viewing increases, it may be no surprise that the share of viewing for cable news networks increased as well. Compared to 2019, there was a +63% increase in gross hours measured for cable news networks. Cable news will likely continue to see viewing shifts when viewers look to their favorite networks and channels for updates on current events.
Sports 12% 10% Viewing Share The return of sports to the viewing ecosystem in Q2 ‘20 created a large boost in viewership, however cable TV sports networks saw a dip in share of viewing overall for 2H ’20, largely driven by the postponements and delays in College Football, NFL, MLB, and Tennis.**
*Source: Deadline. “Coronavirus Shutdown Will Delay 60% Of U.S. & Global Drama As Scripted Hangover Set To Extend Well In 2021”
** Source: Comcast Viewing Data. Shift in share of gross hours by network type for 2H 2019 vs 2H 2020. Excludes uncategorized viewing.
*** Source: Nielsen. Change in GRPs for 2H 2019 vs 2H 2020 across cable sports networks.
-9%Decrease in original
programming
+63%Increase in
gross hours for cable news
-2%Share decrease.
Driven by college football, NFL,
NBA, Tennis***
P.22 - THE TV VIEWERSHIP REPORT - EffECTV INSIGHTS© 2021 COMCAST. ALL RIGHTS RESERVED. COMCAST CONFIDENTIAL AND PROPRIETARY INFORMATION.
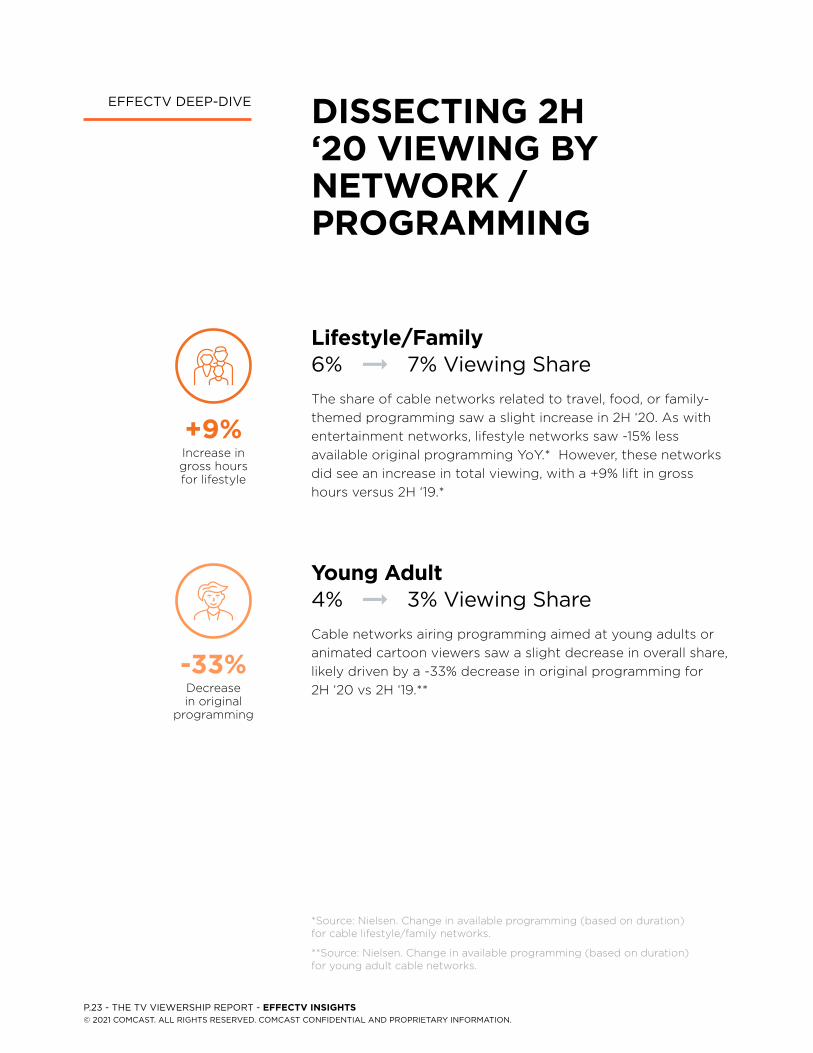
EFFECTV DEEP-DIVE DISSECTING 2H ‘20 VIEWING by NETWORK / PROGRaMMING
lifestyle/family 6% 7% Viewing Share The share of cable networks related to travel, food, or family-themed programming saw a slight increase in 2H ‘20. As with entertainment networks, lifestyle networks saw -15% less available original programming YoY.* However, these networks did see an increase in total viewing, with a +9% lift in gross hours versus 2H ‘19.*
young adult 4% 3% Viewing Share Cable networks airing programming aimed at young adults or animated cartoon viewers saw a slight decrease in overall share, likely driven by a -33% decrease in original programming for 2H ‘20 vs 2H ‘19.**
+9%Increase in gross hours for lifestyle
-33%Decrease in original
programming
*Source: Nielsen. Change in available programming (based on duration) for cable lifestyle/family networks.
**Source: Nielsen. Change in available programming (based on duration) for young adult cable networks.
P.23 - THE TV VIEWERSHIP REPORT - EffECTV INSIGHTS© 2021 COMCAST. ALL RIGHTS RESERVED. COMCAST CONFIDENTIAL AND PROPRIETARY INFORMATION.
SUMMARY 2H 2020 WRaP UP
As we’ve seen with recorded data and trends in viewership, 2020 television consumption was strong as viewers sought out and watched both news and entertainment content. A year defined by a unique set of circumstances contributed to viewership behavior that was different and more nuanced than in the past, highlighting the importance of meeting audiences where they are.
Cable TV saw its highest share of time spent at 71% vs. broadcast and premium networks in Q3 ’20 and within that, a significant portion of the viewing was done live. Live cable TV drove daily viewership, accounting for 89% for 2H ’20, showing viewers in Comcast HHs crave the most up-to-date, timely and relevant information and want to participate in “TV moments” when they’re happening. A further examined look at 2H ’20 viewing showed that of all the live content available to watch, cable news and lifestyle/family networks lead the list of genre choices.
Data-driven approaches based on viewership trends and insights continue to help savvy marketers reach their audiences during moments that are at times unprecedented, uncertain and in motion with the world we live in.
P.24 - THE TV VIEWERSHIP REPORT - SUMMaRy© 2021 COMCAST. ALL RIGHTS RESERVED. COMCAST CONFIDENTIAL AND PROPRIETARY INFORMATION.

CONTRIBUTORS aUTHOR bIOS
HEaTHER COGHIll Heather is senior director of audience insights for Effectv. In her role, she builds narratives around Comcast’s internal viewing data to educate internal and external stakeholders on marketplace trends. Heather has 15 years of experience, overseeing strategic research on broad and specific audience segments, including Gen Z, Millenials,
Women and Multicultural audiences.
TRaVIS flOOD Travis is the director of customer insights at Effectv. In this role, he uncovers new data insights to help advertisers better understand and implement audience-based buying strategies. Travis combines his passion for learning, an innovative spirit and 20+ years of advertising
experience to deliver actionable guidance to customers.
CHRIS MCGINNIS Chris is a senior analyst of audience insights at Effectv. In this position, he leverages his passion for data storytelling to develop narratives that educate both internal stakeholders and external industry leaders. Chris’ work enables both Comcast Advertising and external marketers
to better understand and value the evolving media landscape.
JaMES ROTHWEll James is responsible for agency, brand & industry relations at Comcast Advertising, in the U.S. and Europe. James creates thought leadership and leads advocacy through the Comcast Advertising Agency Leadership Council, the Effectv Automotive Advisory Council
and the FreeWheel Council for Premium Video.
lEE SINGlETaRy Lee manages Comcast Advertising’s advisory councils in America including the Comcast Advertising Agency Leadership Council and the Effectv Automotive Advisory Council. In this role, he connects industry influencers, clients and partners, explores market dynamics, and advocates for innovation to drive the industry forward.
P.25 - THE TV VIEWERSHIP REPORT - CONTRIbUTORS© 2021 COMCAST. ALL RIGHTS RESERVED. COMCAST CONFIDENTIAL AND PROPRIETARY INFORMATION.
