2d-qsar analysis of neocryptolepine analogues with ... · central journal of drug design and...
TRANSCRIPT

Central Journal of Drug Design and Research
Cite this article: Montalvo-Acosta JJ, Ibarra RG (2015) 2D-QSAR Analysis of Neocryptolepine Analogues with Antimalarial Activities. J Drug Des Res 2(3): 1017.
*Corresponding authorJoel José Montalvo-Acosta and Ricardo Gaitán Ibarra, Natural Products Group, Department of Pharmaceutical Science, Campus of Zaragocilla, University of Cartagena, Colombia, Tel/Fax: 57-5-6698179; Email:
Submitted: 24 May 2015
Accepted: 25 September 2015
Published: 28 September 2015
ISSN: 2379-089X
Copyright© 2015 Montalvo-Acosta et al.
OPEN ACCESS
Keywords•Neocryptolepine; 2D-QSAR•Malaria•Linear regression
Research Article
2D-QSAR Analysis of Neocryptolepine Analogues with Antimalarial ActivitiesJoel José Montalvo-Acosta#* and Ricardo Gaitán Ibarra#
Department of Pharmaceutical Science, University of Cartagena, Colombia#Both are equally contributed
Abstract
A series of neocryptolepine derivatives with antimalarial activity were subjected to two-dimensional quantitative structure-activity relationship (2D-QSAR) studies using stepwise multiple linear regressions for variables selection. The results of the study indicate that antimalarial activity of neocryptolepine analogues can be successfully explained in terms of physical (molecular weight and density) and surface properties of the molecules (vsa_don, TPSA and PEOE_VSA-6). The accuracy of the proposed multiple linear regression models was demonstrated using the following evaluation techniques: cross-validation, validation through an external test set and Y-randomization. Furthermore, the domain of applicability which indicates the area of reliable predictions is defined for each model. The results from the 2D-QSAR analysis developed in this study could be used in the design of more potent antimalarial neocryptolepine derivatives.
INTRODUCTIONMalaria remains a global health problem that mainly affects
developing countries in tropical and subtropical regions (WHO 2012). It has been estimated that there were 216 million episodes of malaria and that 655 000 people died from this disease in 2011 (WHO 2012). Malaria is caused by protozoa of the genus Plasmodium and there are five species that infect humans (P. falciparum, P. vivax, P. malariae, P. ovale and P. knowlesi) among which P. falciparum is the most lethal [1]. In the absence of effective antimalarial vaccines, low molecular weight antimalarial drugs are important treatments against the disease [2]. However, many traditional antimalarial drugs such as quinine, chloroquine, mefloquine, and artemisinin derivatives are ineffective because the widespread drug resistance in Plasmodium strains. Therefore, there is an urgent need for development new chemotherapeutic treatment for this disease [3,4].
Since ancient times plants are important source for the discovery of new drugs [5]. The first antimalarial compound to be discovered, which also served as the lead compound for synthetic antimalarials of the chloroquine/mefloquine type, was the alkaloid quinine. Thereafter other antimalarial agents prototypes have been extracted from medicinal plants [6]. One of these is the alkaloid cryptolepine (1, Figure 1), the major alkaloid of the African plant Cryptolepis sanguinolenta, which showed potent in vitro antiplasmodial activity and no cross-resistance with chloroquine [7,8]. Unfortunately, cryptolepine is also a
DNA intercalating agent and an inhibitor of topoisomerase II, resulting in a high level of cytotoxicity [7,8]. The attention has been focused on the minor alkaloid neocryptolepine (2, Figure 1), from the same plant, which showed in vitro antiplasmodial activity against chloroquine-resistant strains of P. falciparum. [8]. However, a direct comparison of the cytotoxicity of cryptolepine and neocryptolepine demonstrated that the latter was much less cytotoxic [9].
Great efforts in synthesis and biological evaluation of neocryptolepine derivates have been performed to optimize the prototype in search for new potent antimalarial molecules with low side effects [10-13]. In this context, molecular modeling studies become important because they can complement experimental studies and serve as a guide in the process of optimization of prototypes [14,15]. Quantitative structure
1 2
Figure 1 Structures of cryptolepine, 1, and neocryptolepine, 2.
Central
Montalvo-Acosta et al. (2015)Email:
J Drug Des Res 2(3): 1017 (2015) 2/11
activity relationships (QSAR) are the most important applications of chemometrics giving useful information for the design of new therapeutic compounds [16]. QSAR methods are widely useful in optimization process of a lead and have been applied in the design and development of new antimalarial compounds [17-19]. A QSAR model describes a mathematical relationship between structural properties or descriptors and a biological activity for a set of similar chemicals, but it can also be applied to predict activity values of non-synthesized compounds, structurally related to the molecules used to build the model (Dudek et al. 2006; Todeschini et al. 2009)[20.21]. The descriptors are recognizable molecular features, such as atom and molecular counts, molecular weight, sum of atomic properties (0D-QSAR); fragment counts (1D-QSAR); topological descriptors (2D-QSAR); geometrical, atomic coordinates, or energy grid descriptors (3D-QSAR); and the combination of atomic coordinates and sampling of conformations (RI-4D-QSAR) (Andrade et al. 2010)[22]. In the present study, we have developed 2D-QSAR models for antimalarial neocryptolepine analogues, in order to get useful information for designing new neocryptolepine derivatives with improved antimalarial activities.
MATERIALS AND METHODS
The data set
A group of 51 neocryptolepine derivatives synthesized by T. Inokuchi et al. (Lu et al. 2013; Mei et al. 2013)[23,12,13] with antimalarial activity against the P. falciparum NF54 strain, were taken to perform this study. A list of the compounds studied along with their molecular structure and biological data are shown in Table 1. For the development of QSAR models, this data set of compounds was divided into a training set (41 compounds) to generate the models and a test set (10 compounds) to evaluate the predictive ability of the resulting models. The diversity based classification method was used to perform rational selection of training and test set based on diversity in the molecules computed through Euclidean distance algorithm using java-based QSAR tools provided from web site of Dr. Kunal Roy (Roy 2013)[24]. The in vitro antimalarial activities expressed as the Inhibitory Concentration [IC50 (nM)] values were converted to the logarithmic scale pIC50 [pIC50= Log 1/ IC50 (M)] and used as dependent variables in the QSAR analyses.
2D-QSAR model
The geometry of the compounds were built with Marvin 5.12 software [25], and then optimized by the PM6 semi-empirical method in Mopac 2009 [26]. Next, a set of 185 2D descriptors based on atoms and connection information on molecules were calculated for the built structures of neocryptolepine analogues using QuaSAR module of the software MOE (Molecular Operating Environment - MOE 2009)[27]. The descriptor pool (185) was reduced by eliminating out the descriptors with constant and near constant values (variance < 0.0001) using QSAR tools provided from reference [24]. Also those inter-correlated descriptors (|r|>0.9) were removed in order to minimize redundant information. If multiple descriptors were inter-correlated, the descriptor with a higher correlation with pIC50 was kept. After pretreatment of the descriptors matrix, a remaining of 62 descriptors were subjected to stepwise multiple
linear regression (stepwise-MLR) to find the most relevant and important variables and construct QSAR equations on these variables only. The optimal 2D-QSAR models using the best descriptors obtained from stepwise regression and pIC50 was built in Build QSAR 2.1 software [28].
Validation of QSAR models
Model validation is a critical step in a QSAR study because a high value of the square of the correlation coefficient (r2) obtained from a correlation analysis (e.g., MLR regressions) indicates the best fit of the data but does not contain information about the ability to predict the dependent variable of no-include data in the training set. Thus, for all QSAR models generated, the “leave-one-out” (LOO) cross-validation scheme was used in order to evaluate the predictive ability. From the LOO cross-validation procedure, the square of cross-validation coefficient (q2) is obtained, which is used as a criterion to evaluate both the robustness and the predictive ability of the models generated. In addition, the “leave-two-out” (LTO) and “leave-five-out” (LFO) cross-validation procedures were performed as a more accurate test to show the stability and statistical significance of the models. The metrics q2
LTO and q2LFO were obtained from the LTO and LFO
cross-validation schemes, respectively.
According to Tropsha, the predictive ability of a QSAR model can be estimated reliably using an external validation. Therefore, the predictive ability of the models was evaluated by predicting the dependent variable vector of an external test set of 10 compounds that was not used for building the model. Furthermore, Tropsha also indicated that a QSAR model is considered predictive, if the following conditions are satisfied [29,30]:
q2 >0.5 (1)
R2 >0.6 (2)
(R2 – R20) / R2 < 0.1 or (R2 – R’2
0) / R2 < 0.1 (3)
0.85<k<1.15 or 0.85<k’<1.15 (4)
Mathematical definitions of R2, R20, R’2
0, k and k’ are based on regression for the test set of the observed activities against predicted activities and vice versa (regression of the predicted activities against observed activities). The definitions are presented clearly in reference (Tropsha et al. 2003)[30] and are not repeated here for shortness.
Another metric proposed by Roy and Roy (Roy and Roy 2008)[31] for evaluating predictive ability in QSAR models is R2
m, which takes the next form:
R2m = R2*(1 – |sqrt (R2 – R2
0)|) (5)
If R2m value for a given model is >0.5, it indicates a good
external predictability of the developed model.
Y-randomization test
In order to demonstrate that the observed correlation of the generated QSAR model is not a “chance-correlation” due to choice of training set compounds, the Y-randomization test was applied. The dependent variable vector (pIC50) is randomly shuffled and a new QSAR model is developed using the original independent

Central
Montalvo-Acosta et al. (2015)Email:
J Drug Des Res 2(3): 1017 (2015) 3/11
Table 1: Structures and antimalarial activities values of Neocryptolepine derivatives.
Compounds R1 R2 R3 IC50 NF54 (nM)
1 H H H 1580.0
2 H Cl H 2055.0
3 H H 78.8
4 Br H 10.4
5 Cl H 11.8
6 F H 49.6
7 CF3 H 10.7
8 OMe H 74.8
9 H
Ar = 4-ClC6H4
H 63.9
10 H
Ar = 4-(CH3)2NC6H4
H 54.9
11 H
Ar = 4-ClC6H4
H 52.4
12 H
Ar = 4-(CH3)2NC6H4
H 38.1
13 H
Ar = 4-FC6H4
H 26.6
14 H H 14.2
15 H H 258.1
16 H H 9.1
17 H H 104.1
18 H H 21.3
19 H H 25.8
20 Br H 4.0
21 Cl H 2.2
22 F H 24.9
23 CF3 H 4.1
24 OMe H 4.4
25 NO2 H 2.1
26 H CO2Me 24.8
27 H CO2Me 55.8
28 H CO2Me 42.5
29 H CO2Me 33.3
30 H CO2Me 278.0
31 H CO2Me 750.0
32 H CO2Me 1770.0
33 CO2Me H 8.3
34 CO2Me CO2Me 9.5
35 Cl CO2Me 7.6
36 Br CO2Me 2.3
37 CO2Me Br 4.5
38 Cl Br 2.2

Central
Montalvo-Acosta et al. (2015)Email:
J Drug Des Res 2(3): 1017 (2015) 4/11
39 H CO2H 1690.0
40 H CO2H 2550.0
41 H CO2H 2160.0
42 CO2Me H 4.2
43 CO2Me H 1.8
44 H CO2Me 14.5
45 H CO2Me 6.0
46 CO2Me CO2Me 16.7
47 CO2Me CO2Me 14.4
48 Cl CO2Me 13.6
49 Br CO2Me 8.1
50 CO2Me Br 7.2
51 Cl Br 5.6
variable matrix. The new QSAR models (after several repetitions) are expected to have low r2 and q2 values. If the opposite happens, an acceptable QSAR model cannot be obtained for the specific modeling method and data. A novel parameter, R2
p, also decide acceptability of a predictive QSAR model[32]. This parameter is obtained from the Y-randomization test of the models.
R2p = r2*[sqrt (r2 – R2
r)] (6)
Where, R2r is the average correlation coefficient of
randomized models. A value greater than 0.5 of R2p may be taken
as an indicator of good external predictability.
Defining model applicability domain
The domain of application of a QSAR model must be defined if the model is to be used for screening new compounds. Predictions for only those compounds that fall into this domain may be considered reliable [29,30]. Extent of extrapolation is one simple approach to define the applicability of the domain [30]. It
is based on the calculation of the leverage hi for each chemical, where the QSAR model is used to predict its activity:
hi = xiT(XTX)–1xi (7)
Where, xi is the descriptor-row vector of the query molecule and X is the n x k matrix containing the k descriptor values for each one of the n training molecules. A leverage value greater than 3k/n (leverage warning limit, h*) is considered large and implies that the predicted response is the result of a substantial extrapolation of the model and may not be reliable.
RESULTS AND DISCUSSION
2D-QSAR models
In order to select the predominant descriptors that will affect the inhibitory activities of these compounds, stepwise multiple linear regression analysis was performed taking the 2D descriptors calculated as independent variables and pIC50 as dependent variable. Thus, a set of 2D-QSAR equations were obtained, which is discussed below (the input descriptors were normalized by centered on mean and scaled by variance):
Model 1
pIC50 = 0,476vsa_don + 0,362 Weight – 0,254PEOE_VSA-6 + 7,624 (8)
n = 41; r2 = 0,705; R2 = 0,881; s = 0,473; F = 29.516; p < 0,
0001; q2 = 0,604; SPRESS = 0,549
Where n is the number of compounds in the training set used to construct 2D-QSAR equation, r2 and R2 are the squares of the correlation coefficient of regression for the training and test sets, respectively; s is the regression standard deviation, F is the Fischer ratio value, p is the statistical confidence level, q2 is the square of LOO cross-validated coefficient and SPRESS is the standard deviation of sum of square of difference between predicted and observed values. The predicted activity values and standardized residuals from Eq. 8 are listed in Table 2.
From Table 2, it can be seen that 39 presents a standardized residual higher than 2, suggesting that 39 is an outlier based on the commonly accepted hypothesis that values of standardized residual above two are characteristic of an outlier. Thus, compound 39 was not considered during the course of exploratory data analysis. Correspondingly, an satisfying QSAR model for the remaining 40 compounds was obtained:
Model 2
pIC50 = 0,536vsa_don + 0,318 weight – 0,162PEOE_VSA-6 + 7,667 (9)
n = 40; r2 = 0,762; R2 = 0,874; s = 0,403; F = 38.342; p < 0,
0001; q2 = 0,705; SPRESS = 0,449
Generally, a good QSAR model has the feature of large F, small s, and SPRESS, very small p-value, and r2 and q2 values that are close to one. Both Eqs. 8 and 9 meet these criteria and thus both are statistically acceptable, however, Eq. 9 has much higher correlation coefficient r2 (0.762) and LOO cross-validated coefficient q2 (0.705) that is close to r2. Therefore, Eq. 9 is statistically better, and thus all the discussions that follows

Central
Montalvo-Acosta et al. (2015)Email:
J Drug Des Res 2(3): 1017 (2015) 5/11
Table 2: Predicted pIC50 values with standardized residual and leverage (h) values from Model 1 and 2.
Compounds pIC50 Exp.Model 1 Model 2
pIC50 Calc. St. Res. pIC50 Calc. St. Res. h
1 5.801 5.834 -0.069 5.807 -0.015 0.033
2* 5.687 6.008 -0.044 5.962 0.352 0.044
3* 7.103 7.737 -0.866 7.864 -0.916 0.108
4* 7.983 8.123 0.432 8.203 0.495 0.090
5 7.928 7.897 0.065 8.002 -0.182 0.099
6* 7.305 7.825 -0.566 7.941 -0.591 0.103
7 7.971 8.061 -0.190 8.145 -0.431 0.092
8* 7.126 7.627 -0.516 7.829 -0.766 0.090
9 7.194 7.518 -0.684 7.376 -0.451 0.091
10 7.26 7.560 -0.633 7.413 -0.379 0.095
11 7.281 7.586 -0.645 7.436 -0.384 0.098
12 7.419 7.506 -0.183 7.366 0.132 0.090
13 7.575 7.820 -0.518 7.641 -0.164 0.122
14 7.848 8.017 -0.357 7.947 -0.244 0.048
15* 6.588 7.465 -1.506 7.431 -1.129 0.032
16 8.041 7.965 0.161 7.955 0.212 0.043
17 6.983 7.761 -1.643 7.783 -1.983 0.038
18 7.672 7.858 -0.393 7.869 -0.487 0.038
19 7.588 8.063 -1.004 8.048 -1.141 0.041
20 8.398 8.243 0.328 8.206 0.476 0.045
21 8.658 8.026 1.335 8.016 1.591 0.040
22 7.604 7.946 -0.722 7.946 -0.846 0.039
23 8.387 8.190 0.417 8.159 0.564 0.044
24 8.357 7.747 1.288 7.833 1.297 0.029
25 8.678 8.078 1.269 8.061 1.529 0.041
26* 7.606 7.764 0.385 7.950 0.172 0.082
27 7.253 7.824 -1.206 7.999 -1.847 0.078
28 7.372 6.658 1.509 6.684 1.703 0.038
29 7.478 6.726 1.588 6.744 1.817 0.041
30 6.556 5.792 1.615 6.117 1.088 0.326
31 6.125 6.412 -0.605 6.375 -0.619 0.097
32 5.752 6.017 -0.561 6.091 -0.840 0.130
33 8.082 7.755 0.691 7.939 0.355 0.082
34 8.021 7.781 0.507 8.023 -0.005 0.099
35 8.121 7.923 0.418 8.086 0.087 0.073
36 8.644 8.140 1.065 8.276 0.913 0.064
37* 8.343 8.150 1.307 8.289 1.210 0.064
38* 8.666 8.292 1.784 8.351 1.890 0.085
39** 5.772 7.146 -2.904 * * 0.217
40 5.593 6.049 -0.963 6.280 -1.703 0.182

Central
Montalvo-Acosta et al. (2015)Email:
J Drug Des Res 2(3): 1017 (2015) 6/11
41* 5.666 6.126 -0.410 6.351 -0.718 0.183
42 8.381 7.884 1.050 7.953 1.061 0.030
43 8.742 7.990 1.588 8.039 1.741 0.030
44 7.839 7.884 -0.095 7.953 -0.282 0.030
45 8.22 7.990 0.485 8.039 0.447 0.030
46 7.777 7.910 -0.281 8.037 -0.645 0.066
47 7.842 8.016 -0.368 8.124 -0.698 0.061
48 7.866 8.052 -0.393 8.100 -0.580 0.032
49 8.094 8.269 -0.369 8.290 -0.485 0.037
50 8.146 8.269 -0.259 8.290 -0.357 0.037
51 8.253 8.411 -0.333 8.353 -0.247 0.051
*Compounds in the test set**Outliers
will be based on this equation. The deviations of regression and prediction of Model 2 are also listed in Table 2. The plot of the predicted pIC50 values based on Eq. 9 versus experimental ones is shown in Figure 2.
The most influential descriptor in Model 2 is vsa_don (coefficient of 0.536), which represents the approximation to the sum of van der Waals surface areas of pure hydrogen bond donors (not counting the basic atoms and atoms that are both hydrogen bond donors and acceptors, such as -OH). This pharmacophore feature descriptor presents positive correlation with pIC50 in the standardized Eq. 8, which shows that the molecules with higher value of vsa_don have higher value of pIC50.
The molecular weight is the second most important descriptor in Model 2 (coefficient of 0.318). This simple descriptor also has positive sign in the Model 2. Thus, neocryptolepine (1) and monosubstituted analogues (2 and 3) with low molecular weight have low antimalarial activities in comparision with di or trisubstituted neocrytolepine analogues (25, 36 and 38) and with high molecular weight, which show greater values of pIC50. This descriptor confirms the need for introducing substituents
on neocryptolepine nucleus to improve the antimalarial activity, however, does not discriminate about the chemical nature nor in which positions should be placed the substituents.
The third term in Model 2 is PEOE_VSA-6 that is defined to be the sum of the van der Waals surface areas (VSA) computed using atomic partial charges less than -0.3. Atomic partial charges were computed using The Partial Equalization of Orbital Electronegativities (PEOE) method. It has participated in Model 2 with a negative regression coefficient suggesting in favor of decreased positively charged and increased negatively charged surface areas for better antimalarial activity.
Model 3
pIC50 = –0,752PEOE_VSA-6 + 0,577TPSA + 0,244a_ICM + 7,560 (10)
n = 39; r2 = 0,792; R2 = 0,705; s = 0,397; F = 44.364; p < 0,
0001; q2 = 0,746; SPRESS = 0,438
Model 3 is developed for 39 compounds after eliminating 2 molecules as outliers (compounds 24 and 30), the reason being the same as explained under Model 2. Model 3 explained 79.2% of the variance in antimalarial activity. As in Model 2, Model 3 presented three descriptors correlated with pIC50, in addition to predictive robustness and good statistic consistency as evident from the higher q2 and R2. The calculated pIC50 values from Model 3 are shown in Table 3. Experimental versus predicted values for pIC50 values for training and test set, obtained by Model 3, are shown graphically in Figure 3.
PEOE_VSA-6 was the most influential descriptor in Model 3 (coefficient of 0.792) and presented negative contribution to the model. PEOE_VSA-6 was also found in Model 2 and preserved the same sign. However, this descriptor exhibited different contributions to both models, thus PEOE_VSA-6 was the least influential descriptor in Model 2.
The remaining descriptors in Model 3 were TPSA and a_ICM. They represent the topological polar surface area and the atom information content (mean), respectively. Both descriptors appeared in Model 3 with positive correlation. Therefore, high
Figure 2 Plot of predicted activities vs. experimental ones based on Model 2.

Central
Montalvo-Acosta et al. (2015)Email:
J Drug Des Res 2(3): 1017 (2015) 7/11
Table 3: Predicted pIC50 values with standardized residual and leverage (h) values from Model 3 and 4.
Compounds pIC50 Exp.Model 3 Model 4
pIC50 Calc. St. Res. h pIC50 Calc. St. Res. h1 5.801 5.922 -0.305 0.097 6.238 -1.126 0.114
2* 5.687 6.431 -1.343 0.133 6.670 -1.748 0.1433* 7.103 7.093 -0.001 0.026 7.288 -0.044 0.0294* 7.983 7.540 0.772 0.033 8.147 0.001 0.0475 7.928 7.542 0.974 0.033 7.664 0.682 0.034
6* 7.305 7.499 -0.364 0.034 7.519 -0.107 0.0337 7.971 7.889 0.206 0.045 7.895 0.195 0.043
8* 7.126 6.869 0.440 0.021 6.875 0.887 0.0219 7.194 7.684 -1.237 0.056 7.548 -0.914 0.048
10 7.26 7.448 -0.475 0.039 7.358 -0.252 0.03511 7.281 7.626 -0.871 0.054 7.504 -0.576 0.04612 7.419 7.626 -0.523 0.054 7.439 -0.051 0.04413 7.575 7.533 0.106 0.050 7.487 0.226 0.04614 7.848 8.160 -0.787 0.037 8.095 -0.636 0.037
15* 6.588 7.692 -1.985 0.037 7.585 -1.779 0.03216 8.041 8.087 -0.115 0.053 8.211 -0.439 0.05217 6.983 7.598 -1.551 0.028 7.577 -1.531 0.02818 7.672 7.646 0.067 0.028 7.663 0.023 0.02819 7.588 7.518 0.176 0.028 7.568 0.051 0.02820 8.398 7.973 1.072 0.031 8.267 0.339 0.03421 8.658 8.013 1.625 0.031 7.953 1.819 0.03022 7.604 7.973 -0.930 0.031 7.833 -0.591 0.02923 8.387 8.298 0.224 0.036 8.115 0.702 0.032
24** 8.357 7.366 2.129 0.021 7.335 2.224 0.02125 8.678 9.213 -1.348 0.133 9.168 -1.264 0.135
26* 7.606 7.485 0.197 0.022 7.456 0.670 0.02327 7.253 7.425 -0.433 0.023 7.408 -0.399 0.02328 7.372 6.872 1.261 0.031 6.765 1.565 0.02729 7.478 6.812 1.678 0.029 6.725 1.941 0.026
30** 6.556 5.623 2.004 0.293 5.635 2.005 0.29431 6.125 6.592 -1.176 0.045 6.532 -1.050 0.04132 5.752 6.134 -0.962 0.095 6.088 -0.867 0.09133 8.082 7.488 1.497 0.022 7.453 1.622 0.02334 8.021 7.577 1.121 0.070 7.576 1.148 0.07035 8.121 7.894 0.572 0.023 7.786 0.865 0.02336 8.644 7.894 1.891 0.023 8.207 1.126 0.025
37* 8.343 7.891 0.787 0.023 8.211 0.633 0.02538* 8.666 7.940 1.275 0.044 8.433 0.848 0.05639 5.772 6.218 -1.124 0.130 6.269 -1.283 0.12940 5.593 5.597 -0.011 0.161 5.574 0.050 0.160
41* 5.666 5.531 0.222 0.159 5.531 0.638 0.15942 8.381 7.803 1.457 0.038 7.772 1.572 0.03943 8.742 8.379 0.916 0.074 8.310 1.114 0.07644 7.839 7.803 0.091 0.038 7.772 0.174 0.03945 8.22 8.379 -0.400 0.074 8.310 -0.233 0.07646 7.777 7.834 -0.144 0.108 7.855 -0.202 0.10647 7.842 8.436 -1.498 0.158 8.386 -1.404 0.15848 7.866 8.145 -0.704 0.036 8.036 -0.438 0.03849 8.094 8.145 -0.129 0.036 8.361 -0.688 0.03450 8.146 8.145 0.002 0.036 8.361 -0.554 0.03451 8.253 8.337 -0.212 0.035 8.530 -0.715 0.037
*Compounds in the test set**Outliers

Central
Montalvo-Acosta et al. (2015)Email:
J Drug Des Res 2(3): 1017 (2015) 8/11
TPSA and a_ICM values are favorable for high antimalarial activity. TPSA together with vsa_don and PEOE_VSA-6 demonstrate the importance of including polar regions to the neocryptolepine nucleus to increase the antimalarial activity.
Model 4
pIC50 = –0,727PEOE_VSA-6 + 0,641TPSA + 0,231density + 7,559 (11)
n = 39; r2 = 0,801; R2 = 0,789; s = 0,388; F = 46.967; p < 0,
0001; q2 = 0,751; SPRESS = 0,434
Model 4 is again a three-descriptors model built for 39 compounds, while compounds 24 and 30 were eliminated as outliers. This model explained 80.1% of the variance in antimalarial activity. Model 4 presents the highest values of r2, q2 and R2 of all QSAR models generated in this study. It is statistically significant with an F value exceeding 99.9% confidence level. The low values of s and SPRESS also reflect the statistical significance of the Model 4. Experimental and predicted activities from Model 4 are show in Table 3. Figure 4 presents the plot of experimental versus predicted values calculated by Model 4.
As in Model 3, the descriptors PEOE_VSA-6 and TPSA were the first and second most important descriptors in Model 4, respectively. These descriptors kept the same sign as in Model 3 (negative and positive correlations, respectively). However, in contrast to Model 3, the density was the third most influent descriptor in Model 4.
The density is obtained as the ratio of molecular weight and the van der Waals volume. Density appears in the standardized Eq. 11 with a positive sign which shows that the molecules with higher value of density have greater value of pIC50. The colinearity among the descriptors used for building of the QSAR models was checked by calculation of a inter-correlation matrix (see Table 4). The inter-correlation coefficients obtained indicate non-dependency of the descriptors on each other.
Models validation
Validation is a crucial aspect of any QSAR model. The accuracy of proposed MLR models was illustrated using the evaluation techniques such as LOO, LTO and LFO cross-validation procedures and validation through an external test set. A summary of the results of the internal and external validation for all models are presented in Table 5. The high values of the q2, q2
LTO and especially q2
LFO (higher than 0.5) demonstrate statistical quality for the obtained models. In addition, the final QSAR models passed all tests proposed in Eqs. 1-5, therefore, predictions of the pIC50 values for new compounds made with these models are reliable.
The set of QSAR models was further validated by applying the Y-randomization test. Several random shuffles of the Y vector were performed and the results are shown in Table 6. The low r2 and q2 values indicate that the good results in Models 2-4 are not due to a chance correlation or structural dependency of the training set. The R2
p values, greater than 0.5 (see Table 5), ensure that the predictions by Models 2-4 are reliable.
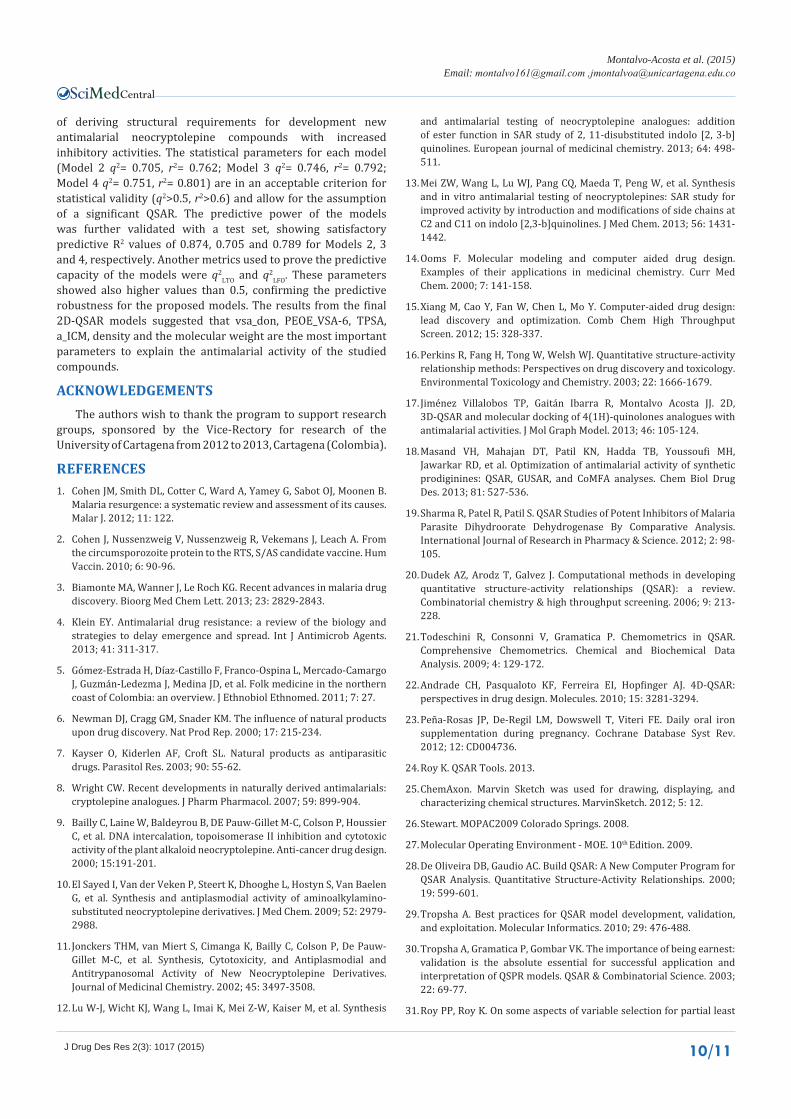
Defining Model Applicability Domain
If a QSAR model is used to predict the biological activity of new compounds not yet synthesized, it is necessary to define a domain of application of the regression model. A QSAR model can be statistically validated but it cannot be used to predict the dependent variable for the entire universe of compounds. Reliable predictions will be obtained only for those compounds that fall within of the domain of application. In this study, the William plot (Figure 5) was used for assigning applicability domain. In the William plot, standardized residuals versus leverage values (h values in Table 2 and 3) are plotted. This plot could be used for an immediate and simple graphical detection of both the response outliers and compounds outside the domain of application. In the present case the initial training descriptor matrix for all QSAR models was of order 41x3 and thus the warning leverage value (h* = 3k/n) was 0.220.
In Model 2, compound 39 was defined as outlier as described above. The results for this model indicate that out of the total set of molecules in study only the compound 30 have a value greater than the warning leverage value (Figure 3a). This compound with h > h* hardly affect the goodness of fit of the developed model but it may not be an outlier because this compound has a low standardized residual. It must be noted that compounds with
Figure 3 Plot of predicted activities vs. experimental ones based on Model 3.
Figure 4 Plot of predicted activities vs. experimental ones based on Model 4.
Central
Montalvo-Acosta et al. (2015)Email:
J Drug Des Res 2(3): 1017 (2015) 9/11
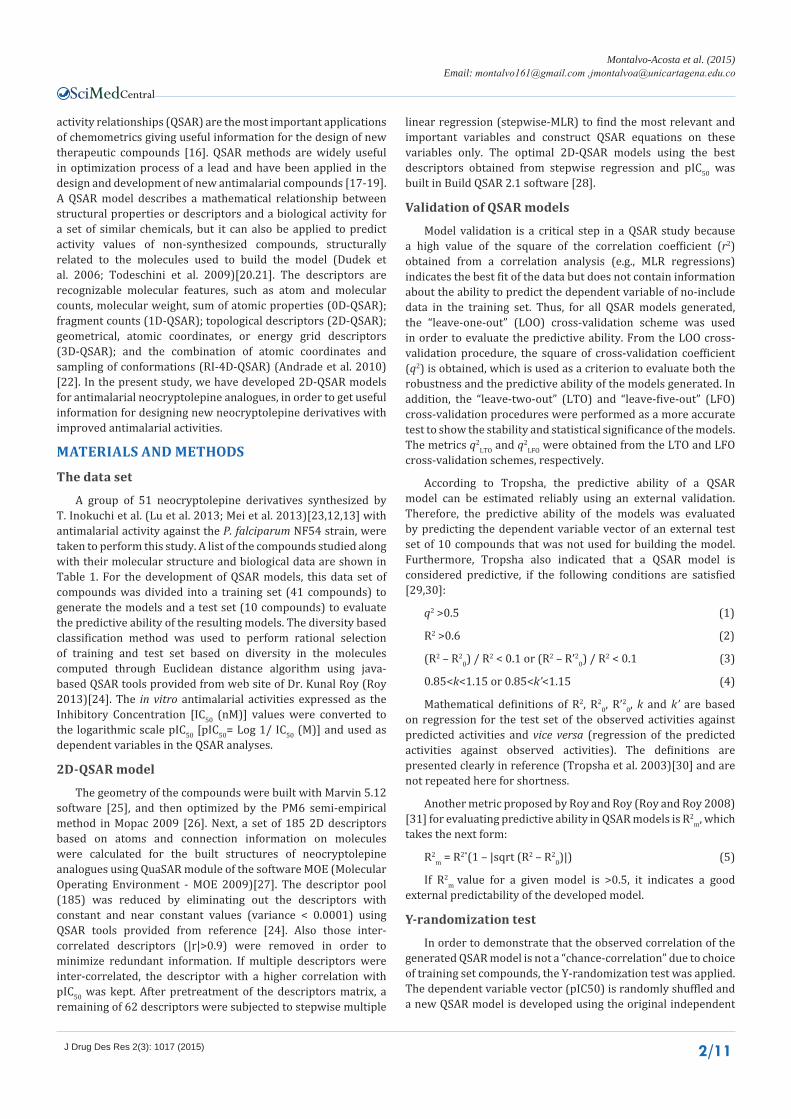
Table 4: Correlation matrix for the descriptors used in Models 2-4.
TPSA PEOE_VSA-6 a_ICM density vsa_don weight
TPSA 1.000
PEOE_VSA-6 0.412 1.000
a_ICM 0.530 0.159 1.000
density 0.238 0.049 0.602 1.000
vsa_don 0.593 0.026 0.348 0.320 1.000
weight 0.419 0.210 0.630 0.506 0.083 1.000
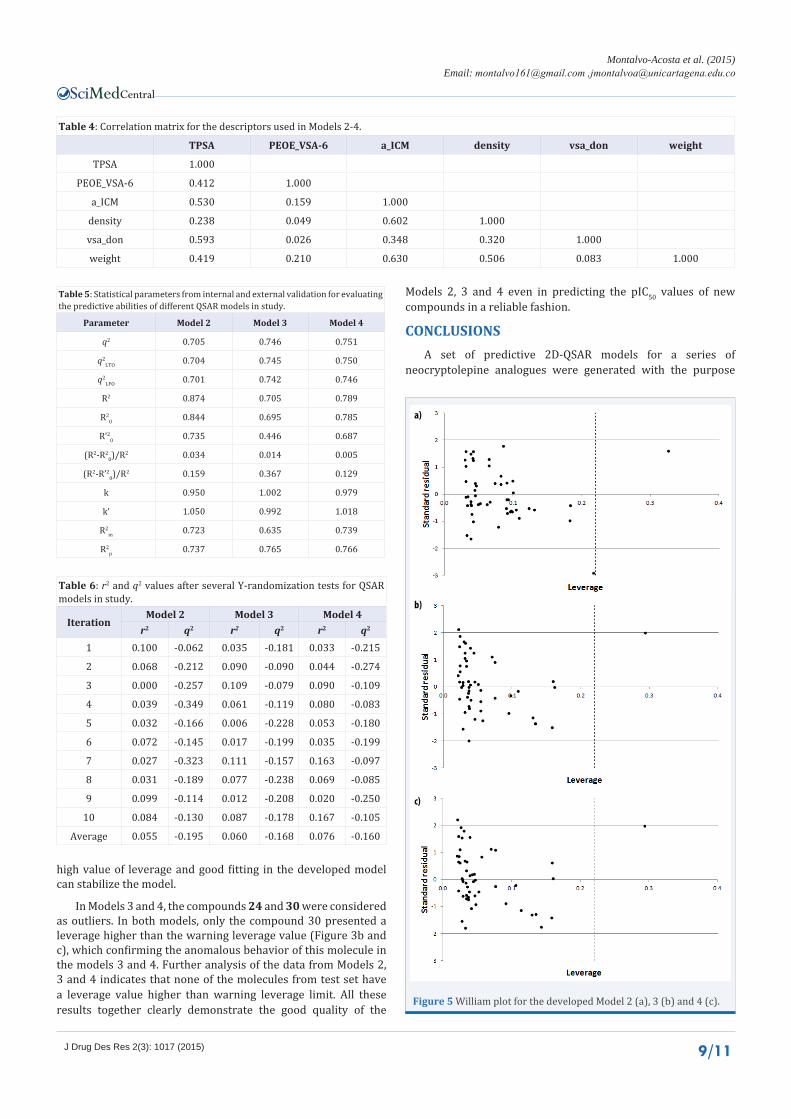
Table 5: Statistical parameters from internal and external validation for evaluating the predictive abilities of different QSAR models in study.
Parameter Model 2 Model 3 Model 4
q2 0.705 0.746 0.751
q2LTO 0.704 0.745 0.750
q2LFO 0.701 0.742 0.746
R2 0.874 0.705 0.789
R20 0.844 0.695 0.785
R’20 0.735 0.446 0.687
(R2-R20)/R2 0.034 0.014 0.005
(R2-R’20)/R2 0.159 0.367 0.129
k 0.950 1.002 0.979
k’ 1.050 0.992 1.018
R2m 0.723 0.635 0.739
R2p 0.737 0.765 0.766
Table 6: r2 and q2 values after several Y-randomization tests for QSAR models in study.
IterationModel 2 Model 3 Model 4
r2 q2 r2 q2 r2 q2
1 0.100 -0.062 0.035 -0.181 0.033 -0.215
2 0.068 -0.212 0.090 -0.090 0.044 -0.274
3 0.000 -0.257 0.109 -0.079 0.090 -0.109
4 0.039 -0.349 0.061 -0.119 0.080 -0.083
5 0.032 -0.166 0.006 -0.228 0.053 -0.180
6 0.072 -0.145 0.017 -0.199 0.035 -0.199
7 0.027 -0.323 0.111 -0.157 0.163 -0.097
8 0.031 -0.189 0.077 -0.238 0.069 -0.085
9 0.099 -0.114 0.012 -0.208 0.020 -0.250
10 0.084 -0.130 0.087 -0.178 0.167 -0.105
Average 0.055 -0.195 0.060 -0.168 0.076 -0.160
high value of leverage and good fitting in the developed model can stabilize the model.
In Models 3 and 4, the compounds 24 and 30 were considered as outliers. In both models, only the compound 30 presented a leverage higher than the warning leverage value (Figure 3b and c), which confirming the anomalous behavior of this molecule in the models 3 and 4. Further analysis of the data from Models 2, 3 and 4 indicates that none of the molecules from test set have a leverage value higher than warning leverage limit. All these results together clearly demonstrate the good quality of the
a)
b)
c)
Figure 5 William plot for the developed Model 2 (a), 3 (b) and 4 (c).
Models 2, 3 and 4 even in predicting the pIC50 values of new compounds in a reliable fashion.
CONCLUSIONS A set of predictive 2D-QSAR models for a series of
neocryptolepine analogues were generated with the purpose
Central
Montalvo-Acosta et al. (2015)Email:
J Drug Des Res 2(3): 1017 (2015) 10/11
of deriving structural requirements for development new antimalarial neocryptolepine compounds with increased inhibitory activities. The statistical parameters for each model (Model 2 q2= 0.705, r2= 0.762; Model 3 q2= 0.746, r2= 0.792; Model 4 q2= 0.751, r2= 0.801) are in an acceptable criterion for statistical validity (q2>0.5, r2>0.6) and allow for the assumption of a significant QSAR. The predictive power of the models was further validated with a test set, showing satisfactory predictive R2 values of 0.874, 0.705 and 0.789 for Models 2, 3 and 4, respectively. Another metrics used to prove the predictive capacity of the models were q2
LTO and q2LFO. These parameters
showed also higher values than 0.5, confirming the predictive robustness for the proposed models. The results from the final 2D-QSAR models suggested that vsa_don, PEOE_VSA-6, TPSA, a_ICM, density and the molecular weight are the most important parameters to explain the antimalarial activity of the studied compounds.
ACKNOWLEDGEMENTSThe authors wish to thank the program to support research
groups, sponsored by the Vice-Rectory for research of the University of Cartagena from 2012 to 2013, Cartagena (Colombia).
REFERENCES1. Cohen JM, Smith DL, Cotter C, Ward A, Yamey G, Sabot OJ, Moonen B.
Malaria resurgence: a systematic review and assessment of its causes. Malar J. 2012; 11: 122.
2. Cohen J, Nussenzweig V, Nussenzweig R, Vekemans J, Leach A. From the circumsporozoite protein to the RTS, S/AS candidate vaccine. Hum Vaccin. 2010; 6: 90-96.
3. Biamonte MA, Wanner J, Le Roch KG. Recent advances in malaria drug discovery. Bioorg Med Chem Lett. 2013; 23: 2829-2843.
4. Klein EY. Antimalarial drug resistance: a review of the biology and strategies to delay emergence and spread. Int J Antimicrob Agents. 2013; 41: 311-317.
5. Gómez-Estrada H, Díaz-Castillo F, Franco-Ospina L, Mercado-Camargo J, Guzmán-Ledezma J, Medina JD, et al. Folk medicine in the northern coast of Colombia: an overview. J Ethnobiol Ethnomed. 2011; 7: 27.
6. Newman DJ, Cragg GM, Snader KM. The influence of natural products upon drug discovery. Nat Prod Rep. 2000; 17: 215-234.
7. Kayser O, Kiderlen AF, Croft SL. Natural products as antiparasitic drugs. Parasitol Res. 2003; 90: 55-62.
8. Wright CW. Recent developments in naturally derived antimalarials: cryptolepine analogues. J Pharm Pharmacol. 2007; 59: 899-904.
9. Bailly C, Laine W, Baldeyrou B, DE Pauw-Gillet M-C, Colson P, Houssier C, et al. DNA intercalation, topoisomerase II inhibition and cytotoxic activity of the plant alkaloid neocryptolepine. Anti-cancer drug design. 2000; 15:191-201.
10. El Sayed I, Van der Veken P, Steert K, Dhooghe L, Hostyn S, Van Baelen G, et al. Synthesis and antiplasmodial activity of aminoalkylamino-substituted neocryptolepine derivatives. J Med Chem. 2009; 52: 2979-2988.
11. Jonckers THM, van Miert S, Cimanga K, Bailly C, Colson P, De Pauw-Gillet M-C, et al. Synthesis, Cytotoxicity, and Antiplasmodial and Antitrypanosomal Activity of New Neocryptolepine Derivatives. Journal of Medicinal Chemistry. 2002; 45: 3497-3508.
12. Lu W-J, Wicht KJ, Wang L, Imai K, Mei Z-W, Kaiser M, et al. Synthesis
and antimalarial testing of neocryptolepine analogues: addition of ester function in SAR study of 2, 11-disubstituted indolo [2, 3-b] quinolines. European journal of medicinal chemistry. 2013; 64: 498-511.
13. Mei ZW, Wang L, Lu WJ, Pang CQ, Maeda T, Peng W, et al. Synthesis and in vitro antimalarial testing of neocryptolepines: SAR study for improved activity by introduction and modifications of side chains at C2 and C11 on indolo [2,3-b]quinolines. J Med Chem. 2013; 56: 1431-1442.
14. Ooms F. Molecular modeling and computer aided drug design. Examples of their applications in medicinal chemistry. Curr Med Chem. 2000; 7: 141-158.
15. Xiang M, Cao Y, Fan W, Chen L, Mo Y. Computer-aided drug design: lead discovery and optimization. Comb Chem High Throughput Screen. 2012; 15: 328-337.
16. Perkins R, Fang H, Tong W, Welsh WJ. Quantitative structure-activity relationship methods: Perspectives on drug discovery and toxicology. Environmental Toxicology and Chemistry. 2003; 22: 1666-1679.
17. Jiménez Villalobos TP, Gaitán Ibarra R, Montalvo Acosta JJ. 2D, 3D-QSAR and molecular docking of 4(1H)-quinolones analogues with antimalarial activities. J Mol Graph Model. 2013; 46: 105-124.
18. Masand VH, Mahajan DT, Patil KN, Hadda TB, Youssoufi MH, Jawarkar RD, et al. Optimization of antimalarial activity of synthetic prodiginines: QSAR, GUSAR, and CoMFA analyses. Chem Biol Drug Des. 2013; 81: 527-536.
19. Sharma R, Patel R, Patil S. QSAR Studies of Potent Inhibitors of Malaria Parasite Dihydroorate Dehydrogenase By Comparative Analysis. International Journal of Research in Pharmacy & Science. 2012; 2: 98-105.
20. Dudek AZ, Arodz T, Galvez J. Computational methods in developing quantitative structure-activity relationships (QSAR): a review. Combinatorial chemistry & high throughput screening. 2006; 9: 213-228.
21. Todeschini R, Consonni V, Gramatica P. Chemometrics in QSAR. Comprehensive Chemometrics. Chemical and Biochemical Data Analysis. 2009; 4: 129-172.
22. Andrade CH, Pasqualoto KF, Ferreira EI, Hopfinger AJ. 4D-QSAR: perspectives in drug design. Molecules. 2010; 15: 3281-3294.
23. Peña-Rosas JP, De-Regil LM, Dowswell T, Viteri FE. Daily oral iron supplementation during pregnancy. Cochrane Database Syst Rev. 2012; 12: CD004736.
24. Roy K. QSAR Tools. 2013.
25. ChemAxon. Marvin Sketch was used for drawing, displaying, and characterizing chemical structures. MarvinSketch. 2012; 5: 12.
26. Stewart. MOPAC2009 Colorado Springs. 2008.
27. Molecular Operating Environment - MOE. 10th Edition. 2009.
28. De Oliveira DB, Gaudio AC. Build QSAR: A New Computer Program for QSAR Analysis. Quantitative Structure-Activity Relationships. 2000; 19: 599-601.
29. Tropsha A. Best practices for QSAR model development, validation, and exploitation. Molecular Informatics. 2010; 29: 476-488.
30. Tropsha A, Gramatica P, Gombar VK. The importance of being earnest: validation is the absolute essential for successful application and interpretation of QSPR models. QSAR & Combinatorial Science. 2003; 22: 69-77.
31. Roy PP, Roy K. On some aspects of variable selection for partial least
Central
Montalvo-Acosta et al. (2015)Email:
J Drug Des Res 2(3): 1017 (2015) 11/11
squares regression models. QSAR & Combinatorial Science. 2008; 27: 302-313.
32. Pratim Roy P, Paul S, Mitra I, Roy K. On two novel parameters for validation of predictive QSAR models. Molecules. 2009; 14: 1660-1701.
Montalvo-Acosta JJ, Ibarra RG (2015) 2D-QSAR Analysis of Neocryptolepine Analogues with Antimalarial Activities. J Drug Des Res 2(3): 1017.
Cite this article