2d ft-icr ms of calmodulin: a top-down and bottom … · 2d ft-icr ms of calmodulin: a top-down and...
TRANSCRIPT

B American Society for Mass Spectrometry, 2016DOI: 10.1007/s13361-016-1431-z
J. Am. Soc. Mass Spectrom. (2016) 27:1531Y1538
RESEARCH ARTICLE
2D FT-ICR MS of Calmodulin: A Top-Down and Bottom-UpApproach
Federico Floris,1 Maria van Agthoven,1 Lionel Chiron,2 Andrew J. Soulby,1
Christopher A. Wootton,1 Yuko P. Y. Lam,1 Mark P. Barrow,1 Marc-André Delsuc,2,3
Peter B. O’Connor1
1University of Warwick, Coventry, UK2CASC4DE, Illkirch-Graffenstaden, France3IGBMC, Illkirch-Graffenstaden, France
Abstract. Two-dimensional Fourier transform ion cyclotron resonance mass spec-trometry (2D FT-ICR MS) allows data-independent fragmentation of all ions in asample and correlation of fragment ions to their precursors through the modulationof precursor ion cyclotron radii prior to fragmentation. Previous results show thatimplementation of 2D FT-ICR MS with infrared multi-photon dissociation (IRMPD)and electron capture dissociation (ECD) has turned this method into a useful analyt-ical tool. In this work, IRMPD tandem mass spectrometry of calmodulin (CaM) hasbeen performed both in one-dimensional and two-dimensional FT-ICR MS using atop-down and bottom-up approach. 2D IRMPD FT-ICR MS is used to achieveextensive inter-residue bond cleavage and assignment for CaM, using its unique
features for fragment identification in a less time- and sample-consuming experiment than doing the same thingusing sequential MS/MS experiments.Keywords: Tandem mass spectrometry, FTICR mass spectrometry, 2-Dimensional mass spectrometry
Received: 2 March 2016/Revised: 2 June 2016/Accepted: 3 June 2016/Published Online: 18 July 2016
Introduction
F ourier transform ioncyclotron resonancemass spectrometry(FT-ICR MS) provides the highest resolving power and
mass measurement accuracy among all kinds of mass spectrom-etry (MS) [1]. In an FT-ICR MS experiment, the raw signal ismeasured as a function of time providing time-domain data, or“transient.”TheFourier transform(FT) is thenapplied, alongwitha series of operations/algorithms such as zero-filling, convolution[2], and apodization [3] to improve the quality of data [4],transforming the time-domain data into the frequency domain.A frequency spectrum is obtained and converted to a mass (m/z)spectrum through a calibration function [5]. In order to obtainmore structural information, analytes are often isolated andfragmented (tandem mass spectrometry, or MS/MS). TandemMS is influenced by the resolution that can be obtained during
isolation and by the various fragmentation techniques, whichproduce different and often complementary fragmentation [6].
Two-Dimensional (2D) FT-ICRMS allows data-independentfragmentation of all ions in a sample and correlation of precursorand fragment ionswithout prior isolation [7–10]. This correlationis obtained through the modulation of precursor ions’ cyclotronradii prior to fragmentation using a series of rf-pulses. Pfandleret al. developed the first pulse sequence used for 2D MS exper-iments [7, 8]. A different pulse sequence called stored-waveformionmodulation (SWIM)wasdevelopedandappliedbyRoss et al.[11] and byvan derRest andMarshall [12]. Figure 1 shows the rf-pulses used in a typical 2D FT-ICR MS experiment. The ionsenter the cell ideally at the center, and are then excited by anexcitation pulse, P1. The ions rotate inside the cell according totheir cyclotron frequency (ωc) for an encoding time (t1), to accu-mulate aphaseofωct1.Anencodingpulse (P2), equal toP1, is thenapplied, and the ions are either excited further or de-excited,depending on their instantaneous phase relative to P2. At the endof P2, the ions’ cyclotron radii are modulated according to t1 andωc [9]. P2 is followed by a fragmentation period (τm), inwhich theions are subjected to a radius-dependent fragmentation, and pro-duce fragment ions whose abundances depend on t1 and the
Electronic supplementary material The online version of this article (doi:10.1007/s13361-016-1431-z) contains supplementary material, which is availableto authorized users.
Correspondence to: Peter B. O’Connor; e-mail: [email protected]
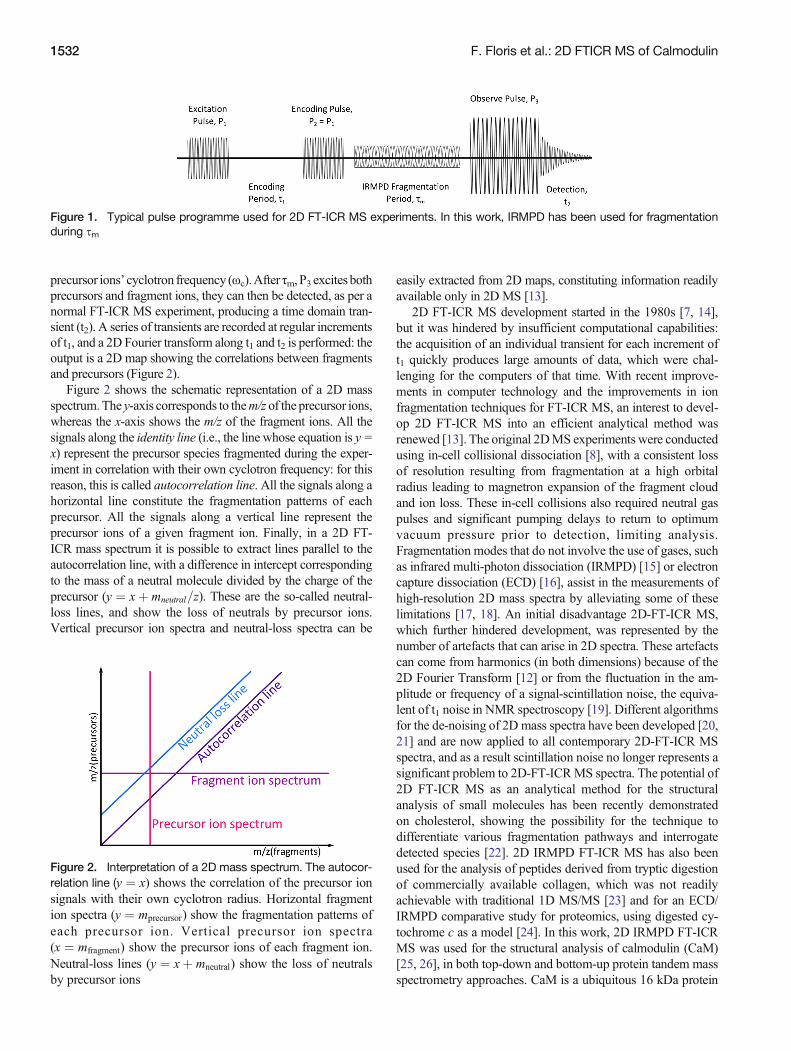
precursor ions’ cyclotron frequency (ωc).After τm,P3 excites bothprecursors and fragment ions, they can then be detected, as per anormal FT-ICR MS experiment, producing a time domain tran-sient (t2). A series of transients are recorded at regular incrementsof t1, and a 2D Fourier transform along t1 and t2 is performed: theoutput is a 2D map showing the correlations between fragmentsand precursors (Figure 2).
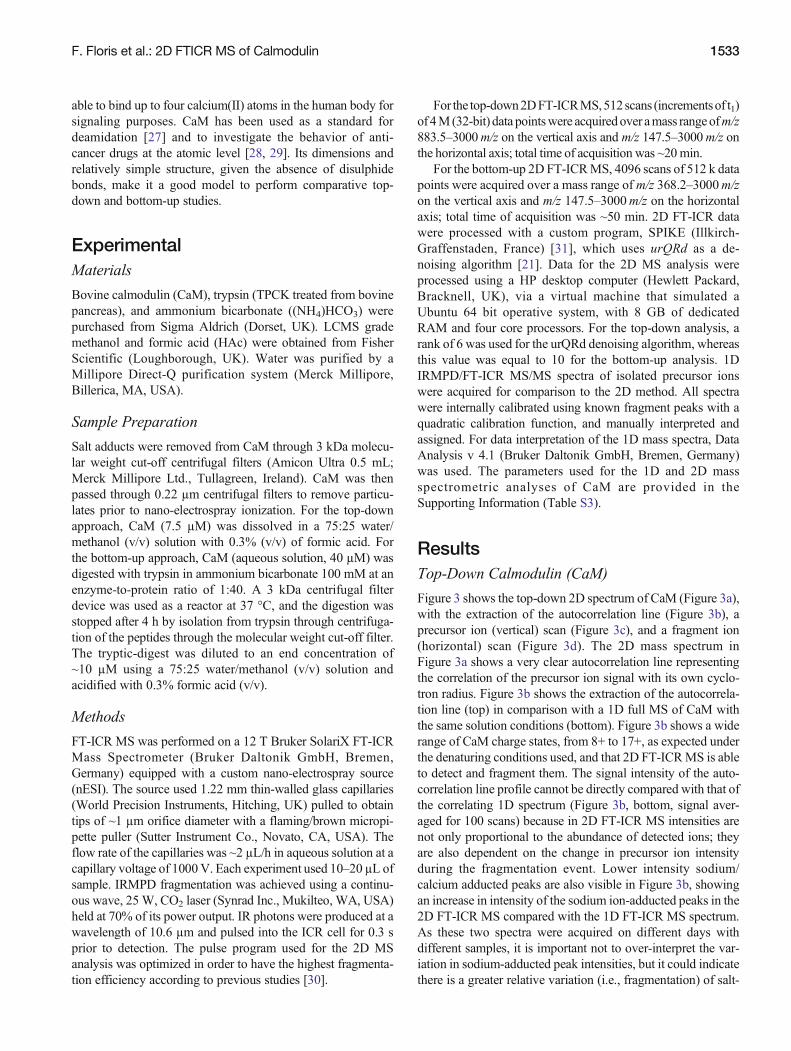
Figure 2 shows the schematic representation of a 2D massspectrum.The y-axis corresponds to them/z of the precursor ions,whereas the x-axis shows the m/z of the fragment ions. All thesignals along the identity line (i.e., the line whose equation is y =x) represent the precursor species fragmented during the exper-iment in correlation with their own cyclotron frequency: for thisreason, this is called autocorrelation line. All the signals along ahorizontal line constitute the fragmentation patterns of eachprecursor. All the signals along a vertical line represent theprecursor ions of a given fragment ion. Finally, in a 2D FT-ICR mass spectrum it is possible to extract lines parallel to theautocorrelation line, with a difference in intercept correspondingto the mass of a neutral molecule divided by the charge of theprecursor (y ¼ xþ mneutral=z). These are the so-called neutral-loss lines, and show the loss of neutrals by precursor ions.Vertical precursor ion spectra and neutral-loss spectra can be
easily extracted from 2D maps, constituting information readilyavailable only in 2D MS [13].
2D FT-ICR MS development started in the 1980s [7, 14],but it was hindered by insufficient computational capabilities:the acquisition of an individual transient for each increment oft1 quickly produces large amounts of data, which were chal-lenging for the computers of that time. With recent improve-ments in computer technology and the improvements in ionfragmentation techniques for FT-ICR MS, an interest to devel-op 2D FT-ICR MS into an efficient analytical method wasrenewed [13]. The original 2DMS experiments were conductedusing in-cell collisional dissociation [8], with a consistent lossof resolution resulting from fragmentation at a high orbitalradius leading to magnetron expansion of the fragment cloudand ion loss. These in-cell collisions also required neutral gaspulses and significant pumping delays to return to optimumvacuum pressure prior to detection, limiting analysis.Fragmentation modes that do not involve the use of gases, suchas infrared multi-photon dissociation (IRMPD) [15] or electroncapture dissociation (ECD) [16], assist in the measurements ofhigh-resolution 2D mass spectra by alleviating some of theselimitations [17, 18]. An initial disadvantage 2D-FT-ICR MS,which further hindered development, was represented by thenumber of artefacts that can arise in 2D spectra. These artefactscan come from harmonics (in both dimensions) because of the2D Fourier Transform [12] or from the fluctuation in the am-plitude or frequency of a signal-scintillation noise, the equiva-lent of t1 noise in NMR spectroscopy [19]. Different algorithmsfor the de-noising of 2D mass spectra have been developed [20,21] and are now applied to all contemporary 2D-FT-ICR MSspectra, and as a result scintillation noise no longer represents asignificant problem to 2D-FT-ICRMS spectra. The potential of2D FT-ICR MS as an analytical method for the structuralanalysis of small molecules has been recently demonstratedon cholesterol, showing the possibility for the technique todifferentiate various fragmentation pathways and interrogatedetected species [22]. 2D IRMPD FT-ICR MS has also beenused for the analysis of peptides derived from tryptic digestionof commercially available collagen, which was not readilyachievable with traditional 1D MS/MS [23] and for an ECD/IRMPD comparative study for proteomics, using digested cy-tochrome c as a model [24]. In this work, 2D IRMPD FT-ICRMS was used for the structural analysis of calmodulin (CaM)[25, 26], in both top-down and bottom-up protein tandem massspectrometry approaches. CaM is a ubiquitous 16 kDa protein
Figure 1. Typical pulse programme used for 2D FT-ICR MS experiments. In this work, IRMPD has been used for fragmentationduring Cm
Figure 2. Interpretation of a 2D mass spectrum. The autocor-relation line (y ¼ x) shows the correlation of the precursor ionsignals with their own cyclotron radius. Horizontal fragmention spectra (y ¼ mprecursor) show the fragmentation patterns ofeach precursor ion. Vertical precursor ion spectra(x ¼ mfragment) show the precursor ions of each fragment ion.Neutral-loss lines (y ¼ xþ mneutral) show the loss of neutralsby precursor ions
1532 F. Floris et al.: 2D FTICR MS of Calmodulin
able to bind up to four calcium(II) atoms in the human body forsignaling purposes. CaM has been used as a standard fordeamidation [27] and to investigate the behavior of anti-cancer drugs at the atomic level [28, 29]. Its dimensions andrelatively simple structure, given the absence of disulphidebonds, make it a good model to perform comparative top-down and bottom-up studies.
ExperimentalMaterials
Bovine calmodulin (CaM), trypsin (TPCK treated from bovinepancreas), and ammonium bicarbonate ((NH4)HCO3) werepurchased from Sigma Aldrich (Dorset, UK). LCMS grademethanol and formic acid (HAc) were obtained from FisherScientific (Loughborough, UK). Water was purified by aMillipore Direct-Q purification system (Merck Millipore,Billerica, MA, USA).
Sample Preparation
Salt adducts were removed from CaM through 3 kDa molecu-lar weight cut-off centrifugal filters (Amicon Ultra 0.5 mL;Merck Millipore Ltd., Tullagreen, Ireland). CaM was thenpassed through 0.22 μm centrifugal filters to remove particu-lates prior to nano-electrospray ionization. For the top-downapproach, CaM (7.5 μM) was dissolved in a 75:25 water/methanol (v/v) solution with 0.3% (v/v) of formic acid. Forthe bottom-up approach, CaM (aqueous solution, 40 μM) wasdigested with trypsin in ammonium bicarbonate 100 mM at anenzyme-to-protein ratio of 1:40. A 3 kDa centrifugal filterdevice was used as a reactor at 37 °C, and the digestion wasstopped after 4 h by isolation from trypsin through centrifuga-tion of the peptides through the molecular weight cut-off filter.The tryptic-digest was diluted to an end concentration of~10 μM using a 75:25 water/methanol (v/v) solution andacidified with 0.3% formic acid (v/v).
Methods
FT-ICR MS was performed on a 12 T Bruker SolariX FT-ICRMass Spectrometer (Bruker Daltonik GmbH, Bremen,Germany) equipped with a custom nano-electrospray source(nESI). The source used 1.22 mm thin-walled glass capillaries(World Precision Instruments, Hitching, UK) pulled to obtaintips of ~1 μm orifice diameter with a flaming/brown micropi-pette puller (Sutter Instrument Co., Novato, CA, USA). Theflow rate of the capillaries was ~2 μL/h in aqueous solution at acapillary voltage of 1000V. Each experiment used 10–20 μL ofsample. IRMPD fragmentation was achieved using a continu-ous wave, 25W, CO2 laser (Synrad Inc., Mukilteo, WA, USA)held at 70% of its power output. IR photons were produced at awavelength of 10.6 μm and pulsed into the ICR cell for 0.3 sprior to detection. The pulse program used for the 2D MSanalysis was optimized in order to have the highest fragmenta-tion efficiency according to previous studies [30].
For the top-down2DFT-ICRMS,512scans (incrementsof t1)of 4M(32-bit) data pointswere acquiredover amass rangeofm/z883.5–3000m/z on the vertical axis and m/z 147.5–3000m/z onthe horizontal axis; total time of acquisition was ~20min.
For the bottom-up 2D FT-ICRMS, 4096 scans of 512 k datapoints were acquired over a mass range of m/z 368.2–3000m/zon the vertical axis and m/z 147.5–3000m/z on the horizontalaxis; total time of acquisition was ~50 min. 2D FT-ICR datawere processed with a custom program, SPIKE (Illkirch-Graffenstaden, France) [31], which uses urQRd as a de-noising algorithm [21]. Data for the 2D MS analysis wereprocessed using a HP desktop computer (Hewlett Packard,Bracknell, UK), via a virtual machine that simulated aUbuntu 64 bit operative system, with 8 GB of dedicatedRAM and four core processors. For the top-down analysis, arank of 6 was used for the urQRd denoising algorithm, whereasthis value was equal to 10 for the bottom-up analysis. 1DIRMPD/FT-ICR MS/MS spectra of isolated precursor ionswere acquired for comparison to the 2D method. All spectrawere internally calibrated using known fragment peaks with aquadratic calibration function, and manually interpreted andassigned. For data interpretation of the 1D mass spectra, DataAnalysis v 4.1 (Bruker Daltonik GmbH, Bremen, Germany)was used. The parameters used for the 1D and 2D massspectrometric analyses of CaM are provided in theSupporting Information (Table S3).
ResultsTop-Down Calmodulin (CaM)
Figure 3 shows the top-down 2D spectrum of CaM (Figure 3a),with the extraction of the autocorrelation line (Figure 3b), aprecursor ion (vertical) scan (Figure 3c), and a fragment ion(horizontal) scan (Figure 3d). The 2D mass spectrum inFigure 3a shows a very clear autocorrelation line representingthe correlation of the precursor ion signal with its own cyclo-tron radius. Figure 3b shows the extraction of the autocorrela-tion line (top) in comparison with a 1D full MS of CaM withthe same solution conditions (bottom). Figure 3b shows a widerange of CaM charge states, from 8+ to 17+, as expected underthe denaturing conditions used, and that 2D FT-ICRMS is ableto detect and fragment them. The signal intensity of the auto-correlation line profile cannot be directly compared with that ofthe correlating 1D spectrum (Figure 3b, bottom, signal aver-aged for 100 scans) because in 2D FT-ICR MS intensities arenot only proportional to the abundance of detected ions; theyare also dependent on the change in precursor ion intensityduring the fragmentation event. Lower intensity sodium/calcium adducted peaks are also visible in Figure 3b, showingan increase in intensity of the sodium ion-adducted peaks in the2D FT-ICR MS compared with the 1D FT-ICR MS spectrum.As these two spectra were acquired on different days withdifferent samples, it is important not to over-interpret the var-iation in sodium-adducted peak intensities, but it could indicatethere is a greater relative variation (i.e., fragmentation) of salt-
F. Floris et al.: 2D FTICR MS of Calmodulin 1533
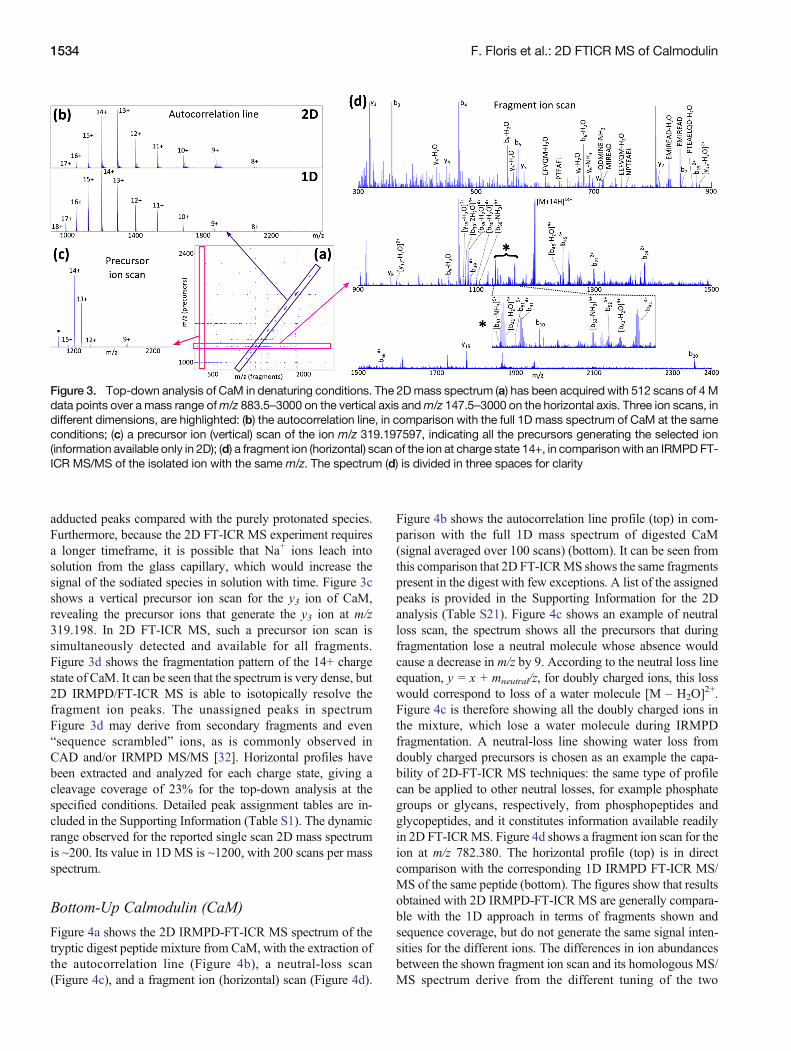
adducted peaks compared with the purely protonated species.Furthermore, because the 2D FT-ICR MS experiment requiresa longer timeframe, it is possible that Na+ ions leach intosolution from the glass capillary, which would increase thesignal of the sodiated species in solution with time. Figure 3cshows a vertical precursor ion scan for the y3 ion of CaM,revealing the precursor ions that generate the y3 ion at m/z319.198. In 2D FT-ICR MS, such a precursor ion scan issimultaneously detected and available for all fragments.Figure 3d shows the fragmentation pattern of the 14+ chargestate of CaM. It can be seen that the spectrum is very dense, but2D IRMPD/FT-ICR MS is able to isotopically resolve thefragment ion peaks. The unassigned peaks in spectrumFigure 3d may derive from secondary fragments and even“sequence scrambled” ions, as is commonly observed inCAD and/or IRMPD MS/MS [32]. Horizontal profiles havebeen extracted and analyzed for each charge state, giving acleavage coverage of 23% for the top-down analysis at thespecified conditions. Detailed peak assignment tables are in-cluded in the Supporting Information (Table S1). The dynamicrange observed for the reported single scan 2D mass spectrumis ~200. Its value in 1D MS is ~1200, with 200 scans per massspectrum.
Bottom-Up Calmodulin (CaM)
Figure 4a shows the 2D IRMPD-FT-ICR MS spectrum of thetryptic digest peptide mixture from CaM, with the extraction ofthe autocorrelation line (Figure 4b), a neutral-loss scan(Figure 4c), and a fragment ion (horizontal) scan (Figure 4d).
Figure 4b shows the autocorrelation line profile (top) in com-parison with the full 1D mass spectrum of digested CaM(signal averaged over 100 scans) (bottom). It can be seen fromthis comparison that 2D FT-ICRMS shows the same fragmentspresent in the digest with few exceptions. A list of the assignedpeaks is provided in the Supporting Information for the 2Danalysis (Table S21). Figure 4c shows an example of neutralloss scan, the spectrum shows all the precursors that duringfragmentation lose a neutral molecule whose absence wouldcause a decrease in m/z by 9. According to the neutral loss lineequation, y = x + mneutral/z, for doubly charged ions, this losswould correspond to loss of a water molecule [M – H2O]
2+.Figure 4c is therefore showing all the doubly charged ions inthe mixture, which lose a water molecule during IRMPDfragmentation. A neutral-loss line showing water loss fromdoubly charged precursors is chosen as an example the capa-bility of 2D-FT-ICR MS techniques: the same type of profilecan be applied to other neutral losses, for example phosphategroups or glycans, respectively, from phosphopeptides andglycopeptides, and it constitutes information available readilyin 2D FT-ICRMS. Figure 4d shows a fragment ion scan for theion at m/z 782.380. The horizontal profile (top) is in directcomparison with the corresponding 1D IRMPD FT-ICR MS/MS of the same peptide (bottom). The figures show that resultsobtained with 2D IRMPD-FT-ICR MS are generally compara-ble with the 1D approach in terms of fragments shown andsequence coverage, but do not generate the same signal inten-sities for the different ions. The differences in ion abundancesbetween the shown fragment ion scan and its homologous MS/MS spectrum derive from the different tuning of the two
Figure 3. Top-down analysis of CaM in denaturing conditions. The 2Dmass spectrum (a) has been acquired with 512 scans of 4 Mdata points over a mass range ofm/z 883.5–3000 on the vertical axis andm/z 147.5–3000 on the horizontal axis. Three ion scans, indifferent dimensions, are highlighted: (b) the autocorrelation line, in comparison with the full 1D mass spectrum of CaM at the sameconditions; (c) a precursor ion (vertical) scan of the ion m/z 319.197597, indicating all the precursors generating the selected ion(information available only in 2D); (d) a fragment ion (horizontal) scan of the ion at charge state 14+, in comparisonwith an IRMPD FT-ICR MS/MS of the isolated ion with the same m/z. The spectrum (d) is divided in three spaces for clarity
1534 F. Floris et al.: 2D FTICR MS of Calmodulin
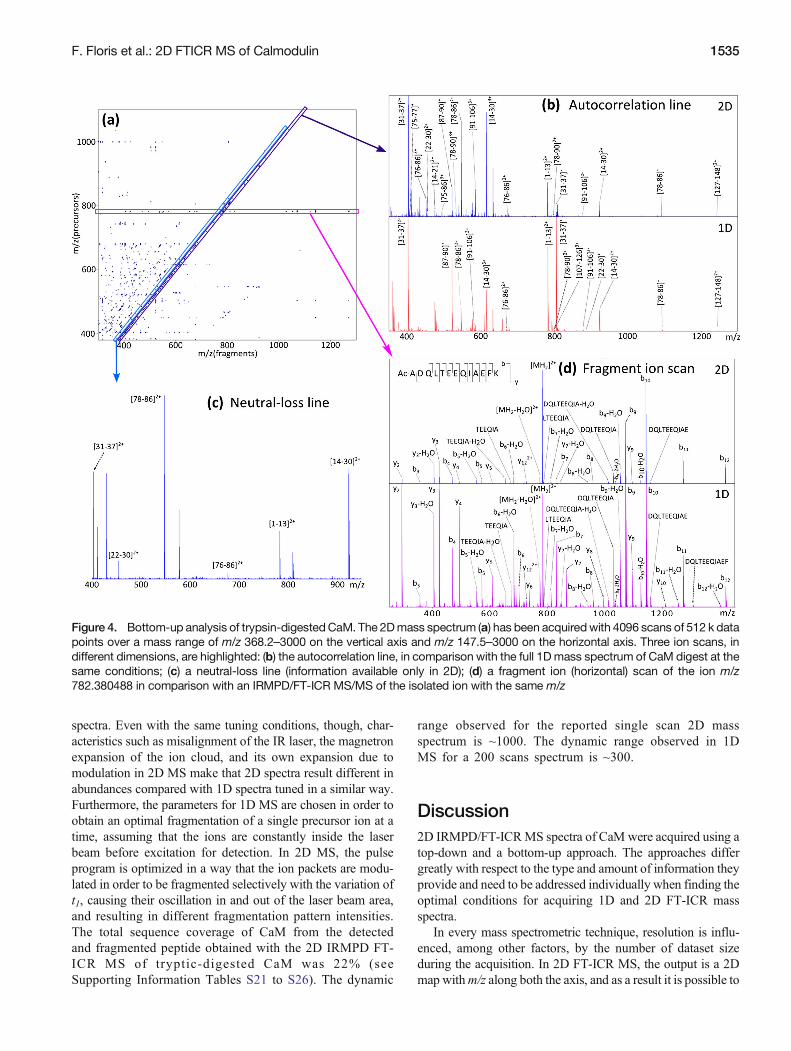
spectra. Even with the same tuning conditions, though, char-acteristics such as misalignment of the IR laser, the magnetronexpansion of the ion cloud, and its own expansion due tomodulation in 2D MS make that 2D spectra result different inabundances compared with 1D spectra tuned in a similar way.Furthermore, the parameters for 1D MS are chosen in order toobtain an optimal fragmentation of a single precursor ion at atime, assuming that the ions are constantly inside the laserbeam before excitation for detection. In 2D MS, the pulseprogram is optimized in a way that the ion packets are modu-lated in order to be fragmented selectively with the variation oft1, causing their oscillation in and out of the laser beam area,and resulting in different fragmentation pattern intensities.The total sequence coverage of CaM from the detectedand fragmented peptide obtained with the 2D IRMPD FT-ICR MS of tryptic-digested CaM was 22% (seeSupporting Information Tables S21 to S26). The dynamic
range observed for the reported single scan 2D massspectrum is ~1000. The dynamic range observed in 1DMS for a 200 scans spectrum is ~300.
Discussion2D IRMPD/FT-ICRMS spectra of CaM were acquired using atop-down and a bottom-up approach. The approaches differgreatly with respect to the type and amount of information theyprovide and need to be addressed individually when finding theoptimal conditions for acquiring 1D and 2D FT-ICR massspectra.
In every mass spectrometric technique, resolution is influ-enced, among other factors, by the number of dataset sizeduring the acquisition. In 2D FT-ICR MS, the output is a 2Dmap withm/z along both the axis, and as a result it is possible to
Figure 4. Bottom-up analysis of trypsin-digestedCaM. The 2Dmass spectrum (a) has been acquiredwith 4096 scans of 512 k datapoints over a mass range of m/z 368.2–3000 on the vertical axis and m/z 147.5–3000 on the horizontal axis. Three ion scans, indifferent dimensions, are highlighted: (b) the autocorrelation line, in comparison with the full 1Dmass spectrum of CaM digest at thesame conditions; (c) a neutral-loss line (information available only in 2D); (d) a fragment ion (horizontal) scan of the ion m/z782.380488 in comparison with an IRMPD/FT-ICR MS/MS of the isolated ion with the same m/z
F. Floris et al.: 2D FTICR MS of Calmodulin 1535
define the resolution for both dimensions, vertical and horizon-tal. Since the y-axis shows them/z of ions in themixture prior tofragmentation (i.e., the precursor ions), the vertical resolutionis analogous to the ability to separate two precursor ion peaks,whereas since the x-axis shows the m/z of the fragment ionsgenerated by each precursor, the horizontal resolution is relatedto the separation of narrow fragment ion peaks. Due to thenature of the 2D Fourier transform, the horizontal resolutiondepends on the number of data points used to acquire t2,whereas the vertical resolution depends on the number ofiterations in t1 (scans). As it can be seen in Figure 1, t2 is thelength of the transient acquired after the fragmentation occurs.Thus, t2 is dictated by the number of data points used for eachacquisition and the sampling frequency required, and is easilyvariable, as for all FTMS acquisitions; t1, as described before, isthe delay between the identical initial pulses P1 and P2. Thestarting value of t1 is dictated by the precursor ions of interest,and the number of increments is dictated by the vertical reso-lution needed to effectively separate those precursors duringthe subsequent 2D-FT-ICR MS experiment.
In the case of the bottom-up procedure, the tryptic digestsolution presents a complex mixture of peptides, whose pre-cursor m/z peaks must be resolved in order to be able todistinguish different precursor peptides and overlapping distri-butions (Figure 4b). The fragmentation of peptides does notgenerate spectra as dense in peaks as those generated by thefragmentation of whole proteins. As can be seen in Figure 4c, itis possible to resolve the generated peptide fragment peaks witha relatively low horizontal resolution. However, the increase insample complexity requires a higher vertical resolution in orderto resolve overlapping peaks. In this case, 4096 data pointswere used for the acquisition in the vertical dimension, eighttimes the amount of data points used for the same acquisition inthe top-down approach (see below). Since the resolution isproportional to the number of data points used for the acquisi-tion, and that in the vertical dimension this value is determinedby the number of t1 time steps, the acquisition of the 2D massspectrum of digested/complex mixtures would take more timethan the top-down experiment because of increased samplecomplexity. The mass resolving powers for the bottom-up 2Dmass spectrum of CaM were RPy = 58766 and an RPx =1191 at m/z 400.
The top-down analysis of CaM showed an initial full MS(Figure 3b) presenting peaks of different charge states clearlyseparated in m/z, with no overlapping distributions betweencharge states. Therefore, vertical resolution needed to be able toseparate two narrow peaks in this case would be relatively low,especially compared with the bottom-up procedure (above).For this reason, only 512 t1 increments (time steps/data points)were required to ensure the effective separation of precursors.The converse applies for the horizontal (MS/MS) scans: afterIRMPD fragmentation, the density of the spectrum (Figure 3c)increases significantly compared with the peptide spectraabove, requiring a higher horizontal resolution to separatedifferent fragments and provide accurate assignments. In thiscase, 4 M data points were used for the acquired transient,
corresponding to a horizontal resolution of 420,000 at 400m/z.Generation of very dense spectra is typical of the top-downapproach, which benefits from the resolution and mass accura-cy of FT-ICR MS for accurate, resolved assignment. The massresolving power was measured using the FWHM reported tom/z 400. For the top-down 2D mass spectrum of CaM, theresults were: RPy (vertical) of 182 and an RPx (horizontal) of420,000.
Owing to the nature of the 2D map produced in 2D FT-ICRMS, it is possible to define a composite resolution, which takesinto account the vertical and horizontal dimensions. In effectthe “true resolution” of a 2D MS mass spectrum is the productof the resolution in both dimensions, and is approximatelyequal to the theoretical peak capacity of the experiment.According to this line of reasoning, the 2D mass resolvingpowers for the previous spectra are the following: 182 (RPy) ×420,000 (RPx) = RP2D ≈ 77 M for the top-down analysis ofCaM and 59,000 (RPy) × 1200 (RPx) RP2D ≈ 70 M for thebottom-up procedure, both at m/z 400.
The results obtained with 2D FT-ICR MS for both thetop-down and the bottom-up analyses of CaM are compa-rable to those obtained with standard 1D FT-ICR MS,with a consistent saving in time and sample consumption.For the bottom-up approach, the 2D FT-ICR MS experi-ment was remarkably faster than a comparative analysis in1D-MS would be; isolating, fragmenting, and detectingeach individual precursor observed in the 1D spectrumof the tryptic digest of CaM could require several hours incomparison. 1D top-down and bottom-up studies on CaMusing IRMPD as fragmentation techniques were per-formed for comparison to the 2D IRMPD FT-ICR MSanalysis, showing cleavage coverages of the protein up to36% for the top-down approach, and about 25% for thebottom-up approach, for a total cleavage coverage of 52%(see Supporting Information, Figure S1). For the 2D FT-ICR MS experiments, the total cleavage coverage obtain-ed with both the approaches reaches ~40% comparable tothose obtained in 1D FT-ICR MS. Since precursors havedifferent fragmentation efficiencies, the limitation of usinga set fragmentation parameter combination for all chargestates is not ideal and could account for the differencesbetween the 2D FT-ICR MS data and individually opti-mized 1D data. Similar issues arise for LC-MS/MSexperiments.
The experiments performed in this work constitute the firstexample of 2D FT-ICR MS for top-down proteomics, andshow that top-down analysis can be performed in 2D MS. Inthis case, CaM is used as a model for its structure and size, andexperiments performed with such a protein constitute the initialstep for top-down analysis of complex mixtures. In fact, al-though the sample used for this analysis was relatively pure,once the procedure is developed, it is possible to apply top-down 2D MS on non-pure/complex mixture samples. In suchsamples, depending on the complexity of the mixture, isolatinga protein for standard MSn analysis might be difficult if notimpossible without contamination from ions close in m/z. As
1536 F. Floris et al.: 2D FTICR MS of Calmodulin

mentioned, in traditional MS/MS the quality of the spectradepends on the resolution obtained with quadrupole isolationof single precursor ions. Narrowing the isolation window inorder to include a single ion (e.g., a single charge state of aprotein of interest) increases the isolation resolution required,but working with narrow isolation windows in a quadrupole(usually less than 5 Da) inevitably brings substantial signallosses that negatively affect the sensitivity of the final MS/MS spectrum. On the other hand, 2D FT-ICR MS provides thefragmentation patterns of all the ions in the mixture without thenecessity of quadrupole isolation, preventing the loss of reso-lution in the precursor dimension even in the case of complexmixtures, as it is demonstrated in this study for the bottom-upprocedure. The resolution in the vertical dimension is higherthan the resolution typically obtainable with quadruple isola-tion, and in 2D FT-ICRMS, the vertical resolution is primarilylimited by the number of t1 steps (vertical scans) acquired, andby the computational capacity available.
2D FT-ICR MS presents particular computational chal-lenges. 2D IRMPD FT-ICR MS of CaM resulted in filesof 23.5 GB for both approaches, a challenging file sizefor processing and denoising with standard desktop com-puters like the one used for this work. 2D NMR, bycomparison, usually works with files 103 times smaller[33]. The choice of denoising rank is roughly proportionalto the number of precursors in the spectrum, and thelower the rank the more the spectrum is denoised [21].Denoising a mass spectrum highly increases the dataprocessing time (from about 4 h- to ~12 h for the shown2D spectra in the described work station system), but it isessential for effective visualization and interpretation. 2DFT-ICR MS development has been hindered until recentlybecause of limited computational capabilities, and com-puter technology still represents a significant limitationfor the technique, but one that is changing rapidly. Thecurrent computational approach to processing this datainvolves parallelizing the 2DFT, denoising, and visualiza-tion code, which will greatly alleviate the current compu-tational bottleneck.
Conclusions2D IRMPD/FT-ICR MS has been used for the top-down andbottom-up analysis of CaM, and fragmentation patterns ofCaM have been obtained with both approaches. The resultsobtained are comparable with 1D FT-ICR MS/MS and theoverall procedure is lower time- and sample-consuming thantraditional tandem mass spectrometry. In 2D MS more infor-mation is available at once through the observation of theneutral-loss lines and the vertical ion scans. 2D FT-ICR MScan be used for the identification of proteins in complex mix-tures, although the technique could be improved for top-downanalysis. The main limitation is currently represented by com-putational capacities.
AcknowledgmentsThe authors thank Dr. Andrea Clavijo-Lopez, Ms. HayleySimon, and Ms. Alice M. Lynch for their helpful discussionsand support. The authors acknowledge the University of War-wick for the opportunity to do these experiments, and theEngineering and Physical Sciences Research Council forfunding (EP/J000302/1).
References1. Marshall, A.G., Hendrickson, C.L., Jackson, G.S.: Fourier transform ion
cyclotron resonance mass spectrometry: a primer. Mass Spectrom. Rev. 17,1–35 (1998)
2. Bracewell, R.N.: The fourier transform and its applications. McGraw-Hill,New York (2000)
3. Marshall, A.G., Verdun, F.R.: Fourier transforms in NMR, optical, andmass spectrometry a user’s handbook. Elsevier B.V., Amsterdam (1990)
4. Qi, Y., O’Connor, P.B.: Data processing in Fourier transform ion cyclotronresonance mass spectrometry. Mass Spectrom. Rev. 33, 333–352 (2014)
5. Zhang, L.-K., Rempel, D., Pramanik, B.N., Gross, M.: Accurate massmeasurements by Fourier transform mass spectrometry. Mass Spectrom.Rev. 24, 286–309 (2005)
6. Hogan, J.M., Pitteri, S.J., Chrisman, P.A., Mcluckey, S.A.: Complementarystructural information from a tryptic N-linked glycopeptide via electrontransfer ion/ion reactions and collision-induced dissociation. J. ProteomeRes. 4, 628–632 (2005)
7. Pfandler, P., Bodenhausen, G., Rapin, J., Houriet, R., Gaumann, T.: Two-dimensional Fourier transform ion cyclotron resonance mass spectrometry.Chem. Phys. Lett. 138, 195–200 (1987)
8. Pfandler, P., Gaumann, T.: Broad-band two-dimensional fourier transformion cyclotron resonance. J. Am. Chem. Soc. 110, 5625–5628 (1988)
9. Guan, S., Jones, P.: A theory for two-dimensional Fourier-transform ioncyclotron resonance mass spectrometry. J. Chem. Phys. 91, 5291–5295(1989)
10. Bensimon, M.: A method to generate phase continuity in two-dimensionalFourier transform ion cyclotron resonance mass spectrometry. Chem. Phys.Lett. 157, 97–100 (1989)
11. Ross, C.W., Guan, S., Grosshans, P.B., Ricca, T.L., Marshall, A.G.: Two-dimensional Fourier transform ion cyclotron resonance mass spectrometry/mass spectrometry with stored-waveform ion radius modulation. J. Am.Chem. Soc. 115, 7854–7861 (1993)
12. van der Rest, G., Marshall, A.G.: Noise analysis for 2D tandem Fouriertransform ion cyclotron resonance mass spectrometry. Int. J. MassSpectrom. 210/211, 101–111 (2001)
13. van Agthoven, M.A., Delsuc, M.-A., Bodenhausen, G., Rolando, C.:Towards analytically useful two-dimensional Fourier transform ion cyclo-tron resonance mass spectrometry. Anal. Bioanal. Chem. 405, 51–61(2013)
14. Marshall, A.G., Wang, L.I.N., Lebatuan, T.: Ion cyclotron resonance exci-tation/de-excitation: a basis for stochastic Fourier transform ion cyclotronresonance mass spectrometry. Chem. Phys. Lett. 105, 233–236 (1984)
15. Little, D.P., Speir, J.P., Senko, M.W., O’Connor, P.B., McLafferty, F.W.:Infrared multiphoton dissociation of large multiply charged ions for bio-molecule sequencing. Anal. Chem. 66, 2809–2815 (1994)
16. Zubarev, R., Kelleher, N.L., McLafferty, F.W.: Electron capture dissocia-tion of multiply charged protein cations. A nonergodic process. J. Am.Chem. Soc. 120, 3265–3266 (1998)
17. van Agthoven, M.A., Delsuc, M.-A., Rolando, C.: Two-dimensional FT-ICR/MS with IRMPD as fragmentation mode. Int. J. Mass Spectrom. 306,196–203 (2011)
18. van Agthoven, M.A., Chiron, L., Coutouly, M.-A., Delsuc, M.-A.,Rolando, C.: Two-dimensional ECD FT-ICR mass spectrometry of pep-tides and glycopeptides. Anal. Chem. 84, 5589–5595 (2012)
19. Morris, G.A.: Systematic sources of signal irreproducibility and t1 noise inhigh-field NMR spectrometers. J. Magn. Reson. 100, 316–328 (1992)
20. van Agthoven, M.A., Coutouly, M.-A., Rolando, C., Delsuc, M.-A.: Two-dimensional Fourier transform ion cyclotron resonance mass spectrometry:reduction of scintillation noise using Cadzow data processing. RapidCommun. Mass Spectrom. 25, 1609–1616 (2011)
F. Floris et al.: 2D FTICR MS of Calmodulin 1537
21. Chiron, L., van Agthoven, M.A., Kieffer, B., Rolando, C., Delsuc,M.-A.: Efficient denoising algorithms for large experimentaldatasets and their applications in Fourier transform ion cyclotronresonance mass spectrometry. Proc. Natl. Acad. Sci. U. S. A. 111,1385–1390 (2014)
22. van Agthoven, M.A., Barrow, M.P., Chiron, L., Coutouly, M.-A.,Kilgour, D., Wootton, C.A., Wei, J., Soulby, A., Delsuc, M.-A.,Rolando, C., O’Connor, P.B.: Differentiating fragmentation path-ways of cholesterol by two-dimensional fourier transform ion cy-clotron resonance mass spectrometry. J. Am. Soc. Mass Spectrom.26, 2105–2114 (2015)
23. Simon, H., van Agthoven, M.A., Lam, P.Y., Floris, F., Chiron, L., Delsuc,M.-A., Rolando, C., Barrow, M., O’Connor, P.: Uncoiling Collagen: amultidimensional mass spectrometry study. Analyst (2015). doi:10.1039/C5AN01757B
24. van Agthoven, M.A.,Wootton, C.A., Chiron, L., Coutouly,M., Soulby, A.,Wei, J., Barrow, M.P., Delsuc, M., Rolando, C., O'Connor, P.B.: Two-dimensional mass spectrometry for proteomics, a comparative study withcytochrome c. Anal. Chem. 88, 4409–4417 (2016)
25. Stevens, F.C.: Calmodulin: an introduction. Can. J. Biochem. Cell Biol. 61,906–910 (1982)
26. Means, A.D.: Calmodulin: an intracellular calcium receptor. Nature 285,73–77 (1980)
27. Soulby, A.J., Heal, J.W., Barrow, M.P., Roemer, R.A., O’Connor, P.B.:Does deamidation cause protein unfolding? A top-down tandem massspectrometry study. Protein Sci. 24, 850–860 (2015)
28. Li, H., Lin, T.Y., Van Orden, S.L., Zhao, Y., Barrow, M.P., Pizarro, A.M.,Qi, Y., Sadler, P.J., O’Connor, P.B.: Use of top-down and bottom-upfourier transform ion cyclotron resonance mass spectrometry for mappingcalmodulin sites modified by platinum anticancer drugs. Anal. Chem. 83,9507–9515 (2011)
29. Li, H., Wells, S.A., Jimenez-Roldan, J.E., Römer, R.A., Zhao, Y., Sadler,P.J., O’Connor, P.B.: Protein flexibility is key to cisplatin crosslinking incalmodulin. Protein Sci. 21, 1269–1279 (2012)
30. van Agthoven, M.A., Chiron, L., Coutouly, M.-A., Sehgal, A.A., Pelupessy,P., Delsuc, M.-A., Rolando, C.: Optimization of the discrete pulse sequencefor two-dimensional FT-ICR mass spectrometry using infrared multiphotondissociation. Int. J. Mass Spectrom. 370, 114–124 (2014)
31. SPIKE: Spectrometry Processing Innovative KErnel. Available at: https://bitbucket.org/delsuc/spike. Accessed May 2015
32. Paizs, B., Suhai, S.: Fragmentation pathways of protonated peptides. MassSpectrom. Rev. 24, 508–548 (2005)
33. Kumar, A., Ernst, R.R., Wüthrich, K.: A two-dimensional nuclearOverhauser enhancement (2D NOE) experiment for the elucidation ofcomplete proton-proton cross-relaxation networks in biological macromol-ecules. Biochem. Biophys. Res. Commun. 95, 1–6 (1980)
1538 F. Floris et al.: 2D FTICR MS of Calmodulin