28th february, 2021 - anand rathi
TRANSCRIPT
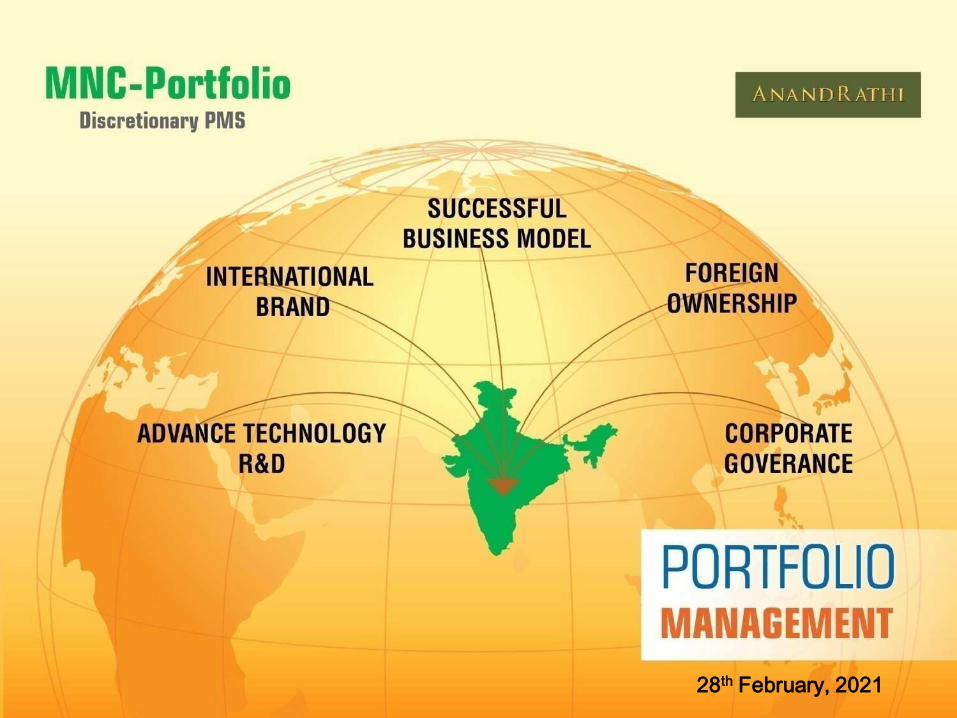
28th February, 2021
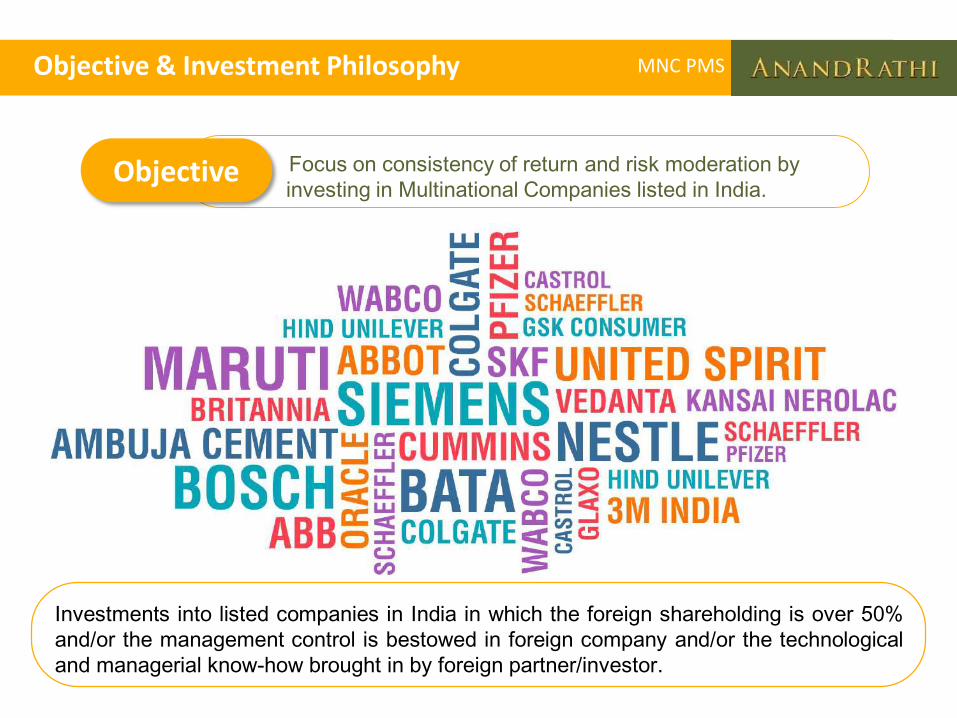
Objective & Investment Philosophy
Focus on consistency of return and risk moderation by
investing in Multinational Companies listed in India.Objective
Investments into listed companies in India in which the foreign shareholding is over 50%
and/or the management control is bestowed in foreign company and/or the technological
and managerial know-how brought in by foreign partner/investor.
MNC PMS
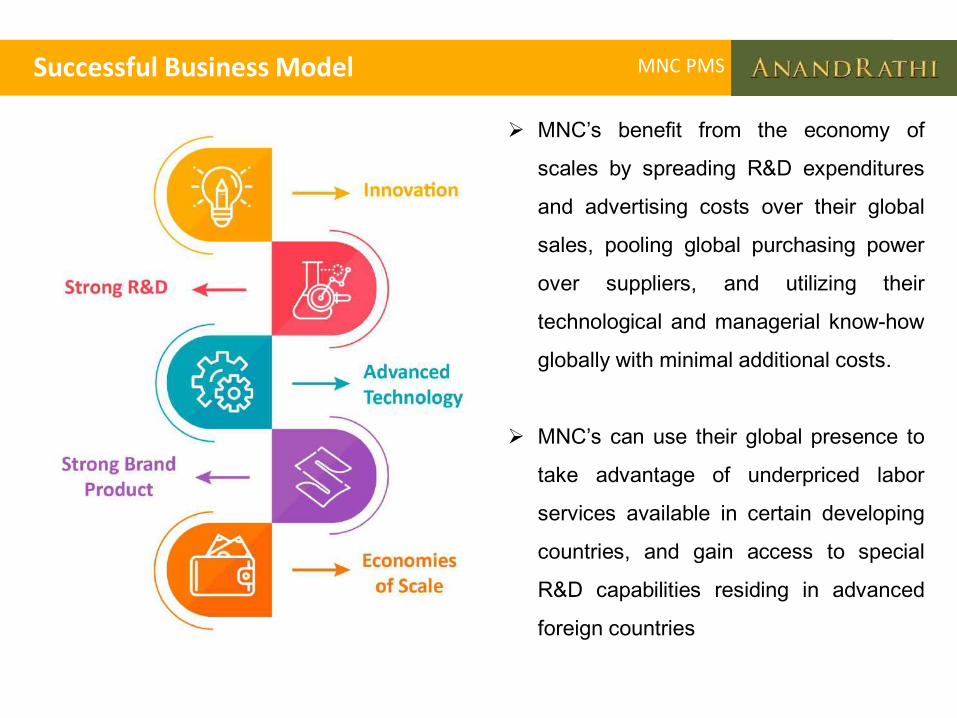
Successful Business Model
MNC’s benefit from the economy of
scales by spreading R&D expenditures
and advertising costs over their global
sales, pooling global purchasing power
over suppliers, and utilizing their
technological and managerial know-how
globally with minimal additional costs.
MNC’s can use their global presence to
take advantage of underpriced labor
services available in certain developing
countries, and gain access to special
R&D capabilities residing in advanced
foreign countries
MNC PMS
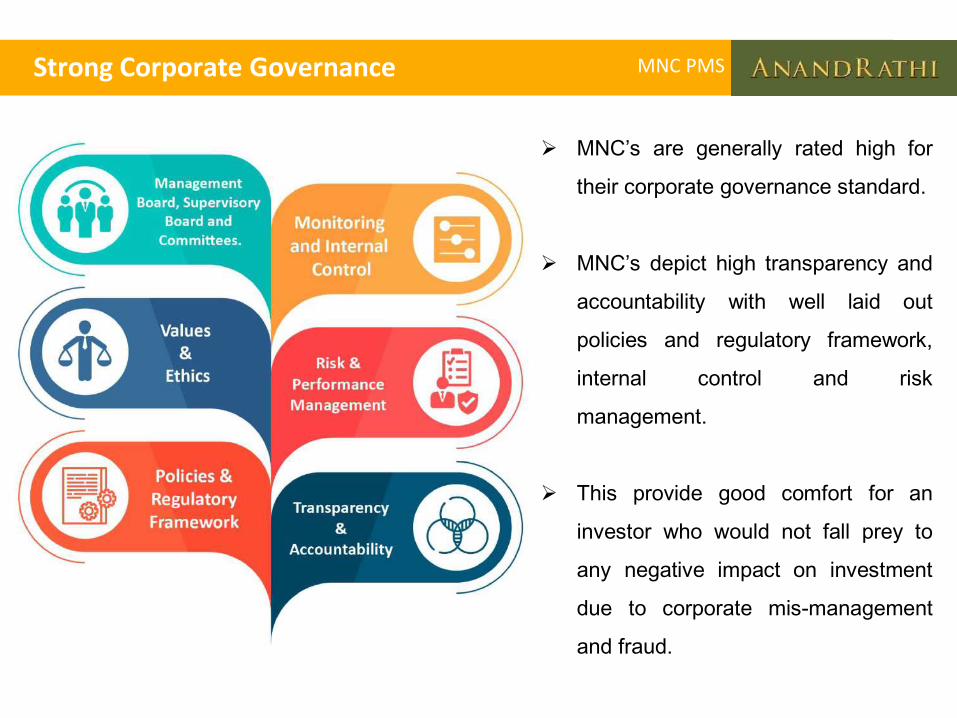
Strong Corporate Governance
MNC’s are generally rated high for
their corporate governance standard.
MNC’s depict high transparency and
accountability with well laid out
policies and regulatory framework,
internal control and risk
management.
This provide good comfort for an
investor who would not fall prey to
any negative impact on investment
due to corporate mis-management
and fraud.
MNC PMS
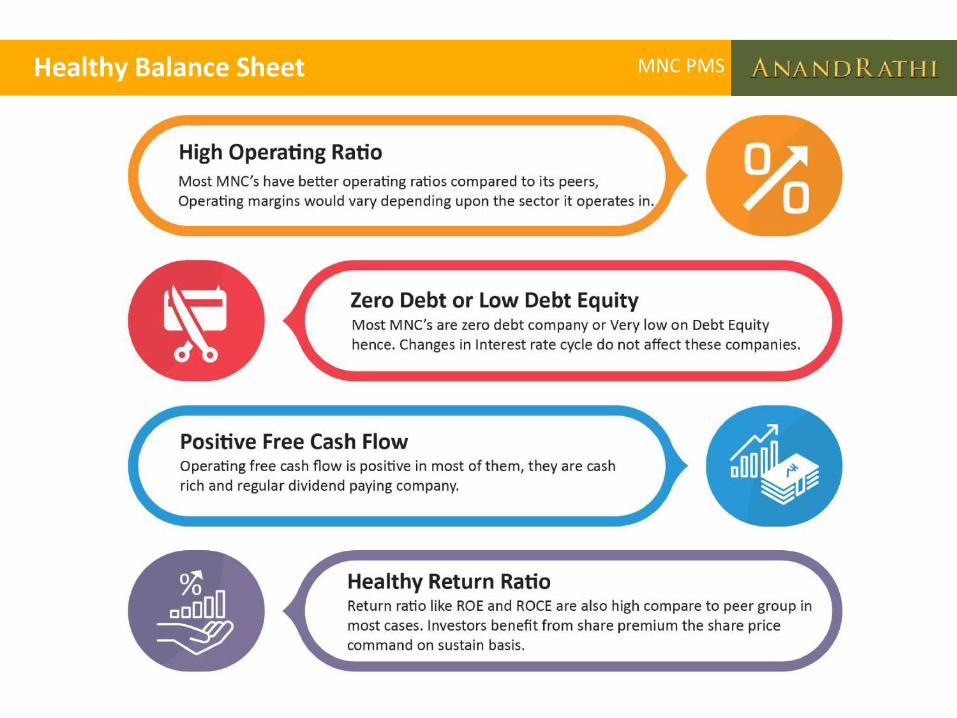
Healthy Balance Sheet MNC PMS
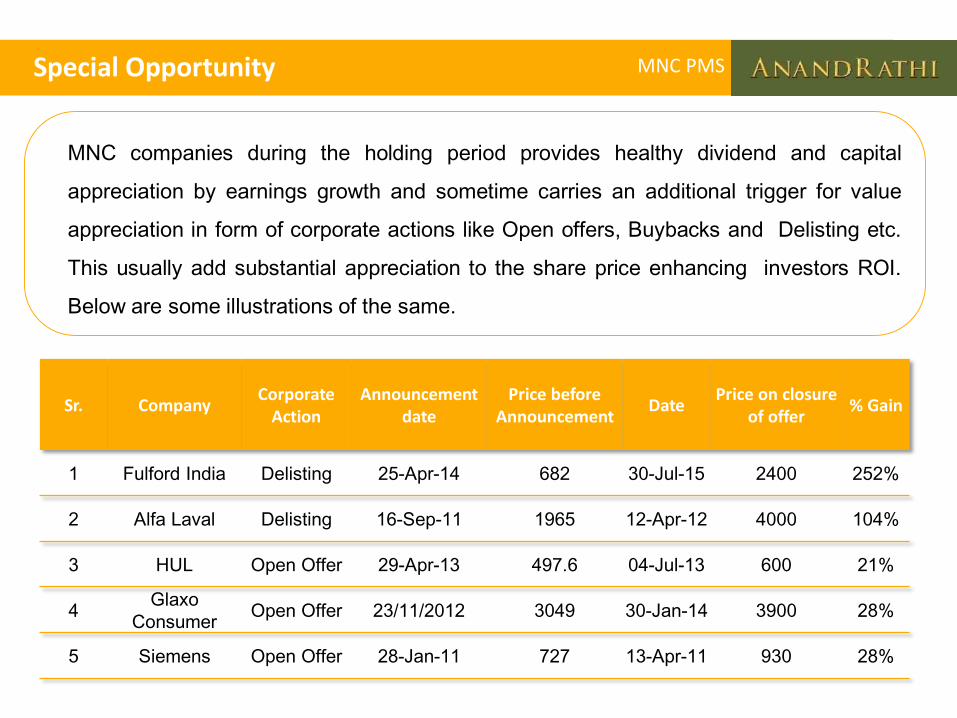
Special Opportunity
Sr. CompanyCorporate
ActionAnnouncement
datePrice before
AnnouncementDate
Price on closure of offer
% Gain
1 Fulford India Delisting 25-Apr-14 682 30-Jul-15 2400 252%
2 Alfa Laval Delisting 16-Sep-11 1965 12-Apr-12 4000 104%
3 HUL Open Offer 29-Apr-13 497.6 04-Jul-13 600 21%
4Glaxo
ConsumerOpen Offer 23/11/2012 3049 30-Jan-14 3900 28%
5 Siemens Open Offer 28-Jan-11 727 13-Apr-11 930 28%
MNC companies during the holding period provides healthy dividend and capital
appreciation by earnings growth and sometime carries an additional trigger for value
appreciation in form of corporate actions like Open offers, Buybacks and Delisting etc.
This usually add substantial appreciation to the share price enhancing investors ROI.
Below are some illustrations of the same.
MNC PMS
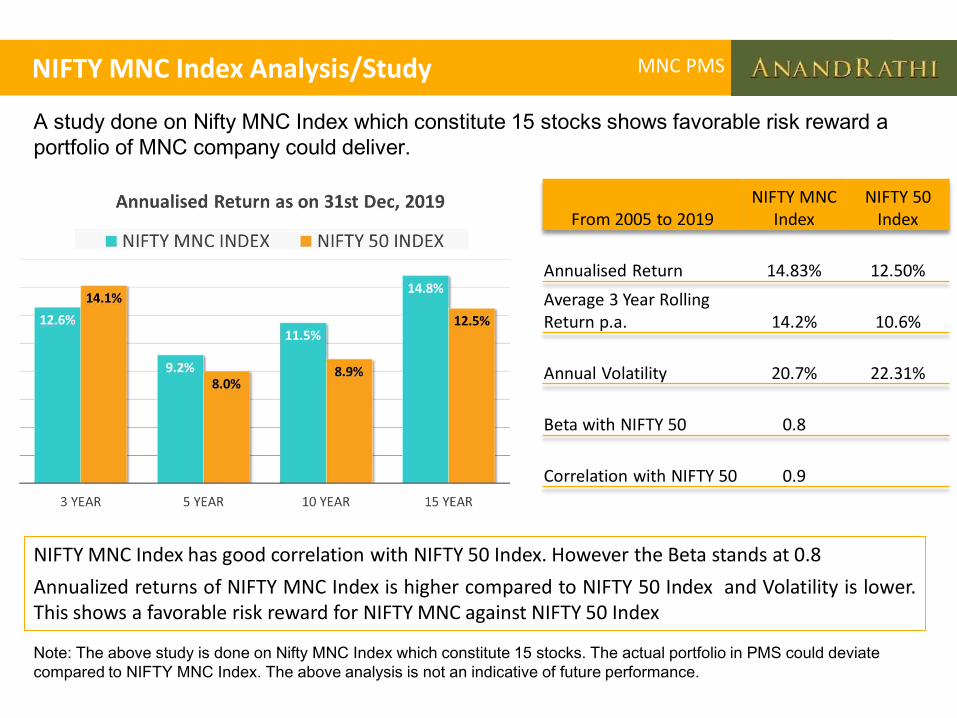
NIFTY MNC Index Analysis/Study
NIFTY MNC Index has good correlation with NIFTY 50 Index. However the Beta stands at 0.8
Annualized returns of NIFTY MNC Index is higher compared to NIFTY 50 Index and Volatility is lower.This shows a favorable risk reward for NIFTY MNC against NIFTY 50 Index
Note: The above study is done on Nifty MNC Index which constitute 15 stocks. The actual portfolio in PMS could deviate
compared to NIFTY MNC Index. The above analysis is not an indicative of future performance.
From 2005 to 2019NIFTY MNC
IndexNIFTY 50
Index
Annualised Return 14.83% 12.50%
Average 3 Year Rolling Return p.a. 14.2% 10.6%
Annual Volatility 20.7% 22.31%
Beta with NIFTY 50 0.8
Correlation with NIFTY 50 0.9
A study done on Nifty MNC Index which constitute 15 stocks shows favorable risk reward a
portfolio of MNC company could deliver.
MNC PMS
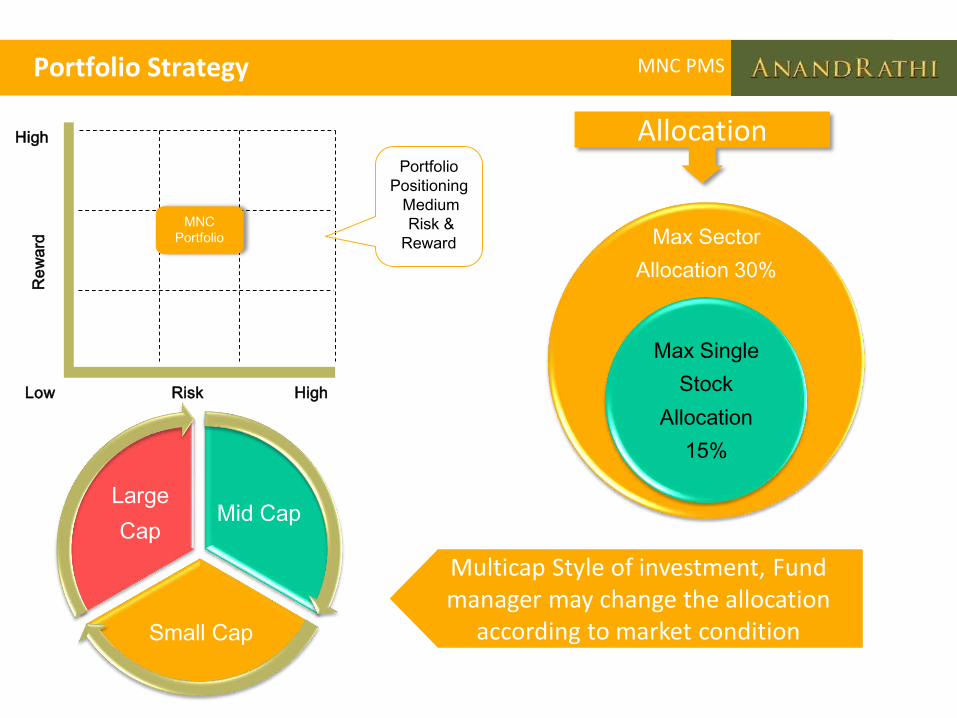
Portfolio Strategy
Risk
Re
wa
rd
Low High
High
MNC
Portfolio
Portfolio
Positioning
Medium
Risk &
Reward
Multicap Style of investment, Fund manager may change the allocation
according to market condition
Allocation
Mid Cap
Small Cap
Large
Cap
Max Sector
Allocation 30%
Max Single
Stock
Allocation
15%
MNC PMS
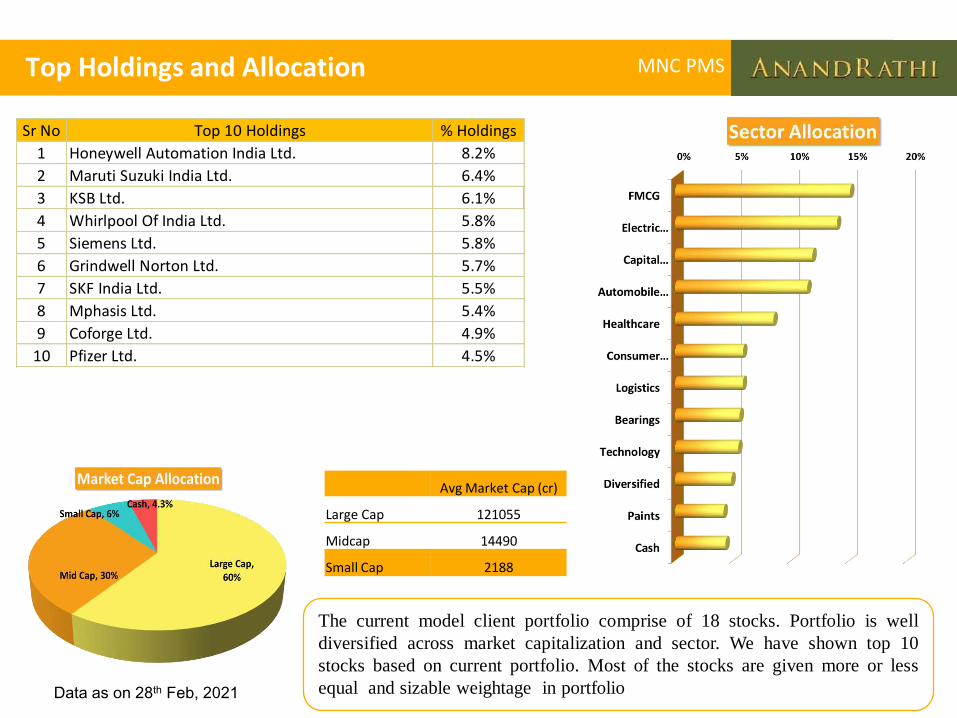
Top Holdings and Allocation
Data as on 28th Feb, 2021
The current model client portfolio comprise of 18 stocks. Portfolio is well
diversified across market capitalization and sector. We have shown top 10
stocks based on current portfolio. Most of the stocks are given more or less
equal and sizable weightage in portfolio
Avg Market Cap (cr)
Large Cap 121055
Midcap 14490
Small Cap 2188
MNC PMS
Sr No Top 10 Holdings % Holdings
1 Honeywell Automation India Ltd. 8.2%
2 Maruti Suzuki India Ltd. 6.4%
3 KSB Ltd. 6.1%
4 Whirlpool Of India Ltd. 5.8%
5 Siemens Ltd. 5.8%
6 Grindwell Norton Ltd. 5.7%
7 SKF India Ltd. 5.5%
8 Mphasis Ltd. 5.4%
9 Coforge Ltd. 4.9%
10 Pfizer Ltd. 4.5%
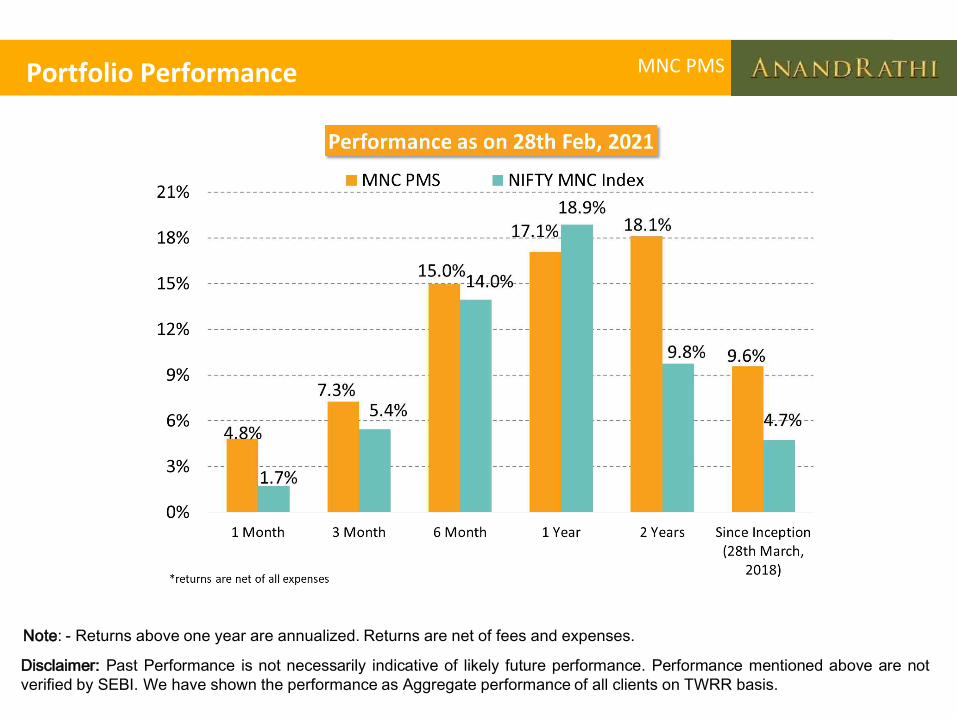
Portfolio Performance
10
MNC PMS
Note: - Returns above one year are annualized. Returns are net of fees and expenses.
Disclaimer: Past Performance is not necessarily indicative of likely future performance. Performance mentioned above are not
verified by SEBI. We have shown the performance as Aggregate performance of all clients on TWRR basis.
Portfolio Strategy
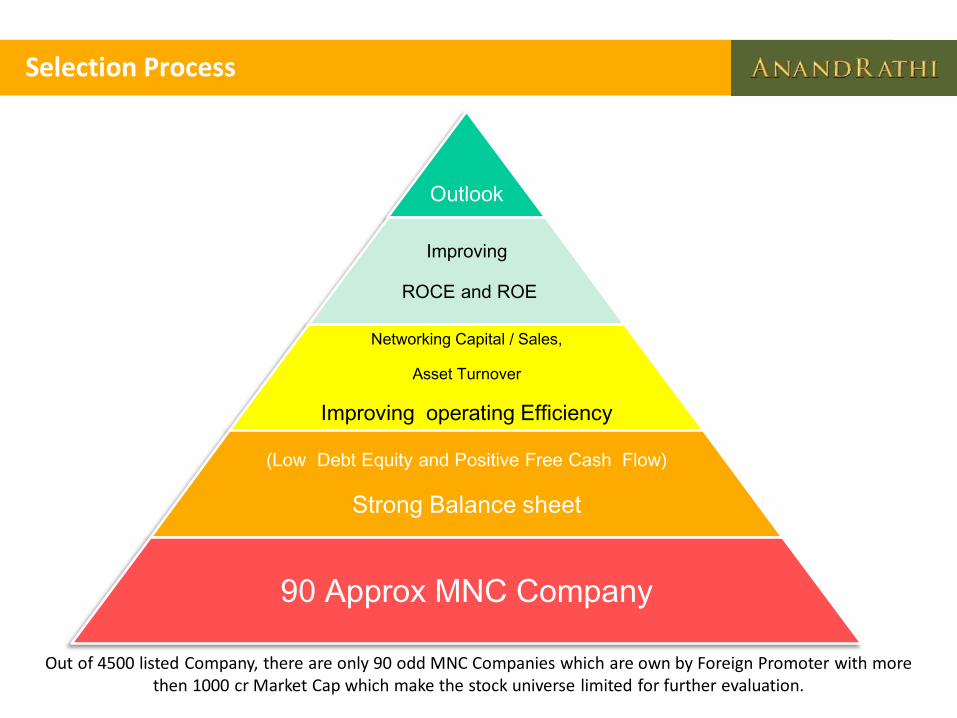
Selection Process
Outlook
Improving
ROCE and ROE
Networking Capital / Sales,
Asset Turnover
Improving operating Efficiency
(Low Debt Equity and Positive Free Cash Flow)
Strong Balance sheet
90 Approx MNC Company
Out of 4500 listed Company, there are only 90 odd MNC Companies which are own by Foreign Promoter with more then 1000 cr Market Cap which make the stock universe limited for further evaluation.
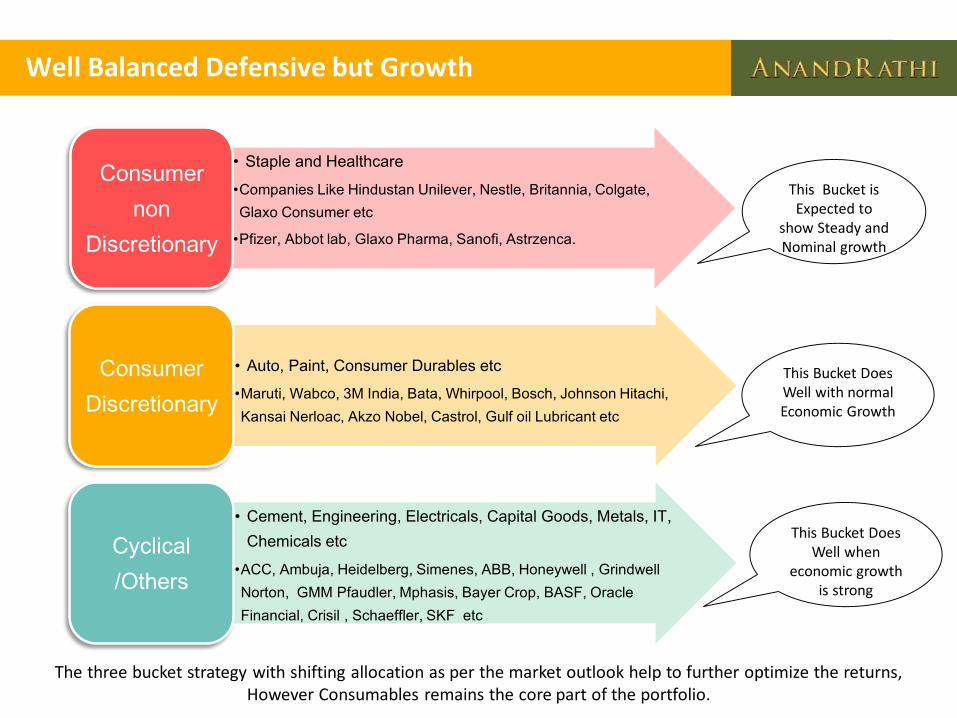
Well Balanced Defensive but Growth
• Staple and Healthcare
•Companies Like Hindustan Unilever, Nestle, Britannia, Colgate,
Glaxo Consumer etc
•Pfizer, Abbot lab, Glaxo Pharma, Sanofi, Astrzenca.
Consumer
non
Discretionary
• Auto, Paint, Consumer Durables etc
•Maruti, Wabco, 3M India, Bata, Whirpool, Bosch, Johnson Hitachi,
Kansai Nerloac, Akzo Nobel, Castrol, Gulf oil Lubricant etc
Consumer
Discretionary
• Cement, Engineering, Electricals, Capital Goods, Metals, IT,
Chemicals etc
•ACC, Ambuja, Heidelberg, Simenes, ABB, Honeywell , Grindwell
Norton, GMM Pfaudler, Mphasis, Bayer Crop, BASF, Oracle
Financial, Crisil , Schaeffler, SKF etc
Cyclical
/Others
This Bucket is Expected to
show Steady and Nominal growth
This Bucket Does Well with normal Economic Growth
This Bucket Does Well when
economic growth is strong
The three bucket strategy with shifting allocation as per the market outlook help to further optimize the returns, However Consumables remains the core part of the portfolio.
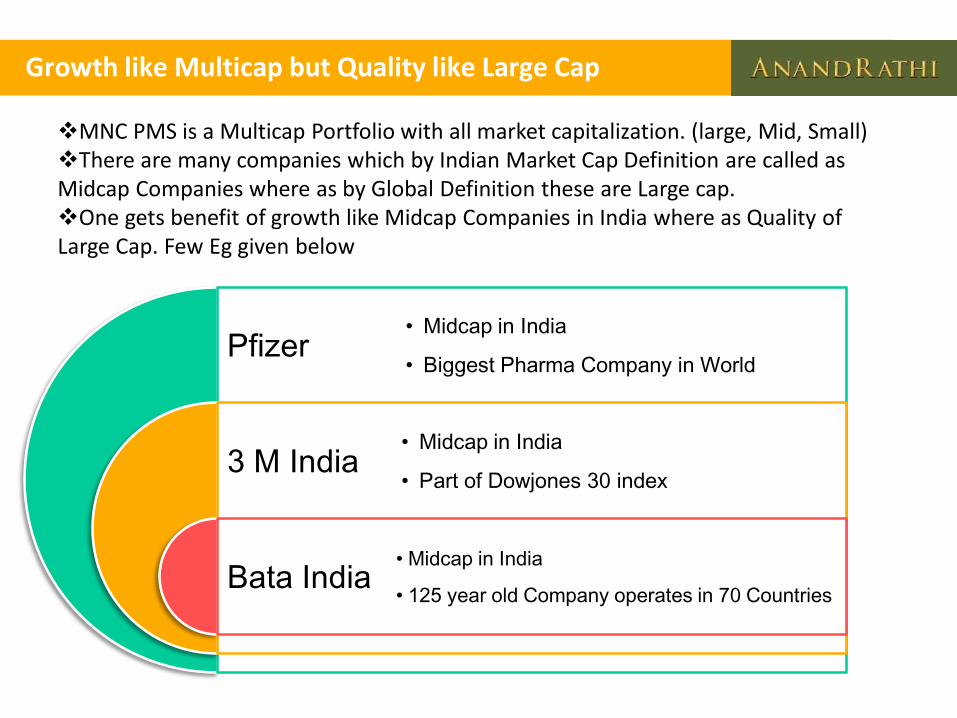
Growth like Multicap but Quality like Large Cap
MNC PMS is a Multicap Portfolio with all market capitalization. (large, Mid, Small)There are many companies which by Indian Market Cap Definition are called as Midcap Companies where as by Global Definition these are Large cap.One gets benefit of growth like Midcap Companies in India where as Quality of Large Cap. Few Eg given below
Pfizer
3 M India
Bata India
• Midcap in India
• Biggest Pharma Company in World
• Midcap in India
• Part of Dowjones 30 index
• Midcap in India
• 125 year old Company operates in 70 Countries
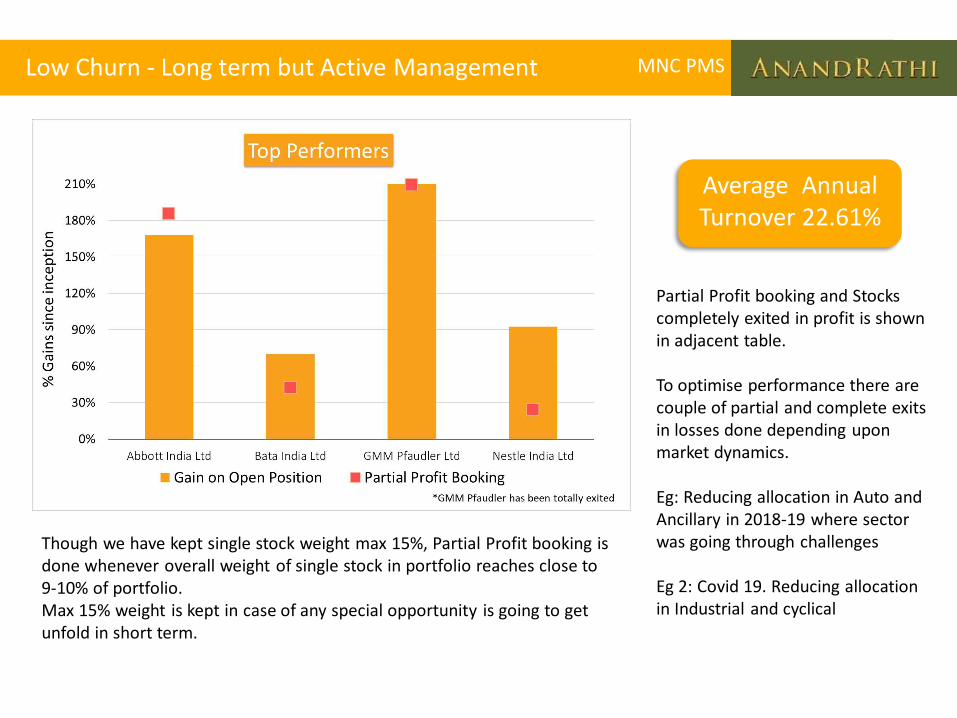
Low Churn - Long term but Active Management MNC PMS
Though we have kept single stock weight max 15%, Partial Profit booking is done whenever overall weight of single stock in portfolio reaches close to 9-10% of portfolio. Max 15% weight is kept in case of any special opportunity is going to get unfold in short term.
Average Annual Turnover 22.61%
Partial Profit booking and Stocks completely exited in profit is shown in adjacent table.
To optimise performance there are couple of partial and complete exits in losses done depending upon market dynamics.
Eg: Reducing allocation in Auto and Ancillary in 2018-19 where sector was going through challenges
Eg 2: Covid 19. Reducing allocation in Industrial and cyclical
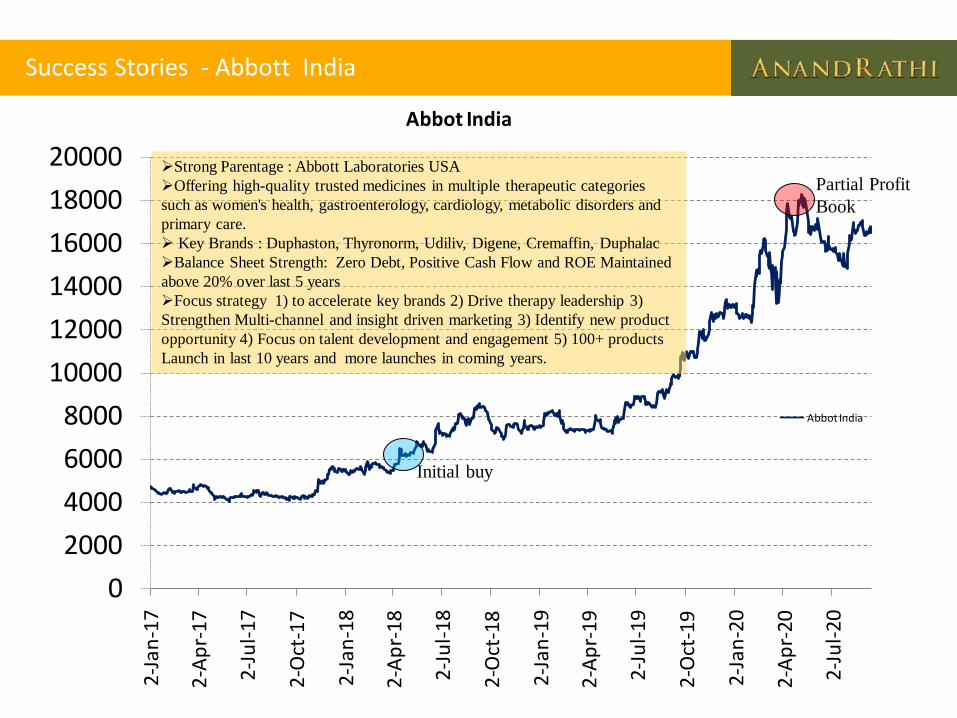
Success Stories - Abbott India
0
2000
4000
6000
8000
10000
12000
14000
16000
18000
200002-
Jan
-17
2-A
pr-
17
2-Ju
l-1
7
2-O
ct-1
7
2-Ja
n-1
8
2-A
pr-
18
2-Ju
l-1
8
2-O
ct-1
8
2-Ja
n-1
9
2-A
pr-
19
2-Ju
l-1
9
2-O
ct-1
9
2-Ja
n-2
0
2-A
pr-
20
2-Ju
l-2
0
Abbot India
Abbot India
Initial buy
Partial Profit
Book
Strong Parentage : Abbott Laboratories USA
Offering high-quality trusted medicines in multiple therapeutic categories
such as women's health, gastroenterology, cardiology, metabolic disorders and
primary care.
Key Brands : Duphaston, Thyronorm, Udiliv, Digene, Cremaffin, Duphalac
Balance Sheet Strength: Zero Debt, Positive Cash Flow and ROE Maintained
above 20% over last 5 years
Focus strategy 1) to accelerate key brands 2) Drive therapy leadership 3)
Strengthen Multi-channel and insight driven marketing 3) Identify new product
opportunity 4) Focus on talent development and engagement 5) 100+ products
Launch in last 10 years and more launches in coming years.
0
1000
2000
3000
4000
5000
6000
70005-
Mar
-18
5-M
ay-…
5-Ju
l-18
5-Se
p-1
8
5-N
ov-
18
5-Ja
n-1
9
5-M
ar-1
9
5-M
ay-…
5-Ju
l-19
5-Se
p-1
9
5-N
ov-
19
5-Ja
n-2
0
5-M
ar-2
0
5-M
ay-…
5-Ju
l-20
5-Se
p-2
0
GMM Pfaudler
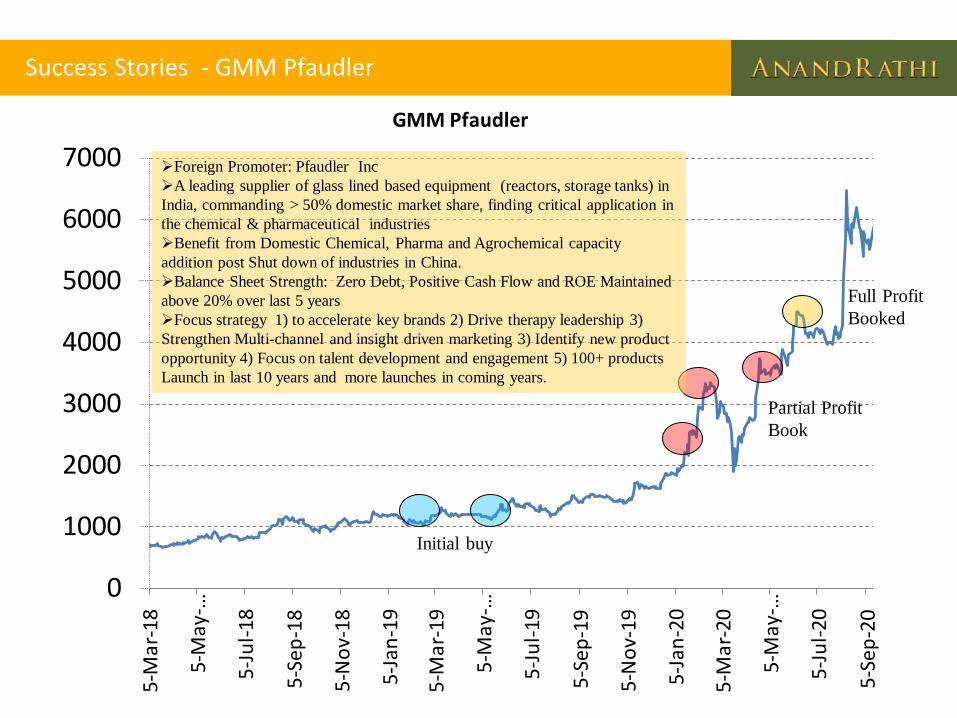
Success Stories - GMM Pfaudler
Initial buy
Full Profit
Booked
Partial Profit
Book
Foreign Promoter: Pfaudler Inc
A leading supplier of glass lined based equipment (reactors, storage tanks) in
India, commanding > 50% domestic market share, finding critical application in
the chemical & pharmaceutical industries
Benefit from Domestic Chemical, Pharma and Agrochemical capacity
addition post Shut down of industries in China.
Balance Sheet Strength: Zero Debt, Positive Cash Flow and ROE Maintained
above 20% over last 5 years
Focus strategy 1) to accelerate key brands 2) Drive therapy leadership 3)
Strengthen Multi-channel and insight driven marketing 3) Identify new product
opportunity 4) Focus on talent development and engagement 5) 100+ products
Launch in last 10 years and more launches in coming years.
0
500
1000
1500
2000
25002-
Jan
-17
2-A
pr-
17
2-Ju
l-17
2-O
ct-1
7
2-Ja
n-1
8
2-A
pr-
18
2-Ju
l-18
2-O
ct-1
8
2-Ja
n-1
9
2-A
pr-
19
2-Ju
l-19
2-O
ct-1
9
2-Ja
n-2
0
2-A
pr-
20
2-Ju
l-20
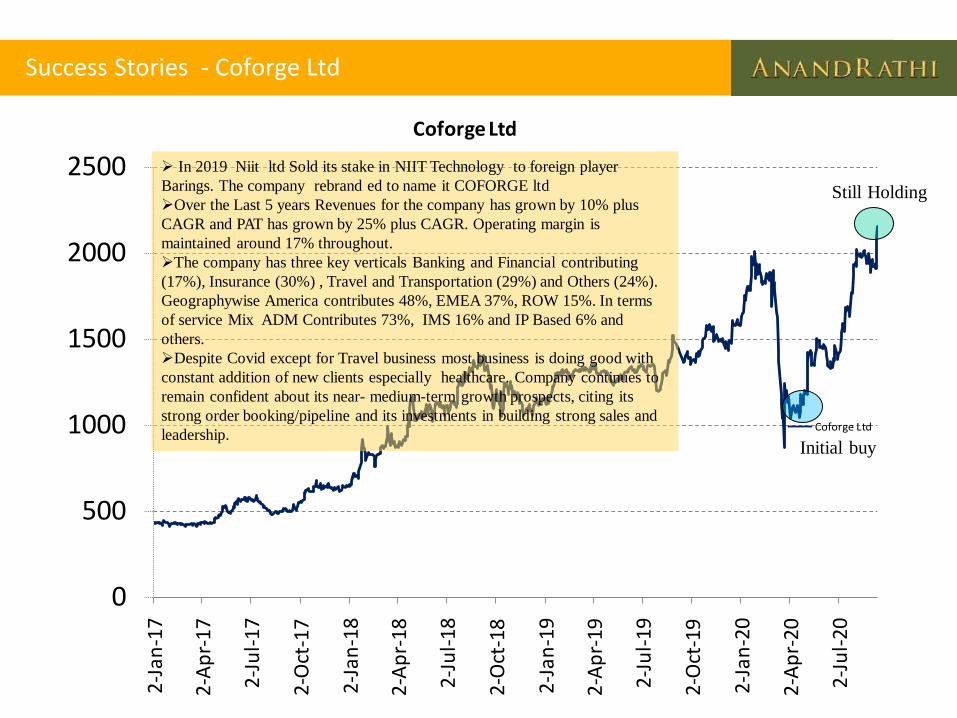
Coforge Ltd
Coforge Ltd
Success Stories - Coforge Ltd
Initial buy
In 2019 Niit ltd Sold its stake in NIIT Technology to foreign player
Barings. The company rebrand ed to name it COFORGE ltd
Over the Last 5 years Revenues for the company has grown by 10% plus
CAGR and PAT has grown by 25% plus CAGR. Operating margin is
maintained around 17% throughout.
The company has three key verticals Banking and Financial contributing
(17%), Insurance (30%) , Travel and Transportation (29%) and Others (24%).
Geographywise America contributes 48%, EMEA 37%, ROW 15%. In terms
of service Mix ADM Contributes 73%, IMS 16% and IP Based 6% and
others.
Despite Covid except for Travel business most business is doing good with
constant addition of new clients especially healthcare. Company continues to
remain confident about its near- medium-term growth prospects, citing its
strong order booking/pipeline and its investments in building strong sales and
leadership.
Still Holding
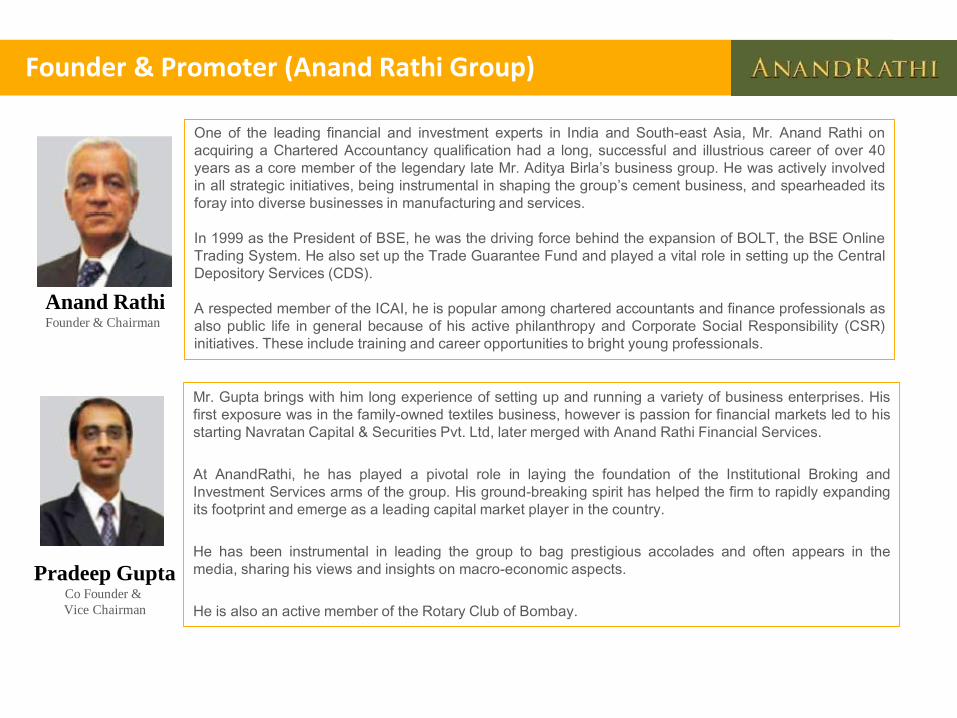
Founder & Promoter (Anand Rathi Group)
One of the leading financial and investment experts in India and South-east Asia, Mr. Anand Rathi on
acquiring a Chartered Accountancy qualification had a long, successful and illustrious career of over 40
years as a core member of the legendary late Mr. Aditya Birla’s business group. He was actively involved
in all strategic initiatives, being instrumental in shaping the group’s cement business, and spearheaded its
foray into diverse businesses in manufacturing and services.
In 1999 as the President of BSE, he was the driving force behind the expansion of BOLT, the BSE Online
Trading System. He also set up the Trade Guarantee Fund and played a vital role in setting up the Central
Depository Services (CDS).
A respected member of the ICAI, he is popular among chartered accountants and finance professionals as
also public life in general because of his active philanthropy and Corporate Social Responsibility (CSR)
initiatives. These include training and career opportunities to bright young professionals.
Anand RathiFounder & Chairman
Pradeep GuptaCo Founder &
Vice Chairman
Mr. Gupta brings with him long experience of setting up and running a variety of business enterprises. His
first exposure was in the family-owned textiles business, however is passion for financial markets led to his
starting Navratan Capital & Securities Pvt. Ltd, later merged with Anand Rathi Financial Services.
At AnandRathi, he has played a pivotal role in laying the foundation of the Institutional Broking and
Investment Services arms of the group. His ground-breaking spirit has helped the firm to rapidly expanding
its footprint and emerge as a leading capital market player in the country.
He has been instrumental in leading the group to bag prestigious accolades and often appears in the
media, sharing his views and insights on macro-economic aspects.
He is also an active member of the Rotary Club of Bombay.
Fund Management Team
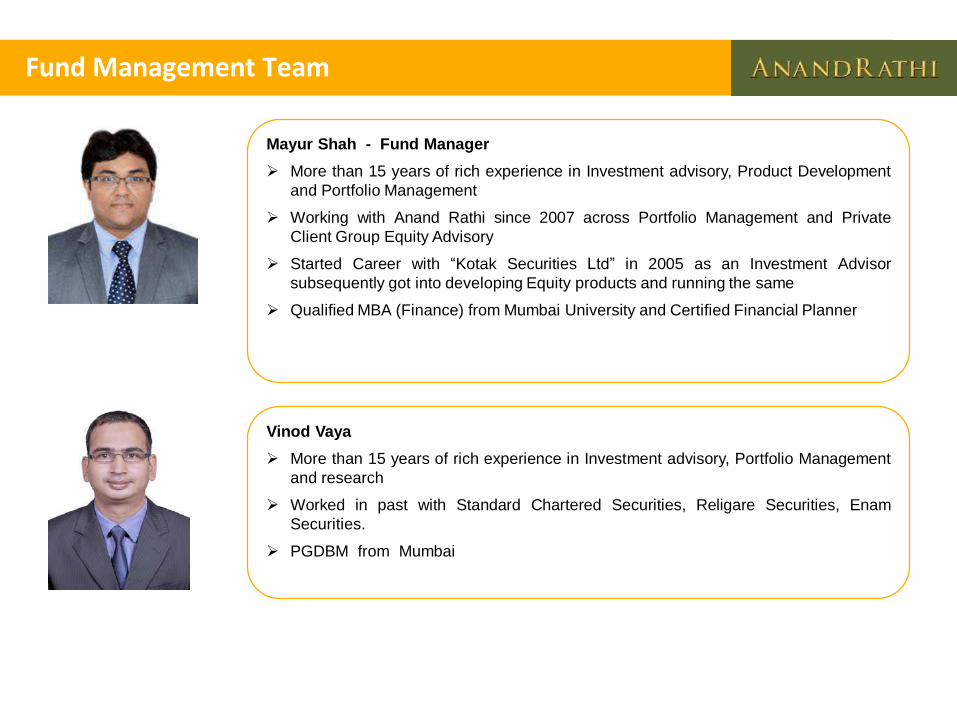
Mayur Shah - Fund Manager
More than 15 years of rich experience in Investment advisory, Product Development
and Portfolio Management
Working with Anand Rathi since 2007 across Portfolio Management and Private
Client Group Equity Advisory
Started Career with “Kotak Securities Ltd” in 2005 as an Investment Advisor
subsequently got into developing Equity products and running the same
Qualified MBA (Finance) from Mumbai University and Certified Financial Planner
Vinod Vaya
More than 15 years of rich experience in Investment advisory, Portfolio Management
and research
Worked in past with Standard Chartered Securities, Religare Securities, Enam
Securities.
PGDBM from Mumbai
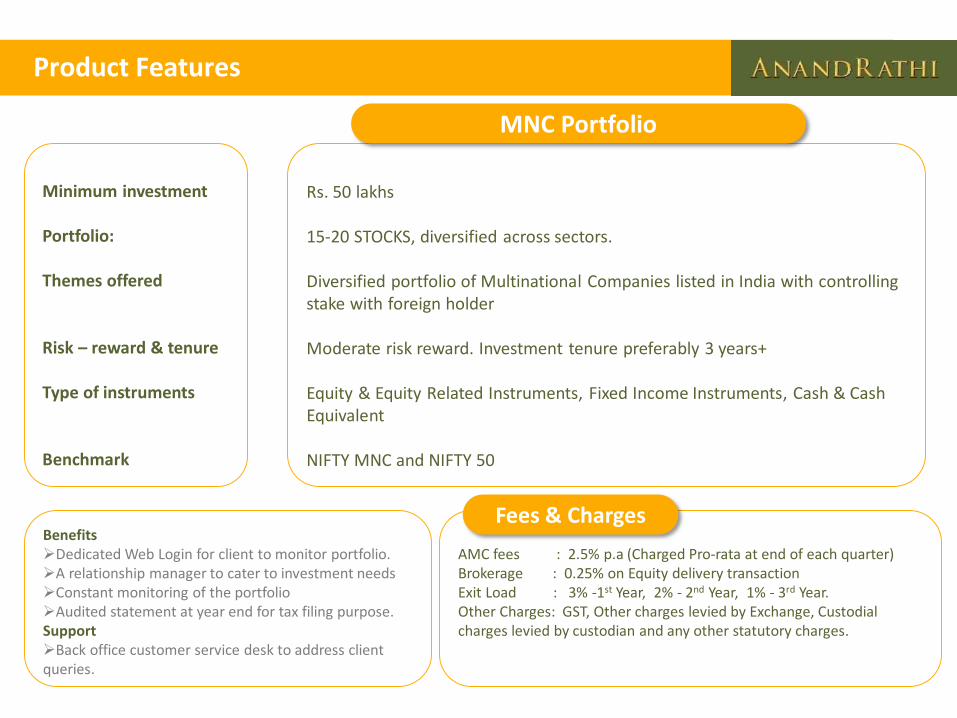
AMC fees : 2.5% p.a (Charged Pro-rata at end of each quarter)Brokerage : 0.25% on Equity delivery transactionExit Load : 3% -1st Year, 2% - 2nd Year, 1% - 3rd Year.Other Charges: GST, Other charges levied by Exchange, Custodial charges levied by custodian and any other statutory charges.
Product Features
Minimum investment
Portfolio:
Themes offered
Risk – reward & tenure
Type of instruments
Benchmark
Rs. 50 lakhs
15-20 STOCKS, diversified across sectors.
Diversified portfolio of Multinational Companies listed in India with controlling stake with foreign holder
Moderate risk reward. Investment tenure preferably 3 years+
Equity & Equity Related Instruments, Fixed Income Instruments, Cash & Cash Equivalent
NIFTY MNC and NIFTY 50
BenefitsDedicated Web Login for client to monitor portfolio.A relationship manager to cater to investment needsConstant monitoring of the portfolioAudited statement at year end for tax filing purpose.SupportBack office customer service desk to address client queries.
MNC Portfolio
Fees & Charges
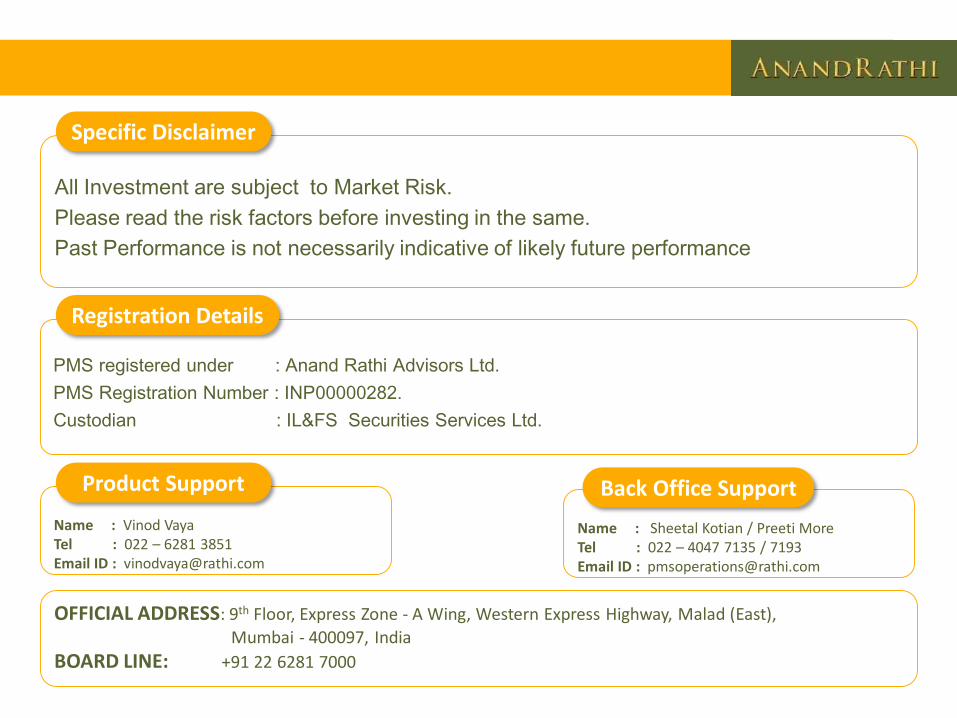
PMS registered under : Anand Rathi Advisors Ltd.
PMS Registration Number : INP00000282.
Custodian : IL&FS Securities Services Ltd.
OFFICIAL ADDRESS: 9th Floor, Express Zone - A Wing, Western Express Highway, Malad (East),
Mumbai - 400097, India
BOARD LINE: +91 22 6281 7000
All Investment are subject to Market Risk.
Please read the risk factors before investing in the same.
Past Performance is not necessarily indicative of likely future performance
Specific Disclaimer
Registration Details
Name : Vinod VayaTel : 022 – 6281 3851Email ID : [email protected]
Product Support
Name : Sheetal Kotian / Preeti More Tel : 022 – 4047 7135 / 7193Email ID : [email protected]
Back Office Support
Private & Confidential
Disclaimer: Disclaimer: Anand Rathi Advisors ltd (ARAL) ("Portfolio Manager") SEBI Reg No. INP000000282 which is regulatedunder SEBI. This report has been issued by ARAL. Investments in securities are subject to market and other risks and there is noassurance or guarantee that the investment objectives of any of the investment approaches or portfolios offered by the PortfolioManager (each, a "Portfolio") will be achieved. Portfolio performance may be affected by a wide variety of factors, including, withoutlimitation, security-specific price shifts, changes in general market conditions and/or other micro and macro factors. A Portfolioperformance results at any particular time will also be impacted by its investment objectives and the investment strategy it uses toachieve those objectives, including without limitation, its then-current asset allocation position. As the price/value of the underlyingassets of a Portfolio fluctuates, the value of investors investments in that Portfolio and any income derived from it may go up or down.Individual returns of an investor for a particular Portfolio may also vary because of factors such as timings of entry and exit timings ofadditional flows and redemptions, individual investor mandate, specific Portfolio construction characteristics and/or structuralparameters. Please refer to the Disclosure Document and Portfolio Management Services Agreement for Portfolio-specific, riskfactors. Note that the composition of a Portfolio and the index(es) used to benchmark its performance are subject to change fromtime to time, as may be more fully described in the Disclosure Document. Note also that the composite benchmarks used for thePortfolios may be proprietary to the Portfolio Manager.
ARAL and its affiliates may trade for their own accounts as market maker / jobber and/or arbitrageur in any securities of this issuer(s)or in related investments, and may be on the opposite side of public orders. ARAL, its affiliates, directors, officers, and employeesmay have a long or short position in any securities of this issuer(s) or in related investments. ARAL or its affiliates may from time totime perform investment banking or other services for, or solicit investment banking or other business from, any entity mentioned inthis report. This is prepared for only private circulation. It does not have regard to the specific investment objectives, financialsituation and the particular needs of any specific person who may receive this report.
Past performance of a Portfolio does not indicate its future performance. The Portfolio Manager does not guarantee that any Portfoliowill generate positive returns or that it will meet the needs/investment objectives of any particular person. The names of the Portfoliosdo not in any manner indicate their prospects or likelihood of returns. Before making an investment decision, please(1) carefullyreview the Disclosure Document, Portfolio Management Services Agreement, and other related documents, including issuedocuments pertaining to the underlying investments of the relevant Portfolio(s), and (2)consult your legal, tax and financial advisors todetermine possible legal, tax and financial or any other consequences of investing in any of the Portfolios.
Investors are also advised to refer to the risk factors associated with Portfolio Management Services and read the DisclosureDocument carefully and consult their Financial Advisor before taking decisions of investment.
For detailed risk factor, please refer to Disclosure Document before investing.