28, 2017 joint legislative budget committee … phil ting, chair assembly budget committee honorable...
TRANSCRIPT

Honorable Phil Ting, Chair Assembly Budget Committee
Honorable Lorena Gonzalez, Chair Assembly Appropriations Committee
September 28, 2017
Honorable Holly Mitchell, Chair Joint Legislative Budget Committee Senate Budget and Fiscal Review Committee
Honorable Ricardo Lara, Chair Senate Appropriations Committee
SUPPLEMENTAL PENSION PAYMENT REPORT
Pursuant to Chapter 50, Statutes of 2017 (SB 84), the Department of Finance respectfully submits the following report.
The report provides an analysis of the supplemental pension payment to the California Public Employees’ Retirement System in 2017-18, including discussion of the following:
The economic benefits and risks associated with making the cash loan Cost-allocation methodology of the loan repayment Structure of the loan repayment schedule, and mechanisms available to adjust it The actuarial impact on the contribution rates for each of the five state member plans
receiving the supplementary pension payment
If you have any questions or need additional information regarding this matter, please call Evelyn Suess, Principal Program Budget Analyst, at (916) 445-3274.
MICHAEL COHEN Director By:
AMY M. COSTA Chief Deputy Director
Attachment
cc: On following page
/s/ Amy M. Costa
-2-
cc: Honorable Jim Nielsen, Vice Chair, Senate Budget and Fiscal Review Committee Honorable Jay Obernolte, Vice Chair, Assembly Budget Committee Mr. Mac Taylor, Legislative Analyst (4) Mr. Mark Ibele, Staff Director, Senate Budget and Fiscal Review Committee Mr. Mark McKenzie, Staff Director, Senate Appropriations Committee Mr. Kirk Feely, Budget Fiscal Director, Senate Republican Fiscal Office Mr. Craig Cornett, Senate President pro Tempore's Office (2) Mr. Christian Griffith, Chief Consultant, Assembly Budget Committee Mr. Pedro R. Reyes, Chief Consultant, Assembly Appropriations Committee Mr. Eric Swanson, Staff Director, Assembly Republican Fiscal Committee Mr. Seren Taylor, Director of Strategic Policy, Assembly Republican Leader’s OfficeMr. Christopher W. Woods, Assembly Speaker’s Office (2)Honorable John Chiang, State Treasurer, California State Treasurer’s OfficeMs. Marcie Frost, Chief Executive Officer, California Public Employees’ Retirement SystemMr. Scott Terando, Chief Actuary, California Public Employees’ Retirement System

Supplemental Pension Payment Report
1t2TZCG62
Supplemental Pension Payment Report
IntroductionAs of June 30, 2016, the California Public Employees’ Retirement System (CalPERS) state plans have an aggregate funded status of 65.1 percent, and an aggregate unfunded liability of $59.5 billion. In December 2016, the CalPERS Board of Administration adopted a reduced assumed rate of investment return (or discount rate), which is 7 percent1 starting in fiscal year 2019-20 when it is fully phased-in, from the previous 7.5 percent. The decrease in discount rate results in an increase to the state’s unfunded pension liabilities requiring additional contributions in future years. For 2017-18, the state’s contribution to CalPERS is estimated at $5.8 billion ($3.4 billion General Fund). If no action is taken by the state, this amount is estimated to reach $9.2 billion ($5.3 billion General Fund) by 2023-24 due to the decrease in the discount rate and other factors. Pursuant to Chapter 50, Statutes of 2017 (SB 84), the Legislature approved a one-time additional payment to CalPERS in 2017-18 to help lower and stabilize the state’s contributions.
The Department of Finance respectfully submits this report in compliance with the reporting requirement under SB 84. This report provides an analysis of the supplemental pension payment in 2017-18, including discussion of the following:
• The economic benefits and risks associated with making the cash loan.
• Cost-allocation methodology of the loan repayment.
• Structure of the loan repayment schedule, and mechanisms available to adjust it.
• The actuarial impact on the contribution rates for each of the five state member plans receiving the supplementary pension payment.
1 CalPERS’ assumed rates of return will be phased in as follows: July 1, 2017: 7.375 percent; July 1, 2018: 7.25 percent, and July 1, 2019: 7 percent.

Supplemental Pension Payment Report
2t2TZCG62
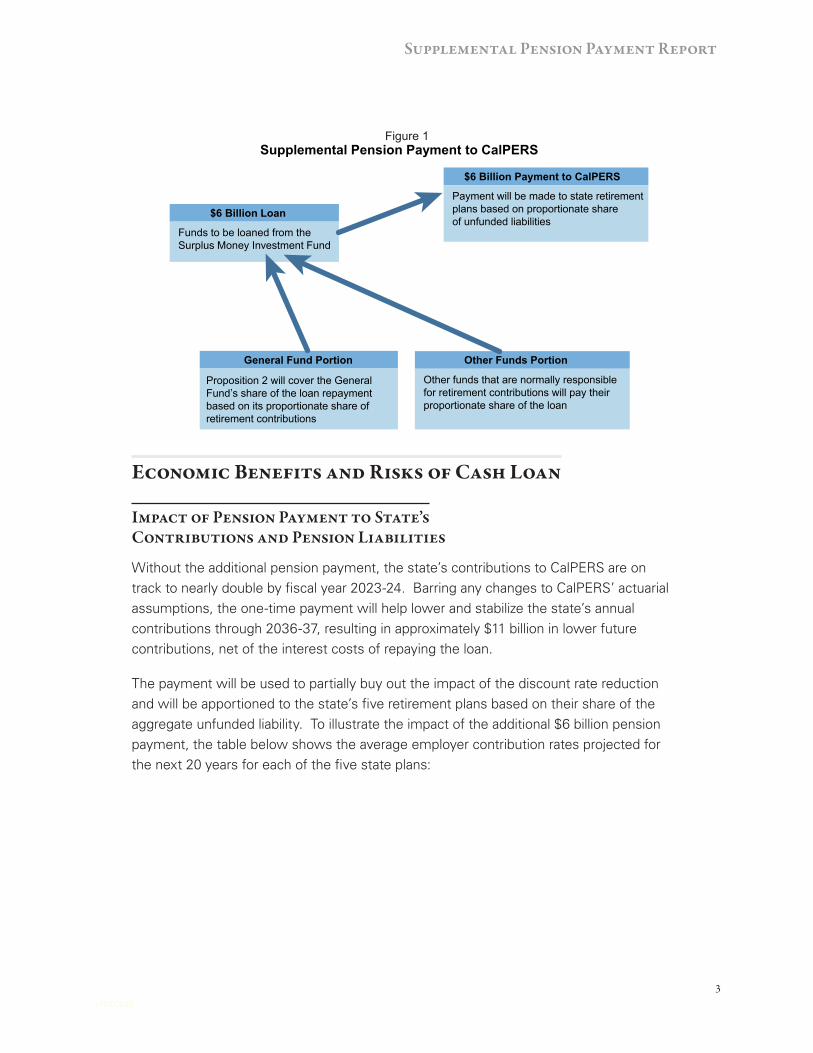
SB 84 Supplemental Pension PaymentSB 84 authorized a one-time $6 billion supplemental pension payment in 2017-18 to CalPERS, in addition to the actuarially determined annual contribution, which is to be apportioned to the five state retirement plans based on their share of the aggregate unfunded liability.2 The supplemental pension payment will be funded through a cash loan from the Surplus Money Investment Fund (SMIF)3 and other state funds that accrue interest to the General Fund, which will be paid back by June 30, 2030, through the General Fund and other funds responsible for retirement contributions for the state’s plans. SB 84 also requires quarterly interest payments on the outstanding loan balance to be made, starting in 2017-18 through the duration of the repayment of the loan. The interest rate is valued at the quarter-to-date yield at the two-year constant maturity U.S. Treasury rate. The General Fund’s share of the loan will be repaid using available Proposition 2 debt repayment funds. Refer to the Figure 1 flowchart.
Proposition 2 was an initiative passed by voters in 2014 that amended the State Constitution related to General Fund rainy day funds and debt payment. Proposition 2 requires 1.5 percent of General Fund revenues, in addition to capital gains revenues over 8 percent of General Fund taxes (net of the amount that would go to Proposition 98), to be set aside by the state. Of the total amount set aside, half must be allocated to pay down qualified debt payments through fiscal year 2029-30. Debts eligible for Proposition 2 debt repayment funds include pension and retiree healthcare liabilities “in excess of the base amounts scheduled” and past budgetary borrowings. The other half of the General Fund revenue set aside is allocated to the Budget Stabilization Account to build a rainy-day reserve. SB 84 clarified that the repayment of the General Fund share of the cash loan meets the eligibility requirements for Proposition 2 debt repayment funding. The amount of Proposition 2 funding that will be available each year to cover the General Fund’s portion of the loan repayment will be determined by (1) the amount of revenue that is calculated that year for Proposition 2 debt payment, and (2) the prioritization of the loan repayment, as compared to other outstanding debts that qualify for Proposition 2 funds.
2 SB 84 directs $3.6 billion to the State Miscellaneous category, $100 million to the State Industrial category, $300 million to the State Safety category, $1.5 billion to the State Peace Officer/Firefighter category, and $500 million to the Patrol category.3 A state fund managed by the State Treasurer’s Office as part of the Pooled Money Investment Account to invest excess cash from funds held by state departments. It does not include any deposit by the local governments. Deposits of the local governments are segregated and accounted for under the Local Agency Investment Fund.
Supplemental Pension Payment Report
3t2TZCG62
Figure 1
$6 Billion Loan
Funds to be loaned from the Surplus Money Investment Fund
General Fund Portion
Proposition 2 will cover the General Fund’s share of the loan repayment based on its proportionate share of retirement contributions
Other Funds Portion
Other funds that are normally responsible for retirement contributions will pay their proportionate share of the loan
$6 Billion Payment to CalPERS
Payment will be made to state retirement plans based on proportionate share of unfunded liabilities
Supplemental Pension Payment to CalPERS
Economic Benefits and Risks of Cash Loan
Impact of Pension Payment to State’s Contributions and Pension Liabilities
Without the additional pension payment, the state’s contributions to CalPERS are on track to nearly double by fiscal year 2023-24. Barring any changes to CalPERS’ actuarial assumptions, the one-time payment will help lower and stabilize the state’s annual contributions through 2036-37, resulting in approximately $11 billion in lower future contributions, net of the interest costs of repaying the loan.
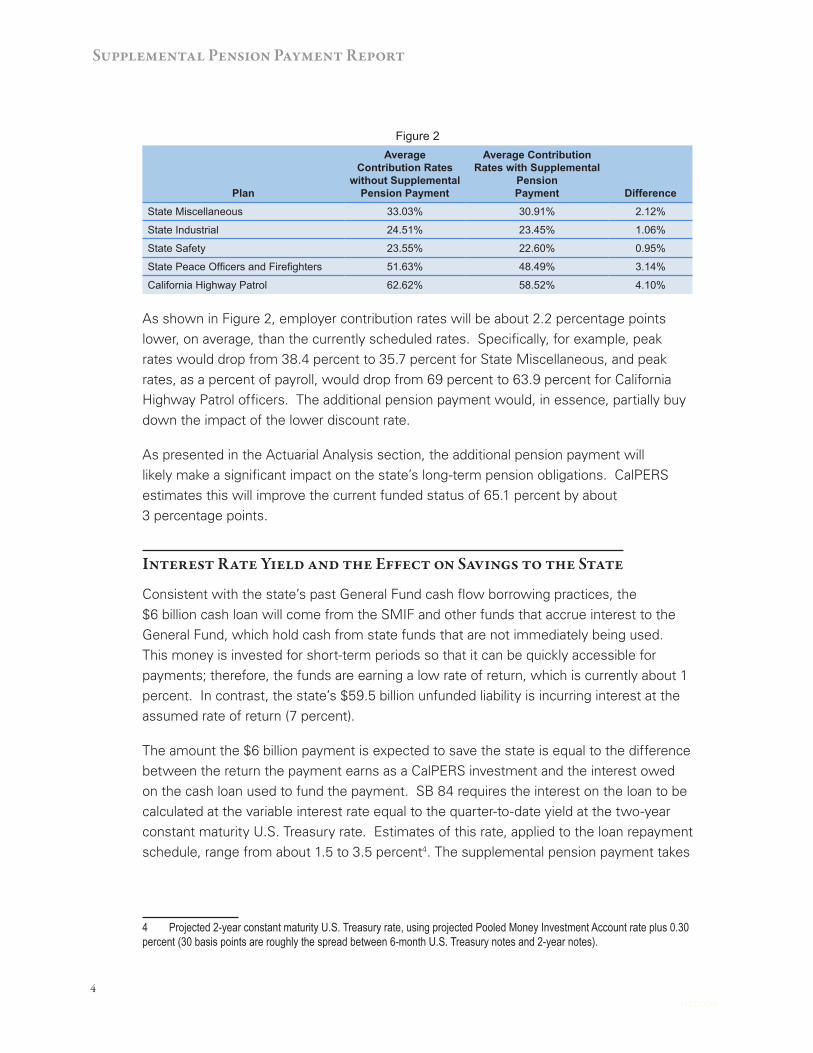
The payment will be used to partially buy out the impact of the discount rate reduction and will be apportioned to the state’s five retirement plans based on their share of the aggregate unfunded liability. To illustrate the impact of the additional $6 billion pension payment, the table below shows the average employer contribution rates projected for the next 20 years for each of the five state plans:
Supplemental Pension Payment Report
4t2TZCG62
Figure 2
Plan
AverageContribution Rates
without Supplemental Pension Payment
Average Contribution Rates with Supplemental
Pension Payment Difference
State Miscellaneous 33.03% 30.91% 2.12%
State Industrial 24.51% 23.45% 1.06%
State Safety 23.55% 22.60% 0.95%
State Peace Officers and Firefighters 51.63% 48.49% 3.14%
California Highway Patrol 62.62% 58.52% 4.10%
As shown in Figure 2, employer contribution rates will be about 2.2 percentage points lower, on average, than the currently scheduled rates. Specifically, for example, peak rates would drop from 38.4 percent to 35.7 percent for State Miscellaneous, and peak rates, as a percent of payroll, would drop from 69 percent to 63.9 percent for California Highway Patrol officers. The additional pension payment would, in essence, partially buy down the impact of the lower discount rate.
As presented in the Actuarial Analysis section, the additional pension payment will likely make a significant impact on the state’s long-term pension obligations. CalPERS estimates this will improve the current funded status of 65.1 percent by about 3 percentage points.
Interest Rate Yield and the Effect on Savings to the State
Consistent with the state’s past General Fund cash flow borrowing practices, the $6 billion cash loan will come from the SMIF and other funds that accrue interest to the General Fund, which hold cash from state funds that are not immediately being used. This money is invested for short-term periods so that it can be quickly accessible for payments; therefore, the funds are earning a low rate of return, which is currently about 1 percent. In contrast, the state’s $59.5 billion unfunded liability is incurring interest at the assumed rate of return (7 percent).
The amount the $6 billion payment is expected to save the state is equal to the difference between the return the payment earns as a CalPERS investment and the interest owed on the cash loan used to fund the payment. SB 84 requires the interest on the loan to be calculated at the variable interest rate equal to the quarter-to-date yield at the two-year constant maturity U.S. Treasury rate. Estimates of this rate, applied to the loan repayment schedule, range from about 1.5 to 3.5 percent4. The supplemental pension payment takes
4 Projected 2-year constant maturity U.S. Treasury rate, using projected Pooled Money Investment Account rate plus 0.30 percent (30 basis points are roughly the spread between 6-month U.S. Treasury notes and 2-year notes).

Supplemental Pension Payment Report
5t2TZCG62
advantage of the significant amount of available cash reserves that can earn the state much more in an actively-invested, long-term portfolio, such as CalPERS, rather than in the SMIF.
As the benefits of this payment are determined using estimates, some of the risks depend on the actual rates of return. If CalPERS earns, in the long-term, a lower return than the system assumes it will, or if the actual U.S. Treasury rate exceeds the projected growth rate, realized savings will fall short of estimated savings. For instance, as presented in Appendix A under the Stochastic Model, the conservative average return for the five state plans over a 20-year period was 6.25 percent. Using this model, CalPERS estimates that the payment will save the state $9.2 billion in future retirement contributions to the CalPERS state plans, net of the interest costs of repaying the loan. As shown in Appendix B, the projected U.S. Treasury rates used in the loan repayment schedule are well below the long-term returns expected by CalPERS; as such, it is highly likely that the payment will result in savings.
For reference, the table below details CalPERS’ time-weighted average investment returns over the recent 3-, 5-, 10-, and 20-year periods as of June 30, 2017:
PeriodTime-Weighted Average
Investment Return5
3 Years 4.6%
5 Years 8.8%
10 Years 4.4%
20 Years 6.6%
Effect of Pension Loan on General Fund Cash Management
The state has a long history of using excess funds to manage the greater cash flow needs of the General Fund by borrowing among the state funds that make up the SMIF and other funds that accrue interest to the General Fund, which is a cost-effective way to utilize cash reserves. The magnitude of borrowing for the supplemental pension payment will reduce the overall available internal borrowable resources for the state’s General Fund cash management purposes; however, the state is in a healthy cash position and can afford a $6 billion cash loan to make the supplemental pension payment.
5 CalPERS Newsletter, July 14, 2017. The 3-year time-weighted average return is not cited in the newsletter, but was provided separately by CalPERS.
Supplemental Pension Payment Report
6t2TZCG62
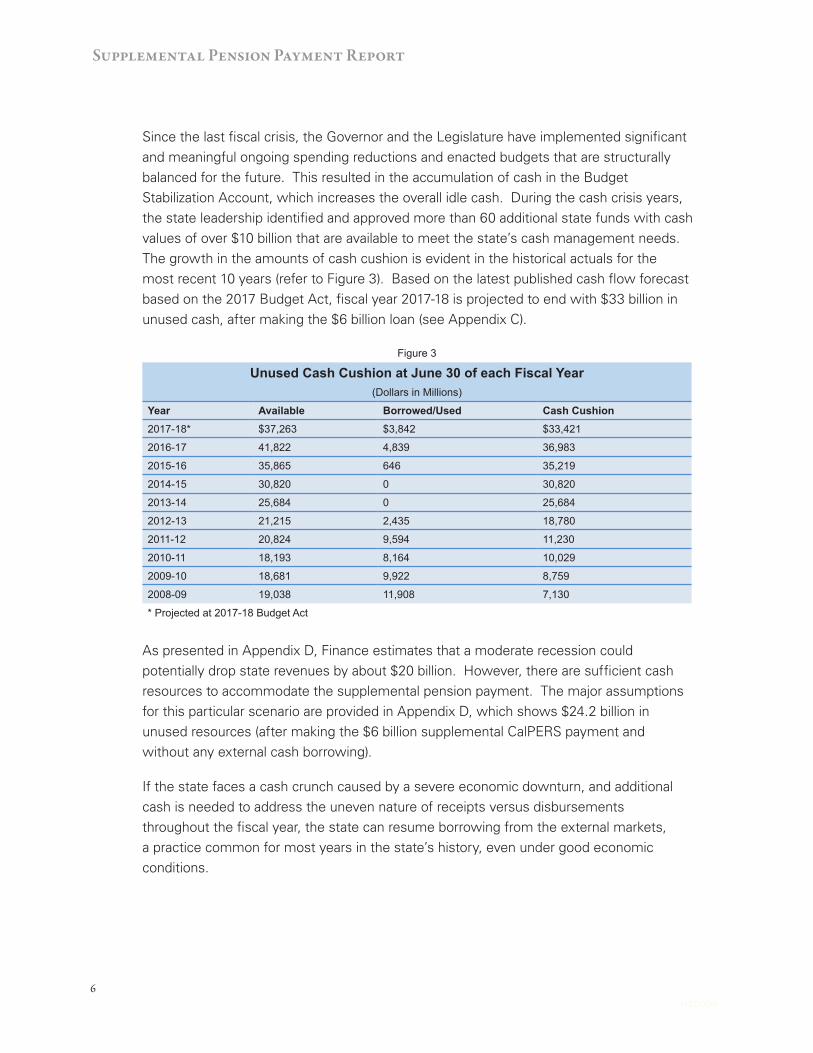
Since the last fiscal crisis, the Governor and the Legislature have implemented significant and meaningful ongoing spending reductions and enacted budgets that are structurally balanced for the future. This resulted in the accumulation of cash in the Budget Stabilization Account, which increases the overall idle cash. During the cash crisis years, the state leadership identified and approved more than 60 additional state funds with cash values of over $10 billion that are available to meet the state’s cash management needs. The growth in the amounts of cash cushion is evident in the historical actuals for the most recent 10 years (refer to Figure 3). Based on the latest published cash flow forecast based on the 2017 Budget Act, fiscal year 2017-18 is projected to end with $33 billion in unused cash, after making the $6 billion loan (see Appendix C).
Figure 3
Unused Cash Cushion at June 30 of each Fiscal Year(Dollars in Millions)
Year Available Borrowed/Used Cash Cushion2017-18* $37,263 $3,842 $33,421
2016-17 41,822 4,839 36,983
2015-16 35,865 646 35,219
2014-15 30,820 0 30,820
2013-14 25,684 0 25,684
2012-13 21,215 2,435 18,780
2011-12 20,824 9,594 11,230
2010-11 18,193 8,164 10,029
2009-10 18,681 9,922 8,759
2008-09 19,038 11,908 7,130
* Projected at 2017-18 Budget Act
As presented in Appendix D, Finance estimates that a moderate recession could potentially drop state revenues by about $20 billion. However, there are sufficient cash resources to accommodate the supplemental pension payment. The major assumptions for this particular scenario are provided in Appendix D, which shows $24.2 billion in unused resources (after making the $6 billion supplemental CalPERS payment and without any external cash borrowing).
If the state faces a cash crunch caused by a severe economic downturn, and additional cash is needed to address the uneven nature of receipts versus disbursements throughout the fiscal year, the state can resume borrowing from the external markets, a practice common for most years in the state’s history, even under good economic conditions.

Supplemental Pension Payment Report
7t2TZCG62
Revenue Anticipation Notes (RANs) (external cash borrowing) remain an effective and affordable cash tool to help meet the state’s cash needs. Over the last 30 plus years, RANs were issued every single year except for one year until 2015-16. Since 2015-16, the state’s liquidity balance has been high and RANs have not been needed. Additionally, the state has other cash tools that can be used to help manage cash needs, such as statutorily deferring payments and designating additional funds as borrowable, and in a worst-case scenario, delaying payments, issuing registered warrants, or issuing revenue anticipation warrants to preserve enough cash to meet the priority obligations of the General Fund.
Lastly, Moody’s and Fitch (rating agencies that assess the creditworthiness of the state and its long-term debt) have viewed the additional pension payment positively because it reduces long-term unfunded pension liabilities at a faster rate. In a June 2017 report, Moody’s referred to the additional pension payment as a “credit positive development.”6 Similarly, in July 2017, Fitch viewed “California as being well positioned to realize the plan’s goals,” and added that the additional pension payment “poses relatively little risk to overall state liquidity.”7
To mitigate the impact on the state’s cash flow needs, the additional $6 billion contribution to CalPERS is planned to be made in three installments; $2 billion on October 31, 2017, January 16, 2018, and April 17, 2018. Installment payments will also
reduce the risk of market fluctuations.
Repayment of SMIF Loan by General Fund and Other Funds
According to the State Controller’s Office, there are more than 400 unique state funds that currently make retirement contributions to the CalPERS state plans. The ability of these funds to support the loan repayments in addition to annual contributions should not be overly burdensome.
To help put the $6 billion loan into context, the loan repayments represent only a fraction of the annual retirement contributions these funds already pay. For instance, the total retirement contributions for funds other than the General Fund is estimated to be approximately $2.7 billion in 2018-19, assuming the supplemental payment is not made. With the supplemental payment, Finance estimates that contributions from non-General Fund sources will decrease by approximately $90 million in 2018-19. As shown
6 California – Improved Liquidity Position Enables More Aggressive Fiscal 2018 Pension Payment. Issuer Comment. Moody’s Investor Service. June 12 2017.7 Fitch Focus on Munis: Pensions, State Use Financial Engineering to Lower Contributions. Fitch Ratings. July 31 2017.
Supplemental Pension Payment Report
8t2TZCG62
in Appendix B, the loan repayment that these same funds are to be assessed in fiscal year 2018-19 is roughly $220 million—a net increase of about $130 million, or less than 5 percent of the total annual contribution by those funds. Put another way, the net increase is less than one month of retirement contribution payments. Though non-General Fund sources may experience slightly higher pension costs during the loan repayment period, the savings in future contribution rates will continue for 20 years, benefitting the public services that are supported by those funds.
Given the reduction of contribution rates, we believe the repayment can be absorbed by those funds. In the event a fund cannot absorb the repayment in any given year, SB 84 allows Finance to ensure the proportionate share is paid over the life of the loan, not necessarily in a given year. In the extreme case that a fund is depleted, Finance may need to consider allocating the costs to other allowable funds used by the affected departments or other options. In that case, it is likely the fund would have been depleted due to other factors.
SB 84 provides the flexibility needed to account for these circumstances. As previously stated, Proposition 2 debt repayment funding will be used to pay the General Fund’s portion of the loan. Therefore, this would require that Proposition 2 debt payment funds are allocated for this purpose until the loan is paid off. SB 84 also authorized Finance to direct the Controller to advance from the General Fund, other funds’ portion of the repayment of the loan principal or payment interest, to be repaid to the General Fund at a later date. Similar to other funds, the General Fund must repay its proportionate share over the life of the loan, not necessarily in a given year.
Cost-Allocation Methodology of Loan RepaymentPursuant to SB 84, the cash loan will be repaid by all state funds responsible for retirement contributions. Finance will allocate loan repayments to the responsible funds as a percentage of total current retirement contributions that each fund makes. The percentage split among all the funds will be calculated according to payroll data provided by the State Controller’s Office. The pension contribution funding split will be revisited annually during development of the Governor’s Budget to reflect the current percentage split among the funds and the loan repayment amounts owed by each fund. As of June 2017, the General Fund made 49.1 percent of total retirement contributions, while other funds made 50.9 percent of total retirement contributions.

Supplemental Pension Payment Report
9t2TZCG62
Structure and Mechanics of the Loan Repayment ScheduleBased on the current loan repayment schedule in Appendix B, Finance projects the loan will be fully repaid in fiscal year 2024-25 and will incur an estimated $1 billion in interest payments. Of the total loan repayment (approximately $7 billion), the General Fund will be responsible for an estimated $3.4 billion or 49.1 percent of the total loan repayment, while other funds will be responsible for the remaining $3.6 billion or 50.9 percent. Refer to Appendix B for a display of a projected loan repayment schedule.
Finance has determined a transfer schedule of the $6 billion from the SMIF to CalPERS. Three transfers of $2 billion each are expected to be made on October 31, 2017,
January 16, 2018, and April 17, 2018. Quarterly interest payments in fiscal year 2017-18 will be calculated on the portion of the loan that has been drawn down. Once the loan amount has been fully transferred, interest payments will be calculated using the outstanding loan amount. The schedule assumes that principal payments will be made after the end of the year once all required quarterly interest payments are known.
This will allow time to calculate required interest payments first, in order to assess remaining funds available to pay down the principal.
The structure of the loan repayment schedule relies on the interest payments that must be made quarterly on the outstanding balance of the loan. As previously stated, Finance estimates the interest rate to range from about 1.5 to 3.5 percent. According to the Congressional Budget Office, interest rates on federal borrowing will also rise gradually over the next few years.8 The interest rate on 3-month Treasury bills is projected to rise from 0.4 percent in the fourth quarter of 2016 to 2.5 percent by the end of 2020. Over the same period, the interest rate on 10-year Treasury notes is projected to rise from its average of 2.1 percent in the fourth quarter of 2016 to 3.2 percent in 2020. Two-year rates can be expected to fall between the shorter- and longer-term rates. Refer to Appendix E for historic U.S. Treasury two-year constant maturity rates.
Finance’s estimates were created by taking the projected Pooled Money Investment Account (PMIA) rate, which is tied to the six-month U.S. Treasury note, and adding 30 basis points. Thirty basis points is roughly the spread between six-month U.S. Treasury notes and two-year notes.
8 Gamber, Edward, Projections of Interest Rates, https://www.cbo.gov/publication/52391, Congressional Budget Office, February 1, 2017.

Supplemental Pension Payment Report
10t2TZCG62
The Proposition 2 debt repayment funds, used to repay the General Fund’s proportionate share of the loan, for fiscal years 2017-18 through 2020-21, are estimates projected as of the 2017 Budget Act. The Proposition 2 funds for fiscal years 2021-22 through 2023-24 are Finance estimates, and the Proposition 2 funds for fiscal year 2024-25 equal the final payment required to fully repay the General Fund’s share of the loan.
The amount of Proposition 2 funds that the General Fund will use to repay its share of the loan each year will determine the proportionate amount the other funds will pay that year. As noted earlier, the General Fund is currently responsible for 49.1 percent, and the other funds are responsible for 50.9 percent, of the loan repayment. For example, in fiscal year 2018-19, an estimated $195 million in Proposition 2 funds will be available to pay the General Fund’s share of the loan repayment. The estimated $195 million would represent 49.1 percent of the total loan repayment in 2018-19, and the other funds will be assessed approximately $224 million to cover the remaining 50.9 percent of the total loan repayment that year.
To maximize accuracy, the loan repayment schedule will be revised each time the following occurs:
• the actual interest rate is calculated,
• projected interest rates are updated,
• the State Controller’s Office provides new payroll data to calculate the current percentage split by fund of the loan repayment,
• new estimates are determined for Proposition 2 debt repayment funds available to repay the General Fund’s portion of the loan, or
• the General Fund makes an advanced payment on behalf of other funds that the other funds must repay to the General Fund at a later date (as authorized by SB 84).
As required by SB 84, Finance will develop and maintain a mechanism that tracks both the obligation and the payment made by each fund for each fiscal year. Finance will direct the Controller to transfer the applicable loan repayment amounts from each of the funds pursuant to the loan repayment schedule. Finance will maintain a spreadsheet to track the actual payments made by each of the funds to ensure each fund pays its proportionate share of the loan’s principal and interest payment by the end of the loan term.

Supplemental Pension Payment Report
11t2TZCG62
Mechanisms to Adjust the Repayment ScheduleSB 84 authorized Finance to direct the State Controller’s Office to advance from the General Fund the portion of the loan repayment for which other funds are responsible. An advance payment would be authorized in the event that any of the other responsible funds has an insufficient balance to make the assessed loan repayment at that time. SB 84 allows repayment from other funds to the General Fund, for any advanced payments, to be made by the loan repayment deadline of June 30, 2030.
Due to the timing issues related to establishing the administrative mechanics, loan repayment will not begin for other funds until fiscal year 2018-19. In fiscal year 2017-18, the only payments are from the General Fund.
To assess whether each of the other funds has a sufficient balance to make annual loan repayments, Finance will conduct an annual review of those funds and notify each fund administrator of the responsible fund’s assessed loan repayment for the upcoming fiscal year (budget year). The fund administrator must inform Finance of the fund’s ability to make the assessed payment; if the fund cannot make the payment, the General Fund will make the payment on behalf of that fund. The outstanding balance the fund incurs on this advanced payment will be paid back to the General Fund by the loan repayment deadline.
In the event the General Fund is unable to repay its share of the loan, due to poor revenues or other negative economic scenario, the loan repayment schedule—currently projected to be eight years—can be extended to the statutory deadline of 13 years or June 30, 2030.
Actuarial AnalysisTo further determine the estimated impact of the supplemental pension payment, Finance requested the CalPERS Actuarial Office to demonstrate the impact of the additional $6 billion payment on the state’s contributions over the next 20 years by using different investment scenarios. Four of those scenarios are included in this report.
The first scenario uses CalPERS’ assumed rate of investment return, which is considered the Baseline Projection that Finance projects to estimate savings. The CalPERS Board of Administration recently adopted a reduced assumed rate of investment return, which is 7 percent starting in fiscal year 2019-20 when it is fully phased in.

Supplemental Pension Payment Report
12t2TZCG62
The second scenario is a Stochastic Simulation Model, which takes 1,000 random simulations of 20 years of varying investment returns to estimate savings. The third scenario takes actual investment returns from the past 20 years, and applies them to 20 years going forward, in order to estimate the savings the supplemental pension payment will provide if future returns mimic the returns from the last 20 years. The final scenario is an alternate projection that applies a more conservative assumed rate of investment return, 6.5 percent, to estimate savings. Below is a summary table of the savings estimated for each of the four investment scenarios:
Model
Assumed Investment
ReturnContribution Rate Savings
Loan Interest Rates*
Interest Cost*
Principal Payment Net Savings
Baseline Projection 7.0% $11.82 billion
1.5% to 3.5%
$979 million $6 billion
$4.84 billion
Stochastic Simulation
5.75% (10-year)6.25% (20-year) $10.21 billion $3.23 billion
Historical Returns – Last 20 Years Varies $7.14 billion $161 million
Alternate Projection – 6.5 % Investment Return
6.5% $11.03 billion $4.05 billion
*Based on Finance’s projected interest rates – see Appendix B.
See Appendix A for more detailed information on the actuarial analysis conducted by CalPERS on the impact of the additional payment on the state’s retirement contributions.
ConclusionThe circumstances surrounding the cash loan for the supplemental pension payment indicate significant savings to the state and that the state is capable of successfully executing the loan repayment schedule. It is expected that any deviation from assumed CalPERS returns, or projected U.S. Treasury rates, will still result in significant net savings, and that any issues with funds’ ability to repay its share of the loan can be absorbed by the repayment schedule and effectively resolved.
It is important to note that the state is responsible for its unfunded pension liability, regardless of this supplemental pension payment. The payment was proposed as a solution to reduce the growing fiscal pressures on the state, by taking advantage of

Supplemental Pension Payment Report
13t2TZCG62
available excess reserves in a responsible manner. The budgetary burden borne by repaying the SMIF loan represents a small portion of the overall burden that the state will take on absent any action to address the growing unfunded pension liability.

This page intentionally blank to facilitate double-sided printing.

Appendices
A1 t2TZCG62
AppendicesAppendix A Actuarial Analysis: Estimated Impact on Contribution RatesTo project the estimated impact of the state’s supplemental pension payment pursuant to Chapter 50, Statutes of 2017 (SB 84), the Department of Finance requested the CalPERS Actuarial Office demonstrate the potential savings of the supplemental pension payment over the next 20 years under various investment return scenarios.
The following projections are based on the state valuation results at June 30, 2016, and reflect the impact on state employer contributions due to the lowering of the discount rate from the current assumption of 7.375 percent at June 30, 2016, to 7.25 percent at June 30, 2017, and then finally to 7.00 percent at June 30, 2018.
In the following tables, total contributions under the current plan represent the sum of each state plan’s unfunded liability contributions over the next 20 years, plus a final contribution/credit based on the projected funded position of the state plan at the end of the 20-year period.
Total contributions under the SB 84 supplemental pension payment plan column represent the sum of each state plan’s unfunded liability contributions over the 20 years following the transfer of the supplemental pension payment to CalPERS, plus a final contribution/credit based on the projected funded position of the state plan at the end of the 20-year period. The average rate represents the average employer contribution rate over the 20-year period, which is the sum of the employer normal cost contribution rate plus the employer unfunded liability contribution rate under each investment scenario. Total contributions under SB 84 do not account for the principal or interest cost the state will incur to repay the loan used to fund the supplemental pension payment.
Savings represent the difference between the total contributions estimated under the current plan, and the impact of the supplemental pension payment plan. In the last columns under savings, the average rate equals the difference between the average rate estimated under the current plan, and the supplemental pension payment plan.

Appendices
A2t2TZCG62
Baseline Projection
This compares the current plan with the supplemental pension payment plan under SB 84 using the expected investment returns of 7.375 percent, 7.25 percent and then 7.00 percent for the remainder of the next 20 years from the valuation date of June 30, 2016. The projections do not reflect the actual investment return of 11.2 percent for the fiscal year ending June 30, 2017.
Current Plan SB 84 Savings
State Plan
Total Contributions
Average Rate
Total Contributions
Average Rate
Total Contributions
Average Rate
Miscellaneous $80.356B 33.03% $73.220B 30.91% $7.136B 2.12%
Industrial $2.728B 24.51% $2.537B 23.45% $0.191B 1.06%
Safety $7.630B 23.55% $7.055B 22.60% $0.575B 0.95%
Peace Officers and Firefighters (POFF)
$36.388B 51.63% $33.481B 48.49% $2.907B 3.14%
California Highway Patrol (CHP)
$11.008B 62.62% $9.999B 58.52% $1.009B 4.10%
Totals $138.110B 35.95% $126.292B 33.71% $11.818B 2.23%

Appendices
A3 t2TZCG62
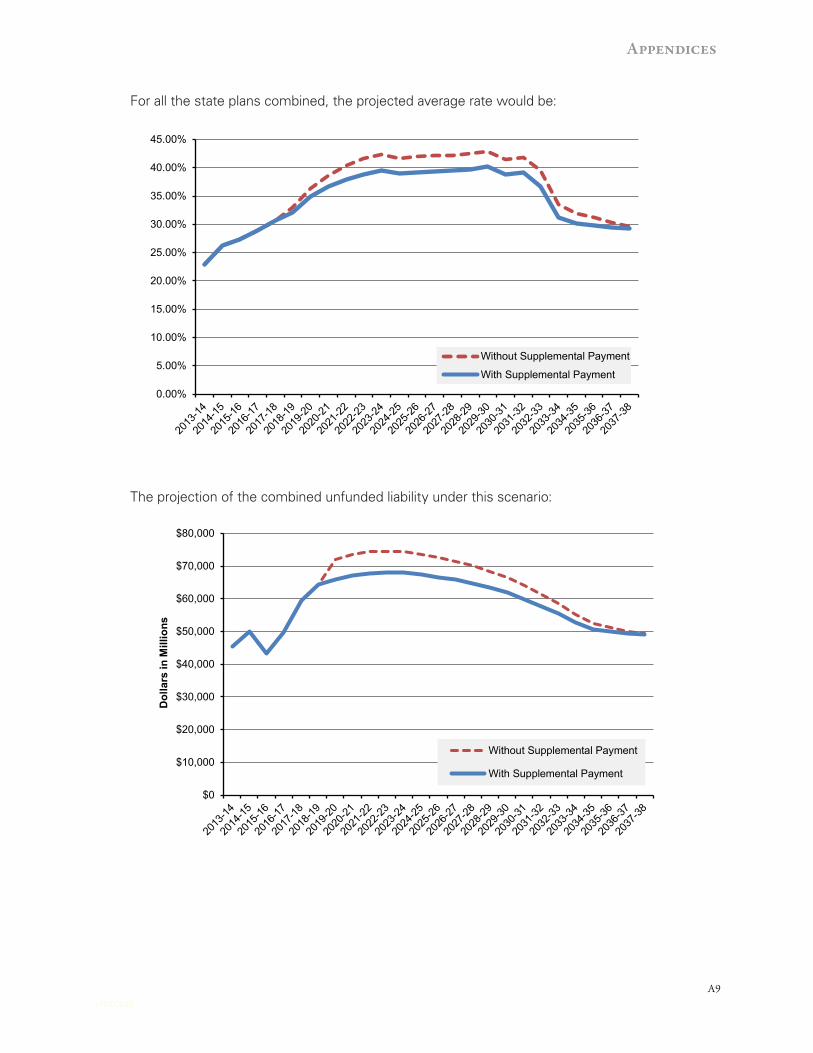
For all the state plans combined, the projected average rate would be:
0.00%
5.00%
10.00%
15.00%
20.00%
25.00%
30.00%
35.00%
40.00%
45.00%
Without Supplemental PaymentWith Supplemental Payment
The projection of the combined unfunded liability under this scenario:
$0
$10,000
$20,000
$30,000
$40,000
$50,000
$60,000
$70,000
$80,000
2013
-14
2014
-15
2015
-16
2016
-17
2017
-18
2018
-19
2019
-20
2020
-21
2021
-22
2022
-23
2023
-24
2024
-25
2025
-26
2026
-27
2027
-28
2028
-29
2029
-30
2030
-31
2031
-32
2032
-33
2033
-34
2034
-35
2035
-36
2036
-37
2037
-38
Dol
lars
in M
illio
ns
Without Supplemental PaymentWith Supplemental Payment
Appendices
A4t2TZCG62
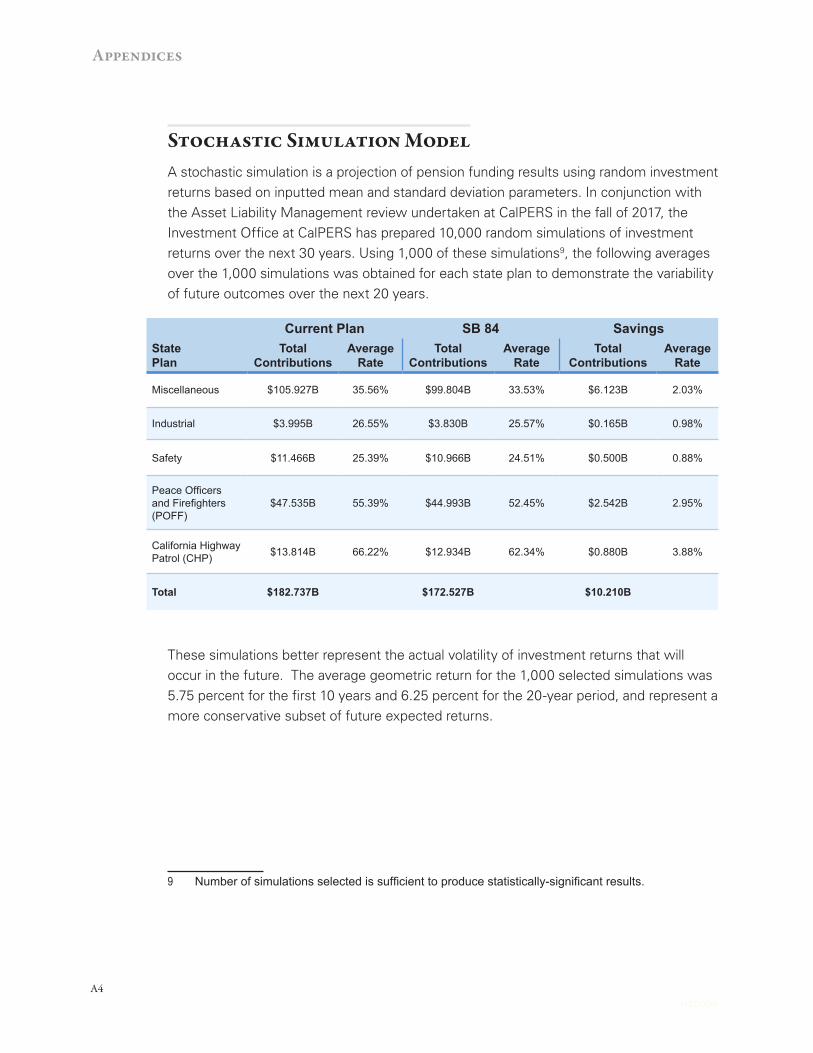
Stochastic Simulation ModelA stochastic simulation is a projection of pension funding results using random investment returns based on inputted mean and standard deviation parameters. In conjunction with the Asset Liability Management review undertaken at CalPERS in the fall of 2017, the Investment Office at CalPERS has prepared 10,000 random simulations of investment returns over the next 30 years. Using 1,000 of these simulations9, the following averages over the 1,000 simulations was obtained for each state plan to demonstrate the variability of future outcomes over the next 20 years.
Current Plan SB 84 SavingsState Plan
Total Contributions
Average Rate
Total Contributions
Average Rate
Total Contributions
Average Rate
Miscellaneous $105.927B 35.56% $99.804B 33.53% $6.123B 2.03%
Industrial $3.995B 26.55% $3.830B 25.57% $0.165B 0.98%
Safety $11.466B 25.39% $10.966B 24.51% $0.500B 0.88%
Peace Officers and Firefighters (POFF)
$47.535B 55.39% $44.993B 52.45% $2.542B 2.95%
California Highway Patrol (CHP) $13.814B 66.22% $12.934B 62.34% $0.880B 3.88%
Total $182.737B $172.527B $10.210B
These simulations better represent the actual volatility of investment returns that will occur in the future. The average geometric return for the 1,000 selected simulations was 5.75 percent for the first 10 years and 6.25 percent for the 20-year period, and represent a more conservative subset of future expected returns.
9 Number of simulations selected is sufficient to produce statistically-significant results.

Appendices
A5 t2TZCG62
For example, the projected Average Rates under one random scenario (out of a 1,000 simulations) would look as follows:
0.00%
5.00%
10.00%
15.00%
20.00%
25.00%
30.00%
35.00%
40.00%
45.00%
50.00%
Without Supplemental PaymentWith Supplemental Payment
The projection of combined unfunded liability under the same random scenario:
-$40,000
-$20,000
$0
$20,000
$40,000
$60,000
$80,000
$100,000
Dol
lars
in M
illio
ns
Without Supplemental PaymentWith Supplemental Payment
Appendices
A6t2TZCG62
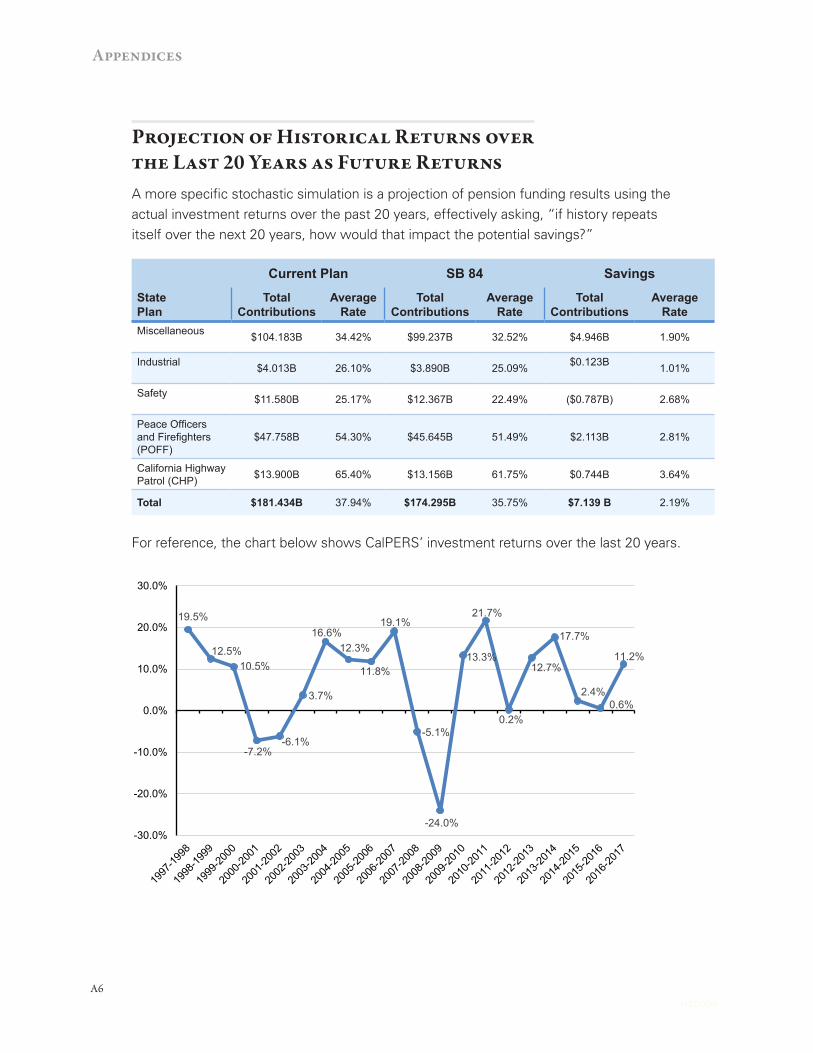
Projection of Historical Returns over the Last 20 Years as Future ReturnsA more specific stochastic simulation is a projection of pension funding results using the actual investment returns over the past 20 years, effectively asking, “if history repeats itself over the next 20 years, how would that impact the potential savings?”
Current Plan SB 84 Savings
State Plan
Total Contributions
Average Rate
Total Contributions
Average Rate
Total Contributions
Average Rate
Miscellaneous $104.183B 34.42% $99.237B 32.52% $4.946B 1.90%
Industrial $4.013B 26.10% $3.890B 25.09% $0.123B 1.01%
Safety $11.580B 25.17% $12.367B 22.49% ($0.787B) 2.68%
Peace Officers and Firefighters (POFF)
$47.758B 54.30% $45.645B 51.49% $2.113B 2.81%
California Highway Patrol (CHP) $13.900B 65.40% $13.156B 61.75% $0.744B 3.64%
Total $181.434B 37.94% $174.295B 35.75% $7.139 B 2.19%
For reference, the chart below shows CalPERS’ investment returns over the last 20 years.
19.5%
12.5%10.5%
-7.2%-6.1%
3.7%
16.6%12.3%
11.8%
19.1%
-5.1%
-24.0%
13.3%
21.7%
0.2%
12.7%
17.7%
2.4%0.6%
11.2%
-30.0%
-20.0%
-10.0%
0.0%
10.0%
20.0%
30.0%

Appendices
A7 t2TZCG62
For all the state plans combined, the projected average rates under this scenario:
0.00%
5.00%
10.00%
15.00%
20.00%
25.00%
30.00%
35.00%
40.00%
45.00%
50.00%
Without Supplemental Payment
With Supplemental Payment
The projection of the combined unfunded liability under this scenario:
$0
$20,000
$40,000
$60,000
$80,000
$100,000
$120,000
$140,000
Dol
lars
in M
illio
ns
Without Supplemental Payment
With Supplemental Payment

Appendices
A8t2TZCG62
Alternate Projection – 6.50 Percent Investment Return
This compares the current plan with the supplemental pension payment plan under SB 84, assuming slightly more conservative future annual investment returns of 6.50 percent.
Current Plan SB 84 SavingsState Plan
Total Contributions
Average Rate
Total Contributions
Average Rate
Total Contributions
Average Rate
Miscellaneous $104.565B 34.89% $97.898B 32.83% $6.667B 2.06%
Industrial $4.020B 26.14% $3.842B 25.11% $0.178B 1.03%
Safety $11.716B 25.04% $11.181B 24.11% $0.535B 0.93%
Peace Officers and Firefighters (POFF)
$47.830B 54.49% $45.123B 51.44% $2.707B 3.05%
California Highway Patrol (CHP)
$13.932B 65.56% $12.994B 61.57% $0.938B 3.99%
Total $182.063B 38.24% $171.038B 36.07% $11.025B 2.17%
Appendices
A9 t2TZCG62
For all the state plans combined, the projected average rate would be:
0.00%
5.00%
10.00%
15.00%
20.00%
25.00%
30.00%
35.00%
40.00%
45.00%
Without Supplemental Payment
With Supplemental Payment
The projection of the combined unfunded liability under this scenario:
$0
$10,000
$20,000
$30,000
$40,000
$50,000
$60,000
$70,000
$80,000
Dol
lars
in M
illio
ns
Without Supplemental Payment
With Supplemental Payment

Appendices
A10t2TZCG62
Appendix B
Fiscal Year
LoanBalance 1/
InterestRate2/
Interest Payment
Principal Payment 3/
Total Payment
2017-18 6,000,000 1.47 44,040 101,960 146,000
2018-19 5,898,040 2.12 124,920 293,850 418,770
2019-20 5,604,190 2.95 165,324 286,033 451,357
2020-21 5,318,157 3.41 181,509 554,981 736,489
2021-22 4,763,176 3.51 167,140 601,936 769,076
2022-23 4,161,240 3.51 146,018 1,179,066 1,325,084
2023-24 2,982,174 3.51 104,644 1,692,945 1,797,589
2024-25 1,289,229 3.51 45,239 1,289,229 1,334,468
Total 978,834 6,000,000 6,978,834
Fiscal Year 2017-185/ 2018-19 2019-20 2020-21 2021-22 2022-23 2023-24 2024-25 Total
GF Amount6/
146,000 195,000 211,000 351,000 367,000 640,000 872,000 644,608 3,426,608
Other Funds' Amount6/
0 223,770 240,357 385,489 402,076 685,084 925,589 689,860 3,552,227Total
Payment146,000 418,770 451,357 736,489 769,076 1,325,084 1,797,589 1,334,468 6,978,834
(Dollars in Thousands)
Loan Repayment Schedule
Repayment of Cash Loan Funding the Supplemental Pension Payment
Loan Repayment Allocation to General Fund and Other Funds4/
Assumptions:1/ Assumes $6 billion loan drawn down in three equal installments on 10/31/2017, 1/16/2018, and 4/17/2018. Quarterly interest payments
in FY 2017-18 will be calculated using only the portion of the loan that has been drawn down.2/ The 2-year constant maturity U.S. Treasury rate was projected using the projected Pooled Money Investment Account (PMIA) rate plus 30 basis points. Thirty-basis points is roughly the spread between 6-month U.S. Treasury notes and 2-year notes. Growth in the PMIA rate is expected to reduce after FY 2019-20, and no growth is expected for the three fiscal years following FY 2021-22; as such, growth in the projected interest rate slows, and the interest rate does not change after FY 2022-23.
3/ Assumes principal payments will be made at the end of the year. 4/ This table displays the portion of repayment that the General Fund (GF), and other funds, are respectively responsible for per SB 84.
5/ The GF share of total retirement contributions is 49.1% as of June 2017. Amounts could fluctuate from year to year.6/ Displays the loan repayment amounts the GF and other funds are expected to make that fiscal year. The GF values for 2017-18 through 2020-21 are the estimated available Proposition 2 debt payment amounts, projected as of 2017 Budget Act. The GF values for FY 2021-22 through 2023-24 are rough estimates of available Proposition 2 debt payment amounts. For FY 2024-25, the GF value is the amount required to fully repay the GF's share of the loan.

Appendices
A11 t2TZCG62
Appendix CG
EN
ER
AL
FUN
D
JUL
AU
GSE
PO
CT
NO
VD
ECJA
NFE
BM
AR
APR
MA
YJU
NTO
TAL
1B
EGIN
NIN
G C
ASH
BA
LAN
CE
$0$0
$0$0
$0$0
$0$0
$0$0
$0$0
$02
REC
EIPT
S:3
Alc
ohol
ic B
ever
age
Exc
ise
Tax
$43
$28
$31
$32
$32
$24
$45
$20
$31
$23
$28
$40
$377
4 C
orpo
ratio
n Ta
x34
525
931
364
-108
1,76
740
814
985
92,
821
425
2,89
010
,876
5 C
igar
ette
Tax
61
101
101
120
100
68
656
Inh
erita
nce,
Gift
and
Est
ate
Taxe
s
00
00
00
00
00
00
07
Ins
uran
ce T
ax
1730
132
815
277
294
1027
247
487
211
324
2,53
88
Per
sona
l Inc
ome
Tax
4,66
05,
089
7,61
95,
433
4,83
09,
194
14,2
683,
679
3,97
214
,575
4,31
111
,512
89,1
429
Ret
ail S
ales
and
Use
Tax
815
3,05
71,
903
891
2,76
32,
136
1,07
33,
212
2,07
674
43,
426
2,28
024
,376
10 I
ncom
e fro
m P
oole
d M
oney
Inve
stm
ents
47
114
714
74
116
427
106
11 T
rans
fer f
rom
Spe
cial
Fun
d fo
r E
cono
mic
Unc
erta
intie
s0
00
00
032
30
00
00
323
12 O
ther
3627
748
6672
130
138
6756
6875
552
1,58
513
TOTA
L, R
ecei
pts
$5,9
26$8
,785
$10,
881
$6,8
06$7
,883
$13,
560
$16,
284
$7,1
58$7
,262
$18,
724
$8,4
86$1
7,63
3$1
29,3
88
14D
ISB
UR
SEM
ENTS
:15
Sta
te O
pera
tions
:16
U
nive
rsity
of C
alifo
rnia
$432
$263
$263
$263
$263
$480
$263
$263
$263
$263
$493
$34
$3,5
4317
D
ebt S
ervi
ce
-82
549
794
937
627
-283
-82
473
1,00
197
421
2-2
804,
840
18
Oth
er S
tate
Ope
ratio
ns2,
589
1,98
21,
892
2,65
21,
440
2,45
71,
831
1,46
41,
614
2,52
71,
971
1,39
423
,813
19 S
ocia
l Ser
vice
s1,
300
334
526
837
750
534
699
664
687
756
526
567
8,18
020
Med
i-Cal
Ass
ista
nce
for D
HC
S2,
645
2,00
61,
736
1,31
71,
966
1,14
41,
073
2,03
71,
612
1,68
11,
047
1,19
719
,461
21 O
ther
Hea
lth a
nd H
uman
Ser
vice
s28
5-5
943
382
336
128
135
033
870
317
815
817
3,86
722
Sch
ools
2,
902
3,54
45,
669
4,00
84,
535
6,23
44,
125
4,71
96,
068
3,96
84,
439
6,06
856
,279
23 T
each
ers'
Ret
irem
ent
524
00
871
052
40
00
871
00
2,79
0
24 T
rans
fer t
o S
peci
al F
und
for E
cono
mic
U
ncer
tain
ties
00
00
00
00
00
00
0
25 T
rans
fer t
o B
udge
t Sta
biliz
atio
n A
ccou
nt0
02,
289
00
00
00
00
02,
289
26 O
ther
6850
645
528
510
930
512
530
9623
917
493
63,
329
27TO
TAL,
Dis
burs
emen
ts$1
0,66
3$9
,125
$14,
057
$11,
993
$10,
051
$11,
676
$8,3
84$9
,988
$12,
044
$11,
457
$9,0
20$9
,933
$128
,391
28EX
CES
S R
ECEI
PTS/
(DEF
ICIT
)-$
4,73
8-$
340
-$3,
177
-$5,
186
-$2,
169
$1,8
85$7
,900
-$2,
830
-$4,
781
$7,2
67-$
534
$7,7
00$9
98
29N
ET T
EMPO
RA
RY
LOA
NS:
30 S
peci
al F
und
for E
cono
mic
Unc
erta
intie
s$0
$0$0
$0$0
$0-$
323
$0$0
$0$0
$0-$
323
31 B
udge
t Sta
biliz
atio
n A
ccou
nt
3,10
70
2,28
90
00
00
00
0-6
,071
-675
32 O
ther
Inte
rnal
Sou
rces
1,63
134
088
85,
186
2,16
9-1
,885
-7,5
782,
830
4,78
1-7
,267
534
-1,6
290
33 E
xter
nal B
orro
win
g0
00
00
00
00
00
00
34
TO
TAL,
Net
Tem
pora
ry L
oans
$4,7
38$3
40$3
,177
$5,1
86$2
,169
-$1,
885
-$7,
901
$2,8
30$4
,781
-$7,
267
$534
-$7,
700
-$99
8
35EN
DIN
G C
ASH
BA
LAN
CE
$0$0
$0$0
$0$0
$0$0
$0$0
$0$0
$0
ESTI
MAT
ED 2
017-
18 F
ISC
AL Y
EAR
CAS
HFL
OW
AS
OF
2017
BU
DG
ET A
CT
(Dol
lars
in M
illio
ns)

Appendices
A12t2TZCG62
GE
NE
RA
L FU
ND
JUL
AU
GSE
PO
CT
NO
VD
ECJA
NFE
BM
AR
APR
MA
YJU
NTO
TAL
ESTI
MAT
ED 2
017-
18 F
ISC
AL Y
EAR
CAS
HFL
OW
AS
OF
2017
BU
DG
ET A
CT
(Dol
lars
in M
illio
ns)
36A
VAIL
AB
LE/B
OR
RO
WA
BLE
RES
OU
RC
ES:
37 S
peci
al F
und
for E
cono
mic
Unc
erta
intie
s$1
,749
$1,7
49$1
,749
$1,7
49$1
,749
$1,7
49$1
,426
$1,4
26$1
,426
$1,4
26$1
,426
$1,4
26$1
,426
38 B
udge
t Sta
biliz
atio
n A
ccou
nt
6,19
76,
197
8,48
68,
486
8,48
68,
486
8,48
68,
486
8,48
68,
486
8,48
68,
486
8,48
6
39 O
ther
Inte
rnal
Sou
rces
30,9
9531
,357
30,8
3529
,439
29,5
5128
,637
26,2
3928
,280
28,7
8326
,884
26,7
2827
,350
27,3
5040
Ext
erna
l Bor
row
ing
00
00
00
00
00
00
0
41es
T
OTA
L, A
vail.
Bor
row
able
Res
ourc
es
$38
,941
$39,
303
$41,
070
$39,
674
$39,
786
$38,
872
$36,
151
$38,
192
$38,
695
$36,
796
$36,
640
$37,
263
$37,
263
42C
UM
ULA
TIVE
LO
AN
BA
LAN
CES
:
43 S
peci
al F
und
for E
cono
mic
Unc
erta
intie
s$1
,749
$1,7
49$1
,749
$1,7
49$1
,749
$1,7
49$1
,426
$1,4
26$1
,426
$1,4
26$1
,426
$1,4
26$1
,426
44 B
udge
t Sta
biliz
atio
n A
ccou
nt
6,19
76,
197
8,48
68,
486
8,48
68,
486
8,48
68,
486
8,48
68,
486
8,48
62,
416
2,41
6
45 O
ther
Inte
rnal
Sou
rces
1,63
11,
971
2,85
98,
045
10,2
138,
329
751
3,58
18,
363
1,09
51,
629
00
46 E
xter
nal B
orro
win
g0
00
00
00
00
00
00
47
TO
TAL,
Cum
ulat
ive
Loan
Bal
ance
s$9
,577
$9,9
17$1
3,09
4$1
8,28
0$2
0,44
9$1
8,56
4$1
0,66
4$1
3,49
4$1
8,27
5$1
1,00
8$1
1,54
2$3
,842
$3,8
42
48U
NU
SED
BO
RR
OW
AB
LE R
ESO
UR
CES
$29,
364
$29,
386
$27,
976
$21,
394
$19,
337
$20,
308
$25,
488
$24,
698
$20,
420
$25,
788
$25,
099
$33,
421
$33,
421
49C
ash
and
Unu
sed
Bor
row
able
Res
ourc
es$2
9,36
4$2
9,38
6$2
7,97
6$2
1,39
4$1
9,33
7$2
0,30
8$2
5,48
8$2
4,69
8$2
0,42
0$2
5,78
8$2
5,09
9$3
3,42
1$3
3,42
1
Not
e: L
ine
39 in
clud
es re
duct
ion
of $
2 bi
llion
in th
e m
onth
s of
Oct
, Jan
, and
Apr
il fo
r the
sup
plem
enta
l pen
sion
pay
men
t.
Num
bers
may
not
add
due
to ro
undi
ng.

Appendices
A13 t2TZCG62
Appendix D
Estimated Year-End Totals
(at Budget Act)
Reductions Under Moderate
Recession
Projected Economic Downturn
RECEIPTS $129,388 -$20,000 $109,388DISBURSEMENTS $128,391 -$20,000 $108,391
AVAILABLE/BORROWABLE RESOURCES: Special Fund for Economic Uncertainties $1,426 $0 $1,426 Budget Stabilization Account 8,486 -4,243 4,243
Other Internal Sources 33,350 -5,003 28,348
One-time $6 Billion Supplemental Pension Payment -6,000 0 -6,000 TOTAL, Available/Borrowable Resources $37,262 -$9,246 $28,017
UNUSED BORROWABLE RESOURCES $33,421 -$9,246 $24,176
Assumptions:1 – Moderate recession could result in $20 billion loss of revenues.2 – Measures would be implemented to reduce spending to balance the budget pursuant to Proposition 58.3 – Draw one-half of the Budget Stabilization Account.
General Fund Cash Position in 2017-18 Under a Moderate Recession Scenario(Dollars in Millions)
4 – For a conservative estimate, other internal available cash was reduced by 15 percent (although we note that historical records do not support this scenario). The result is a reduction to resources by $5 billion.

Appendices
A14t2TZCG62
Appendix E Comparison of 2-Year US Treasury Constant Maturity (TCM) Rates and Pooled Money In-vestment Account (PMIA) Rate Over Last 20 Years, Measured at the End of the 2nd Calendar Quarter Period
0.00
1.00
2.00
3.00
4.00
5.00
6.00
7.00
1998 2000 2002 2004 2006 2008 2010 2012 2014 2016
2-Year TCM RatePMIA Rate
Source: U.S. Federal Reserve System; State Treasurer's Office