27th ecbc plenary meeting · min credit score; new loan doc stds feb-10 (effective apr) ... jap deu...
TRANSCRIPT
27th ECBC PLENARY MEETING 18 APRIL 2018 VANCOUVER, CANADA

ECBC Chairman’s Note
Niek ALLONECBC Chairman
Vancouver – 18 April 2018

Agenda Overview
Luca BERTALOTSecretary General, EMF-ECBC
Vancouver – 18 April 2018

European Mortgage Federation – European Covered Bond Council
Why Canada for launching Covered Bondsglobally?
1
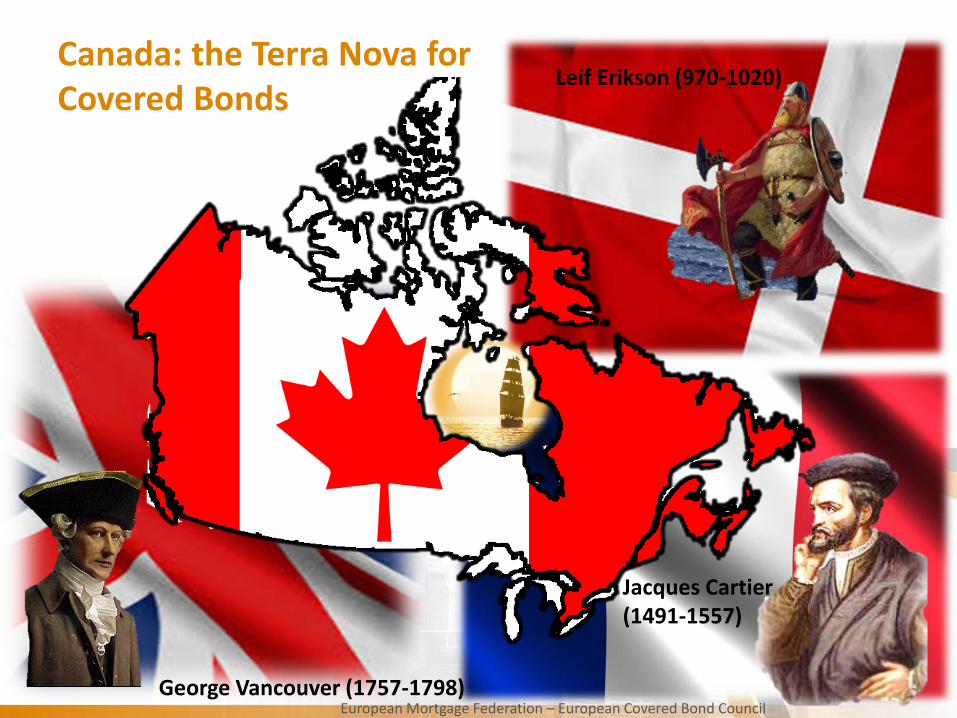
Leif Erikson (970-1020)
Jacques Cartier(1491-1557)
George Vancouver (1757-1798)
European Mortgage Federation – European Covered Bond Council
Canada: the Terra Nova forCovered Bonds
2
Leif Erikson (970-1020)
Jacques Cartier(1491-1557)
George Vancouver (1757-1798)

Keynote Speech
Jeremy RudinSuperintendent, Office of the Superintendent of Financial Institutions (OSFI)
Vancouver – 18 April 2018

European Mortgage Federation – European Covered Bond Council
First Panel Discussion: Covered Bonds in Canada
Panel Moderator
Marc J. MacMullinMcCarthy Tétrault LLP
Wojtek NiebrzydowskiCIBC
David PowerRoyal Bank of Canada
Jacob Pinto,Bank of Montreal
Jean Blouin,Desjardins
Stefane Marion,National Bank
Janet Boyle,Scotiabank
Greg McDonald,TD Bank

Canada’s housing fundamentals:How do we compare ?___
Stéfane MarionChief Economist and Strategist
April 18, 2018
European Covered Bond CouncilVancouver
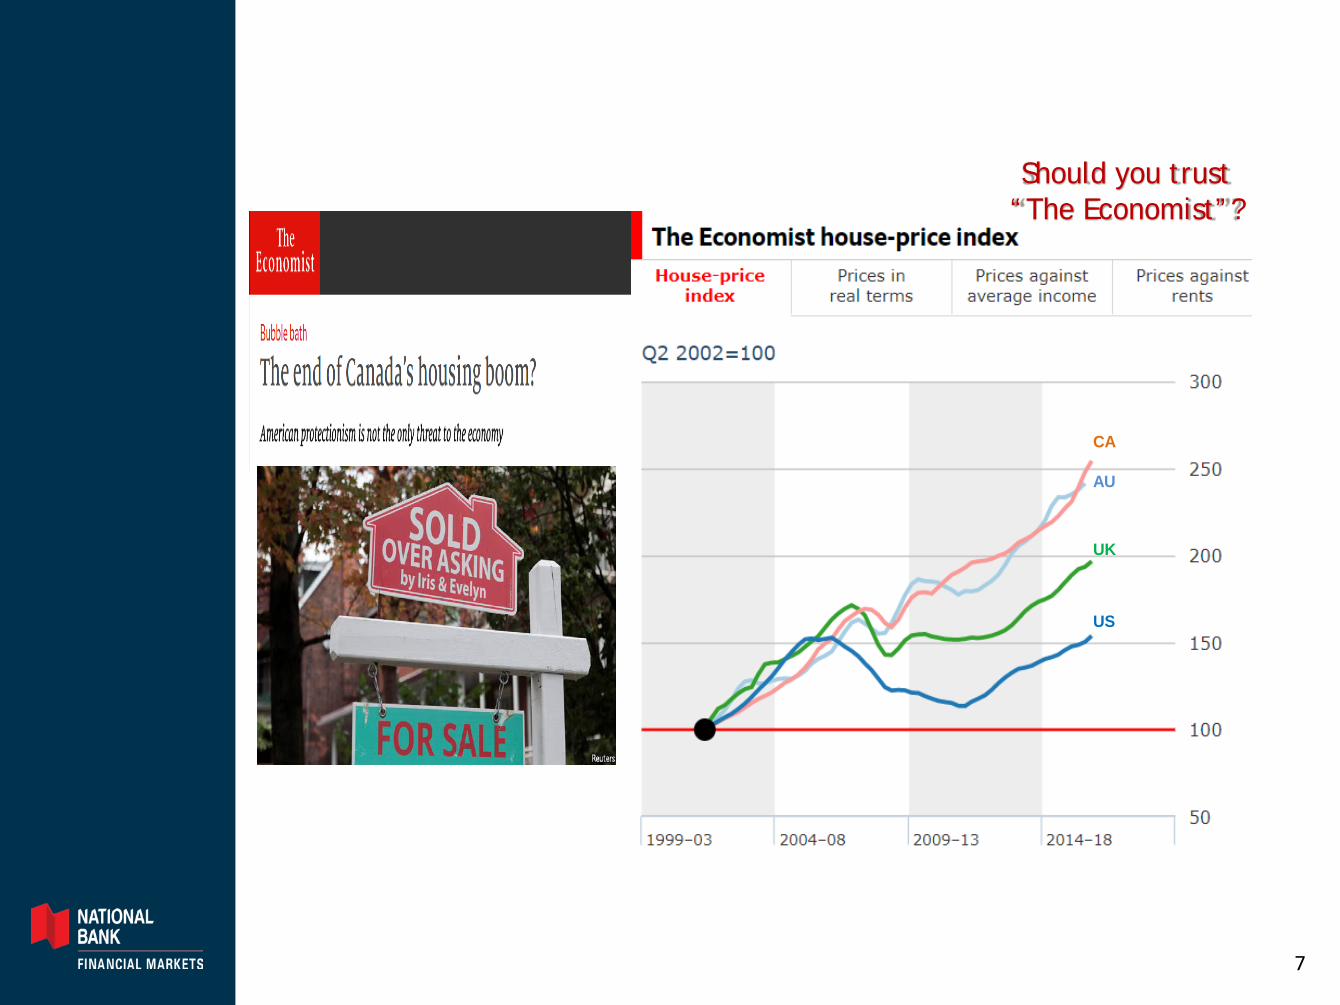
CA
AU
UK
US
Should you trust“The Economist”?
7

80
120
160
200
240
280
320
360
400
440
2000 2002 2004 2006 2008 2010 2012 2014 2016 2018
Canada: Irrational exuberance in Canada?Resale price index
Index 2000 = 100 VAN
TOR
MON
CAL
U.S.
NBF Economics and Strategy (data via Teranet-National Bank and Datastream)
Indices don’t tellthe whole story
8
245286300334374387
438606
655699720729
9259861,0021,0421,0551,0751,083
1,2281,246
1,3281,861
3,257
0 500 1,000 1,500 2,000 2,500 3,000 3,500
Quebec CityOttawa/Gatineau
CalgaryHoustonChicagoMontreal
MiamiBerlin
CopenhagenRome
TorontoLos Angeles
OsloTokyo
VancouverBostonSydney
StockhomSan Francisco
ParisBeijing
New YorkLondon
Hong Kong
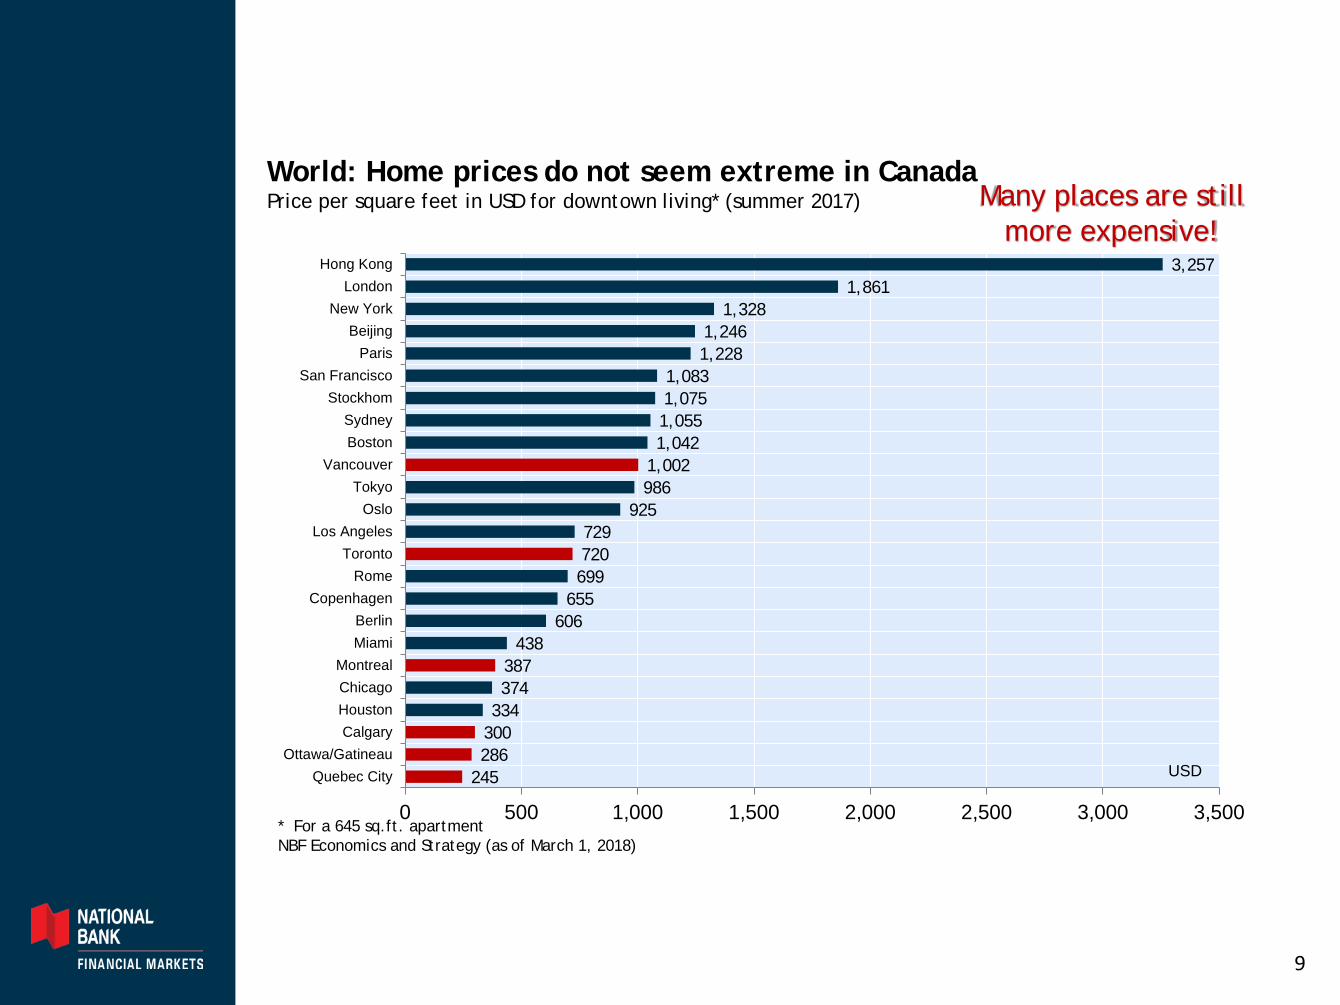
World: Home prices do not seem extreme in CanadaPrice per square feet in USD for downtown living* (summer 2017)
* For a 645 sq.ft. apartmentNBF Economics and Strategy (as of March 1, 2018)
USD
Many places are still more expensive!
9

0
20
40
60
80
100
120
RUS MEX BRA CZE ZAF POL ITA ISR CHN IRL AUT DEU JPN FRA BEL ESP FIN LUX THA HKG PRT USA GBR SWE NZL KOR CAN
World: Perspective on household leverageHousehold debt as a percentage of GDP
%
NBF Economics and Strategy (data via the Bank for International Settlements)
Really ?
10

0
20
40
60
80
100
120
140
RUS MEX BRA CZE ZAF POL ITA ISR CHN IRL AUT DEU JPN FRA BEL ESP FIN LUX THA HKG PRT USA GBR SWE NZL KOR CAN NOR USA NLD DNK AUS CHE
World: Perspective on household leverageHousehold debt as a percentage of GDP
%
NBF Economics and Strategy (data via the Bank for International Settlements) U.S. adjusted to Canadian definition
A case of fake news !
11

0
10
20
30
40
50
60
70
80
90
100
2000 2002 2004 2006 2008 2010 2012 2014 2016 2018
Canada: Home prices remain resilientShare of regional markets* in Canada where prices have increased in the past 3 months
%
* 26 markets in totalNBF Economics and Strategy (Teranet-National Bank)
Why won’tit break?
12

0
10
20
30
40
50
60
70
80
90
100
2000 2002 2004 2006 2008 2010 2012 2014 2016 2018
Ontario: Home price deflation is abatingShare of regional markets* in Ontario where prices have increased in the past 3 months
%
* 15 markets in totalNBF Economics and Strategy (Teranet-National Bank)
Ontario refusesto capitulate
13

A very long list of macroprudential rules aim to contain overheated housing market…
Source: NBF, Government of Canada, OSFI, CMHC, CREA
Canada average resale housing price & timing of housing/mortgage market reforms
BC moves again
Jul-08 (effective Oct)lower max amort 40Y to 35Y;inc min downpay 0% to 5%;
min credit score;new loan doc stds
Feb-10 (effective Apr)tougher qualifying for ARMs;reduce refi limit 95% to 90%;
min 20% downpay for investment properties
Jan-11 (effective Apr)lower max amort 35Y to 30Y;reduce refi limit 90% to 85%;
no insurance on HELOCs
Jun-12insured mort not eligible for
covered bond pools;OSFI guidelines on mort u/w
Jun-12 (effective Jul)lower max amort 30Y to 25Y;reduce refi limit 85% to 80%;
debt service caps;no insurance on homes >$1mln
Aug-13CMHC cap on MBS gtee
Feb-14 (effective May)CMHC increase mort insurance
premiums
Nov-14OSFI guidelines on insured mort
u/w
Apr-15 (effective Jun)CMHC increase mort insurance
premiums
Dec-15 (effective Feb)inc min downpay 5% to 10% for
homes >$500K;co-ord with moves at OSFI (capital) and CMHC (fees)
Jul-16OSFI tighten supervisory
expectations
Jul-16 (effective Aug)incremental property
transfer tax forforeign buyers*** BC ONLY ***
Oct-16 (effective Oct/Nov)"stress test" 5+Y fixed mort;
elim tax exemption for non-res;tighten access to port insurance;
consult on risk sharing
Apr-17package of reforms inclnon-res speculation tax
*** ONT ONLY ***
Oct-17 (effective Jan)OSFI finalizes B-20
regulations, incl stresstesting uninsured
mortgages
200
250
300
350
400
450
500
550
2006 2007 2008 2009 2010 2011 2012 2013 2014 2015 2016 2017 2018
$000s
Can this list get any longer?
14

Canada: Household debt determinants according to Statistics CanadaTobit model description from Household debt in Canada (2012)
Statistics Canada (“Household Debt in Canada”, March 2012)
Total household debt ═ β1Income + β2Employed + β3Tenure+β4Immigrant Status + β5Education
Key findings:
Employed: An employee has $93K more debt than a retiree and +$37K more debt than others.
The age profile of employees is also important (+$52K more debtfor younger workers vs. others).
Home Tenure: A homeowner has $100K more debt than a renter
Immigrants: Foreign born population has more leverage than natives (+$34K)
Education: Postsecondary education = +$26K more debt than less educated
After controlling for income, here are the key determinants of household leverage identified by statistics Canada
15

35
40
45
50
55
60
65
GRC ITA ESP BEL FRA PRT SLO POL HUN FIN SVK LAT IRE CHI AUT CZE JAP DEU EST DNK USA GBR NLD SWE AUS NOR CAN SWI
World: Perspective on employment rateWorkers as a percentage of population 15+
NBF Economics and Strategy (data via OECD, Statistics Canada)
%
Second highest !
16

96
98
100
102
104
106
108
110
112
114
116
118
120
122
124
126
2000 2002 2004 2006 2008 2010 2012 2014 2016 2018
Index, 2000 = 100
Perspective on key driver of labour incomeFull-time employment: Canada vs. the U.S.
NBF Economics and Strategy (data via Datastream)
We continueto do well
17

60
61
62
63
64
65
66
67
68
69
70
1975 1980 1985 1990 1995 2000 2005 2010 2015
Canada: Perspective on homeownership rateHomeownership rate in Canada and United States
%
NBF Economics and Strategy (data via Statistics Canada and U.S. Census)
Should we panic?
18

0%
10%
20%
30%
40%
50%
60%
LAT SLO SVK POL GRC CHI CZE ITA HUN EST DEU AUT FRA IRE ESP PRT GBR AUS FIN BEL SWI DNK USA CAN NLD SWENOR
World: Perspective on mortgage holdersHomeowners having a mortgage as a percentage of total households (2014 or latest)
NBF Economics and Strategy (data via OECD)
Not so bad
19
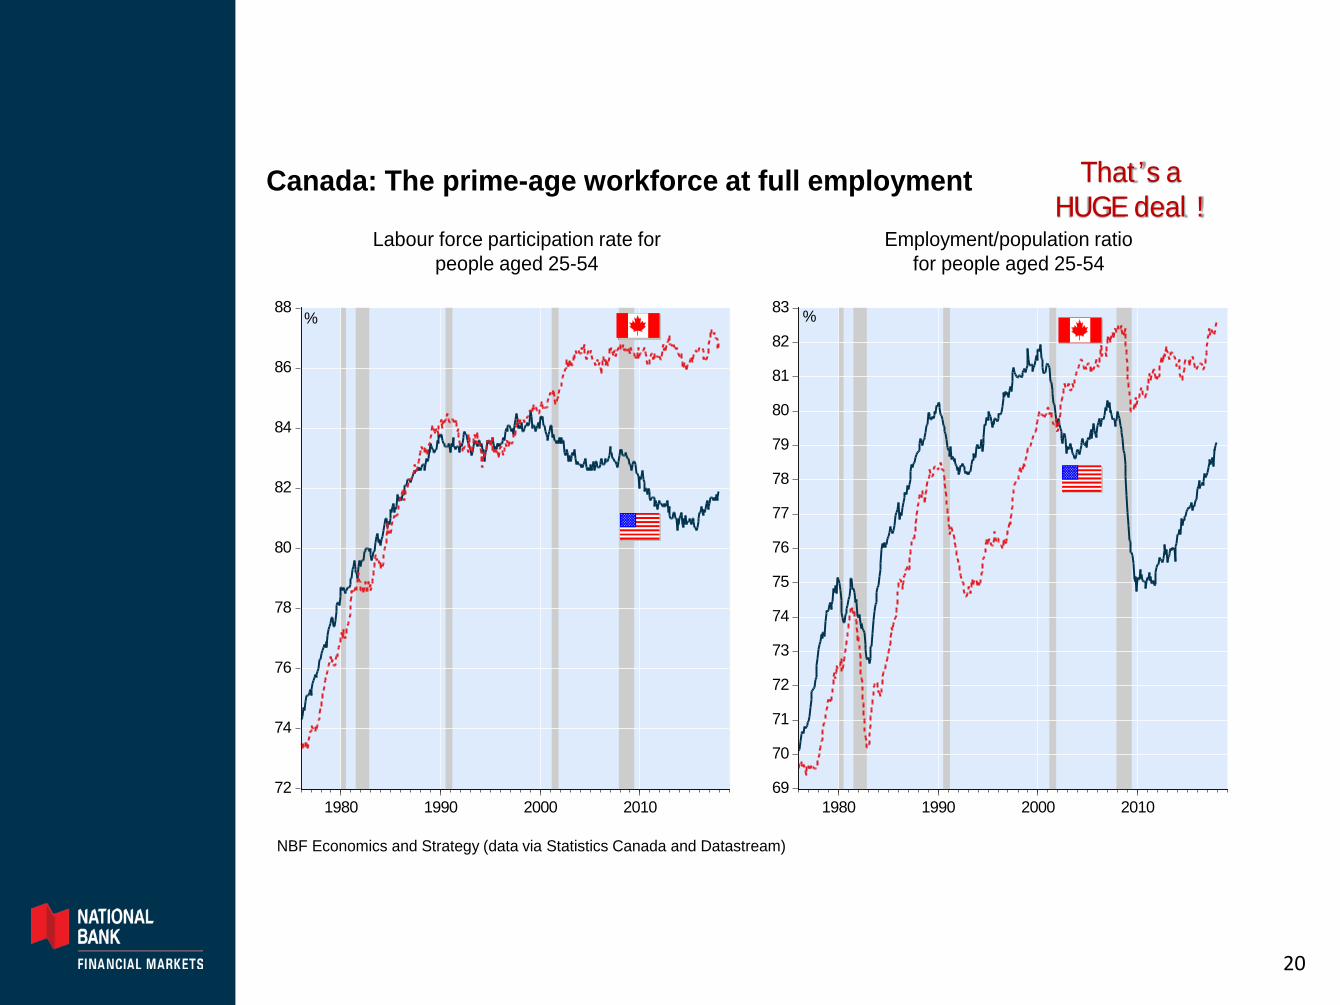
69
70
71
72
73
74
75
76
77
78
79
80
81
82
83
1980 1990 2000 201072
74
76
78
80
82
84
86
88
1980 1990 2000 2010
Canada: The prime-age workforce at full employment
Employment/population ratiofor people aged 25-54
Labour force participation rate forpeople aged 25-54
% %
NBF Economics and Strategy (data via Statistics Canada and Datastream)
That’s a HUGE deal !
20

94
96
98
100
102
104
106
108
110
112
2000 2002 2004 2006 2008 2010 2012 2014 2016 2018
Index, 2000 = 100
Perspective on the prime-aged workforceEmployment for people aged 25-54: Canada vs. the U.S.
NBF Economics and Strategy (data via Statistics Canada and BLS via Datastream)
That’s very impressive
21

99
100
101
102
103
104
105
106
107
108
2000 2002 2004 2006 2008 2010 2012 2014 2016 2018
Index, 2000 = 100
Prime-age population growing in Canada, stalling in the U.S.Population aged 25-54: Canada vs. the U.S.
NBF Economics and Strategy (data via Statistics Canada and BLS via Datastream)
Did you know this ?
22

Canada: Leading OECD countries in terms of population growth2017 population growth, natural vs. caused by migration
NBF Economics and Strategy (data via Statistics Canada and U.S. Census)
%
-0.4%
-0.2%
0.0%
0.2%
0.4%
0.6%
0.8%
1.0%
1.2%
1.4%
JAP DEU GRC POR ITA DEN FIN FRA NLD AUT GBR SWI BEL ESP NZL SWE USA NOR AUS IRE CAN
Natural Migration Total
Fastest in the OECD
23

0
5
10
15
20
25
30
CHI SVK HUN FIN CZE PRT DNK ITA EST NLD FRA GBR DEU USA ESP NOR BEL SWE SLO IRE AUT CAN AUS SWI
World: Perspective on foreign-born populationShare of population born abroad
%
NBF Economics and Strategy (data via OECD)
CA: 22% vs US: 14%
24

0
200
400
600
800
1,000
LAT SLK EST FIN SLO HUN PRT GRC CZK IRE NOR DNK JAP POL BEL AUT SWI SWE ESP ITA CHI NLD AUS FRA CAN GBR DEU USA
World: Inflows of permanent immigrantsPermanent immigration in OECD countries in 2016 (2015 if not yet available)
thousands
NBF Economics and Strategy (OECD data https://data.oecd.org/migration/permanent-immigrant-inflows.htm#indicator-chart)
300K/year is a lot!
25

12
16
20
24
28
32
36
40
44
48
52
56
60
64
68
2003 2004 2005 2006 2007 2008 2009 2010 2011 2012 2013 2014 2015
%
Canada: Immigration policy is key for labour markets“Economic category” admissions to permanent residence as a share of total immigration
NBF Economics and Strategy (OECD data https://data.oecd.org/migration/permanent-immigrant-inflows.htm#indicator-chart)
Massive divergence
26
0
20
40
60
80
100
120
140
160
180
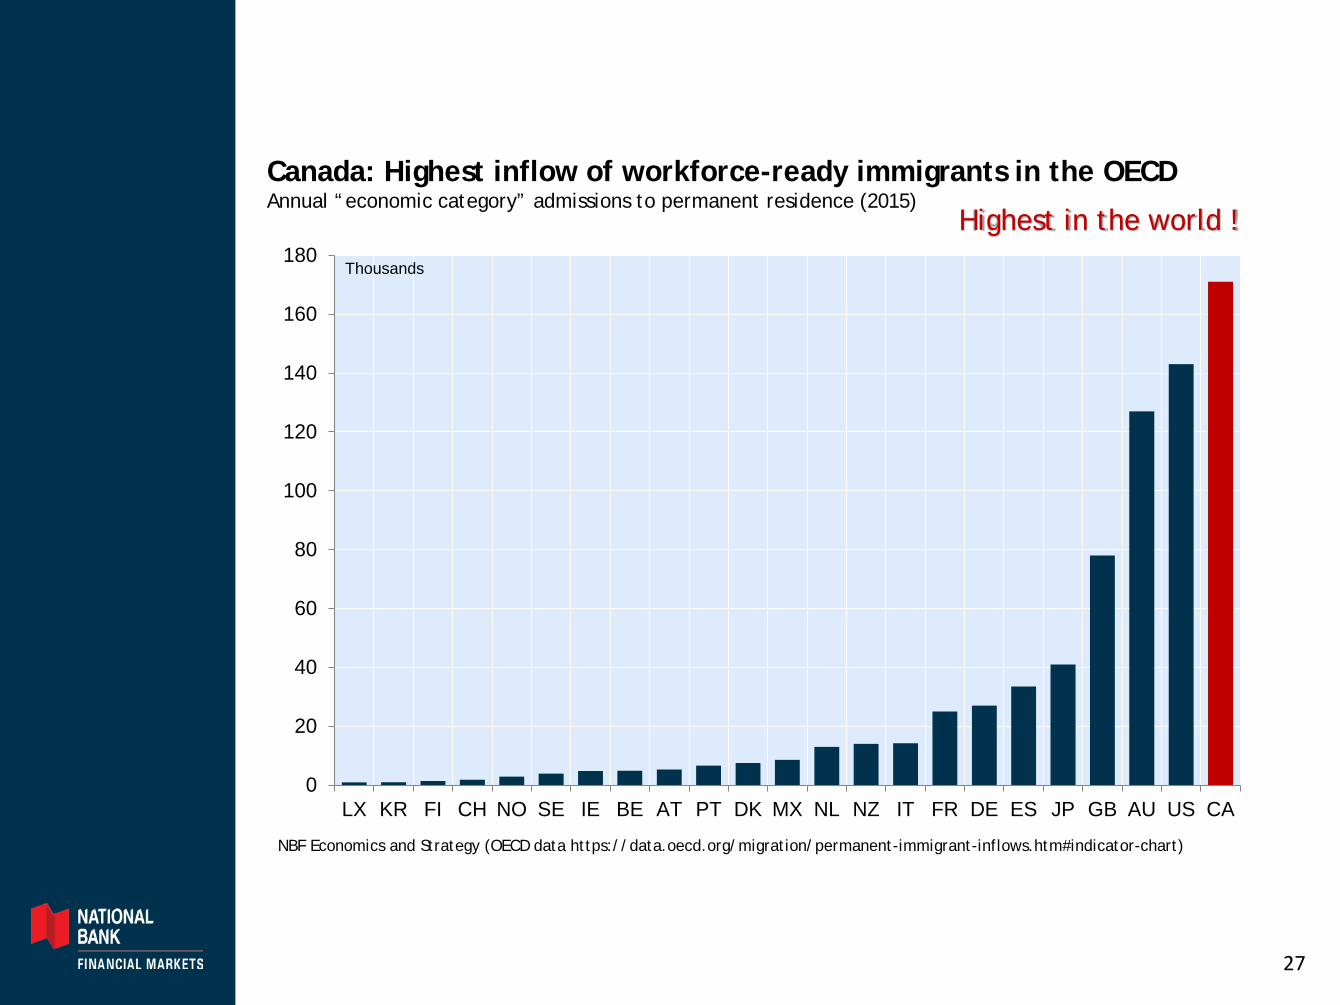
LX KR FI CH NO SE IE BE AT PT DK MX NL NZ IT FR DE ES JP GB AU US CA
Thousands
Canada: Highest inflow of workforce-ready immigrants in the OECDAnnual “economic category” admissions to permanent residence (2015)
NBF Economics and Strategy (OECD data https://data.oecd.org/migration/permanent-immigrant-inflows.htm#indicator-chart)
Highest in the world !
27

0 10 20 30 40 50 60
ITASLV
GRCAUTDEUTURESPCZEPRTNLDSLVFRAFIN
BELHUNJAP
SWEDEN
OECDSWI
MEXUSANORESTPOLNZLGBRAUSLUXIRE
CAN
Canada: foreign-born population is highly educatedPercentage of foreign-born 15-64 with post-secondary education
%
NBF Economics and Strategy (data via http://www.oecd.org/els/mig/Indicators-of-Immigrant-Integration-2015.pdf)
Impressive
28

20
25
30
35
40
45
50
55
60
65
ITA HUN DEU CZE SVK PRT AUT GRC ESP EST FIN LAT SLO POL FRA BEL NLD DNK SWE USA NOR SWI AUS GBR JAP CAN
World: Perspective on educationShare of population aged 25-34 with post-secondary education (2016)
%
NBF Economics and Strategy (data via OECD)
Highest in the world !
29

22
27
32
37
42
47
52
57
62
1992 1993 1994 1995 1996 1997 1998 1999 2000 2001 2002 2003 2004 2005 2006 2007 2008 2009 2010 2011 2012 2013 2014 2015 2016
Canada: An educated workforce can support higher debtShare of population aged 25-34 with tertiary education
%
Canada
U.S.
OECD
NBF Economics and Strategy (OECD data via https://data.oecd.org/eduatt/population-with-tertiary-education.htm)
13 pp gap with the U.S. !
30

34.6
58.6
69.3
75.078.8
63.4
43.1
59.4
70.5
76.3 74.6
67.8
20
30
40
50
60
70
80
90
Less than 35 35-44 45-54 55-64 65 and over Total
USCanada
%
Canada: Perspective on homeownership rateHomeownership rate in Canada and United States (2016)
NBF Economics and Strategy (data via Statistics Canada and U.S. Census)
The below 35 are better off in Canada
31
98
100
102
104
106
108
110
112
114
116
118
120
122
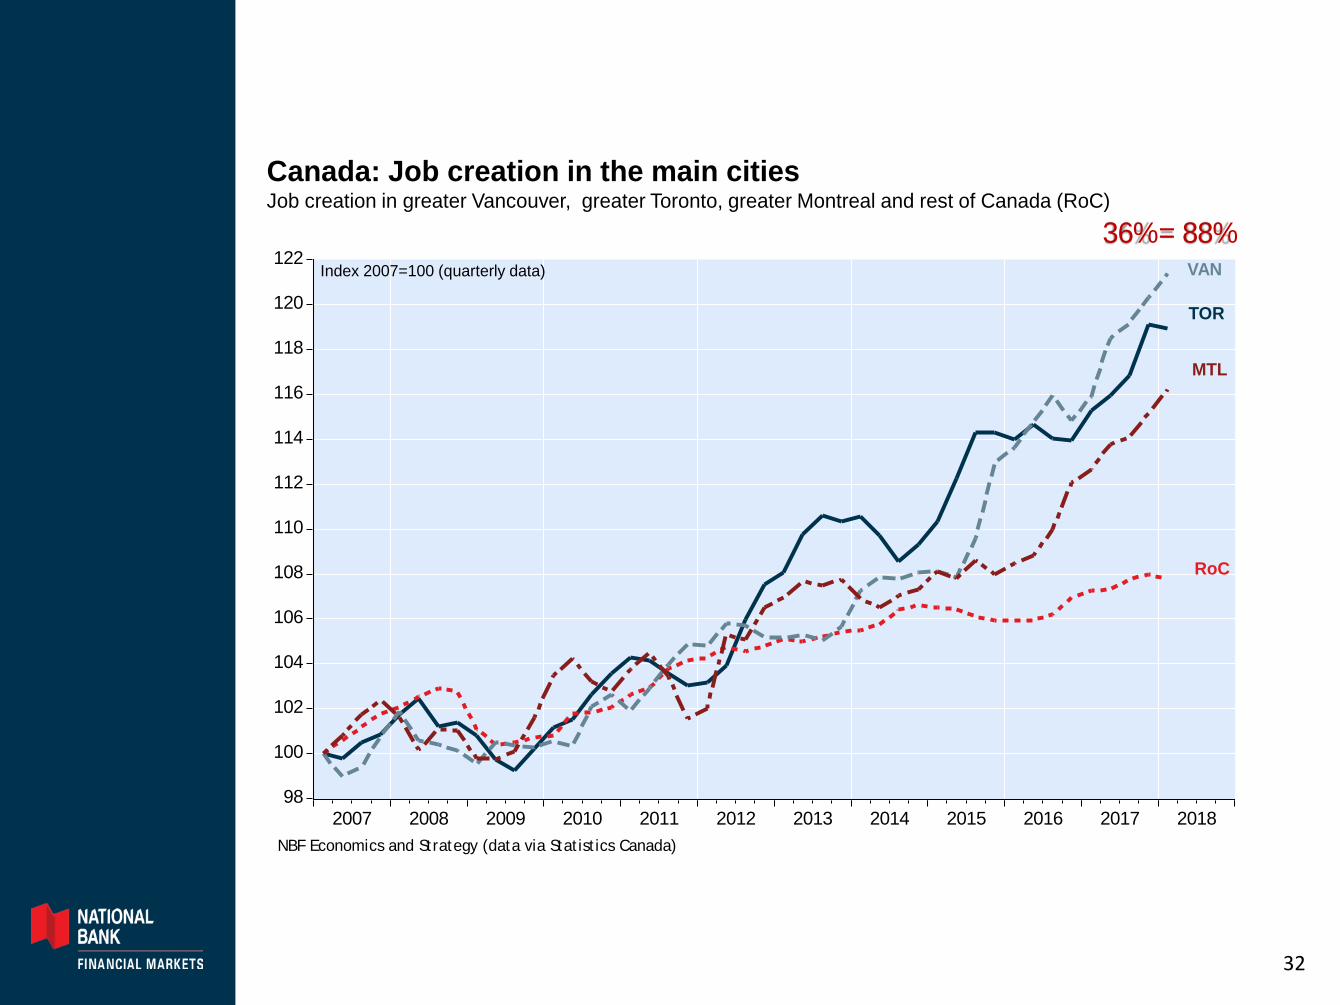
2007 2008 2009 2010 2011 2012 2013 2014 2015 2016 2017 2018
Index 2007=100 (quarterly data)
Canada: Job creation in the main citiesJob creation in greater Vancouver, greater Toronto, greater Montreal and rest of Canada (RoC)
NBF Economics and Strategy (data via Statistics Canada)
MTL
VAN
TOR
RoC
36% = 88%
32

-8
-7
-6
-5
-4
-3
-2
-1
0
1
2
3
4
5
6
7
8
2007 2008 2009 2010 2011 2012 2013 2014 2015 2016 2017 2018
Canada: Perspective on nominal GDPNominal GDP growth
%(y/y)
NBF Economics and Strategy (data via Statistics Canada and Datastream)
Economy is doing well
33

600
650
700
750
800
850
900
950
1,000
1,050
1,100
2006 2007 2008 2009 2010 2011 2012 2013 2014 2015 2016 2017 2018 2019
Canada: Earnings expected to hit a recordTrailing earnings for the S&P/TSX
EPS
NBF Economics and Strategy (data via Datastream)
Profits are doing well
34

5
6
7
8
9
10
11
12
13
14
1980 1985 1990 1995 2000 2005 2010 2015 2020
%
Canada: Perspective on labour-market slackUnemployment rate
NBF Economics and Strategy (data via Statistics Canada)
Labour marketis tight
35

Canada: Growth in wages & salariesQ4 2017 vs. Q4 2016
NBF Economics and Strategy (data via Statistics Canada)
6.25.8
4.9 4.9 4.7 4.6 4.4 4.3 4.2
3.2
2.4
0.30.0
1.0
2.0
3.0
4.0
5.0
6.0
7.0
8.0
BC QC CA AB ON US NS MB PE NB SK NL
%y/y
Labour income is rising
36

0.0
0.4
0.8
1.2
1.6
2.0
2.4
2.8
3.2
3.6
4.0
4.4
4.8
5.2
1985 1990 1995 2000 2005 2010 2015
Canada: Perspective on mortgage marketDelinquency rates on residential mortgage loans
%
NBF Economics and Strategy (data via CBA and U.S. MBA)
Rest of Canada
Alberta
U.S.
No evidence of financial stress
37

Canada: Perspective on household financial stressCredit card delinquency rate (90 days +) – Visa and Mastercard
%
NBF Economics and Strategy (data via CBA seasonally adjusted by NBF)
0.75
0.80
0.85
0.90
0.95
1.00
1.05
1.10
1.15
1.20
1.25
1.30
1.35
2004 2006 2008 2010 2012 2014 2016 2018
No evidence of financial stress
38

-30
-20
-10
0
10
20
30
40
50
60
70
80
90
100
2008 2009 2010 2011 2012 2013 2014 2015 2016 2017 2018
Canada: Personal bankruptcies Number of personal bankruptcies and proposals to creditors
%y/y
NBF Economics and Strategy (data via Office of Superintendent of Bankruptcy Canada)
Rest of Canada
Alberta
No evidence of financial stress
39

30
40
50
60
70
80
90
100
110
120
2007 2008 2009 2010 2011 2012 2013 2014 2015 2016 2017 2018
Index 2007 = 100
NBF Economy and Strategy, data from Conference Board of Canada
Four main provinces: Index of consumer confidenceQuarterly data;
Shaded area: Recession in Canada
BC
Alberta
Ontario
Quebec
No evidence of financial stress
40

Canada: Perspective on CPI-commonCore inflation based on common component measure
% (y/y)
NBF Economics and Strategy (data via Statistics Canada)
Official
NBF
More evidence of inflation
41

2
4
6
8
10
12
14
16
18
20
22
1980 1985 1990 1995 2000 2005 2010 2015
Canada: Perspective on mortgage interest rates5-year mortgage interest rate
%
NBF Economics and Strategy (data via National Bank Financial Strategic Data Analytics)
Rates will move higher
42

0
1
2
3
4
5
6
7
8
9
10
2007 2008 2009 2010 2011 2012 2013 2014 2015 2016 2017 2018
Household net savings rate
% of household disposable income
NBF Economics and Strategy (data via Statistics Canada and Datastream)
Some room tospare in Canada
43
Conclusion:• World, U.S.: Another year of above-potential growth
- Global growth near 3.7% in 2018
- China continues to grow at around 6.5% (good enough)
- Eurozone, still great at 1.9%
- Geopolitical risks to remain a major source of concern: U.S. Trade Policy?
Interest rates, currency:
- The Fed probably hikes two more times in 2018 ; 10-year Treasury yield near 3.0%.
- Expect the BoC to hike again in H2 2018 (heading towards 2%); GDP 2.5% in 2018
- Canadian dollar in the 1.20-1.30 range (stronger in short-term); Oil in the $55-$62 range
- Large correction in housing unlikely unless labour markets deteriorate markedly
or mortgage rates surge.
WE DIFFER FROM THE U.S. WHEN IT COMES TO DEMOGRAPHICS
___
44

NBC at 1155 Metcalfe Street, Montreal, CanadaGeneral – National Bank Financial (NBF) is an indirect wholly owned subsidiary of National Bank of Canada. National Bank of Canada is a publiccompany listed on Canadian stock exchanges. The particulars contained herein were obtained from sources which we believe to be reliable but are notguaranteed by us and may be incomplete. The opinions expressed are based upon our analysis and interpretation of these particulars and are not to beconstrued as a solicitation or offer to buy or sell the securities mentioned herein. Research Analysts – The Research Analyst(s) who prepare these reportscertify that their respective report accurately reflects his or her personal opinion and that no part of his/her compensation was, is, or will be directly orindirectly related to the specific recommendations or views as to the securities or companies. NBF compensates its Research Analysts from a variety ofsources. The Research Department is a cost centre and is funded by the business activities of NBF including, Institutional Equity Sales and Trading,Retail Sales, the correspondent clearing business, and Corporate and Investment Banking. Since the revenues from these businesses vary, the funds forresearch compensation vary. No one business line has a greater influence than any other for Research Analyst compensation. Canadian Residents – Inrespect of the distribution of this report in Canada, NBF accepts responsibility for its contents. To make further inquiry related to this report, Canadianresidents should contact their NBF professional representative. To effect any transaction, Canadian residents should contact their NBF Investmentadvisor. U.S. Residents – With respect to the distribution of this report in the United States, National Bank of Canada Financial Inc. (NBCFI) is regulatedby the Financial Industry Regulatory Authority (FINRA) and a member of the Securities Investor Protection Corporation (SIPC). This report has beenprepared in whole or in part by, research analysts employed by non-US affiliates of NBCFI that are not registered as broker/dealers in the US. These non-US research analysts are not registered as associated persons of NBCFI and are not licensed or qualified as research analysts with FINRA or any otherUS regulatory authority and, accordingly, may not be subject (among other things) to FINRA restrictions regarding communications by a research analystwith the subject company, public appearances by research analysts and trading securities held a research analyst account. All of the views expressed inthis research report accurately reflect the research analysts’ personal views regarding any and all of the subject securities or issuers. No part of theanalysts’ compensation was, is, or will be, directly or indirectly, related to the specific recommendations or views expressed in this research report. Theanalyst responsible for the production of this report certifies that the views expressed herein reflect his or her accurate personal and technical judgment atthe moment of publication. Because the views of analysts may differ, members of the National Bank Financial Group may have or may in the future issuereports that are inconsistent with this report, or that reach conclusions different from those in this report. To make further inquiry related to this report,United States residents should contact their NBCFI registered representative.UK Residents – In respect of the distribution of this report to UK residents, National Bank Financial Inc. has approved the contents (including, wherenecessary, for the purposes of Section 21(1) of the Financial Services and Markets Act 2000). National Bank Financial Inc. and/or its parent and/or anycompanies within or affiliates of the National Bank of Canada group and/or any of their directors, officers and employees may have or may have hadinterests or long or short positions in, and may at any time make purchases and/or sales as principal or agent, or may act or may have acted as marketmaker in the relevant investments or related investments discussed in this report, or may act or have acted as investment and/or commercial banker withrespect thereto. The value of investments can go down as well as up. Past performance will not necessarily be repeated in the future. The investmentscontained in this report are not available to retail customers. This report does not constitute or form part of any offer for sale or subscription of orsolicitation of any offer to buy or subscribe for the securities described herein nor shall it or any part of it form the basis of or be relied on in connectionwith any contract or commitment whatsoever. This information is only for distribution to Eligible Counterparties and Professional Clients in the UnitedKingdom within the meaning of the rules of the Financial Conduct Authority. National Bank Financial Inc. is authorised and regulated by the FinancialConduct Authority and has its registered office at 71 Fenchurch Street, London, EC3M 4HD. National Bank Financial Inc. is not authorised by thePrudential Regulation Authority and the Financial Conduct Authority to accept deposits in the United Kingdom. Copyright – This report may not bereproduced in whole or in part, or further distributed or published or referred to in any manner whatsoever, nor may the information, opinions orconclusions contained in it be referred to without in each case the prior express written consent of National Bank Financial.

European Mortgage Federation – European Covered Bond Council
First Panel Discussion: Covered Bonds in Canada
Panel Moderator
Marc J. MacMullinMcCarthy Tétrault LLP
Wojtek NiebrzydowskiCIBC
David PowerRoyal Bank of Canada
Jacob Pinto,Bank of Montreal
Jean Blouin,Desjardins
Stefane Marion,National Bank
Janet Boyle,Scotiabank
Greg McDonald,TD Bank

Canadian Bail-In Regime
Andrew FlemingNorton Rose Fulbright
Vancouver – 18 April 2018

Canadian Bail-in Regime Andrew Fleming Senior Partner Norton Rose Fulbright Canada LLP April 2018
Bail-in Introduction
2
• Bail-in regimes are being implemented in a number of jurisdictions in an effort to limit taxpayer exposure to losses of a failing institution and ensure the institution’s shareholders and creditors remain responsible for bearing such losses.
• On June 22, 2016, legislation came into force in Canada, amending certain federal statutes pertaining to banks to create a bank recapitalization or “bail-in” regime for the six domestic systemically important banks (D-SIBs) in Canada.
• On June 16, 2017, the Department of Finance announced the publication of draft regulations under the CDIC Act and the Bank Act, which provide key details of the conversion, issuance and compensation regimes for bail-in instruments issued by D-SIBs.

Bail-in Introduction - 2
3
• The final version of the proposed regulations was published on April 18, 2018 and the regime will become effective on September 23, 2018.
• Pursuant to the CDIC Act, in circumstances when the Superintendent of Financial Institutions is of the opinion that a bank may no longer be viable, the Governor in Council may, upon a recommendation of the Minister of Finance that he or she is of the opinion that it is in the public interest to do so, grant an order giving CDIC the power to convert – by means of a transaction or series of transactions and in one or more steps - all or a portion of certain shares and liabilities of that bank into common shares of the bank or any of its affiliates.
Instruments eligible for conversion under bail-in
4
• debt other than subordinated debt issued by a D-SIB after September 23, 2018 that is: – unsecured (or, if partly secured, only the unsecured portion will be subject to
bail-in), – tradable, (CUSIP, ISIN or similar number), and – perpetual or for an initial term of at least 400 days.
• subordinated liabilities and preferred shares issued after September 23, 2018 that are not non-viability contingent capital (NVCC) instruments.
• NVCC are instruments that are convertible into common shares by their terms at the point of non-viability of the D-SIB.

Instruments not eligible for conversion under bail-in
5
• non-transferable deposits (e.g. accounts and term deposits),
covered bonds, structured notes (that meet the requirements of the proposed regulations), eligible financial contracts (derivatives), conversion or exchange rights that are convertible into shares.
• debt issued before September 23, 2018 unless such debt is amended after September 23, 2018 to increase the principal amount or extend the term of the debt.
Requirements applicable to issuance of bail-in eligible securities
6
• terms of bail-in instruments must provide for:
– binding holder to the bail-in regime; – submission to the jurisdiction of Canadian courts regardless of governing law
of contract; and – such terms to be binding on the holder of the instrument despite any other
terms of the instrument, any other law governing the instrument and any other agreement or arrangement.
• any prospectus or other offering or similar document relating to an eligible bail-in instrument must include disclosure regarding its being subject to conversion into common shares.
• A D-SIB must not advertise or otherwise promote a bail-inable liability, including in its name, to a purchaser in Canada, as a deposit or any variation of that term.
Bail-in Process
7
• bail-in is undertaken by CDIC in one or more steps after OSFI determines that a D-SIB is non-viable or near non-viability and the federal government approves.
• A resolution order will then be issued. The resolution order will set out the terms of CDIC’s temporary control or ownership of the D-SIB.
• After the bail-in process and other restructuring processes are completed, CDIC must return the bank to private control.
• This must happen within 1 year of the commencement of the bail-in (subject to extension to 5 years by government order).
• Following the resolution, CDIC will offer compensation to shareholders and creditors if they are “worse-off” as a result of CDIC’s actions than if the D-SIB had been wound up in the normal course.

Conversion
8
• Conversion process is prescribed to maintain “relative” creditor hierarchy.
• Unlike NVCC instruments, the bail-in debt will not have a fixed conversion multiplier leaving it to CDIC to determine the conversion formula.
• CDIC must in carrying out a bail-in: – consider requirement of a bank under Bank Act (Canada) to maintain
adequate capitalization; and – use its best efforts to:
· convert all equally ranking bail-in instruments converted during the same restructuring period on the same proportionate basis; and · only convert a bail-in instrument if all NVCC instruments and subordinate ranking bail-in eligible instruments have been or will be concurrently converted.
• Holders of bail-in securities converted during the same restructuring period must receive more common shares per dollar amount of claim than converted subordinate ranking bail-in eligible instruments and NVCC.
Compensation for bank shareholders and creditors
9
• The regulations provide a process for bank shareholders and other creditors to obtain compensation if they are “worse off” as a result of CDIC’s actions as opposed to winding up.
• CDIC will provide an offer of compensation to such prescribed persons entitled to compensation.
• CDIC’s compensation offer may, if requested by prescribed persons representing at least 10% of the subject shares or liabilities, be reviewed by a third party assessor whose determination is final.
• Creditors who have liabilities assumed by a solvent third party after the date of the bail-in resolution or who have been made whole will not be entitled to compensation.

Total Loss-Absorbing Capacity (TLAC)
10
• On November 9, 2015, the Financial Stability Board (FSB) finalized minimum common international standards related to TLAC for global systemically important banks (G-SIBs).
• The standards are intended to address the sufficiency of G-SIBs’ capital to absorb losses in a resolution situation in a manner that minimizes the impact on financial stability, ensures continuity of critical functions and avoids exposing taxpayers to loss.
• Under the final standards, G-SIBs are expected to meet a 16% TLAC ratio based on risk-weighted assets as from January 1, 2019, increasing to 18% as from January 1, 2022.
• In addition, G-SIBs are expected as from January 1, 2019 to maintain a TLAC leverage ratio of 6% of the Basel III leverage ratio denominator, increasing to 6.75% as from January 1, 2022.

Total Loss-Absorbing Capacity (TLAC) - 2
11
• On June 16, 2017, as part of the Federal Government’s bail-in regime OSFI released a draft guideline on TLAC, applicable to Canada’s D-SIBs.
• On April 18, 2018, OSFI published the final version of such guideline.
• The guideline is consistent with the TLAC standards released by the FSB for G-SIBs.
• The standards are intended to address the sufficiency of a systemically important bank’s loss absorbing capacity in supporting its recapitalization in the event of its failure.
• The ratios based on risk-weighted assets and leverage will be set forth in orders issued by the Superintendent and are expected to be 21.5% and 6.75% respectively.

Total Loss-Absorbing Capacity (TLAC) - 3
12
• TLAC is defined as the aggregate of Tier 1 capital, Tier 2 capital, and “Other TLAC Instruments” (essentially bail-in instruments) which meet the additional eligibility criteria under the guideline.
• The additional eligibility criteria under the guideline include: − the instrument is directly issued by the Canadian parent bank − the instrument when issued, must be paid for in cash or, with
the approval of the Superintendent, in property − the instrument cannot have been purchased by the institution
or a related party except for the purpose of resale nor can the institution have provided financing for the expressed purpose of investing in the instrument
− the instrument is neither fully secured nor covered by a guarantee
− the instrument is not covered by set-off or netting

Total Loss-Absorbing Capacity (TLAC) - 4
13
− the instrument must not permit acceleration except on insolvency or on default to pay principal or interest after a 30 business day grace period
− the instrument is perpetual or has a residual maturity in excess of 365 days
− the instrument is callable or purchasable only by the issuer − the instrument does not have a credit-sensitive dividend or
coupon feature reset periodically based on the institution’s credit standings
− any amendments or variances to the instrument affecting its TLAC status will need the prior approval of the Superintendent
• Note that if the instrument is governed by foreign law OSFI must receive an opinion of external counsel confirming Canadian statutory bail-in powers will apply.
Total Loss-Absorbing Capacity (TLAC) - 5
14
• On March 21, 2018 OSFI released a draft guideline on TLAC Disclosure Requirements outlining the ongoing disclosure requirements with respect to TLAC levels, which guideline contains TLAC disclosure templates published in the Basel Committee on Banking Supervision Pillar 3 Disclosure Requirements – consolidated and enhanced framework standards issued in March 2017 (also referred to as Phase II of Pillar 3).
• The guideline provides for quarterly disclosure at the same time as the publication of financial statements starting with fiscal Q1 2019 reporting.
• The deadline for comment on the draft guideline was April 17, 2018

Further Reading Norton Rose Fulbright Legal Update A Comparison of Bail-in Regimes – Part 1 http://www.nortonrosefulbright.com/knowledge/publications/155431/a-comparison-of-bail-in-regimes-part-1 (A comparison of the Canadian and United Kingdom bail-in regimes)
15


17
Disclaimer Norton Rose Fulbright US LLP, Norton Rose Fulbright LLP, Norton Rose Fulbright Australia, Norton Rose Fulbright Canada LLP and Norton Rose Fulbright South Africa Inc are separate legal entities and all of them are members of Norton Rose Fulbright Verein, a Swiss verein. Norton Rose Fulbright Verein helps coordinate the activities of the members but does not itself provide legal services to clients. References to ‘Norton Rose Fulbright’, ‘the law firm’ and ‘legal practice’ are to one or more of the Norton Rose Fulbright members or to one of their respective affiliates (together ‘Norton Rose Fulbright entity/entities’). No individual who is a member, partner, shareholder, director, employee or consultant of, in or to any Norton Rose Fulbright entity (whether or not such individual is described as a ‘partner’) accepts or assumes responsibility, or has any liability, to any person in respect of this communication. Any reference to a partner or director is to a member, employee or consultant with equivalent standing and qualifications of the relevant Norton Rose Fulbright entity. The purpose of this communication is to provide general information of a legal nature. It does not contain a full analysis of the law nor does it constitute an opinion of any Norton Rose Fulbright entity on the points of law discussed. You must take specific legal advice on any particular matter which concerns you. If you require any advice or further information, please speak to your usual contact at Norton Rose Fulbright.

27th ECBC PLENARY MEETING 18 APRIL 2018 VANCOUVER, CANADA

Presentation of the European Commission’s Proposed Covered Bond Directive
Didier MillerotEuropean Commission
Vancouver – 18 April 2018

The Commission proposal on Covered bonds: a milestone for
the CMU? EMF-ECBC Conference Vancouver 18 April 2018

66
• Enabling framework on Covered bonds• Regulation on cross-border distribution
of investment funds• Regulation and Communication on
ownership of securities and claims
Measures presented on:
8 March 12 March
• Action Plan on Fintech• Proposal on crowdfunding• Action Plan on Sustainable
Finance

67
Context
Untapped CMU potential
Preferential prudential treatment granted to
different products
Leveraging banking capacity to support the
wider economy
Addressing prudential concerns
CONVERGING VIEWS• Stakeholders supporting view (public consultation closed January 2016)• EBA Report, December 2016• ICF Report delivered March 2017 and published May 2017• EP Report, approved July 2017
PROBLEMS OBJECTIVES

68
Guiding principles of the proposal
• Largely inspired by 2016 EBA report
• “Enabling” legislation (CMU): wide consultation, leverage best practices, “don’t fixwhat’s not broken”, need for caution
• Balanced and proportionate approach: need for a common EU denominator vs risksof a strait jacket → “Directive” with “principle-based” provisions
• The Directive regulates the product, not the issuer… focus on investor protection.
• Minimum harmonisation: but no more a covered bond if not compliant with theDirective!
• Prudential dimension: adjustments to the CRR (ex. OC requirements)

69
Commission Impact Assessment : Benefits
a) All MS will have a legal CB framework in place in line with EBA best practices
b) Benchmark additional issuance: 171/342 billion. In new MS: EUR 63 billion
c) Savings for banks: between EUR 1,65 and EUR 2.7 billion annually (a funding benefit of 30-45 bps on new issuance + 5 bps on all covered bonds)
d) Saving for borrowers: benchmark between €1.1 bn and €1.9 billion.
e) Increase in cross border investments and cover poolsf) Address prudential concerns

70
Commission Impact Assessment: Costs
a) No impact on existing CB thanks to grandfatheringb) Increase in costs for issuers only in jurisdictions not
aligned with EBA best practicesc) Increase in costs for supervisors only where supervision
is currently not adequately carried out.d) Increase in costs for granting permission only where
this is not currently envisagede) Costs are not expected to rise but to lower for
investors

71
The Covered Bonds “Package”
DIRECTIVE(defining EU covered bonds)
REGULATION(amending art 129 CRR)

72
Directive• Provides common definition of covered bonds• Single and consistent point of reference for other EU laws• Main elements:
1. Definition and structural features
2. Covered bond public supervision
3. Label
4. Transitional measures + Transposition
73
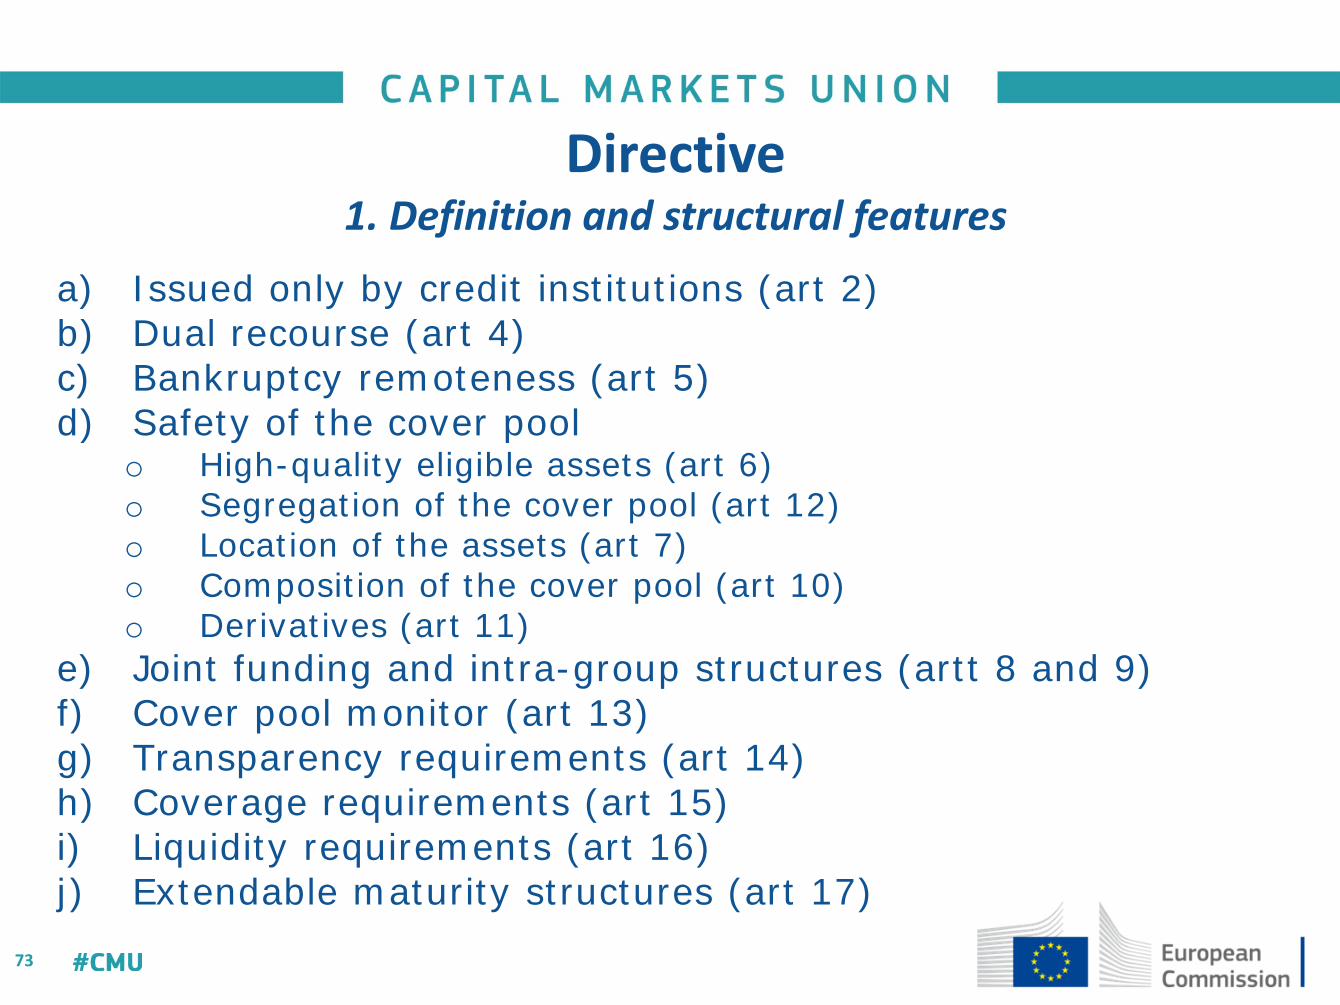
Directive1. Definition and structural features
a) Issued only by credit institutions (art 2)b) Dual recourse (art 4)c) Bankruptcy remoteness (art 5)d) Safety of the cover pool
o High-quality eligible assets (art 6)o Segregation of the cover pool (art 12)o Location of the assets (art 7)o Composition of the cover pool (art 10)o Derivatives (art 11)
e) Joint funding and intra-group structures (artt 8 and 9)f) Cover pool monitor (art 13)g) Transparency requirements (art 14)h) Coverage requirements (art 15)i) Liquidity requirements (art 16)j) Extendable maturity structures (art 17)

74
Directive2. Covered bond public supervision
a) Appointment of the national competent authority (art 18)b) Permission to issue covered bonds (art 19)c) Ongoing supervision of the CB programme (art 21, 22)d) Covered bond supervision in insolvency or resolution (art 20)e) Reporting to competent authorities (art 21)f) Administrative penalties and remedial measures and their
publication (art 23 and 24)g) Cooperation obligations (art 25)h) Disclosure requirements (art 26)

75
Directive3. Label
A new “label” for “European covered bonds” (art 27)
• Purpose: make it easier for investors to assess quality of CB
• Not mandatory. It can be used along with national labels
• Label is not mandatory, while compliance with Directive is.

76
Directive4. Transitional measures and transposition
a) Generous grandfathering provisions (art 30)
b) Review and report in 3 years after transposition (art 31)
c) Review of third-country regime (art 31)
d) Transposition: 12 months (art 32) + link with entry into force of the Regulation

77
Regulation• Amends art 129 of Regulation EU 575/2013 (CRR) • Main elements:
1. Substitution assets
2. Soft LTV limits
3. Rules on exposure
4. Securitised products not eligible anymore
5. Overcollateralization
6. Transparency requirements moved to Directive

78
Regulation4. Overcollateralization
a) 5% limit as in the EBA Report
b) Possibility to go lower only if prudential methods to evaluate assets are in place
c) In any case not lower than 2% (nominal method)
79
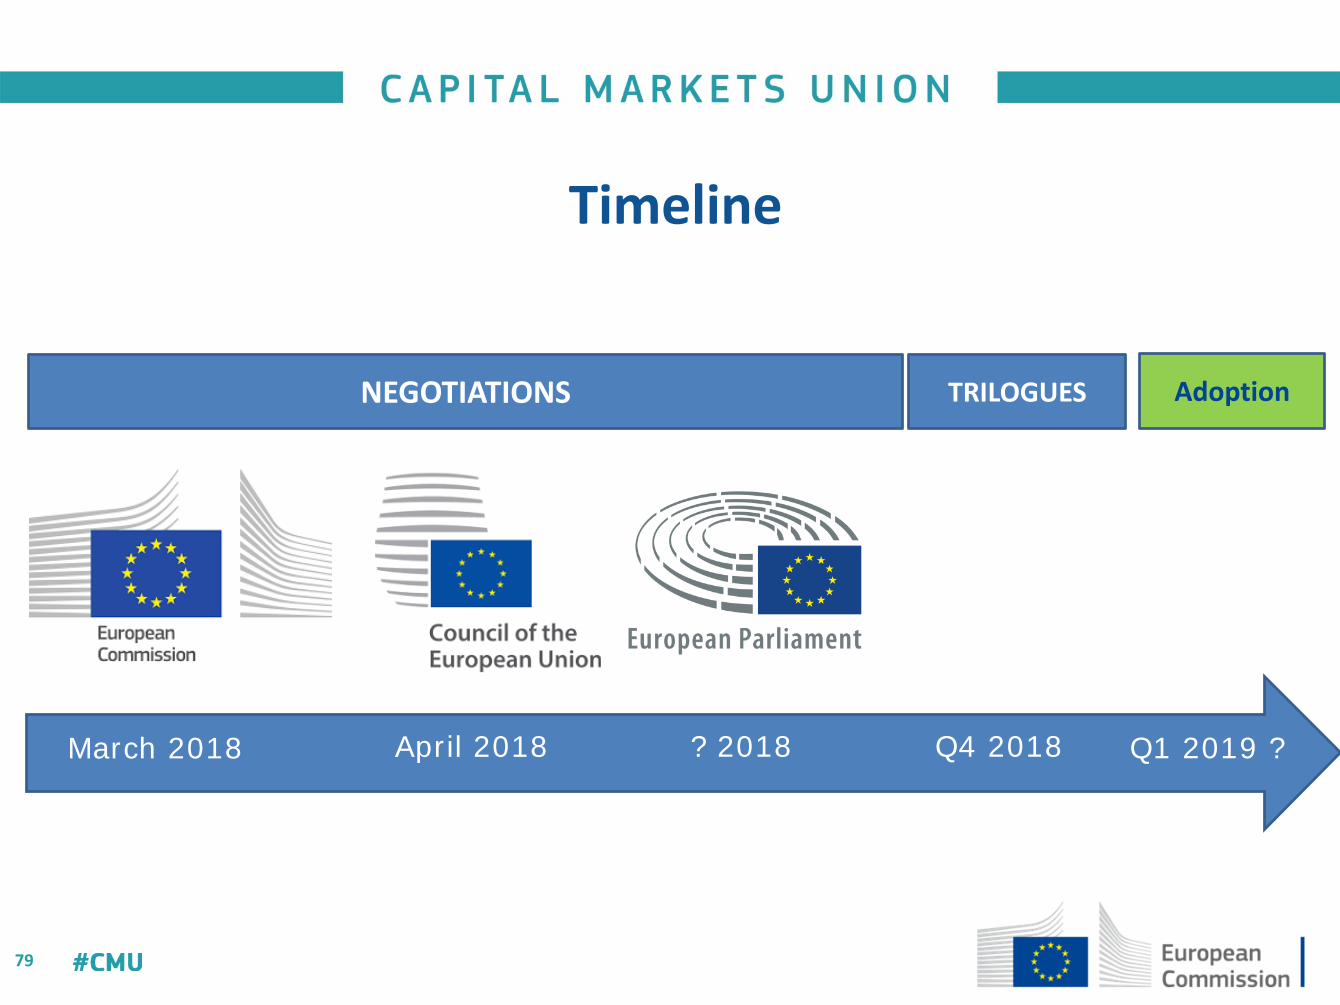
March 2018 April 2018 Q4 2018? 2018
NEGOTIATIONS TRILOGUES Adoption
Q1 2019 ?
Timeline
80
Key challenges for the negotiation
• Limited time for negotiation but could be positive aswell
• Limits of the principle-based approach: ex. article 6 oneligible assets
• Need to maintain a common denominator that makessense and improve the quality of the product →challenge of the national transposition process

81
Thank you!

European Mortgage Federation – European Covered Bond Council
Second Panel Discussion: Covered Bonds in Europe: A Common Framework for Covered Bonds
Panel Moderator
Luca Bertalot,EMF-ECBC
Didier MillerotEuropean Commission
Morten Bækmand NielsenNykredit & Chairman of ECBC Technical Issues Working Group
Boudewijn DierickBNP Paribas & Moderator of ECBC European Secured Notes (ESN) Task Force
Wolfgang Kälberervdp
Anne CarisBanque Pictet
Friedrich LuithlenDZ Bank AG

The Investor’s Perspective
Anne CarisBanquet Pictet
Vancouver – 18 April 2018

Investor’s Perspective
Pictet
Anne Caris
18th AprilEuropean Covered Bond Council Plenary Meeting, Vancouver
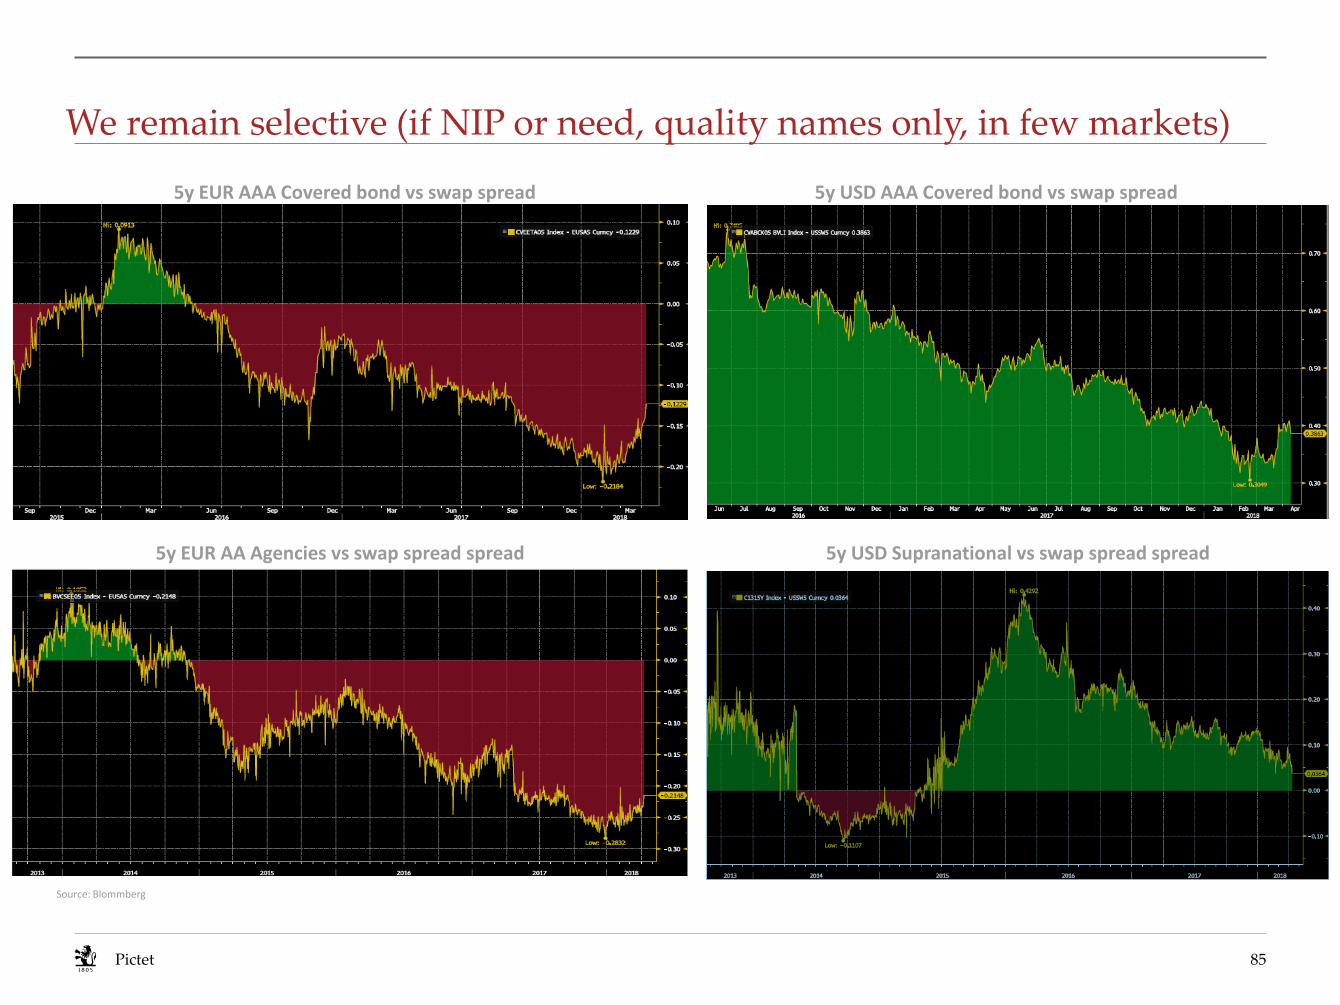
We remain selective (if NIP or need, quality names only, in few markets)
85Pictet
5y EUR AAA Covered bond vs swap spread 5y USD AAA Covered bond vs swap spread
5y EUR AA Agencies vs swap spread spread 5y USD Supranational vs swap spread spread
Source: Blommberg

End of ECB QE: possible benefits are still uncertain
• QE end yet to be announced + material reinvestment needs anyway
• Our investment focus = outsideperipheral markets which shouldcorrect the most
• Other headwinds = wideninginvestor base & limited supply
86Pictet

Regulatory treatment is critical in our investment strategy unsurprisingly
The global covered bond market is not yet a level playing field
Repo eligibility: sustained major discrepancies between central banks, including in new markets
LCR recognition: diverging preferential treatment – another constraint on top of our own investmentcriteria – with the EU still being the most favourable
Proposed EC Covered Bond Directive & Regulation:
• An important step confirming the EU willingness to safeguard a critical bank funding tool
• Positively, some key features being clarified (o/w liquidity buffer, maturity extension, public supervision)
• Key issues = (1) traditional assets only; (2) third-country regimes; (3) no confusion around coveredbond labels & their purpose
87Pictet

ECBC Covered Bond Label: how does it help?
• Not a certification regarding quality
• Improved transparency
• Free access to information in a harmonised way, while upgradeable upon market needs
• User friendly
88Pictet

Canadian covered bonds – outlook
• Among the least mis-priced as a non-EU market, although with possible headline risks
• Sound fundamentals overall expected to provide some degree of resilience vs housing & macroeconomic vulnerabilities
• To watch: (1) housing market; (2) indebtness vs interest rate rise; (3) unemployment risks esp. in light of NAFTA negotiations
• Important mitigating factors:
• Strengthened & hands-on regulation / supervision
• Healthy banks overall
• Conservative underwriting criteria + high quality cover pools by legislation
• Limited rating risks
89Pictet

27th ECBC PLENARY MEETING 18 APRIL 2018 VANCOUVER, CANADA

Introductory Speech
Jacek KubasPrincipal, Local Currency and Capital Markets Development, EBRD
Vancouver – 18 April 2018

Jacek Kubas
18 of April Vancouver, 2018
EBRD & the World of Emerging Markets Covered Bonds

Our Mission
26 April, 2018 93
Why are we here
To develop open and sustainable market economies in countries committed to and applying
democratic principles.

The EBRD – welcome to our world
26 April, 2018 94

What we do
26 April, 2018 95
The EBRD invests to build up effective market economies in countries across three continents and to make a positive impact on people’s lives.
With a focus on private sector investment and support for policy reform, we work to ensure that economies in our regions are competitive, inclusive, well-governed, green, resilientand integrated.

GreenBuilding green, sustainable market
economies which preserve the environment and protect the interests of future
generations.
ResilientBuilding resilient market economies that can
withstand turbulence and shocks.
InclusiveBuilding inclusive market economies which
ensure equal economic opportunity for all and leave no group behind.
IntegratedBuilding geographically integrated domestic
and international markets for goods, services, capital and labour.
Well-governedPromoting the rule of law, transparency, and
accountability, and stimulating firms to adequately safeguard and balance the
interests of their stakeholders.
CompetitiveBuilding dynamic and open markets that
stimulate competition, entrepreneurship and productivity growth.
Our transition qualities
26 April, 2018 96
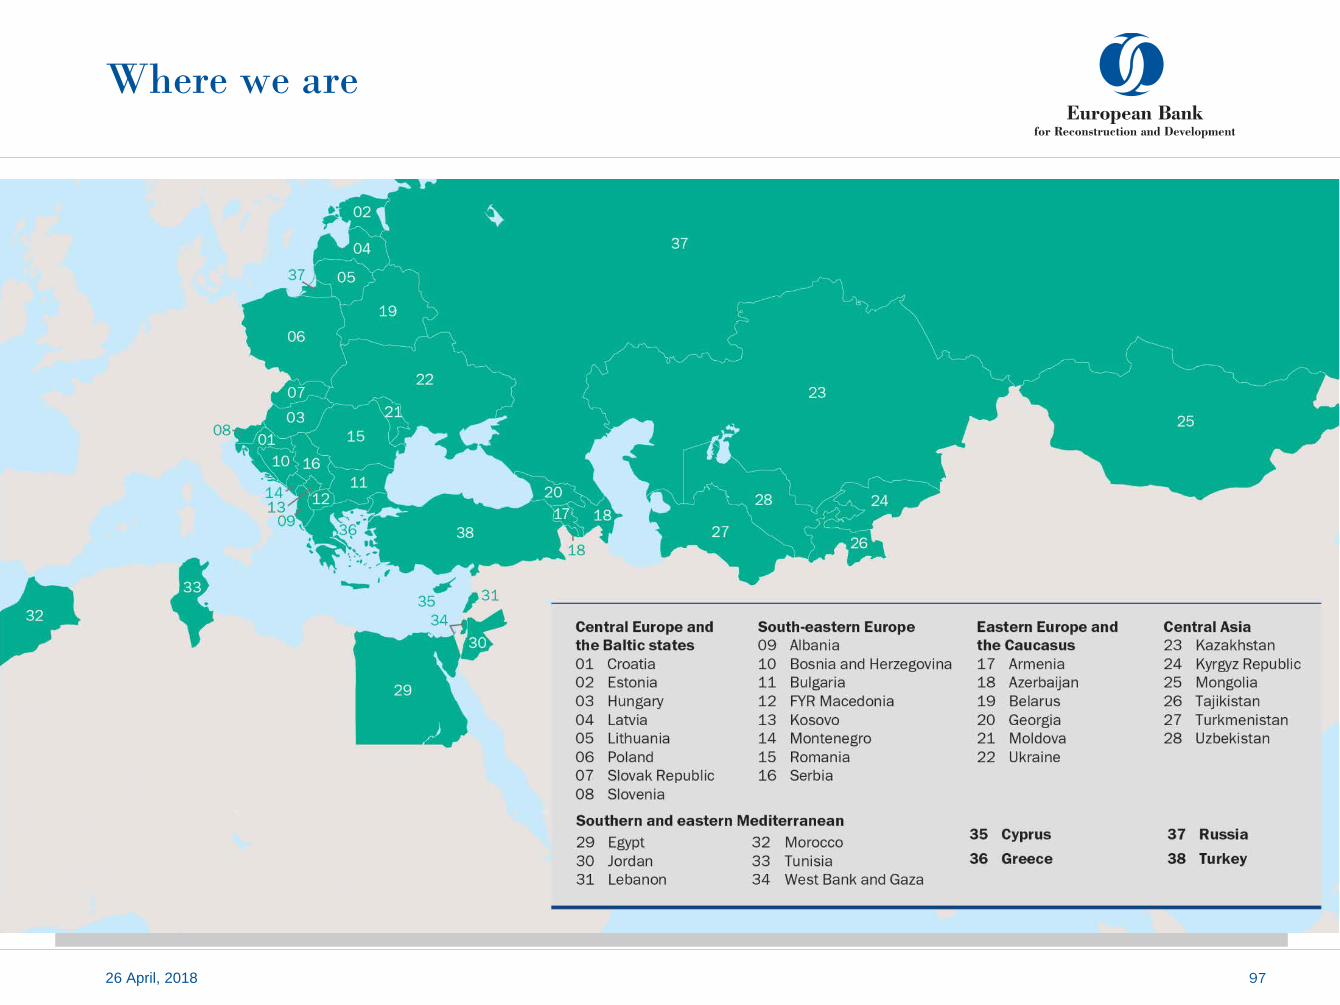
Where we are
26 April, 2018 97

64%
8%
10%
9%
9%
Shareholding
26 April, 2018 98
Established in 1991.
The EBRD is owned by 66 countries from five continents, as well as the European Union and the European Investment Bank. These shareholders have each made a capital contribution, which forms our core funding.
Capital base of €30 billion
The EBRD has a triple-A rating from all three main rating agencies (S&P, Moody’s and Fitch)
As at January 2018
EBRD regionExcluding EU, Russia at 4%
USA
EU27 countriesIncludes European Community and European Investment Bank (EIB) each at 3%. Among other EU countries: France, Germany, Italy, and the UK each holds 8.6%
Japan Other

0
50
100
150
200
250
300
350
400
450
0
2
4
6
8
10
12
'13 '14 '15 '16 '17
Annual Bank Investment and Operations
ABI ( € billion, reported rate)
Number of operations (#)
Results
26 April, 2018 99
At a glanceNet cumulative Bank investment€119.6 billion (since 1991)
€9.67 billion (in 2017)
Number of projects5,035 (since 1991)
412 (in 2017)
Cumulative disbursements€91.5 billion
Private sector share of cumulative investment79%
“Total project value” is the total amount of finance provided to a project, including both EBRD and non-EBRD finance, and is reported in the year in which the project first signs. EBRD financing may be committed over more than one year with “annual Bank investment” (ABI) reflecting EBRD finance by year of commitment. The amount of finance to be provided by non-EBRD parties is reported in the year the project first signs.
As at December 2017

26 April, 2018 100
EBRD
And
Covered Bonds

Covered bonds can provide several key benefits to EBRD’s transition economies.
101
These fund longer-term assets in a way which is cost effective, and relatively delinked from their owncredit rating covered bonds contribute to the stability of the banking system.
New In progress
Poland
Romania
Slovakia
Turkey
Croatia
Estonia
Latvia
Lithuania
Hungary

How does EBRD work on Covered Bonds?
102
The EBRD actively engages in the development of covered bonds markets in its countries of operations. The Bank supports this through all available tools:
OurProduct
Policy dialogue
Technical cooperation projects
Investment

Policy Dialogue
103
The EBRD carries out Policy dialogue in a number of countries
CURRENT ENGAGEMENT
ENGAGEMENT
FOLLOW UP
We try to engage and advise in drafting of newlegislation or proposing legal and regulatory reforms.
Many of our technical cooperation projects are derivedfrom policy dialogue efforts that have lead to MOUs -including the Pan Baltic Regional Capital MarketDevelopment MOU
We collaborate with market participants andindustry associations to discuss Covered Bondframeworks with the Governments of our Countriesof Operation
.
We are currently engaged in Policy Dialogue withHungary, Armenia & Ukraine
COLLABORATION

Technical Cooperation
104
Our Technical Cooperation (“TC”) projects focus on reforming, creating and designing Covered Bond legal and regulatory frameworks and appropriate infrastructure.
Completed Ongoing
Poland Croatia
Slovakia Lithuania
Romania Latvia
Estonia
Pan Baltic Framework
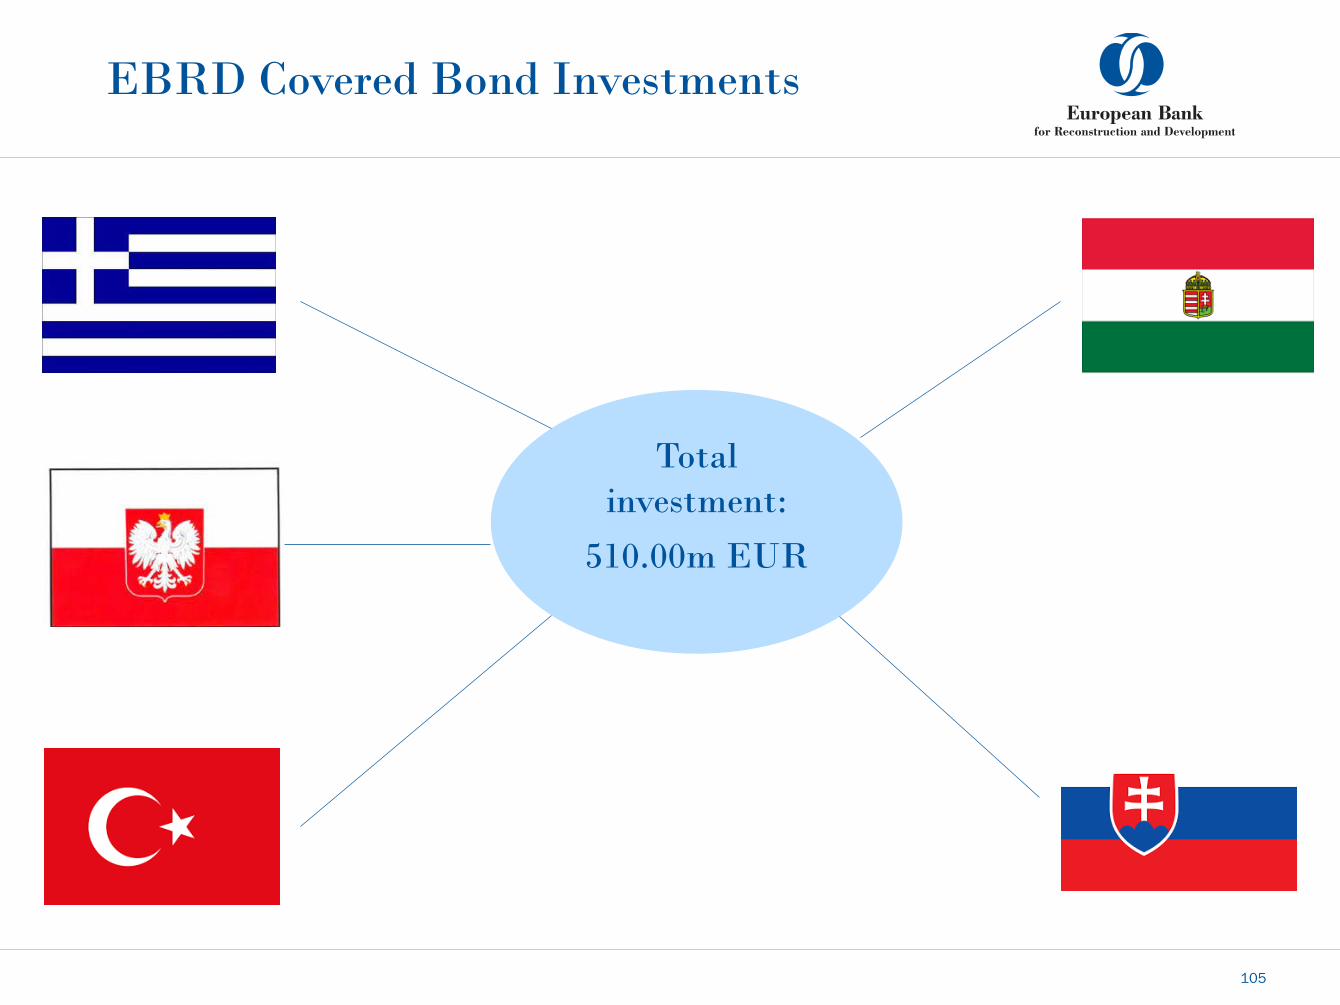
EBRD Covered Bond Investments
105
Total investment:
510.00m EUR
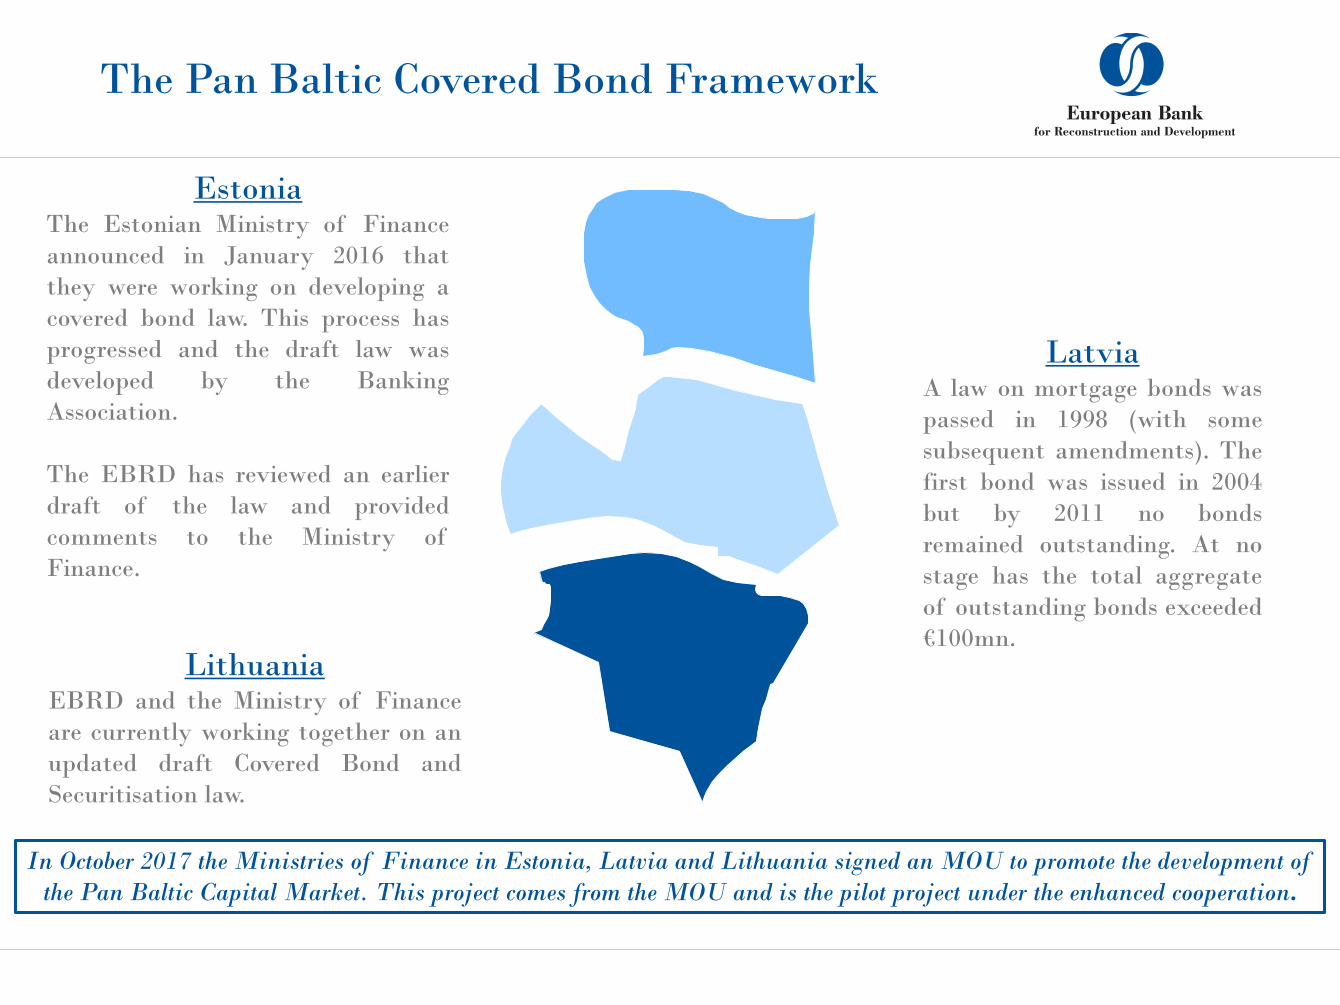
The Pan Baltic Covered Bond Framework
EstoniaThe Estonian Ministry of Financeannounced in January 2016 thatthey were working on developing acovered bond law. This process hasprogressed and the draft law wasdeveloped by the BankingAssociation.
The EBRD has reviewed an earlierdraft of the law and providedcomments to the Ministry ofFinance.
LatviaA law on mortgage bonds waspassed in 1998 (with somesubsequent amendments). Thefirst bond was issued in 2004but by 2011 no bondsremained outstanding. At nostage has the total aggregateof outstanding bonds exceeded€100mn.
LithuaniaEBRD and the Ministry of Financeare currently working together on anupdated draft Covered Bond andSecuritisation law.
In October 2017 the Ministries of Finance in Estonia, Latvia and Lithuania signed an MOU to promote the development of the Pan Baltic Capital Market. This project comes from the MOU and is the pilot project under the enhanced cooperation.

Structure: three equivalent laws –taking assets from all three countries
• For example: An Estonia based bank uses the Estonian covered bond law• Estonian covered bond law allows Latvian and Lithuanian assets to be used• Latvian and Lithuanian law facilitate the transfer of assets to Estonia
Mortgage book
Assets
Investor
Bond
Estonia Latvia Lithuania
Bond Bond
Covered bond programme Mortgage book
Assets

26 April, 2018 108

Contacts
26 April 2018 21
NameJacek KubasLocal Currency and Capital MarketTel: + 44 020 7338 7495Email: [email protected]
EBRD, One Exchange SquareLondon, EC2A 2JN United Kingdomwww.ebrd.com
Find us on social media

Disclaimer
110
This information is provided for discussion purposes only, may not be reproduced or redistributed anddoes not constitute an invitation or offer to subscribe for or purchase any securities, products orservices. No responsibility is accepted in respect of this presentation by its author, the European Bankfor Reconstruction and Development (the "Bank") or any of its directors or employees (together withthe author and the Bank, the "EBRD") for its contents. The information herein is presented insummary form and does not attempt to give a complete picture of any market, financial, legal and/orother issues summarised or discussed. The EBRD is not acting as your advisor or agent and shall haveno liability, contingent or otherwise, for the quality, accuracy, timeliness, continued availability orcompleteness of the information, data, calculations nor for any special, indirect, incidental orconsequential damages which may be experienced because of the use of the material made availableherein. This material is provided on the understanding that (a) you have sufficient knowledge andexperience to understand the contents thereof; and (b) you are not relying on us for advice orrecommendations of any kind (including without limitation advice relating to economic, legal, tax,regulatory and/or accounting risks and consequences) and that any decision to adopt a strategy, dealin any financial product or enter into any transaction is based upon your own analysis or that of yourprofessional advisors, whom you shall consult as you deem necessary.

European Mortgage Federation – European Covered Bond Council
Third Panel Discussion: Covered Bonds in Emerging Markets: Focus on Eastern Europe
Panel Moderator
André KüüsvekEBRD
Jacek KubasEBRD
Jakub NiesluchowskiPKO BH
Joost BeaumontABN AMRO
Richard KemmishRichard Kemmish Consulting
Matthias MelmsNord/ LB

Housing Markets in the United States
Chrissa PagitsasFannie Mae
Vancouver – 18 April 2018

© 2018 Fannie Mae. Trademarks of Fannie Mae. 113
Housing Markets in the U.S.and Fannie Mae Green Financing
European Covered Bond Council
Vancouver, B.C.
April 18, 2018

© 2018 Fannie Mae. Trademarks of Fannie Mae. 114
U.S. Housing Market and Fannie Mae
Housing and Mortgage Market Update

© 2018 Fannie Mae. Trademarks of Fannie Mae. 115Source: Census Bureau, National Association of REALTORS®, Fannie Mae, Federal Reserve
US Housing Demographics
2017Households (thousands) 119,272
Owners 76,170 Renters 43,102
Homeownership Rate 63.9%
Owner Households (thousands, 2016) 75,022 With Mortgages 47,295 Debt Free 27,727
Existing Home Sales (thousands) 5,536 New Homes Sales (thousands) 615
Median Existing Homes Sale Price $ 245,950 Median New Home Sale Price $ 323,200
Purchase Mortgage Originations (billions) $ 1,133 Refinance Originations (billions) $ 698
© 2018 Fannie Mae. Trademarks of Fannie Mae. 116
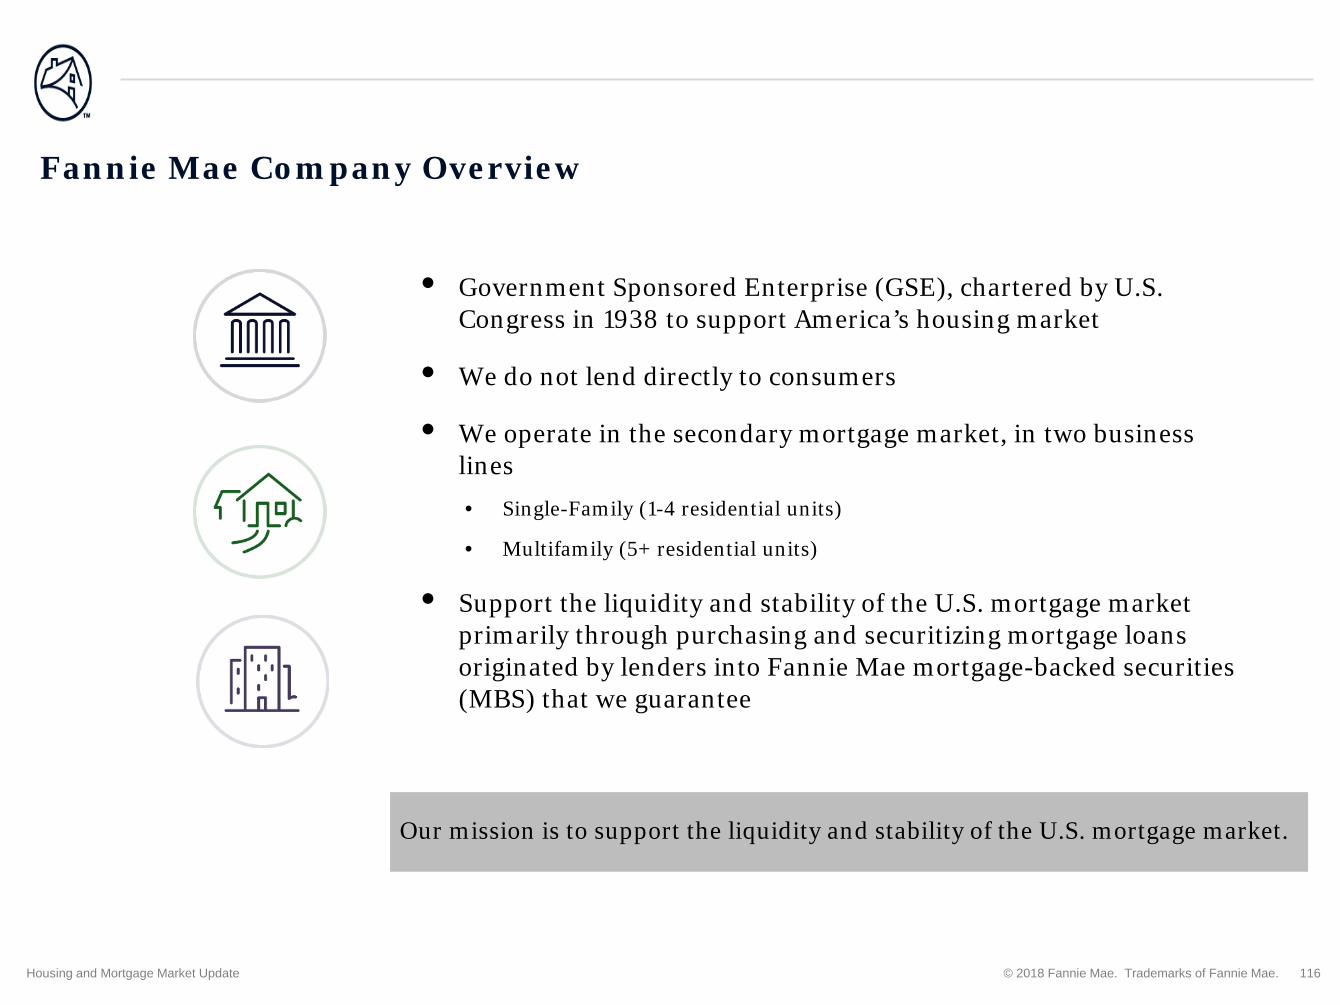
Fannie Mae Company Overview
Housing and Mortgage Market Update
• Government Sponsored Enterprise (GSE), chartered by U.S. Congress in 1938 to support America’s housing market
• We do not lend directly to consumers
• We operate in the secondary mortgage market, in two business lines• Single-Family (1-4 residential units)
• Multifamily (5+ residential units)
• Support the liquidity and stability of the U.S. mortgage market primarily through purchasing and securitizing mortgage loans originated by lenders into Fannie Mae mortgage-backed securities (MBS) that we guarantee
Our mission is to support the liquidity and stability of the U.S. mortgage market.

© 2018 Fannie Mae. Trademarks of Fannie Mae. 117
Fannie Mae Credit Guaranty Business Model
Source: Freddie Mac, Fannie Mae, US Treasury
LenderOriginates Loans
Fannie MaeGuarantees Loans
InvestorPurchases MBS
Assumes interest rate riskMBS
Delivers loansServices loans
Pays guaranty fee
Fannie Mae retains interest rate risk and credit
risk on MBS
Sold to Investor
Credit-Linked Debt Credit
InvestorAssumes portion of
credit riskFannie Mae passes a
portion of credit risk to the investor

© 2018 Fannie Mae. Trademarks of Fannie Mae. 118Source: Federal Reserve
Mortgage-Backed Securities Make Up Majority of Single-Family Residential Mortgage Debt
*Whole loans held for investment on GSE balance sheets are included in the MBS figures
$2,506,094
$516,522
$2,900,634
$1,822,485
$1,833,912
$467,656
$-
$2,000,000
$4,000,000
$6,000,000
$8,000,000
$10,000,000
$12,000,000
'97 '98 '99 '00 '01 '02 '03 '04 '05 '06 '07 '08 '09 '10 '11 '12 '13 '14 '15 '16 '17
Mill
ions
Single Family First Lien Closed-Ended Mortgage Debt Outstanding
Book (only depositories but includes credit unions) Other FNMA FHLMC GNMA + Other Government Held PLS

© 2018 Fannie Mae. Trademarks of Fannie Mae. 119
US Fixed Income Market
Housing and Mortgage Market Update

© 2018 Fannie Mae. Trademarks of Fannie Mae. 120
Overview of U.S. Fixed Income Asset Classes
*Includes Agency MBS (Fannie Mae, Freddie Mac, Ginnie Mae) ($6,924.3), Agency CMO ($1,080.8), Non-Agency RMBS ($782.6), Non-Agency CMBS ($507.7)Source: SIFMA
Money Markets, 966, 2% Asset-backed,
1,448, 4%
Treasury, 14,469, 35%
Agency Debt, 1,935, 5%
Mortgage-Related*,
9,295, 23%
Municipal, 3,851, 9%
Corporate Debt, 8,826, 22%
As of Q4 2017 ($billions)
© 2018 Fannie Mae. Trademarks of Fannie Mae. 121
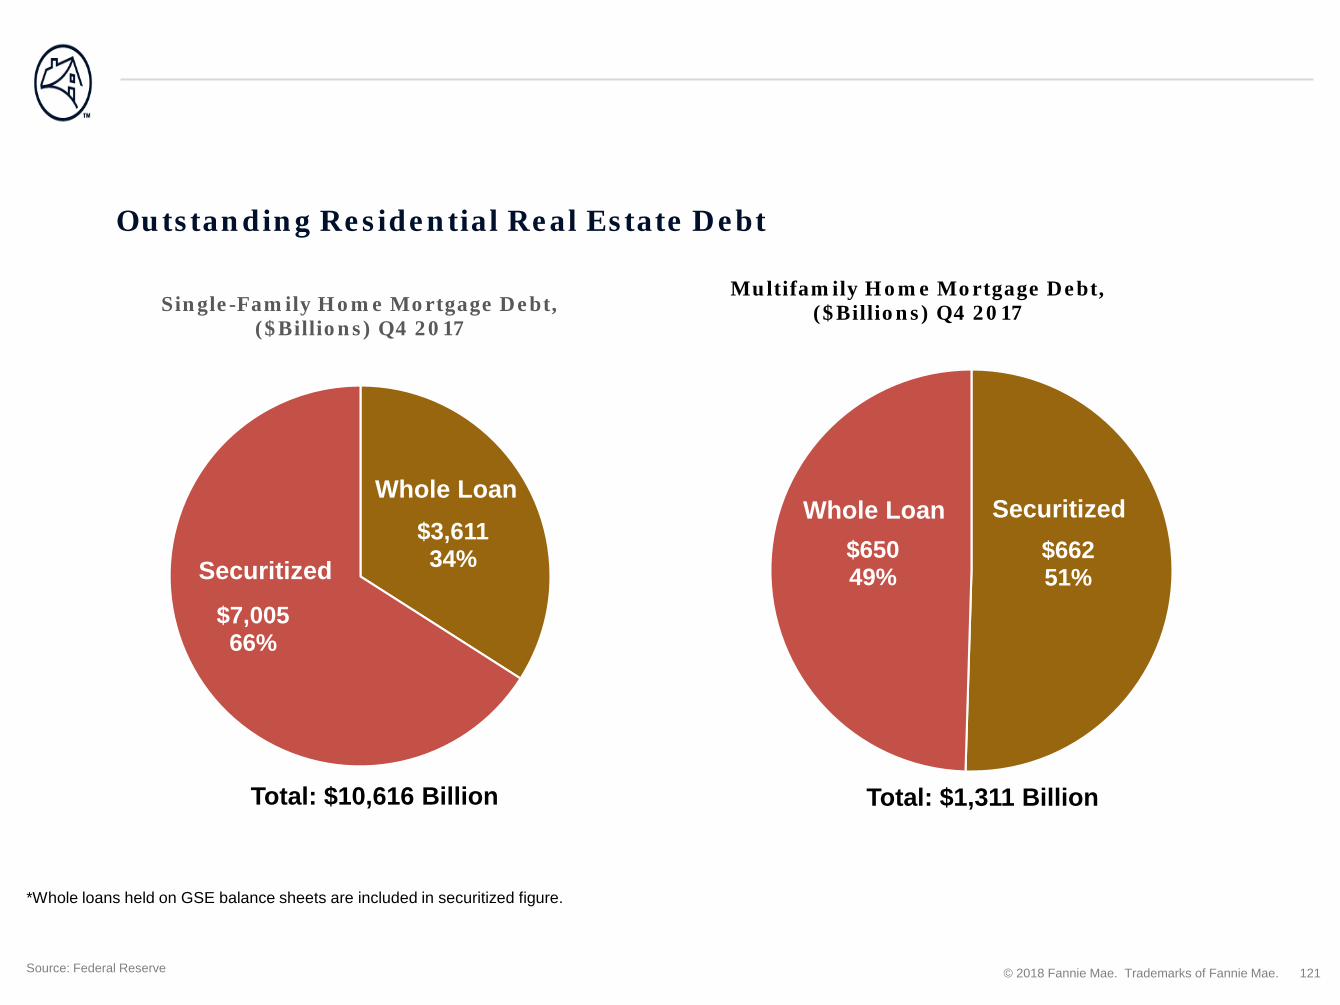
$3,61134%
$7,00566%
Single-Family Home Mortgage Debt, ($Billions) Q4 2017
$66251%
$65049%
Multifamily Home Mortgage Debt, ($Billions) Q4 2017
Source: Federal Reserve
Outstanding Residential Real Estate Debt
Total: $10,616 Billion Total: $1,311 Billion
*Whole loans held on GSE balance sheets are included in securitized figure.
Whole Loan
Securitized
Whole Loan Securitized

© 2018 Fannie Mae. Trademarks of Fannie Mae. 122
Fannie Mae41%
Freddie Mac26%
Ginnie Mae26%
PLS7%
Securitized* SF First Lien Mortgage Debt ($Trillions, Q4 2017)
Source: Federal Reserve
Securitized SF First Lien Closed End Residential Mortgage Debt
Total: $7.02 Trillion

© 2018 Fannie Mae. Trademarks of Fannie Mae. 123
$2,42527.4%
$1,76920.0%$1,320
14.9%
$1,00711.4%
Insurance Companies, $488
Houshold Sector, $454
State and Federal Government (non
pension), $451
Private and Public Pensions, $310 GSEs,
$269
REITS, $251Other, $113
Source: Federal Reserve
Agency SF MBS by Investor Type*
*Also includes non-MBS Agency debt Securities
Banks and Credit Unions
Money Market and Mutual Funds
ForeignFederal Reserve

© 2018 Fannie Mae. Trademarks of Fannie Mae. 124
Source: US Treasury
Foreign Investor Holdings of US Agency SF and MF MBS By Country
$22726.5%
$22124.9%$177
19.9%
$11212.6%
$788.8%
$738.2%
Total: $888 Billionof which $382 Billion held by official institutions
Taiwan
Japan
China
Rest of World
Asia less China, Japan, Taiwan
Europe
Agency MBS Holdings ($Billions, Q2 2017)
© 2018 Fannie Mae. Trademarks of Fannie Mae. 125
Multifamily Market Outlook
Housing and Mortgage Market Update
© 2018 Fannie Mae. Trademarks of Fannie Mae. 126
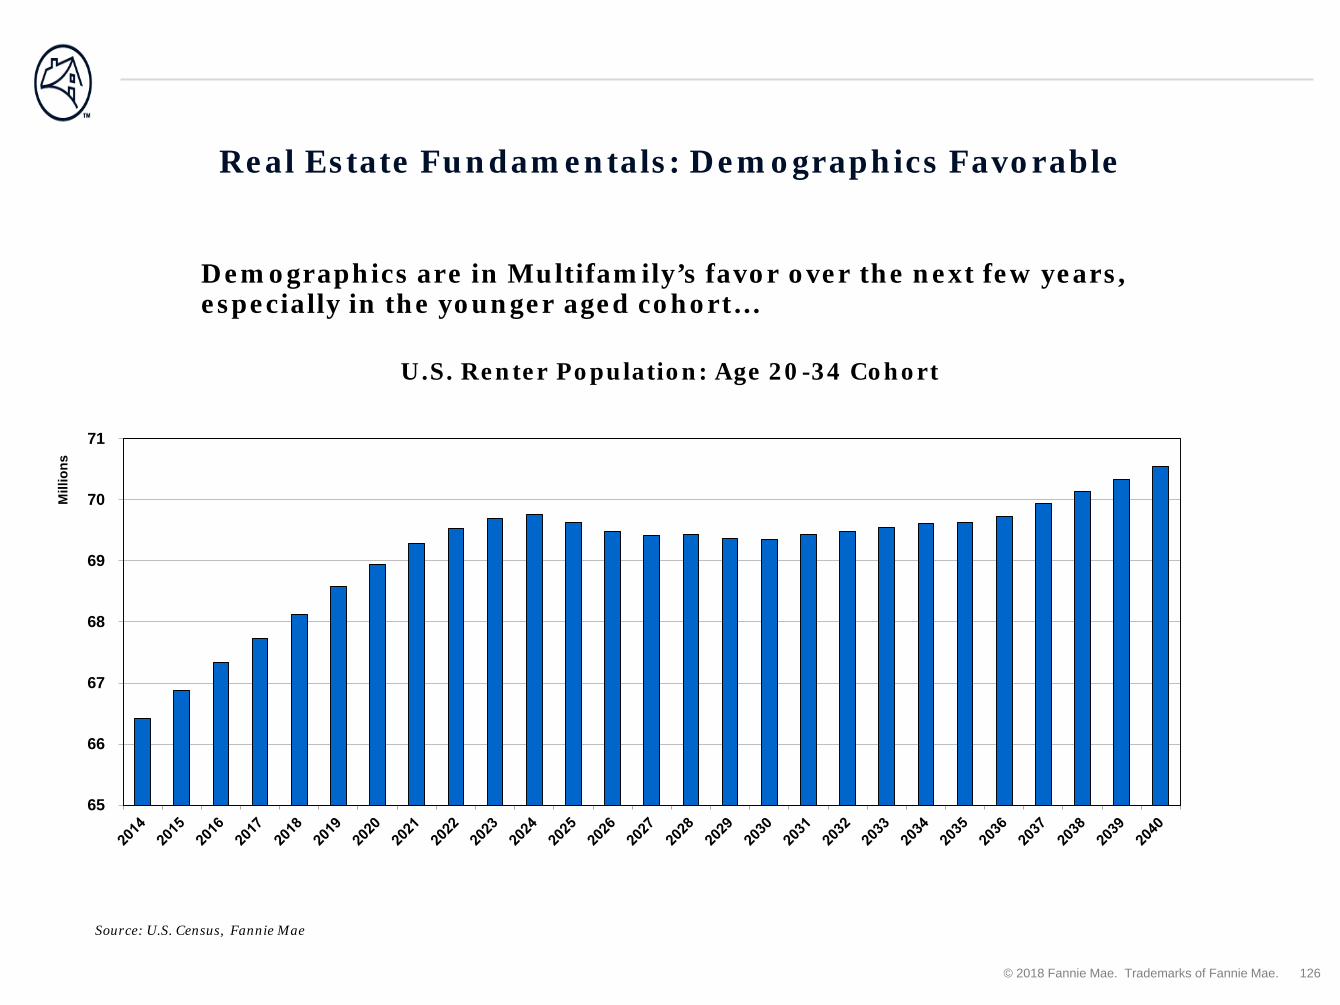
U.S. Renter Population: Age 20-34 Cohort
Demographics are in Multifamily’s favor over the next few years, especially in the younger aged cohort…
Real Estate Fundamentals: Demographics Favorable
Source: U.S. Census, Fannie Mae
65
66
67
68
69
70
71
Mill
ions
© 2018 Fannie Mae. Trademarks of Fannie Mae. 127
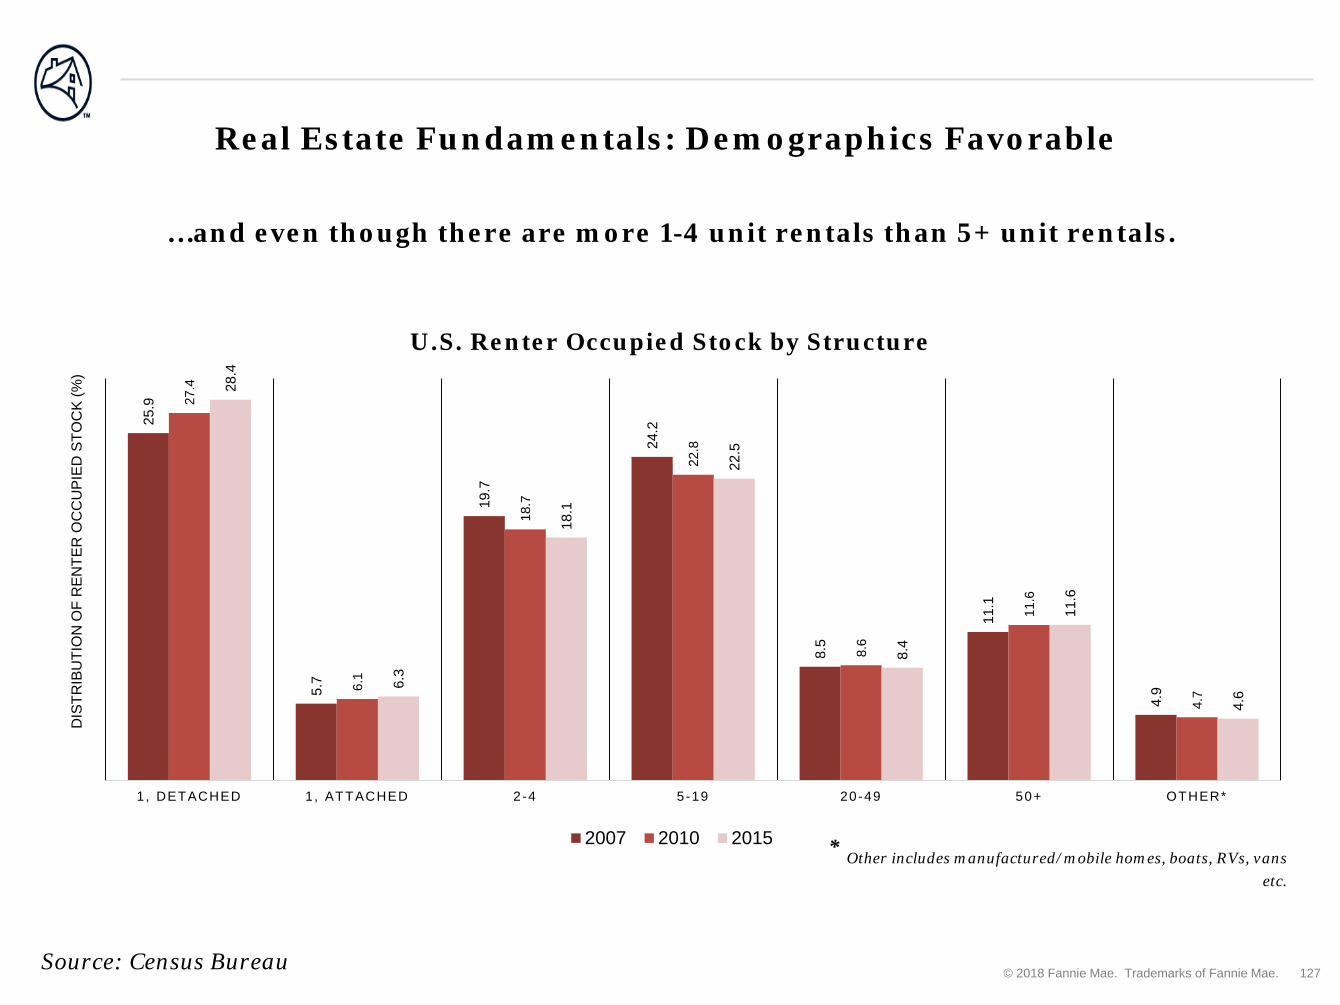
25.9
5.7
19.7
24.2
8.5
11.1
4.9
27.4
6.1
18.7
22.8
8.6
11.6
4.7
28.4
6.3
18.1
22.5
8.4
11.6
4.6
1 , DETACHED 1, ATTACHED 2-4 5-19 20-49 50+ OTHER*
DIS
TRIB
UTI
ON
OF
REN
TER
OC
CU
PIED
STO
CK
(%)
2007 2010 2015
…and even though there are more 1-4 unit rentals than 5+ unit rentals.
Real Estate Fundamentals: Demographics Favorable
Source: Census Bureau
U.S. Renter Occupied Stock by Structure
* Other includes manufactured/mobile homes, boats, RVs, vans etc.

© 2018 Fannie Mae. Trademarks of Fannie Mae. 128
Real Estate Fundamentals: Continued Demand
National estimated multifamily vacancy rates are slowly inching up...
Estimated National Rent Level and Vacancy Rate
Source: Fannie Mae Multifamily Economics and Market Research Estimates
3.0%
4.0%
5.0%
6.0%
7.0%
8.0%
9.0%
$925
$975
$1,025
$1,075
$1,125
$1,175
$1,225
$1,275
Rent Level
Vacancy Rate
$1,233
5.5%

© 2018 Fannie Mae. Trademarks of Fannie Mae. 129
5.3%
5.5%
5.7%
5.9%
6.1%
6.3%
6.5%
6.7%
6.9%
7.1%
7.3%
$0
$10
$20
$30
$40
$50
$60
Billio
ns
Sales
Cap Rates
Real Estate Fundamentals: Multifamily Investment
National Apartment Sales Volume and Cap Rates
…and investors are being more selective about purchasing multifamily buildings.
Source: Real Capital Analytics
2H 2017:
$86 B
Q4 2017:
5.6%

© 2018 Fannie Mae. Trademarks of Fannie Mae. 130
Real Estate Fundamentals: Supply and DemandMultifamily starts remain slightly ahead of recent historic average levels.
Multifamily (5+ units) Starts(3 month moving average)
Source: U.S. Department of Commerce, Bureau of the Census, per Moody’s Analytics
1989 – 2008 Average
0
200
400
600
800
1,000
1,200
(000
s)

© 2018 Fannie Mae. Trademarks of Fannie Mae. 131
Fannie Mae Green Financing
Housing and Mortgage Market Update

© 2018 Fannie Mae. Trademarks of Fannie Mae. 132
What is Fannie Mae Multifamily Green Financing?
Fannie Mae offers Green Mortgage Financing for:
Energy and Water Efficiency
Green Building Certifications
Solar & Combined Heat/Power Systems
Solar systems generate Solar Renewable Energy Credits (SRECs) for owner and potentially for tenants
Efficiency measures lower energy and water expenses for owner and tenants
Green Building Certifications may result in lower operations costs

© 2018 Fannie Mae. Trademarks of Fannie Mae. 133
Fannie Mae Green product volumes increased in 2017 as the program developed, incentives, were aligned and more borrowers were attracted to the products.
Fannie Mae Green MBS Issuance and Cash Loans (2012 – 2017)
*Included in the Bloomberg Barclays MSCI Green Bond Index
Growth of Fannie Mae Green Financing
© 2018 Fannie Mae. Trademarks of Fannie Mae. 134
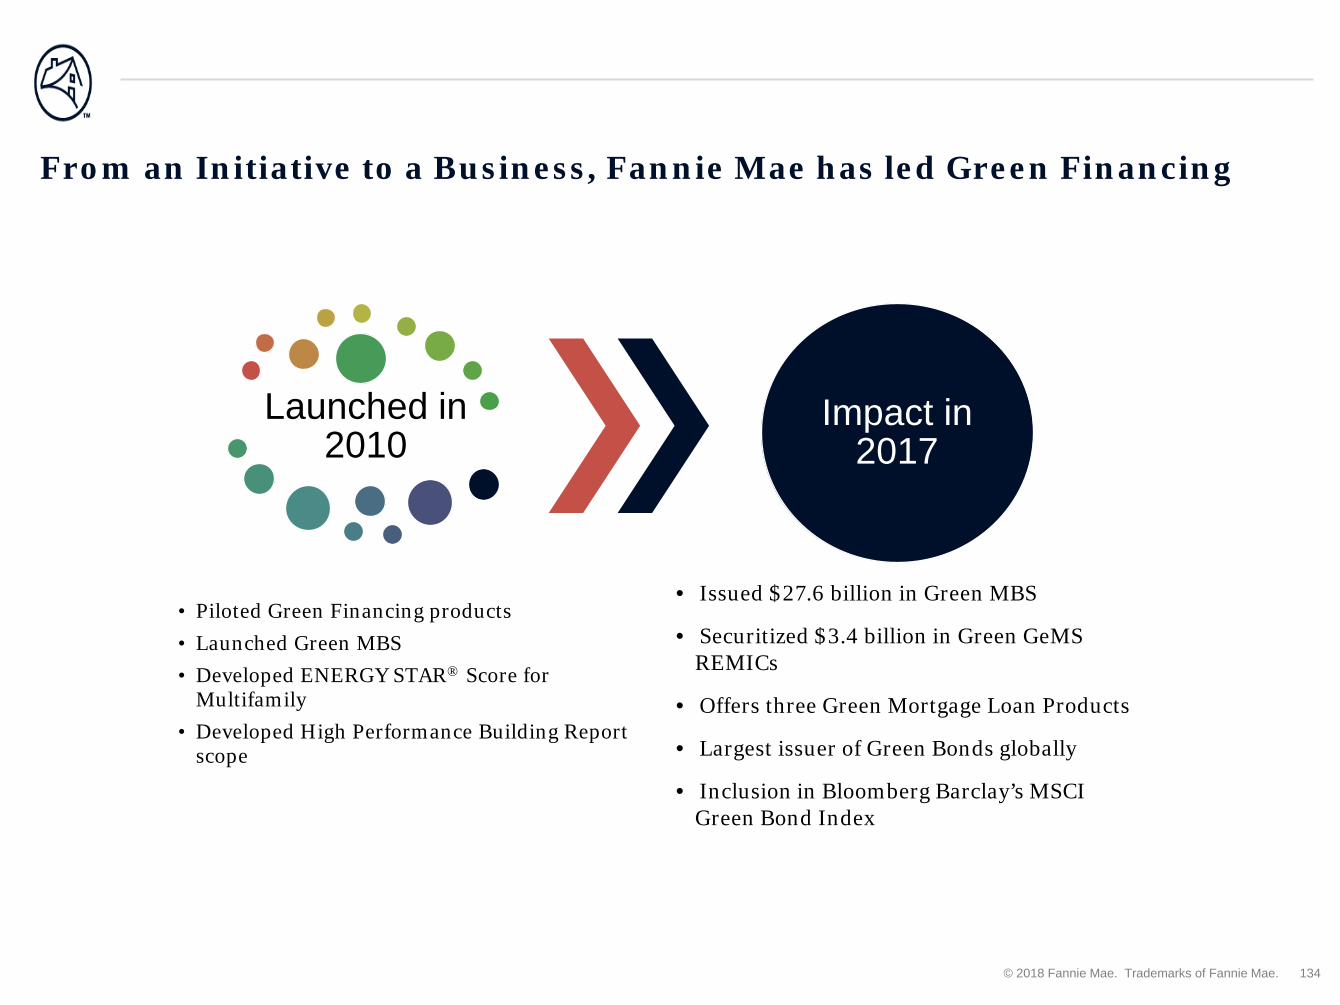
Launched in 2010
• Piloted Green Financing products• Launched Green MBS• Developed ENERGY STAR® Score for
Multifamily• Developed High Performance Building Report
scope
Impact in 2017
• Issued $27.6 billion in Green MBS
• Securitized $3.4 billion in Green GeMS REMICs
• Offers three Green Mortgage Loan Products
• Largest issuer of Green Bonds globally
• Inclusion in Bloomberg Barclay’s MSCI Green Bond Index
From an Initiative to a Business, Fannie Mae has led Green Financing

© 2018 Fannie Mae. Trademarks of Fannie Mae. 135
Per the Triple Bottom Line, Green Rewards loans through YE 2017:
Positive Impact of Fannie Mae’s Green Rewards Portfolio
Financial
• Reduce utility bills by $53 million across portfolio
• Save $49,000 on average energy and water cost reduction annually per property
Social
• Provide more than 248,000 units improved, more comfortable homes
• Save $131 on average annually on energy and water cost reduction per family
Environmental
• Save electricity to power 80 million cell phones
• Save fuel to heat 27 million showers
• Save water to fill 42 billion glasses

© 2018 Fannie Mae. Trademarks of Fannie Mae. 136
Thank you
Contact info:
Chrissa PagitsasDirector, Fannie Mae [email protected]
Housing and Mortgage Market Update

Introductory Speech
Loïc ChiquierWorld Bank Group
Vancouver – 18 April 2018

Depth of housing finance markets: a contrasted picture
138
0%
20%
40%
60%
80%
100%
120%
Denm
ark
Aust
ralia
Uni
ted
Stat
esCa
nada
Sing
apor
eBe
lgiu
mFi
nlan
dLa
tvia
Aust
riaPa
nam
aSa
moa
Thai
land
Chile
Hung
ary
Pola
ndEl
Sal
vado
rTu
nisia
Brun
ei D
arus
sala
mBa
hrai
nKo
sovo
Dom
inic
an R
epub
licSe
yche
lles
Mon
golia
Alba
nia
Russ
ian
Fede
ratio
nG
uate
mal
aJa
mai
caAl
geria
Om
anTo
goRe
publ
ic o
f Mol
dova
Tanz
ania
Chin
aIra
qAf
ghan
ista
nN
epal
Djib
outi
Syria
n Ar
ab R
epub
licAn
gola
Bosn
ia a
nd H
erze
govi
naHa
itiPa
kist
anHo
ndur
asZa
mbi
aPe
ruYe
men
Nig
erLe
soth
oVe
nezu
ela
(Bol
ivar
ian
Repu
blic
of)
Tajik
istan
Cong
oAr
uba
Antig
ua a
nd B
arbu
daBh
utan
Cuba
Dom
inic
aFa
eroe
Isla
nds
Gam
bia
Gre
nada
Guy
ana
Sain
t Kitt
s and
Nev
isLi
echt
enst
ein
Mar
shal
l Isl
ands
May
otte
Pala
uFr
ench
Pol
ynes
iaSa
o To
me
and
Prin
cipe
Turk
s and
Cai
cos I
sland
sTu
valu
Mortgage Debt-to-GDP Ratio
Mortgage Debt-to-GDP Ratio
43 Countries >15% of mortgage debt/GDP
17 Countries <15% but >5% mortgage debt/GDP
135 Countries <5% mortgage debt/GDP


European Mortgage Federation – European Covered Bond Council
Fourth Panel Discussion: Covered Bonds in Emerging Markets - Part II: Focus on Latin America, Eurasia & Africa
Panel Moderator
Loïc ChiquierWorld Bank
Filipe PontualABECIP
Cristina CostaSociété Générale
Antonio FarinaS&P Global Ratings Ltd
Masashi NiimuraJapan Housing Finance Agency
Vito NataleDBRS Ratings Ltd

Update on the European Central Bank’s (ECB) Covered Bond Purchase Programme (CBPP) 3
Ad VisserEuropean Central Bank (ECB)
Vancouver – 18 April 2018
Covered Bond markets from the ECB perspectiveEuropean Cover Bond Council plenary meetingVancouver18 April 2018.
Ad VisserHead of Financial Markets and Collateral SectionDirectorate General Market Operations
The views expressed are those of the presenter and do not necessarily reflect those of the ECB

Rubric
www.ecb.europa.eu ©
The long standing and historical role of covered bonds in Europe as a funding mechanism for credit institutions is well recognised.
• Among the largest private debt markets in Europe;
• Contributes to the bouquet of funding choices of banks;
• Transforms illiquid assets to liquid and tradable securities;
• Broad investor base, both in terms of geography and across sectors;
• Important in supporting long term economic growth;
• Well recognised in financial regulations and other frameworks– Preferential treatment in the CRR, LCR, exempted from bail-in, ECB
collateral eligible
• Highly relevant for the ECB in many respects
Relevance of covered bonds for Europe
ECB-Public

Rubric
www.ecb.europa.eu ©
Covered bonds mobilised as Eurosystem collateral
ECB-Public
0%
5%
10%
15%
20%
25%
30%
35%
0
100
200
300
400
500
Covered bonds as collateral (bn.)
Share of total mobilised collateral (rhs)
Share of eligible covered bonds (rhs)

Rubric
www.ecb.europa.eu ©
On 8 February 2018 ECB announced that from 16 April 2018 on:
• For haircut purposes the residual maturity for own-use covered bonds is defined as the maximum legal maturity, taking into account any extension rights for principal repayments contained in their terms and conditions.
• The Eurosystem may suspend, limit or exclude, on the grounds of prudence, access to monetary policy operations by counterparties that channel Eurosystem liquidity to another entity that belongs to the same banking “group” where the entity receiving such liquidity is (i) a non-eligible wind-down entity or (ii) subject to a discretionary measure on the grounds of prudence.
Recent ECB decisions possibly relevant for the covered bond market
ECB-Public

Rubric
www.ecb.europa.eu ©
Covered bond asset swap spreads
Covered bond spread development since the start of CBPP3
ECB-Public
Announcement CBPP3
Start purchases CBPP3
-40
-20
0
20
40
60
80
100
120
Aug-14 Aug-15 Aug-16 Aug-17
bpsES IE IT PT Announcement
CBPP3
Start purchases CBPP3
-25
-20
-15
-10
-5
0
5
10
15
20
25
30
Aug-14 Aug-15 Aug-16 Aug-17
bpsAT DE FI FR NL
Source: Markit iBoxx indices. Last observation: 6 April 2018.

Rubric
www.ecb.europa.eu ©
CBPP3 holdings 2014 - 2018
ECB-Public
0
50,000
100,000
150,000
200,000
250,000
300,000
Oct
-14
Nov
-14
Dec
-14
Jan-
15Fe
b-15
Mar
-15
Apr
-15
May
-15
Jun-
15Ju
l-15
Aug
-15
Sep-
15O
ct-1
5N
ov-1
5D
ec-1
5Ja
n-16
Feb-
16M
ar-1
6A
pr-1
6M
ay-1
6Ju
n-16
Jul-1
6A
ug-1
6Se
p-16
Oct
-16
Nov
-16
Dec
-16
Jan-
17Fe
b-17
Mar
-17
Apr
-17
May
-17
Jun-
17Ju
l-17
Aug
-17
Sep-
17O
ct-1
7N
ov-1
7D
ec-1
7Ja
n-18
Feb-
18M
ar-1
8
EUR mn Primary market holdings Secondary market holdings
Source: ECB website. Last observation: 31 March 2018.Notes: Figures net of redemptions and at amortised cost.
Monthly progress of CBPP3 purchases

Rubric
www.ecb.europa.eu149
Flexibility in monthly purchase amountsAsset purchase programmes overview
ECB-Public
Source: ECB website. Last observation: 31 March 2018.Notes: Figures at amortised cost.
0%
5%
10%
15%
20%
25%
0
10
20
30
40
50
60
70
80
90
100
Oct
Nov Dec Jan
Feb
Mar
Apr
May Jun
Jul
Aug Se
pO
ctN
ov Dec Jan
Feb
Mar
Apr
May Jun
Jul
Aug Se
pO
ctN
ov Dec Jan
Feb
Mar
Apr
May Jun
Jul
Aug Se
pO
ctN
ov Dec Jan
Feb
Mar
2014 2015 2016 2017 2018
EUR bnPSPP CSPP CBPP3 ABSPP Monthly target CBPP3 share (rhs)

Rubric
www.ecb.europa.eu ©
Commission proposals Proposals on covered bond directive and CRR amendments published on 12 March 2018• Too early to comment in substance now.• ECB opinion to be published in the near future.
In 2016 ECB already noted:• ECB in favour of high quality and transparent EU covered bond market,
potential for harmonisation of some standards and practices across EU• ECB sees merits in enhancements to covered bond frameworks that
promote further harmonisation of national regimes• In the medium to long term the ECB sees merit in the notion of a
comprehensive covered bond legal framework stipulating high standards
ECB-Public

Rubric
www.ecb.europa.eu ©
Thank you for your attention!
ECB-Public
European Mortgage Federation – European Covered Bond Council
Fifth Panel Discussion: Covered Bonds Beyond Quantitative Easing (QE)
Panel Moderator
Bill ThornhillGlobal Capital
Steffen DahmerJ.P. Morgan & Chairman of ECBC Market Related Issues Working Group
Hélène HeberleinFitch Ratings
Michael McCormickCredit Suisse
David JefferdsDealVector
Thomas CohrsNord/LB
CLOSING REMARKS
Luca BERTALOTSecretary General, EMF-ECBC
Vancouver – 18 April 2018

28th ECBC Plenary Meeting 12 September 2018, Munich
UPCOMING ECBC PLENARY
Vancouver – 18 April 2018

27th ECBC PLENARY MEETING 18 APRIL 2018 VANCOUVER, CANADA

Energy efficient Mortgages Action Plan (EeMAP) & Energy efficiency Data Portal & Protocol (EeDaPP) Panel
Event

This project has received funding from the European Union’s Horizon 2020 research and innovation programme under grant agreement No 746205.
Introduction
Luca BERTALOT
Secretary General, EMF-ECBC Coordinator, EeMAP & EeDaPP
Vancouver – 18 April 2018

ChrissaPagitsas
Fannie Mae
Christiaan PennekampHypoport
Joop HesselsABN AMRO
Marco Marijewycz
E.ON
Masashi Niimura
Japan Housing Finance Agency
Jennifer Johnson
EeMAP & EeDaPP
Energy efficient Mortgages Action Plan (EeMAP) & Energy efficiency Data Portal &
Protocol (EeDaPP) Panel Event
www.energyefficientmortgages.eu
Panel Moderator
Chris OstrowskiOfficial Monetary and Financial Institutions
Forum (OMFIF)
TorstenSchmidt
TXS Funding Solutions

This project has received funding from the European Union’s Horizon 2020 research and innovation programme under grant agreement No 746205.
Energy Efficient Mortgages Initiative
Closing Dinner
Organised in cooperation with the Canada Mortgage and Housing Corporation and EuromoneyConferences