27,777,777 shares evoqua water technologies...
TRANSCRIPT

13JUL201714031008
Subject to completion, dated October 18, 2017
PRELIMINARY PROSPECTUS
27,777,777 Shares
Evoqua Water Technologies Corp.Common Stock
This is an initial public offering of shares of common stock of Evoqua Water Technologies Corp.We are selling 8,333,333 shares of common stock, and the selling stockholders named herein are selling19,444,444 shares of common stock. We will not receive any of the proceeds from the shares ofcommon stock sold by the selling stockholders.
Prior to this offering, there has been no public market for our common stock. The initial publicoffering price is expected to be between $17.00 and $19.00 per share. We have applied to list ourcommon stock on the New York Stock Exchange (the ‘‘NYSE’’) under the symbol ‘‘AQUA.’’
The underwriters have an option for a period of 30 days to purchase up to a maximum of4,166,666 additional shares of our common stock from the selling stockholders.
After the completion of this offering, we expect to be a ‘‘controlled company’’ within the meaningof the corporate governance standards of the NYSE.
Investing in our common stock involves risk. See ‘‘Risk Factors’’ beginning onpage 28 to read about factors you should consider before buying shares of ourcommon stock.
Underwriting Proceeds, BeforeDiscounts and Proceeds, Before Expenses, to the
Price to Public Commissions(1) Expenses, to Us Selling Stockholders
Per Share . . . . . . . . . . . . . $ $ $ $
Total . . . . . . . . . . . . . . . . $ $ $ $
(1) See ‘‘Underwriting’’ for additional information regarding underwriting compensation.
Delivery of the shares of common stock will be made on or about , 2017.
Neither the Securities and Exchange Commission (‘‘SEC’’) nor any other regulatory body hasapproved or disapproved of these securities or determined if this prospectus is truthful or complete.Any representation to the contrary is a criminal offense.
Credit Suisse J.P. Morgan RBC Capital MarketsCitigroup Goldman Sachs & Co. LLCMorgan Stanley Baird Raymond James Stifel Wells Fargo Securities
The date of this prospectus is , 2017.The i
nfor
mat
ion in
this
preli
mina
ry pr
ospe
ctus i
s not
com
plete
and m
ay be
chan
ged.
Neith
er w
e nor
the s
elling
stoc
khold
ers m
ay se
ll the
se se
curit
ies un
til th
e reg
istra
tion s
tate
men
t file
d with
the S
ecur
ities
and
Exch
ange
Com
miss
ion is
effe
ctive
. This
pre
limina
ry p
rosp
ectu
s is n
ot a
n of
fer t
o se
ll, an
d it
is no
t soli
citing
an
offe
r to
buy,
thes
e se
curit
ies in
any
juris
dictio
n wh
ere
the
offe
r or s
ale is
not
per
mitt
ed.

16OCT201710555910
TABLE OF CONTENTS
MARKET AND INDUSTRY DATA . . . . . . . . . . . . . . . . . . . . . . . . . . . . . . . . . . . . . . . . . . . . iiCERTAIN TRADEMARKS, TRADE NAMES AND SERVICE MARKS . . . . . . . . . . . . . . . . . iiBASIS OF PRESENTATION . . . . . . . . . . . . . . . . . . . . . . . . . . . . . . . . . . . . . . . . . . . . . . . . . . iiUSE OF NON-GAAP FINANCIAL MEASURES . . . . . . . . . . . . . . . . . . . . . . . . . . . . . . . . . . . vPROSPECTUS SUMMARY . . . . . . . . . . . . . . . . . . . . . . . . . . . . . . . . . . . . . . . . . . . . . . . . . . 1RISK FACTORS . . . . . . . . . . . . . . . . . . . . . . . . . . . . . . . . . . . . . . . . . . . . . . . . . . . . . . . . . . . 28CAUTIONARY NOTE REGARDING FORWARD-LOOKING STATEMENTS . . . . . . . . . . . . 60USE OF PROCEEDS . . . . . . . . . . . . . . . . . . . . . . . . . . . . . . . . . . . . . . . . . . . . . . . . . . . . . . . 62DIVIDEND POLICY . . . . . . . . . . . . . . . . . . . . . . . . . . . . . . . . . . . . . . . . . . . . . . . . . . . . . . . 63CAPITALIZATION . . . . . . . . . . . . . . . . . . . . . . . . . . . . . . . . . . . . . . . . . . . . . . . . . . . . . . . . . 64DILUTION . . . . . . . . . . . . . . . . . . . . . . . . . . . . . . . . . . . . . . . . . . . . . . . . . . . . . . . . . . . . . . . 66UNAUDITED PRO FORMA FINANCIAL INFORMATION . . . . . . . . . . . . . . . . . . . . . . . . . . 68SELECTED HISTORICAL CONSOLIDATED FINANCIAL DATA . . . . . . . . . . . . . . . . . . . . . 83MANAGEMENT’S DISCUSSION AND ANALYSIS OF FINANCIAL CONDITION AND
RESULTS OF OPERATIONS . . . . . . . . . . . . . . . . . . . . . . . . . . . . . . . . . . . . . . . . . . . . . . . 85BUSINESS . . . . . . . . . . . . . . . . . . . . . . . . . . . . . . . . . . . . . . . . . . . . . . . . . . . . . . . . . . . . . . . 130MANAGEMENT . . . . . . . . . . . . . . . . . . . . . . . . . . . . . . . . . . . . . . . . . . . . . . . . . . . . . . . . . . 152COMPENSATION DISCUSSION AND ANALYSIS . . . . . . . . . . . . . . . . . . . . . . . . . . . . . . . . . 160PRINCIPAL AND SELLING STOCKHOLDERS . . . . . . . . . . . . . . . . . . . . . . . . . . . . . . . . . . . 184CERTAIN RELATIONSHIPS AND RELATED PARTY TRANSACTIONS . . . . . . . . . . . . . . . . 188DESCRIPTION OF CAPITAL STOCK . . . . . . . . . . . . . . . . . . . . . . . . . . . . . . . . . . . . . . . . . . 192DESCRIPTION OF CERTAIN INDEBTEDNESS . . . . . . . . . . . . . . . . . . . . . . . . . . . . . . . . . . 197SHARES ELIGIBLE FOR FUTURE SALE . . . . . . . . . . . . . . . . . . . . . . . . . . . . . . . . . . . . . . 200MATERIAL U.S. FEDERAL TAX CONSIDERATIONS FOR NON-U.S. HOLDERS OF OUR
COMMON STOCK . . . . . . . . . . . . . . . . . . . . . . . . . . . . . . . . . . . . . . . . . . . . . . . . . . . . . . . 202UNDERWRITING . . . . . . . . . . . . . . . . . . . . . . . . . . . . . . . . . . . . . . . . . . . . . . . . . . . . . . . . . 207LEGAL MATTERS . . . . . . . . . . . . . . . . . . . . . . . . . . . . . . . . . . . . . . . . . . . . . . . . . . . . . . . . . 214EXPERTS . . . . . . . . . . . . . . . . . . . . . . . . . . . . . . . . . . . . . . . . . . . . . . . . . . . . . . . . . . . . . . . . 214WHERE YOU CAN FIND MORE INFORMATION . . . . . . . . . . . . . . . . . . . . . . . . . . . . . . . . 214INDEX TO CONSOLIDATED FINANCIAL STATEMENTS . . . . . . . . . . . . . . . . . . . . . . . . . . F-1
You should rely only on the information contained in this prospectus and any free writingprospectus prepared by or on behalf of us that we have referred to you. Neither we, the sellingstockholders nor the underwriters have authorized anyone to provide you with additional informationor information different from that contained in this prospectus or in any free writing prospectusprepared by or on behalf of us that we have referred to you. If anyone provides you with additional,different, or inconsistent information, you should not rely on it. Offers to sell, and solicitations of offersto buy, shares of our common stock are being made only in jurisdictions where offers and sales arepermitted. The information contained in this prospectus is accurate only as of the date of thisprospectus, regardless of the time of delivery of this prospectus or of any sale of our common stock.Our business, financial condition, results of operations or prospects may have changed since such date.
No action is being taken in any jurisdiction outside the United States to permit a public offering ofour common stock or possession or distribution of this prospectus in that jurisdiction. Persons whocome into possession of this prospectus in jurisdictions outside the United States are required to informthemselves about and to observe any restriction as to this offering and the distribution of thisprospectus applicable to those jurisdictions.
i

MARKET AND INDUSTRY DATA
This prospectus includes estimates regarding market and industry data that we prepared based onour management’s knowledge and experience in the markets in which we operate, together withinformation obtained from various sources, including publicly available information, industry reportsand publications, surveys, our customers, distributors, suppliers, trade and business organizations andother contacts in the markets in which we operate. In addition, certain market and industry data hasbeen derived from market research prepared for us by Amane Advisors.
In presenting this information, we have made certain assumptions that we believe to be reasonablebased on such data and other similar sources and on our knowledge of, and our experience to date in,the markets for our products. Market share data is subject to change and may be limited by theavailability of raw data, the voluntary nature of the data gathering process and other limitationsinherent in any statistical survey of market share data. In addition, customer preferences are subject tochange. Accordingly, you are cautioned not to place undue reliance on such market share data or anyother such estimates. While we believe such information is reliable, neither we nor the underwriters canguarantee the accuracy or completeness of this information, and neither we nor the underwriters haveindependently verified any third-party information and data from our internal research has not beenverified by any independent source. While we believe the estimated market and industry data includedin this prospectus are generally reliable, such information, which is derived in part from management’sestimates and beliefs, is inherently uncertain and imprecise.
Projections, assumptions and estimates of our future performance and the future performance ofthe markets in which we operate are necessarily subject to a high degree of uncertainty and risk due toa variety of factors, including those described in ‘‘Risk Factors’’ and ‘‘Cautionary Note RegardingForward-Looking Statements.’’ These and other factors could cause results to differ materially fromthose expressed in the estimates made by the independent parties and by us.
CERTAIN TRADEMARKS, TRADE NAMES AND SERVICE MARKS
This prospectus includes trademarks and service marks owned by us, including ‘‘EVOQUA,’’‘‘BIOMAG,’’ ‘‘CAPAC,’’ ‘‘CHLOROPAC,’’ ‘‘COMAG,’’ ‘‘DAVCO,’’ ‘‘DEFENDER,’’ ‘‘DELTA UV,’’‘‘ENVIREX,’’ ‘‘IONPURE,’’ ‘‘JWI,’’ ‘‘MEMCOR,’’ ‘‘MEMPULSE,’’ ‘‘NEXED,’’ ‘‘OSEC,’’‘‘SEACURE,’’ ‘‘TRANSFORMING WATER. ENRICHING LIFE.,’’ ‘‘WALLACE & TIERNAN,’’‘‘WATER ONE,’’ ‘‘VANOX’’ and ‘‘VORTISAND.’’ This prospectus also contains trademarks, tradenames and service marks of other companies, which are the property of their respective owners. Solelyfor convenience, trademarks, trade names and service marks referred to in this prospectus may appearwithout the �, � or SM symbols, but such references are not intended to indicate, in any way, that wewill not assert, to the fullest extent under applicable law, our rights or the right of the applicablelicensor to these trademarks, trade names and service marks. We do not intend our use or display ofother parties’ trademarks, trade names or service marks to imply, and such use or display should not beconstrued to imply, a relationship with, endorsement of or sponsorship of us by, these other parties.
BASIS OF PRESENTATION
On January 15, 2014, Evoqua Water Technologies Corp. (formerly EWT Holdings I Corp.), or the‘‘Successor,’’ acquired, through its wholly-owned entities, EWT Holdings II Corp. and EWT HoldingsIII Corp., all of the outstanding shares of Siemens Water Technologies (the ‘‘Predecessor’’), a group oflegal entity businesses formerly owned by Siemens Aktiengesellschaft (‘‘Siemens’’). This acquisition,which we refer to as the ‘‘AEA Acquisition,’’ closed on January 15, 2014 and was effective January 16,2014. The stock purchase price, net of cash received, was approximately $730.6 million. The Successoris majority-owned by certain affiliates of AEA Investors LP (collectively, ‘‘AEA’’ or our ‘‘Sponsor’’).
ii

As a result of the AEA Acquisition and resulting change in control and changes due to the impactof purchase accounting, we are required to present separately the operating results for the Predecessorand Successor. We refer to the period from October 1, 2013 through January 15, 2014 as ‘‘PredecessorPeriod 2014,’’ and the consolidated financial statements for that period include the accounts of thePredecessor. We refer to the period from January 16, 2014 through September 30, 2014 as ‘‘SuccessorPeriod 2014,’’ and the consolidated financial statements for that period include the accounts of theSuccessor. The Successor was incorporated on October 7, 2013. From October 7, 2013 to January 15,2014, the Successor had no activities other than the incurrence of transaction costs related to the AEAAcquisition, which are included in the Successor Period 2014.
Consequently, Successor Period 2014, fiscal 2015 and fiscal 2016 may not be comparable toPredecessor Period 2014. Unless otherwise indicated or the context otherwise requires, all references to‘‘the Company,’’ ‘‘Evoqua,’’ ‘‘Evoqua Water Technologies Corp.,’’ ‘‘EWT Holdings I Corp.,’’ ‘‘we,’’ ‘‘us,’’‘‘our’’ and similar terms mean (1) the Predecessor for periods ending on or prior to January 15, 2014and (2) the Successor for periods beginning on or after January 16, 2014, in each case together with itsconsolidated subsidiaries.
Our fiscal year ends on September 30 of each year. References in this prospectus to a fiscal yearmean the year in which that fiscal year ends. References in this prospectus to: ‘‘fiscal 2012’’ or ‘‘FY2012’’ relate to the fiscal year ended September 30, 2012, ‘‘fiscal 2013’’ or ‘‘FY 2013’’ relate to thefiscal year ended September 30, 2013, ‘‘fiscal 2014’’ or ‘‘FY 2014’’ relate to the fiscal year endedSeptember 30, 2014, ‘‘fiscal 2015’’ or ‘‘FY 2015’’ relate to the fiscal year ended September 30, 2015,‘‘fiscal 2016’’ or ‘‘FY 2016’’ relate to the fiscal year ended September 30, 2016 and ‘‘fiscal 2017’’ or‘‘FY 2017’’ relate to the fiscal year ended September 30, 2017.
Numerical figures included in this prospectus have been subject to rounding adjustments.Accordingly, numerical figures shown as totals in various tables may not be arithmetic aggregations ofthe figures that precede them. In addition, we round certain percentages presented in this prospectus tothe nearest whole number. As a result, figures expressed as percentages in the text may not total 100%or, as applicable, when aggregated may not be the arithmetic aggregation of the percentages thatprecede them.
As used in this prospectus, unless the context otherwise requires, any reference to:
• ‘‘ADI’’ means ADI Systems North America Inc., Geomembrane Technologies Inc. and LangeContainment Systems, Inc., collectively;
• ‘‘August 2017 Refinancing’’ means our entry into the fourth amendment, dated as of August 8,2017, to the First Lien Credit Agreement (the ‘‘August 2017 Amendment’’) providing for theincurrence of (i) approximately $262.7 million in term loans, the net proceeds of which wereused to refinance in their entirety the NB Incremental Loans and (ii) $80.0 million ofincremental term loans, the net proceeds of which were used to repay $60.0 million of revolvingcredit loans then outstanding under the Revolving Credit Facility and to pay fees and expensesin connection with the transactions thereunder and for other general corporate purposes;
• ‘‘BOO’’ means build own-operate;
• ‘‘Delta UV’’ means Delta Ultraviolet Corporation;
• ‘‘EPC’’ means engineering, procurement and construction;
• ‘‘ePro’’ means Evoqua Procurement;
• ‘‘ETS’’ means Environmental Treatment Systems Inc.;
• ‘‘FDA’’ means the U.S. Food and Drug Administration;
iii

• ‘‘First Lien Credit Agreement’’ means the first lien credit agreement, dated as of January 15,2014, by and among our subsidiary, EWT Holdings II Corp., as a parent guarantor, EWTHoldings III Corp., as the borrower, the lenders party thereto and Credit Suisse AG, asadministrative agent and collateral agent;
• ‘‘First Lien Facilities’’ means the Term Loan Facility, together with the Revolving Credit Facility;
• ‘‘Magneto’’ means Magneto Special Anodes B.V.;
• ‘‘NB Incremental Loans’’ means the $185.0 million of incremental term loans incurred pursuantto the incremental amendment, dated as of April 15, 2016, to the First Lien Credit Agreement.The net proceeds of the NB Incremental Loans were used to finance the Neptune-BensonAcquisition, the refinancing of certain then-existing indebtedness of Neptune-Benson and thepayment of fees and expenses in connection with such transactions;
• ‘‘Neptune-Benson’’ means Neptune-Benson Holding Corp. and certain of its affiliates, which weacquired in connection with the Neptune-Benson Acquisition;
• ‘‘Neptune-Benson Acquisition’’ means our acquisition of Neptune-Benson on April 15, 2016. Inconnection with the Neptune-Benson Acquisition, we created our Aquatics and Disinfectiondivision, which we subsequently merged into our Products Segment;
• ‘‘Noble’’ means Noble Water Technologies, Inc.;
• ‘‘O&M’’ means operations and maintenance;
• ‘‘October 2016 Refinancing’’ means our entry into a second amendment to the First Lien CreditAgreement, on October 28, 2016, to (i) borrow the October 2016 Incremental Term Loans tofund our repayment in full of the Second Lien Facility and revolving credit loans thenoutstanding under the Revolving Credit Facility and (ii) increase commitments under theRevolving Credit Facility by $20.0 million to a total of $95.0 million;
• ‘‘October 2016 Incremental Term Loans’’ means the $150.0 million of additional incrementalterm loans we borrowed under the Term Loan Facility on October 28, 2016, in connection withour entry into the October 2016 Refinancing;
• ‘‘OEM’’ means original equipment manufacturer;
• ‘‘Olson’’ means Olson Irrigation Systems;
• ‘‘Revolving Credit Facility’’ means the senior secured revolving credit facility we entered into onJanuary 15, 2014;
• ‘‘Second Lien Credit Agreement’’ means the second lien credit agreement by and among oursubsidiary, EWT Holdings II Corp., as a parent guarantor, EWT Holdings III Corp., as theborrower, the lenders party thereto and Credit Suisse AG, as administrative agent and collateralagent, dated January 15, 2014;
• ‘‘Second Lien Facility’’ means the senior secured second lien term loan facility we entered intoon January 15, 2014;
• ‘‘Second Lien Repayment’’ means our repayment of all amounts then-outstanding under theSecond Lien Credit Agreement in connection with the October 2016 Refinancing;
• ‘‘Senior Secured Credit Facilities’’ means the First Lien Facilities and, until the Second LienRepayment, the Second Lien Facility;
• ‘‘Stock Option Plan’’ means the Evoqua Water Technologies Corp. Stock Option Plan, which waseffective as of March 6, 2014;
iv

• ‘‘Term Loan Facility’’ means the senior secured first lien term loan facility we entered into onJanuary 15, 2014;
• ‘‘Transactions’’ means (i) the Neptune-Benson Acquisition; (ii) our entry into the NBIncremental Term Loans to finance the Neptune-Benson Acquisition; (iii) the October 2016Refinancing and the August 2017 Refinancing and (iv) the sale of shares of common stock by usin this offering at the initial public offering price of $18.00 per share (the midpoint of the pricerange set forth on the cover of this prospectus) and the application of the net proceedstherefrom as set forth under ‘‘Use of Proceeds’’;
• ‘‘TWO’’ means Treated Water Outsourcing, a joint venture between us and Nalco Water, anEcolab company, to sell water management equipment and services to industrial customerslocated throughout the United States; and
• ‘‘VAF’’ means Valve and Filtration Systems, Ltd.
USE OF NON-GAAP FINANCIAL MEASURES
This prospectus contains ‘‘non-GAAP financial measures,’’ which are financial measures that arenot calculated and presented in accordance with generally accepted accounting principles in the UnitedStates, or ‘‘GAAP.’’
The SEC has adopted rules to regulate the use in filings with the SEC and in other publicdisclosures of non-GAAP financial measures. These rules govern the manner in which non-GAAPfinancial measures are publicly presented and require, among other things:
• a presentation with equal or greater prominence of the most comparable financial measure ormeasures calculated and presented in accordance with GAAP; and
• a statement disclosing the purposes for which the registrant’s management uses the non-GAAPfinancial measure.
Specifically, we make use of the non-GAAP financial measure ‘‘Adjusted EBITDA’’ in evaluatingour past performance and future prospects. Throughout this prospectus, as noted, we make adjustmentsto Adjusted EBITDA, with respect to the pro forma periods presented herein, to give further effect tocontributions from insignificant completed acquisitions for the applicable periods. For the definition ofAdjusted EBITDA (including as further adjusted as described above) and a reconciliation to netincome (loss), its most directly comparable financial measure presented in accordance with GAAP, seefootnotes 2 and 3 to the table under the heading ‘‘Prospectus Summary—Summary ConsolidatedFinancial and Operating Data.’’
Adjusted EBITDA is one of the primary metrics used by management to evaluate the financialperformance of our business. We present Adjusted EBITDA, which is not a recognized financialmeasure under GAAP, because we believe it is frequently used by analysts, investors and otherinterested parties to evaluate companies in our industry. Further, we believe it is helpful in highlightingtrends in our operating results, because it excludes, among other things, certain results of decisions thatare outside the control of management, while other measures can differ significantly depending onlong-term strategic decisions regarding capital structure, the tax jurisdictions in which we operate andcapital investments. Management uses Adjusted EBITDA to supplement GAAP measures ofperformance as follows:
• to assist investors and analysts in comparing our operating performance across reporting periodson a consistent basis by excluding items that we do not believe are indicative of our coreoperating performance;
v

• in our management incentive compensation which is based in part on components of AdjustedEBITDA;
• in certain calculations under our Senior Secured Credit Facilities, which use components ofAdjusted EBITDA;
• to evaluate the effectiveness of our business strategies;
• to make budgeting decisions; and
• to compare our performance against that of other peer companies using similar measures.
In addition to the above, our chief operating decision maker uses EBITDA of each reportablesegment to evaluate the operating performance of such segments. For the definition of EBITDA on asegment basis and a reconciliation to our segment operating profit presented in accordance with GAAP,see our segment results discussed under ‘‘Management’s Discussion and Analysis of Financial Conditionand Results of Operations.’’
Adjusted EBITDA has limitations as an analytical tool, and you should not consider it either inisolation or as a substitute for analyzing our results as reported under GAAP. Some of these limitationsinclude the following:
• Adjusted EBITDA does not reflect every expenditure, future requirements for capitalexpenditures or contractual commitments;
• Adjusted EBITDA does not reflect changes in our working capital needs;
• Adjusted EBITDA does not reflect the significant interest expense, or the amounts necessary toservice interest or principal payments on our Senior Secured Credit Facilities;
• Adjusted EBITDA does not reflect income tax expense (benefit), and because the payment oftaxes is part of our operations, tax expense is a necessary element of our costs and ability tooperate;
• although depreciation and amortization are eliminated in the calculation of Adjusted EBITDA,the assets being depreciated and amortized will often have to be replaced in the future, andAdjusted EBITDA does not reflect any costs of such replacements;
• Adjusted EBITDA does not reflect the noncash component of employee compensation;
• Adjusted EBITDA does not reflect the impact of earnings or charges resulting from matters weconsider not to be reflective, on a recurring basis, of our ongoing operations;
• other companies in our industry may calculate Adjusted EBITDA or similarly titled measuresdifferently than we do, limiting its usefulness as a comparative measure; and
• Adjusted EBITDA (pro forma as adjusted for contributions from insignificant completedacquisitions) does not necessarily reflect the results of operations of such acquired businesses asif they had been acquired at the beginning of each such period presented.
We compensate for these limitations by relying primarily on our GAAP results and using AdjustedEBITDA only as supplemental information.
vi

PROSPECTUS SUMMARY
This summary highlights selected information contained elsewhere in this prospectus and does notcontain all of the information that you should consider in making your investment decision. Before investingin our common stock, you should carefully read this entire prospectus, including our consolidated financialstatements and related notes thereto included elsewhere in this prospectus and the information in ‘‘RiskFactors,’’ ‘‘Cautionary Note Regarding Forward-Looking Statements’’ and ‘‘Management’s Discussion andAnalysis of Financial Condition and Results of Operations.’’
Company Overview
We are a leading provider of mission critical water treatment solutions, offering services, systemsand technologies to support our customers’ full water lifecycle needs. With over 200,000 installationsworldwide, we hold leading positions in the industrial, commercial and municipal water treatmentmarkets in North America. We offer a comprehensive portfolio of differentiated, proprietary technologysolutions sold under a number of market-leading and well-established brands. We deliver and maintainthese mission critical solutions through the largest service network in North America, assuring ourcustomers continuous uptime with 86 branches which are located no further than a two-hour drive frommore than 90% of our customers’ sites. We believe that the customer intimacy created through ourservice network is a significant competitive advantage.
Our solutions are designed to provide ‘‘worry-free water’’ by ensuring that our customers haveaccess to an uninterrupted quantity and level of quality of water that meets their unique product,process and recycle or reuse specifications. We enable our customers to achieve lower costs throughgreater uptime, throughput and efficiency in their operations and support their regulatory complianceand environmental sustainability. We have worked to protect water, the environment and ouremployees for over 100 years. As a result, we have earned a reputation for quality, safety and reliabilityand are sought out by our customers to solve the full range of their water treatment needs, andmaintaining our reputation is critical to the success of our business.
Our vision ‘‘to be the world’s first choice in water solutions’’ and our values of ‘‘integrity,customers and performance’’ foster a corporate culture that is focused on employee enablement,empowerment and accountability, which creates a highly entrepreneurial and dynamic workenvironment. Our purpose is ‘‘Transforming water. Enriching life.’’ We draw from a long legacy ofwater treatment innovations and industry firsts, supported by more than 1,250 granted or pendingpatents, which in aggregate are important to our business and solution set. Our core technologies areprimarily focused on removing impurities from water, rather than neutralizing them through theaddition of chemicals, and we are able to achieve purification levels which are 1,000 times greater thantypical drinking water.
We provide solutions across the entire water cycle. The water cycle begins with ‘‘influent’’ water,which is sourced from oceans, rivers, lakes, as well as other sources. We treat the influent water so thatit can be used for a wide variety of industrial, commercial and municipal applications. In industrialapplications, influent water, after it is treated, is used as process water for applications, such asmicroelectronic production, as an ingredient in the production of food and beverage and other goodsand in utility applications including boiler feed water, cooling water and steam condensate. Commercialapplications for influent water include laboratory testing and aquatic activities, while municipalapplications for influent water include treatment to produce safe drinking water and wastewater that iscompliant with applicable regulations. After the water is used it is considered ‘‘effluent water,’’ and weenable its treatment through the removal of impurities so that it can be discharged safely back into theenvironment or reused for industrial, commercial or municipal applications. As our solutions span theentire water cycle, we believe we have the most comprehensive and innovative range of solutions in theentire water treatment industry. Our future growth is dependent upon our ability to accretively develop
1
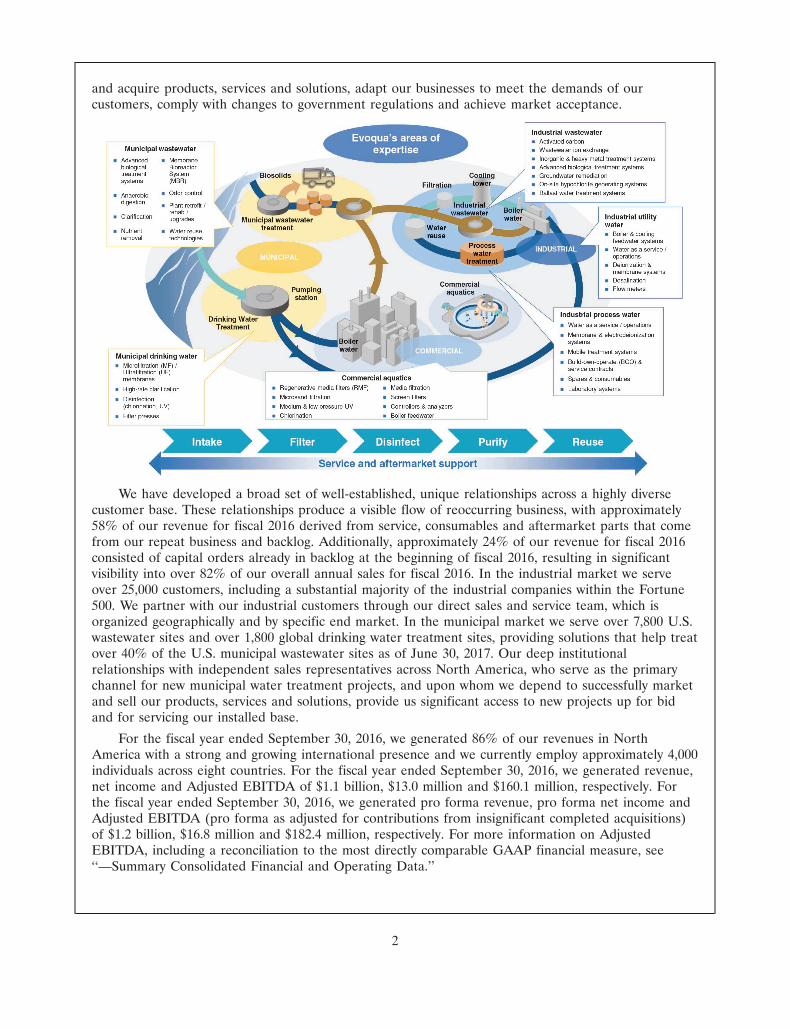
13JUL201703110877
and acquire products, services and solutions, adapt our businesses to meet the demands of ourcustomers, comply with changes to government regulations and achieve market acceptance.
We have developed a broad set of well-established, unique relationships across a highly diversecustomer base. These relationships produce a visible flow of reoccurring business, with approximately58% of our revenue for fiscal 2016 derived from service, consumables and aftermarket parts that comefrom our repeat business and backlog. Additionally, approximately 24% of our revenue for fiscal 2016consisted of capital orders already in backlog at the beginning of fiscal 2016, resulting in significantvisibility into over 82% of our overall annual sales for fiscal 2016. In the industrial market we serveover 25,000 customers, including a substantial majority of the industrial companies within the Fortune500. We partner with our industrial customers through our direct sales and service team, which isorganized geographically and by specific end market. In the municipal market we serve over 7,800 U.S.wastewater sites and over 1,800 global drinking water treatment sites, providing solutions that help treatover 40% of the U.S. municipal wastewater sites as of June 30, 2017. Our deep institutionalrelationships with independent sales representatives across North America, who serve as the primarychannel for new municipal water treatment projects, and upon whom we depend to successfully marketand sell our products, services and solutions, provide us significant access to new projects up for bidand for servicing our installed base.
For the fiscal year ended September 30, 2016, we generated 86% of our revenues in NorthAmerica with a strong and growing international presence and we currently employ approximately 4,000individuals across eight countries. For the fiscal year ended September 30, 2016, we generated revenue,net income and Adjusted EBITDA of $1.1 billion, $13.0 million and $160.1 million, respectively. Forthe fiscal year ended September 30, 2016, we generated pro forma revenue, pro forma net income andAdjusted EBITDA (pro forma as adjusted for contributions from insignificant completed acquisitions)of $1.2 billion, $16.8 million and $182.4 million, respectively. For more information on AdjustedEBITDA, including a reconciliation to the most directly comparable GAAP financial measure, see‘‘—Summary Consolidated Financial and Operating Data.’’
2

We serve our customers through three segments: Industrial, Municipal and Products. Thesesegments all draw from the same reservoir of leading technologies, shared manufacturing infrastructure,common business processes and corporate philosophies. Our Industrial Segment provides fully-integrated systems and service solutions that selectively utilize our comprehensive portfolio of watertreatment technologies to satisfy our customers’ unique water needs. Our Municipal Segment providesengineered water treatment equipment and solutions based on our proprietary technology and odor andcorrosion control services. Our Products Segment sells equipment, based on our broad technologyportfolio, that is used as components in integrated solutions specified by water treatment designers andoffered by OEMs, engineering firms, integrators and our own Industrial and Municipal Segments.
Industrial Municipal Products
• Tailored solutions in • Delivers solutions, equipment • Highly differentiated andcollaboration with our and services to engineering scalable range of products andcustomers backed by life-cycle firms, OEMs and technologies specified byservices including on-demand municipalities to treat global water treatmentwater, BOO, recycle / reuse wastewater and purify designers, OEMs, engineeringOverview and emergency response drinking water firms and integratorsservice alternatives to improveoperational reliability,performance andenvironmental compliance
• Direct sales with market • Independent representative • Direct and indirect sales andvertical focus network supported by aftermarket channels
technical sales teamChannel
• Direct sales and aftermarketchannels
• Full lifecycle service and • Wide range of wastewater • Filtrationsolutions for influent, effluent solutions:
—Regenerative media andand process water, including—Ultrafiltration membrane microsandon-demand water, BOO,
bioreactorsrecycle / reuse and emergency —Self-cleaning filters andresponse services —Advanced biological intake screens
treatment• Equipment systems for • Disinfectionindustrial needs: influent —Clarifiers, aerators, screenswater, boiler feed water, —Low and medium pressureand dewateringKey offerings ultrahigh purity, process ultraviolet (‘‘UV’’)water, wastewater treatment —Ballasted clarification
—Electrochlorination and gasand recycle / reuse—Odor and corrosion control chlorination
• Full-scale outsourcing of equipment and services• Anode technologyoperations and maintenance
• Ultrafiltration for drinking• Electrodeionizationwater• Analyzers and controllers• Retrofit, rehabilitation and
aftermarket
Percentage of 53% 24% 23%FY 2016 revenue
As depicted in the table below, we target attractive global end-markets that utilize water as acritical part of their operations or production processes including pharmaceuticals and health sciences,microelectronics, food and beverage, hydrocarbon and chemical processing, power, generalmanufacturing, municipal drinking water and wastewater, marine and aquatics end markets. While adecline in general global and economic conditions could adversely affect us, our business is highly
3
16JUL201720113272 14JUL201717404035
14JUL201717404583 14JUL201717405191
13JUL20170311160614JUL201717403738
16JUL201720112808 14JUL201717404310
14JUL201717405557 14JUL201717403161
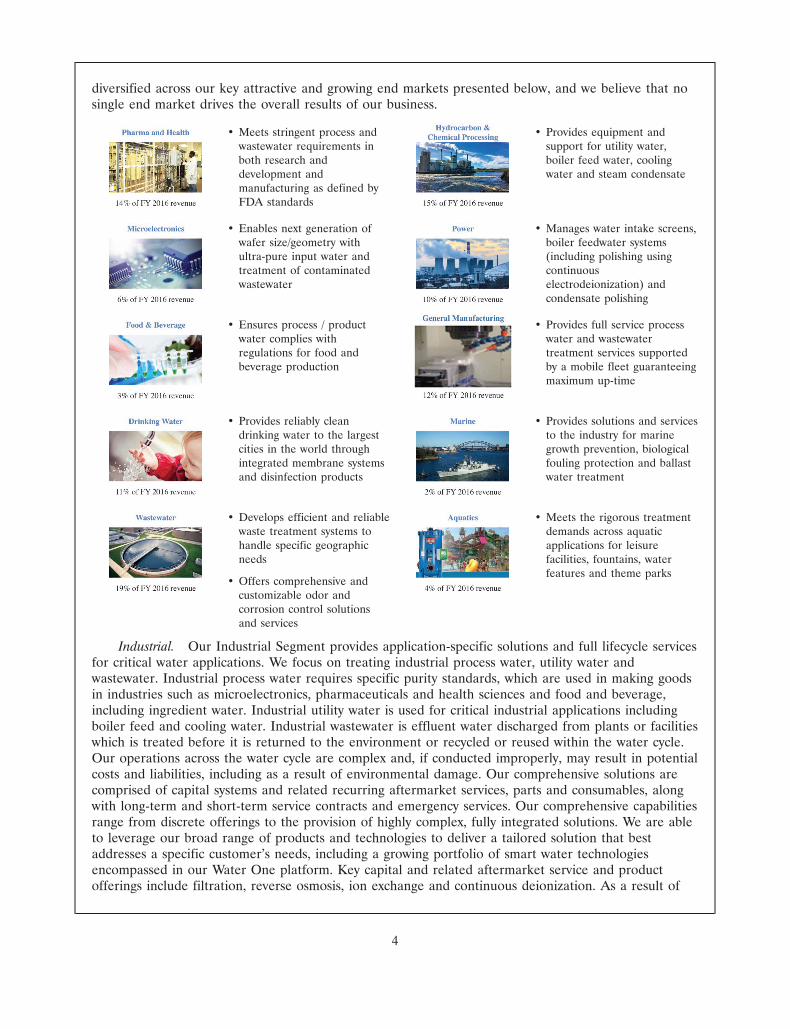
diversified across our key attractive and growing end markets presented below, and we believe that nosingle end market drives the overall results of our business.
• Meets stringent process and • Provides equipment andwastewater requirements in support for utility water,both research and boiler feed water, coolingdevelopment and water and steam condensatemanufacturing as defined byFDA standards
• Enables next generation of • Manages water intake screens,wafer size/geometry with boiler feedwater systemsultra-pure input water and (including polishing usingtreatment of contaminated continuouswastewater electrodeionization) and
condensate polishing
• Ensures process / product • Provides full service processwater complies with water and wastewaterregulations for food and treatment services supportedbeverage production by a mobile fleet guaranteeing
maximum up-time
• Provides reliably clean • Provides solutions and servicesdrinking water to the largest to the industry for marinecities in the world through growth prevention, biologicalintegrated membrane systems fouling protection and ballastand disinfection products water treatment
• Develops efficient and reliable • Meets the rigorous treatmentwaste treatment systems to demands across aquatichandle specific geographic applications for leisureneeds facilities, fountains, water
features and theme parks• Offers comprehensive and
customizable odor andcorrosion control solutionsand services
Industrial. Our Industrial Segment provides application-specific solutions and full lifecycle servicesfor critical water applications. We focus on treating industrial process water, utility water andwastewater. Industrial process water requires specific purity standards, which are used in making goodsin industries such as microelectronics, pharmaceuticals and health sciences and food and beverage,including ingredient water. Industrial utility water is used for critical industrial applications includingboiler feed and cooling water. Industrial wastewater is effluent water discharged from plants or facilitieswhich is treated before it is returned to the environment or recycled or reused within the water cycle.Our operations across the water cycle are complex and, if conducted improperly, may result in potentialcosts and liabilities, including as a result of environmental damage. Our comprehensive solutions arecomprised of capital systems and related recurring aftermarket services, parts and consumables, alongwith long-term and short-term service contracts and emergency services. Our comprehensive capabilitiesrange from discrete offerings to the provision of highly complex, fully integrated solutions. We are ableto leverage our broad range of products and technologies to deliver a tailored solution that bestaddresses a specific customer’s needs, including a growing portfolio of smart water technologiesencompassed in our Water One platform. Key capital and related aftermarket service and productofferings include filtration, reverse osmosis, ion exchange and continuous deionization. As a result of
4

our speed, capabilities and experience, we are a trusted partner to 25,000 industrial customers,including a substantial majority of Fortune 500 industrial companies. As water is a critical componentin many industrial production processes, unavailability of proper water purity, specification or qualitycan lead to significant constraints, downtime and increased operating costs.
The cost of an installation can range from a few thousand dollars to a few million dollars andoften presents an ongoing service and aftermarket revenue opportunity that can reach or exceed theoriginal project cost. The service and aftermarket sales component is supported by our broadapplication and process expertise and the largest integrated industrial service network in NorthAmerica, based on management’s estimate. Our network is comprised of certified technicians and thelargest fleet of mobile reverse osmosis and deionization water treatment systems in North Americabased on management’s estimate, and enables us to provide a complete range of services spanning fromregular maintenance and emergency support to our unique Water One platform. Water One providesremote monitoring capabilities which enable us to optimize our routine service calls through predictiveanalytics and provide customers a more predictable, cost-efficient water solution. We offer serviceswhich include water on-demand, mobile solutions and smart water systems that leverage our extensivebranch network, technical personnel and technology portfolio.
We market our Industrial offerings through our direct sales force, which is organized by marketvertical and is complemented by an inside sales force, field sales engineers and a growing e-commerceplatform.
Municipal. Our Municipal Segment provides engineered solutions and equipment for thetreatment of wastewater, purification of drinking water and odor and corrosion control formunicipalities. Our portfolio of solutions includes ultrafiltration systems, advanced biological treatment,clarifiers, aerators, odor and corrosion control services, equipment for new municipal plant builds andretrofit, rehabilitation and aftermarket parts and services for our extensive installed base. We haveprovided solutions across a large municipal installed base with capacities ranging from 25,000 gallonsper day to over 100 million gallons per day. Our operations are focused within the U.S. market, with apresence in the United Kingdom, Australia, Canada and Singapore.
We maintain a comprehensive municipal representative network that broadly covers the UnitedStates, providing us with a differentiated ability to influence specifications and the basis of design fornew treatment facilities. We also maintain relationships with engineering firms, operators and other keyinfluencers through our direct technical sales force to drive adoption of our offerings.
Products. Our Products Segment sells differentiated technologies to a diverse set of watertreatment system specifiers, integrators and end users globally. Our offerings are highlighted by ourfiltration and disinfection, electrodeionization and electrochlorination technologies, separationtechnologies and anodes offerings. Our filtration and disinfection offerings include our Defender line ofproducts, which is a regenerative media filtration leader in the commercial aquatics market. OurIONPURE electrodeionization solutions allow customers to achieve ultrahigh purity water without theuse of chemicals in the treatment process. Our electrochlorination products provide extensive watertreatment solutions for the maritime, oil and gas and power markets. We also have extensivecapabilities in anode technologies, cathodic protection, solid and liquid separation technologies andvarious aftermarket parts, consumables and accessories. All of our offerings are highly scalable anddesigned to meet current and future water treatment needs, with a focus on generating repeat businessfrom our customers. We generally service the equipment we provide our customers; however, theirfailure to properly use, safeguard or maintain their equipment or product defects or unanticipated useof our products could result in liability to us.
Our portfolio of technologies and products are sold either as discrete offerings or as componentsof broader Evoqua solutions through our Industrial and Municipal Segments. Our Products Segmentalso sells externally to a customer base comprised of globally located OEMs, integrators, regionaldistributors, customers, regional engineering firms and various other end users that we reach throughmultiple established sales and aftermarket channels.
5
27JUL201723370685
Our Industry
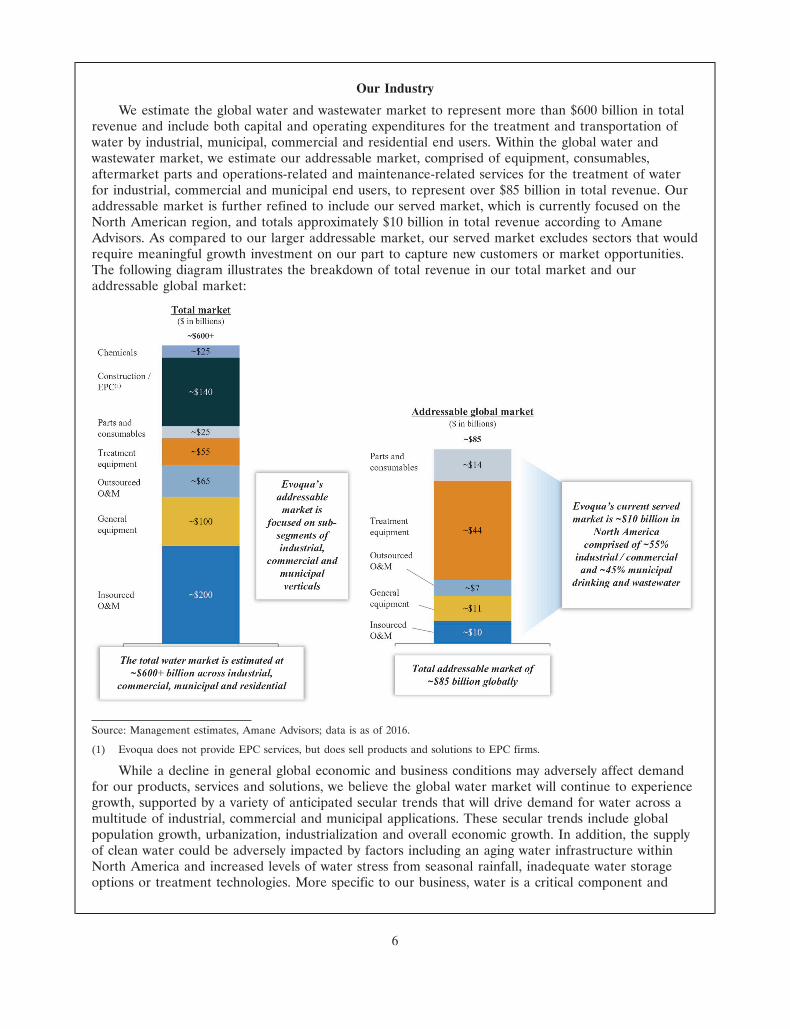
We estimate the global water and wastewater market to represent more than $600 billion in totalrevenue and include both capital and operating expenditures for the treatment and transportation ofwater by industrial, municipal, commercial and residential end users. Within the global water andwastewater market, we estimate our addressable market, comprised of equipment, consumables,aftermarket parts and operations-related and maintenance-related services for the treatment of waterfor industrial, commercial and municipal end users, to represent over $85 billion in total revenue. Ouraddressable market is further refined to include our served market, which is currently focused on theNorth American region, and totals approximately $10 billion in total revenue according to AmaneAdvisors. As compared to our larger addressable market, our served market excludes sectors that wouldrequire meaningful growth investment on our part to capture new customers or market opportunities.The following diagram illustrates the breakdown of total revenue in our total market and ouraddressable global market:
Source: Management estimates, Amane Advisors; data is as of 2016.
(1) Evoqua does not provide EPC services, but does sell products and solutions to EPC firms.
While a decline in general global economic and business conditions may adversely affect demandfor our products, services and solutions, we believe the global water market will continue to experiencegrowth, supported by a variety of anticipated secular trends that will drive demand for water across amultitude of industrial, commercial and municipal applications. These secular trends include globalpopulation growth, urbanization, industrialization and overall economic growth. In addition, the supplyof clean water could be adversely impacted by factors including an aging water infrastructure withinNorth America and increased levels of water stress from seasonal rainfall, inadequate water storageoptions or treatment technologies. More specific to our business, water is a critical component and
6

byproduct of many processes, including in manufacturing and product development. As such, as globalconsumption patterns evolve and water shortages persist, demand for equipment and services willcontinue to increase. We estimate the global water market is expected to grow in total revenue byapproximately 3% annually from 2017 to 2020, although such growth may not be concentrated in themarkets that we serve or may be otherwise affected by global or regional economic conditions.
We hold the number one position, with approximately 11% market share, in the highly fragmentedNorth American water treatment market we serve, based on fiscal 2016 revenue, according to AmaneAdvisors. Our approximately 11% market share is over 1.5 times that of our nearest competitor acrossthe combined industrial, commercial and municipal market verticals, according to Amane Advisors. Asa result of the complex route to market and diverse set of customers, most market participants areniche-offering focused, with a majority of the broader market served by a large number of small,regional providers. More specifically, according to Amane Advisors, the top five market participantscomprised approximately 30% of the North American market share in 2016 with a significant tail ofsmaller, regionally focused competitors. Our leading positions in our market verticals have beencultivated by our suite of differentiated solutions and our comprehensive service network, which hadover four times as many locations as our closest competitor at June 30, 2017. Despite our leadingpositions in the individual market verticals where we participate, our market share did not exceed 25%in any single market vertical in which we participated during fiscal 2016. We must continue to maintainand improve our competitive position, which requires focus on product performance, applicationexpertise and compliance with environmental and regulatory requirements.
We serve three primary market verticals: (i) industrial, (ii) commercial and (iii) municipal.Industrial and commercial customers vary in size, scope and the complexity of their water treatmentneeds and include small manufacturing clients with a single facility, large commercial waterparks andmultinational corporations with a significant global footprint. The municipal market consists of potablewater and wastewater treatment solutions that are sold to municipalities and private companiesoperating under a concession agreement to own and operate treatment facilities on behalf ofmunicipalities. We serve each market with a full range of solutions, services, technologies andaftermarket offerings.
Industrial and commercial markets. The served North America industrial and commercial marketsrepresent an approximately $6 billion revenue opportunity, according to Amane Advisors. Our servedNorth America industrial and commercial water markets consist of industrial process water, industrialutility and wastewater and commercial aquatics. Industrial process water includes the treatment of aninfluent water source prior to its direct use within a specific industrial application such as an ingredientin the development of a product. Industrial customers rely on specific purity standards for processwater with purity needs that range from a small volume of water requiring minimal treatment toultrapure water that support advanced manufacturing processes and are derived from highly advancedwater treatment systems. Industrial utility water treatment includes solutions to remove contaminantsbefore water is utilized to support an industrial process such as boiler feed water. Wastewater is thentreated before it is either discharged to a municipal wastewater system or discharged directly to theenvironment or reused within the facility. Commercial aquatics include the filtration and disinfection ofwater within large commercial applications including pools and water parks.
The industrial market is comprised of direct end market distribution channels. The commercialmarket includes a variety of routes to market including direct and third-party channel relationships.
Municipal market. There were more than 19,500 municipalities in the United States as of 2012,according to the United States Census Bureau. Together, these municipalities provided drinking andwastewater services to over 282 million people in 2016, according to the United States EnvironmentalProtection Agency (the ‘‘U.S. EPA’’). According to Amane Advisors, our served municipal market inNorth America is estimated to be approximately $4 billion in total revenue. The criticality of water hasalso increased due to heightened safety standards, stricter environmental regulation and aging
7
infrastructure. The municipal market is comprised of a wide range of drinking and wastewatertreatment facilities. Key market participants include engineering firms and EPC companies that driveplant design and specifications, along with local municipal sales representatives.
Our Strengths
Number one market position in North America offering comprehensive, mission-critical lifecycle watertreatment solutions. According to Amane Advisors, we are the leader in the highly fragmentedapproximately $10 billion North American served water treatment market across industrial, commercialand municipal process and wastewater treatment, based on our fiscal 2016 revenue. We have a globalinstalled base that exceeds 200,000 installations and supports the full breadth of our water lifecyclesolutions including application specific treatment equipment, aftermarket parts, consumables androutine or emergency service. Our approximately 11% market share in the North American watertreatment market is nearly 1.5 times that of our closest competitor according to Amane Advisors, andyet we still enjoy room for growth given the highly fragmented nature of the market made uppredominately of smaller, local companies. According to Amane Advisors, we operate in a highlycompetitive but fragmented industry, with the top five companies in our industry representingapproximately 30% of the market. Our growth is supported by our global manufacturing capabilities,differentiated channels to market and deep technology reservoir.
We believe our market position is derived from our ability to provide holistic water solutions ascompared to our competitors who lack both the breadth of our product and technology portfolio andour extensive North American service network. We have a vast array of products and systems with theexpertise to adapt core technologies to meet specific customer needs, particularly within the industrialspace. Additionally, we are able to offer our clients a full outsourced water experience with guaranteedwater quality and quantity through a full suite of mobile technologies, including our national fleet ofover 600 mobile treatment assets as of June 30, 2017.
Positioned to capitalize on favorable industry growth dynamics and benefit from diverse end-marketexposure. While a decline in general global economic and business conditions may adversely affectdemand for our products, services and solutions, water treatment is an essential, non-discretionarymarket that is growing in importance as access to clean water has become an international priority. Anumber of global, long-term secular trends underpin anticipated industry growth dynamics and haveresulted in increasingly stringent effluent regulations along with a growing demand for cleaner andsustainable waste streams for reuse. These trends include the growing global population, increasinglevels of urbanization and continued global economic growth. We have seen these trends manifestthemselves within our various end markets creating multiple avenues of growth, but we are unable topredict the impact of potential countervailing considerations. For example, within the industrial market,water is an integral component in the production of a wide range of goods spanning from consumerelectronics to automobiles. Additionally, recent events such as the crisis in Flint, Michigan haverenewed focus on clean drinking water in the United States, which, combined with a historical increasesin infrastructure investment, translates to growing demand for our solutions and services in themunicipal market. Furthermore, our long-standing reputation among engineering firms and independentsales representatives positions us to benefit from increased municipal demand, particularly as watertreatment plants are upgraded and expanded.
Given the wide use and importance of water, we enjoy low concentration within our end markets,with no single market vertical comprising over 19% of our revenue and no single customer comprisingover 1% of our revenue for the fiscal year ended September 30, 2016. As a result, we believe ourbusiness is diversified and insulated from dislocations in specific market verticals. We estimate our endmarkets are growing at a weighted average of approximately 3% per annum. Further, we believe manyof our end markets represents significant market opportunities because they are highly fragmented andnot yet fully penetrated.
8

Unparalleled channels to market and service network to support our diversified, blue-chip customer base.With over four times as many branches as our next largest competitor based on management’sestimates and analysis, our 86 service branches are located within a two-hour drive of more than 90%of our more than 25,000 industrial customer sites in North America. Across our global servicebranches, we have nearly 600 sales and support personnel and 800 field technicians. We believe ourdirect sales force is important to our customers. Most of our sales personnel are assigned to specificend markets and possess extensive application-specific knowledge, allowing us to provide customizedand fully integrated solutions leading to a unique level of intimacy with our end users. Our continuedsuccess depends on our ability to retain or attract skilled technical, engineering, sales and other keypersonnel, for whom competition is intense, both in retaining our existing employees and in replacingor finding additional employees. We complement our sales approach with our Global CorporateAccounts Management team, which we use to drive greater penetration across our extensive portfolioof large blue-chip customers and engineering firms. The efforts of our sales force are further enhancedby the ongoing dialogue and interactions our field technicians have with customers, which provides usreal-time feedback and serve as a source of leads on new sales opportunities. We also have a growingglobal product network that provides us access to commercial opportunities beyond our installed baseand core geographic regions. Overall, we believe that our channels to market play a key role in oursuccess in our core market while also allowing us to rapidly commercialize new technologies as well asscale tuck-in acquisitions. Further, our customer base consists of over 38,000 customers including asubstantial majority of the industrial companies within the Fortune 500 and spans a wide array ofend-markets. We face low customer concentration, with no single customer accounting for over 1% ofour revenue for the fiscal year ended September 30, 2016.
Iconic brands supported by leading proprietary and differentiated technologies. We believe our brandsare known across the water treatment marketplace for innovation, quality, customer service, safety andreliability. Our customers’ familiarity with our brands enhances our sales capabilities and allows us tomore effectively engage existing and new customers. Our reputation depends on our ability to provideour industry-leading water treatment solution offering, and we have a number of patent-protectedcornerstone technologies that support our business. Leveraging these technologies allows us to offersolutions across the entire spectrum of the water treatment lifecycle. Our innovation process issupported through six global research, development and engineering (‘‘RD&E’’) facilities, along withpartnerships spanning leading universities research centers and other outside agencies. Our internalRD&E framework, the Evoqua Innovation Process, is fully deployed and uses a stage-gate approach toidentifying, prioritizing and implementing innovation projects across the organization.
Our innovation platform has generated an extensive portfolio of intellectual property with morethan 1,250 granted or pending patents. In the fiscal year ended September 30, 2016, excluding partsand service, approximately 47% of our revenue was directly or indirectly covered by our granted orpending patents. Our core and established technologies include electrodeionization and advancedoxidation, which allow for chemical free ultra-high purity water solutions; Water One, which leveragesadvanced sensing and analytics to provide water on demand, remote condition monitoring andpredictive maintenance; and mobile treatment services, which provide expedited services in emergencysituations. Our newly developed and acquired technologies include our recently acquired Defender lineof regenerative media filtration, which is a leader in commercial aquatics filtration; BioMag andCoMag, which address the need for capital-light solutions to increase throughput within municipaltreatment facilities; and SeaCURE, which treats ballast water in order to actively remove, kill orinactivate organisms before discharge. We must continue to develop and acquire new products, servicesand solutions to meet the demands of our customers and compete in our markets. Our current pipelineof technologies in development includes biological wastewater diffused aeration, on-site electrolyticchlorination and electrochemical desalination, which are designed to help lower customer costs andexpand our market reach.
9
Stable, recurring flow of business with a large installed base drives superior topline visibility. We hadhigh visibility into over 82% of our overall revenue at the beginning of fiscal 2016. Approximately 58%of our revenue for fiscal 2016 was related to service, consumables and aftermarket parts that comefrom our repeat business and backlog. A portion of this revenue is covered by annual and multi-yearindustrial contracts that had a 98% and 99% renewal rate in fiscal 2015 and 2016, respectively. Wegenerate service and aftermarket revenue from a wide range of activities, including the regular deliveryand installation of consumable ion-exchange replacement bottles across 25,000 industrial customer sitesand the regular replacement of approximately 400,000 ultra-filtration membranes installed across 1,800locations on 4-6 year cycles as of June 30, 2017. In particular, more than 80% of Industrial customerswho purchased capital equipment during the two fiscal years ended September 30, 2015 and 2016 havealso purchased services and/or aftermarket products over the past three years. Approximately 24% ofour revenue for fiscal 2016 consisted of capital orders already contracted in backlog. The remainingapproximately 18% of revenue for the fiscal year ended September 30, 2016 represented book-to-billprojects, which we typically win and convert to revenue within the same fiscal year. For our capitalrelated sales, we selectively focus on projects that we believe have the potential to produce continuingservice, aftermarket and consumables sales. We believe the visibility and predictability we experiencewith our revenue enhances our ability to consistently drive profitability.
Well invested manufacturing and service footprint provides operating leverage and supports our growth.We believe our manufacturing, service and sales functions are capable of supporting our long-termgrowth targets. Our manufacturing base is currently operating at approximately 40% of its maximumcapacity levels at June 30, 2017, creating an opportunity for volume and margin expansion withoutsignificant new capital investments. This dynamic also enhances our ability to absorb new acquisitionsinto our existing operations, though we may not be able to successfully identify, integrate or competefor acquisition targets. We have also identified and are pursuing several operational improvementcampaigns including ePro and LEAN, our supply chain excellence initiative that centralizes andstandardizes purchasing across the organization. These initiatives, combined with low levels ofmaintenance capital expenditures and efficient working capital management, create flexibility to deploycash flow for accretive investments.
Experienced management team with proven operational capabilities that has made Evoqua an employerof choice. We are highly dependent on our leadership team, which consists of industry veterans with atrack record of executing effective strategies and achieving profitable growth. Ron Keating, our CEO, isa highly experienced executive with a strategic, commercial and operational background developed insenior roles, where he reshaped organizations and corporate portfolios for growth. Ben Stas, our CFO,has held a variety of senior financial and business roles in the capital goods sector. Our leadershipdeveloped and deployed standard operating processes under the Evoqua Growth System thatrepositioned the business and improved margins through operational programs and standards such asLEAN operating systems, service growth and ePro, among others. These programs, combined with ournewly implemented sales methodology, Evoqua EDGE, have improved our free cash flow profile andgrowth prospects. Our management team has also expanded our operations to new target markets andgeographies and has demonstrated successful acquisition and integration capabilities. Our successdepends to a significant extent on our ability to retain or attract employees in senior management,skilled technical, engineering, sales and other key personnel.
After the AEA Acquisition, we began a transformation of our business into a global organizationwith an independent, professional management team. We believe our transformation has made us intoa premier partner and employer in our industry, resulting in differentiated capabilities and talent withinour organization. We have instilled an entrepreneurial environment where employees believe in themission and leverage the collective intellect and expertise of service technicians and engineers. Todevelop a safety focused culture, we have invested heavily in our environmental, health and safety(‘‘EH&S’’) program, which is committed to providing employees with a safe and healthy workplace
10

while protecting our shared environment. Following the completion of this offering, we expect to be a‘‘controlled company’’ within the meaning of the corporate governance standards of the NYSE. See‘‘Risk Factors—Risks Relating to our Common Stock and this Offering—We are a ‘controlled company’within the meaning of the corporate governance standards of the NYSE and, as a result, will qualifyfor, and may rely on, exemptions from certain corporate governance requirements.’’
Our Growth Strategy
The key elements of our strategy include:
Grow and further penetrate our existing customer base. We believe our strong brands, leadingposition in highly fragmented markets, scalable and global offerings, leading installed base and uniqueability to provide complete treatment solutions will enable us to capture a larger share of our existingcustomers’ water treatment spend while expanding with existing and new customers into adjacentend-markets and underpenetrated regions, including by investing in our sales force and cross-selling toexisting customers. Despite having the leading market share in the North American water treatmentmarket, our share does not exceed 25% in any single market vertical according to Amane Advisors.Furthermore, our share of any given customer’s water treatment related spend is often limited to selectregions, thereby creating a significant opportunity to further penetrate existing customer accounts byoffering additional solutions and serving more sites, both in current and new geographic regions. Ourgrowth initiatives include both expanding our presence in our core North American market as well asreplicating our leading position and strategies into underpenetrated global regions. For example,through innovative technologies such as IONPURE continuous electrodeionization and Defenderaquatic regenerative media filtration systems, we have expanded our positions in markets such as Asiaand the Middle East.
In order to maintain and enhance our customer relationships, we intend to continue to invest inour sales force. Since fiscal 2014 we have increased the proportion of customer facing employees byover 25%, developed a best-in-class training program, restructured our customer relationshipmanagement system and realigned our compensation packages. Sales of our products, services andsolutions to some of our customers are also accomplished, in part, through the efforts of third-partysales representatives. Through direct sales efforts, outreach and education, we plan to continue toenhance our relationships and enable further adoption of our products, technologies and solutions byend customers and key influencers, including municipal representatives, engineering firms, designersand other system specifiers. Our performance depends, in part, on our ability to attract, incentivize andretain third-party sales representatives that will be able to market and support our products effectively,and competition for sales personnel with established customer relationships is intense.
Continued transition of our customers to a higher value-add service-based business model. Our goal isto provide ‘‘worry-free water’’ by combining our products and technologies with extensive service anddistribution capabilities. We selectively target high value projects with opportunities for recurringbusiness through service, parts and other aftermarket opportunities over the lifecycle of the process orcapital equipment. In particular, we have developed a pipeline of smart, internet-connected monitoringtechnologies through the deployment of our Water One smart water platform that provides us with anincreasing ability to handle our customers’ complete water needs through on-demand watermanagement, predictive maintenance and service response planning. Water One also enables us totransition our customers to more accurate pricing models based on usage, which otherwise would nothave been possible without technological advancement. We estimate that approximately 1.6% of ourindustrial customers utilized our Water One technology in fiscal 2016. Our technology solutions providecustomers with increased stability and predictability in water-related costs, while enabling us to optimizeour service route network and on demand offerings through predictive analytics, which we believe willresult in market share gains, improved service levels, increased barriers to entry and reduced costs. Ourfuture growth depends, in part, on our ability to develop or acquire new products, services and
11

solutions, identify emerging technological trends in our target end markets and maintain the integrity ofour information technology systems.
Drive margin expansion and cash flow improvements through continued focus on operational excellenceand execution. Since fiscal 2014, we have realigned our organizational structure, achieved significantcost savings through operational efficiencies and revitalized our culture, which has energized ourworkforce and reduced employee turnover. This organizational realignment transformed our businessinto a streamlined organization focused on improved accountability, responsiveness and resulted in anoverall lower cost structure. We have identified and are pursuing a number of discrete initiatives which,if successful, we expect could result in additional cost savings over the next three years. Theseinitiatives include our ePro and supply chain improvement program to consolidate and manage globalspending, our improved logistics and transportation management program, further optimizing ourengineering cost structure, capturing benefits of our Water One remote system monitoring and dataanalytics offerings. Furthermore, as a result of significant investments we have made in our footprintand facilities, we believe have capacity to support our planned growth without commensurate increasesin fixed costs.
Commercialize and drive adoption of nascent and newly acquired technologies by leveraging our saleschannels and application expertise. We offer a full range of services, systems and technologies that wemust continually develop to meet our customers’ evolving water lifecycle needs. We develop ourtechnologies through in-house research, development and engineering and targeted tuck-in,technology-enhancing and geography-expanding acquisitions and have a reservoir of recently launchedtechnologies and a pipeline of new offerings designed to provide customers with innovative, value-enhancing solutions. Furthermore, we have successfully completed eight technology-enhancing andgeography-expanding acquisitions since April 2016 to add new capabilities and cross-sellingopportunities in areas such as electrochemical and electrochlorination cells, regenerative mediafiltration, anodes, UV disinfection and aerobic and anaerobic biological treatment technologies. Wemust continue to develop and acquire new products, services and solutions to successfully compete inour markets.
We believe a key differentiator for our technology development program is our strong record ofincorporating new technologies into the comprehensive solutions we provide to our customers acrossour platform. We are able to rapidly scale new technologies using our leading direct and third-partysales channels and our relationships with key influencers, including municipal representatives,engineering firms, designers and other system specifiers. Through our service network, we have a directview of our customers’ water needs which allows us to focus on developing and acquiring the mostrelevant and sought-after solutions.
We believe our continued investment in driving penetration of our recently launched technologies,robust pipeline of new capabilities and best-in-class channels to market will allow us to continue toaddress our customer needs across the water lifecycle.
Continue to evaluate and pursue accretive tuck-in acquisitions to add new technologies, attractivegeographic regions and end-markets. As a complement to our organic growth initiatives, we view tuck-inacquisitions as a key element of our overall growth strategy which will enable us to accelerate ourgrowth in our current addressable market, new geographies and new end market verticals. Our existingcustomer relationships, channels to market and ability to rapidly commercialize technologies provide astrong platform to drive growth in the businesses we acquire. To capitalize on these opportunities wehave built an experienced team dedicated to mergers and acquisitions that has successfully completedeight technology-enhancing and geography-expanding acquisitions since April 2016, including theaddition of capabilities in the attractive aquatics market, which we have typically financed throughborrowings under our revolving credit facility and cash on hand. Although we may not continue toidentify suitable acquisition targets and implement our growth strategy, we currently have a pipeline
12

which includes more than 60 potential targets, which has been developed proactively by our team aswell as informed by our customer base.
Our Sponsor
AEA is one of the most experienced global private investment firms. Founded in 1968, AEAcurrently manages approximately $10 billion of capital for an investor group that includes former andcurrent chief executive officers of major multinational corporations, family groups and institutionalinvestors from around the world. With a staff of approximately 60 investment professionals and officesin New York, Stamford, London, Munich and Shanghai, AEA focuses on investing in companies in theconsumer products/retail, industrial, specialty chemicals and related services sectors.
In addition to Evoqua, representative current and former value-added industrial products portfoliocompanies include B.I. Incorporated, BOA Group, CPG International, Dematic, GMS, HenryCompany, Houghton International, LoneStar Group, Mettler-Toledo International, NES Global Talent,Noveon International, Pregis Corporation, Pro Mach Group, Reladyne, Sparrows Group, SRSDistribution, Symrise, TricorBraun Holdings, Unifrax Corporation, VC GB Holdings and WatersCorporation.
After completion of this offering, we expect to be a ‘‘controlled company’’ within the meaning ofthe corporate governance standards of the NYSE. See ‘‘Risk Factors—Risks Relating to Our CommonStock and this Offering—We are a ‘controlled company’ within the meaning of the corporategovernance standards of the NYSE and, as a result, will qualify for, and may rely on, exemptions fromcertain corporate governance requirements.’’
Risks Associated with Our Business
We are subject to a number of risks, including risks that may prevent us from achieving ourbusiness objectives or that may adversely affect our business, financial condition, results of operationsor prospects. You should carefully consider the risks discussed in the section entitled ‘‘Risk Factors,’’including the following risks, before investing in our common stock:
• general global economic and business conditions may adversely affect demand for our products,services and solutions;
• failure to compete successfully in our markets could adversely affect our business, financialcondition, results of operations or prospects;
• our future growth is dependent upon our ability to continue to develop and acquire ourproducts, services and solutions and adapt our businesses to meet the demands of our customers,comply with changes to government regulations and achieve market acceptance with acceptablemargins;
• our growth strategy includes acquisitions, and we may not be able to identify suitable acquisitiontargets or otherwise successfully implement our growth strategy;
• we may have difficulty in operating or integrating any acquired businesses, assets or productlines profitably or in otherwise successfully implementing our growth strategy;
• delays in enactment or repeals of environmental laws and regulations may make our products,services and solutions less economically beneficial to our customers, thereby affecting demandfor our products, services and solutions;
• if we become subject to claims relating to handling, storage, release or disposal of hazardousmaterials, we could incur significant cost and time to comply;
• product defects and unanticipated or improper use of our products could adversely affect ourbusiness, reputation and financial statements;
13

• we may incur liabilities to customers as a result of warranty claims or failure to meetperformance guarantees, which could reduce our profitability;
• our inability to meet our customers’ safety standards or adverse publicity affecting our reputationas a result of incidents such as workplace accidents, mechanical failures, spills, uncontrolleddischarges, damage to customer or third-party property or the transmission of contaminants ordiseases could have a material adverse effect on our sales and profitability;
• our products, services and solutions, or our participation in large-scale projects, could expose usto litigation, regulatory or enforcement actions and reputational risk;
• seasonality of sales and weather conditions may adversely affect, or cause volatility in, ourfinancial results;
• government customers involve unique policy-, contract- and performance-related risks, and weface many challenges to our government contracts or our eligibility to serve governmentcustomers, any of which could materially adversely impact our business, financial condition,results of operations or prospects;
• our contracts with federal, state and local governments may be terminated or adversely modifiedprior to completion, which could adversely affect our business;
• the cost of complying with complex governmental regulations applicable to our business,sanctions resulting from non-compliance or reduced demand resulting from certain changes inregulations could increase our operating costs and reduce our profit;
• wastewater operations entail significant risks that may impose significant costs;
• we are increasingly dependent on the continuous and reliable operation of our informationtechnology systems, and a disruption of these systems could materially adversely affect ourbusiness;
• if we experience a significant data security breach or fail to detect and appropriately respond toa significant data security breach, our business and reputation could suffer;
• our substantial indebtedness could, among other things, adversely affect our financial condition,reduce or limit our available cash flows and ability to raise additional capital to fund ouroperations or strategic transactions, and have other important consequences to us, includingmaking it more difficult for us to satisfy our debt obligations, exposing us to the risk ofincreased interest rates, limiting our flexibility in planning for, and reacting to changes in, ourbusiness and industry and placing us at a disadvantage relative to our competitors;
• because AEA controls a significant percentage of our common stock, it may influence all majorcorporate decisions, and the interests of AEA and its affiliates, including certain of ourdirectors, may conflict with your interests as an owner of our common stock and those of theCompany; and
• we are a ‘‘controlled company’’ within the meaning of the corporate governance standards of theNYSE and, as a result, will qualify for, and may rely on, exemptions from certain corporategovernance requirements.
Recent Developments
Headquarters Move
On July 28, 2017, we moved our world headquarters and its approximately 200 employees from ourWarrendale, Pennsylvania offices to 210 Sixth Avenue in Pittsburgh, Pennsylvania’s Central BusinessDistrict. We currently lease three floors at 210 Sixth Avenue, with an initial lease term of 10 yearscovering approximately 60,000 square feet of space. We retain certain options to expand the amount ofspace we occupy and to extend the term of the lease.
14

August 2017 Refinancing
On August 8, 2017, EWT Holdings II Corp., as the parent guarantor, EWT Holdings III Corp., asthe borrower, and certain wholly-owned subsidiaries of EWT Holdings II Corp., entered into theAugust 2017 Amendment to the First Lien Credit Agreement.
Prior to the August 2017 Refinancing, the Term Loan Facility consisted of (i) the term loans madeon January 15, 2014 and the October 2016 Incremental Loans (the ‘‘Existing Term Loan Tranche’’) and(ii) the NB Incremental Loans. Pursuant to the August 2017 Amendment, we incurred approximately$262.7 million of refinancing term loans (the ‘‘August 2017 Refinancing Loans’’), the net proceeds ofwhich were used to refinance the NB Incremental Loans in their entirety. As a result of suchrefinancing, the Term Loan Facility now consists of a single tranche of term loans, comprised of theterm loans made on January 15, 2014, the October 2016 Incremental Loans, the August 2017Refinancing Loans and the August 2017 Incremental Loans (as defined below).
Pursuant to the August 2017 Refinancing, we also incurred approximately $80.0 million ofincremental term loans (the ‘‘August 2017 Incremental Loans’’), the net proceeds of which were used torepay $60.0 million of revolving credit loans then outstanding and to pay fees and expenses inconnection with the transactions thereunder and for other general corporate purposes.
As of August 8, 2017, the terms of the Term Loan Facility are now consistent with the terms of theExisting Term Loan Tranche (including with respect to pricing) and the provisions governing the NBIncremental Loans contained in Incremental Term Facility Amendment No. 1, dated as of April 15,2016, to the First Lien Credit Agreement, are superseded in their entirety by the terms of the August2017 Refinancing. As of June 30, 2017, we had $898.7 million of borrowings under the Term LoanFacility, after giving effect to the August 2017 Refinancing.
Preliminary Financial Results for the Three Months and Fiscal Year Ended September 30, 2017
Our preliminary estimated unaudited financial results as of and for the three months and fiscalyear ended September 30, 2017 are set forth below. Our estimates of results are based solely oninformation available to us as of the date of this prospectus and are inherently uncertain and subject tochange due to a variety of business, economic and competitive risks and uncertainties, many of whichare not within our control, and we undertake no obligation to update this information. Our estimatescontained in this prospectus are forward-looking statements. Actual results remain subject to thecompletion of management’s and our audit committee’s final reviews and our other financial closingprocedures, as well as the completion of the audit of our annual consolidated financial statements, asdescribed below. Our actual consolidated financial statements and related notes as of and for the fiscalyear ended September 30, 2017 are not expected to be filed with the SEC until after this offering iscompleted. During the course of the preparation of our actual consolidated financial statements andrelated notes, additional items that would require material adjustments to the preliminary estimatedfinancial information presented below may be identified. See ‘‘Management’s Discussion and Analysisof Financial Condition and Results of Operations—Critical Accounting Policies and Estimates—Use ofEstimates,’’ ‘‘Risk Factors—Risks Relating to Our Business’’ and ‘‘Cautionary Note Regarding Forward-Looking Statements’’ included elsewhere in this prospectus.
The preliminary financial data included in this prospectus have been prepared by and are theresponsibility of our management. Our independent accountant, Ernst & Young LLP, has not audited,reviewed, compiled or performed any procedures with respect to the preliminary financial data.Accordingly, Ernst & Young LLP does not express an opinion or any other form of assurance withrespect thereto.
These estimates are not a comprehensive statement of our financial results as of and for the threemonths or fiscal year ended September 30, 2017, and should not be viewed as a substitute for fullfinancial statements prepared in accordance with GAAP. In addition, these preliminary estimates as of
15
and for the three months and fiscal year ended September 30, 2017 are not necessarily indicative of theresults to be achieved in any future period.
As reflected below, we expect to report increases in revenues, net income and Adjusted EBITDAfor the three months ended September 30, 2017 as compared to the comparable prior period. Also, weexpect to report an increase in revenue, a decrease in net income, and an increase in AdjustedEBITDA for the fiscal year ended September 30, 2017 as compared to the comparable prior period.
• For the three months ended September 30, 2017, we expect to report revenues in the range of$354.0 million to $357.0 million, as compared to $319.4 million for the three months endedSeptember 30, 2016. The increase in revenues for the period was driven by organic revenuegrowth related to capital project activity, growth in Electro-catalytic equipment sales in globalmarine and hydrocarbon markets and increased sales of disinfection products, as well as growthin Industrial services provided to our U.S. power, hydrocarbon and chemical processing customerbase. Additionally, the increase in revenues for the period was attributable to acquisitionscompleted in the current and latter part of the prior year, including VAF and Delta UV in fiscal2016 and ETS, Noble, ADI and Olson in fiscal 2017, which revenue increase was somewhatoffset by revenues related to our Vernon location in the three months ended September 30, 2016that did not reoccur because of the disposition of that location as of September 30, 2016.
• For the fiscal year ended September 30, 2017, we expect to report revenues in the range of$1,245.0 million to $1,248.0 million, as compared to revenues of $1,137.2 million and pro formarevenues of $1,171.4 million for the fiscal year ended September 30, 2016. The increase inrevenues year over year was driven by an increase in organic revenue growth related toIndustrial service revenue associated with new business in power, hydrocarbon and chemicalprocessing end markets. In addition, higher U.S.-customer production levels in the generalmanufacturing and pharmaceutical and healthcare end markets contributed to service growth.Organic revenue growth was also favorably impacted by increased revenue associated with ourpower and microelectronics markets in the Asia region, as well as growth in disinfection productsales and increased capital project activity. In addition to organic revenue growth, the increase inrevenues year over year was attributable to the full year impact of the acquisitions ofNeptune-Benson, VAF, Delta UV and Magneto. Fiscal 2017 acquisitions of ETS, Noble, ADIand Olson also contributed to revenue growth as compared to the prior year. These increaseswere somewhat offset by revenues related to our Vernon location in fiscal year 2016 that did notreoccur because of the disposition of that location as of September 30, 2016.
• We expect to report net income in the range of $12.0 million to $12.8 million for the threemonths ended September 30, 2017 as compared to a net income of $0.2 million for the threemonths ended September 30, 2016. The increase in net income in this period was drivenprimarily by the increased volume and profitability associated with organic revenue growth andacquisitions, as well as the incremental benefits from restructuring activities and operationalefficiencies that were implemented in the prior year (net of charges from additionalrestructuring actions taken in the current period).
• We expect to report net income in the range of $5.5 million to $6.3 million for the fiscal yearended September 30, 2017 as compared to net income of $13.0 million and pro forma netincome of $16.8 million for the fiscal year ended September 30, 2016. The decrease in netincome in this period was driven primarily by the recognition of income tax benefit in the priorperiod of approximately $18.4 million as compared to income tax expense in the range of$7.0 million to $8.0 million in the current period. Additionally, there was an increase in interestexpense in the current period in the range of $55.0 million to $55.5 million as compared tointerest expense in the prior period of approximately $42.5 million ($52.3 million pro forma).These factors offset the increased revenue volume and profitability associated organic revenue
16
growth and acquisitions and operational efficiencies that were implemented in the prior year(net of charges from additional restructuring actions taken in the current period).
• We expect to report Adjusted EBITDA in the range of $69.0 million to $72.0 million for thethree months ended September 30, 2017 as compared to $59.4 million for the three monthsended September 30, 2016. Increased organic revenue volume and the benefits of restructuringand operational efficiencies across the business contributed to the increase in Adjusted EBITDAfor the three months ended September 30, 2017. In addition, the increase in Adjusted EBITDAwas attributable to acquisitions completed in the current and latter part of the prior year,including VAF and Delta UV in fiscal 2016 and ETS, Noble, ADI and Olson in fiscal 2017.Please see below for a reconciliation of our net income (loss) to our Adjusted EBITDA.
• We expect to report Adjusted EBITDA in the range of $205.0 million to $208.0 million for thefiscal year ended September 30, 2017 as compared to Adjusted EBITDA of $160.1 million forthe fiscal year ended September 30, 2016. In addition, we expect to report Adjusted EBITDA(as adjusted for contributions from insignificant completed acquisitions) in the range of$214.3 million to $217.3 million for the fiscal year ended September 30, 2017 as compared toAdjusted EBITDA (pro forma as adjusted for contributions from insignificant completedacquisitions) of $182.5 million for the fiscal year ended September 30, 2016. Adjusted EBITDAwas favorably impacted by increased organic revenue volume and the benefits of restructuringand operational efficiencies across the business. In addition, the increase in Adjusted EBITDAyear over year was attributable to the acquisitions of Neptune-Benson, VAF, Delta UV andMagneto. Fiscal 2017 acquisitions of ETS, Noble, ADI and Olson also contributed to AdjustedEBITDA growth as compared to the prior year. Please see below for a reconciliation of our netincome to our Adjusted EBITDA.
The following information as of and for the three months and the fiscal year ended September 30,2017 sets forth the low and high ends of the ranges of our preliminary estimated financial data. Asnoted above, each of the line items presented below represents our preliminary estimated unauditedfinancial results which remain subject to the completion of management’s and our audit committee’sfinal reviews and our other financial closing procedures, as well as the completion of the audit of ourannual consolidated financial statements. During the course of the preparation of the consolidatedfinancial statements and related notes, additional information may cause a change in, or requirematerial adjustments to, certain accounting estimates and other financial information, in particular,estimates and financial information related to our Restructuring and related business transformationcosts and our Income tax (benefit) expense, which would impact net income and Adjusted EBITDA.
Three Months Ended Fiscal Year EndedSeptember 30, September 30,
2017 2016 2017 2016
Low High Low High
(estimated) (historical) (estimated) (pro forma)(1) (historical)(in thousands) (in thousands)
Revenue from product sales andservices . . . . . . . . . . . . . . . . . . . $354,000 $357,000 $319,408 $1,245,000 $1,248,000 $1,171,389 $1,137,196
Net income . . . . . . . . . . . . . . . . . . $ 12,000 $ 12,800 $ 165 $ 5,500 $ 6,300 $ 13,121 $ 13,031Adjusted EBITDA(2) . . . . . . . . . . . $ 69,000 $ 72,000 $ 59,421 $ 205,000 $ 208,000 $ 168,528 $ 160,053Adjusted EBITDA (as adjusted for
insignificant completedacquisitions)(2) . . . . . . . . . . . . . . $ 214,287 $ 217,287 $ 182,449
(1) The unaudited summary pro forma financial information for the fiscal year ended September 30, 2016 has beenderived from our unaudited pro forma consolidated financial information included in this prospectus under‘‘Unaudited Pro Forma Financial Information’’ and has been prepared to give effect to the transactions described inthis prospectus under ‘‘Unaudited Pro Forma Financial Information’’ as if they had occurred on the dates discussed
17
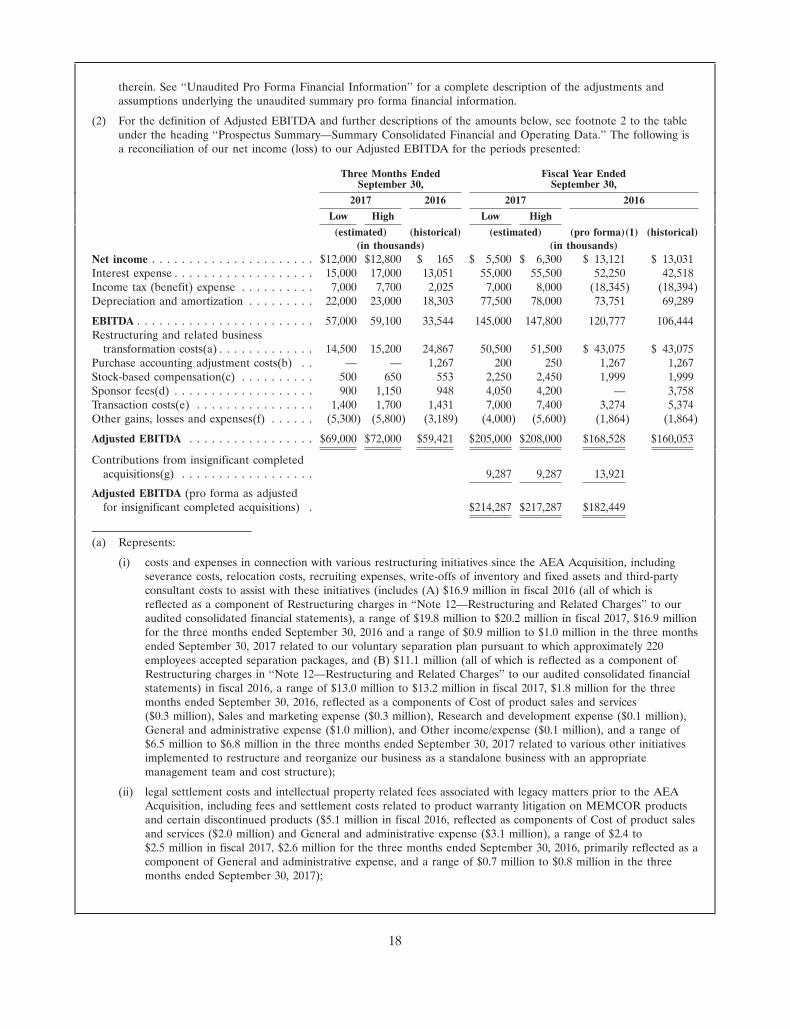
therein. See ‘‘Unaudited Pro Forma Financial Information’’ for a complete description of the adjustments andassumptions underlying the unaudited summary pro forma financial information.
(2) For the definition of Adjusted EBITDA and further descriptions of the amounts below, see footnote 2 to the tableunder the heading ‘‘Prospectus Summary—Summary Consolidated Financial and Operating Data.’’ The following isa reconciliation of our net income (loss) to our Adjusted EBITDA for the periods presented:
Three Months Ended Fiscal Year EndedSeptember 30, September 30,
2017 2016 2017 2016
Low High Low High
(estimated) (historical) (estimated) (pro forma)(1) (historical)(in thousands) (in thousands)
Net income . . . . . . . . . . . . . . . . . . . . . . $12,000 $12,800 $ 165 $ 5,500 $ 6,300 $ 13,121 $ 13,031Interest expense . . . . . . . . . . . . . . . . . . . 15,000 17,000 13,051 55,000 55,500 52,250 42,518Income tax (benefit) expense . . . . . . . . . . 7,000 7,700 2,025 7,000 8,000 (18,345) (18,394)Depreciation and amortization . . . . . . . . . 22,000 23,000 18,303 77,500 78,000 73,751 69,289
EBITDA . . . . . . . . . . . . . . . . . . . . . . . . 57,000 59,100 33,544 145,000 147,800 120,777 106,444Restructuring and related business
transformation costs(a) . . . . . . . . . . . . . 14,500 15,200 24,867 50,500 51,500 $ 43,075 $ 43,075Purchase accounting adjustment costs(b) . . — — 1,267 200 250 1,267 1,267Stock-based compensation(c) . . . . . . . . . . 500 650 553 2,250 2,450 1,999 1,999Sponsor fees(d) . . . . . . . . . . . . . . . . . . . 900 1,150 948 4,050 4,200 — 3,758Transaction costs(e) . . . . . . . . . . . . . . . . 1,400 1,700 1,431 7,000 7,400 3,274 5,374Other gains, losses and expenses(f) . . . . . . (5,300) (5,800) (3,189) (4,000) (5,600) (1,864) (1,864)
Adjusted EBITDA . . . . . . . . . . . . . . . . . $69,000 $72,000 $59,421 $205,000 $208,000 $168,528 $160,053
Contributions from insignificant completedacquisitions(g) . . . . . . . . . . . . . . . . . . 9,287 9,287 13,921
Adjusted EBITDA (pro forma as adjustedfor insignificant completed acquisitions) . $214,287 $217,287 $182,449
(a) Represents:
(i) costs and expenses in connection with various restructuring initiatives since the AEA Acquisition, includingseverance costs, relocation costs, recruiting expenses, write-offs of inventory and fixed assets and third-partyconsultant costs to assist with these initiatives (includes (A) $16.9 million in fiscal 2016 (all of which isreflected as a component of Restructuring charges in ‘‘Note 12—Restructuring and Related Charges’’ to ouraudited consolidated financial statements), a range of $19.8 million to $20.2 million in fiscal 2017, $16.9 millionfor the three months ended September 30, 2016 and a range of $0.9 million to $1.0 million in the three monthsended September 30, 2017 related to our voluntary separation plan pursuant to which approximately 220employees accepted separation packages, and (B) $11.1 million (all of which is reflected as a component ofRestructuring charges in ‘‘Note 12—Restructuring and Related Charges’’ to our audited consolidated financialstatements) in fiscal 2016, a range of $13.0 million to $13.2 million in fiscal 2017, $1.8 million for the threemonths ended September 30, 2016, reflected as a components of Cost of product sales and services($0.3 million), Sales and marketing expense ($0.3 million), Research and development expense ($0.1 million),General and administrative expense ($1.0 million), and Other income/expense ($0.1 million), and a range of$6.5 million to $6.8 million in the three months ended September 30, 2017 related to various other initiativesimplemented to restructure and reorganize our business as a standalone business with an appropriatemanagement team and cost structure);
(ii) legal settlement costs and intellectual property related fees associated with legacy matters prior to the AEAAcquisition, including fees and settlement costs related to product warranty litigation on MEMCOR productsand certain discontinued products ($5.1 million in fiscal 2016, reflected as components of Cost of product salesand services ($2.0 million) and General and administrative expense ($3.1 million), a range of $2.4 to$2.5 million in fiscal 2017, $2.6 million for the three months ended September 30, 2016, primarily reflected as acomponent of General and administrative expense, and a range of $0.7 million to $0.8 million in the threemonths ended September 30, 2017);
18
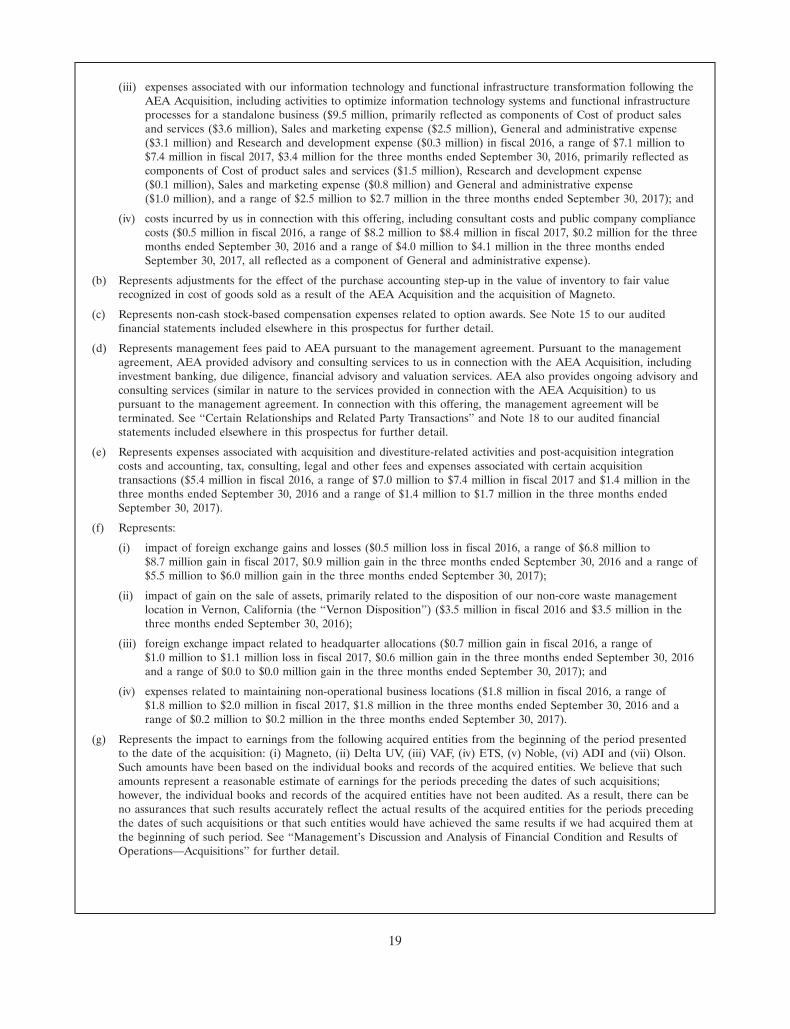
(iii) expenses associated with our information technology and functional infrastructure transformation following theAEA Acquisition, including activities to optimize information technology systems and functional infrastructureprocesses for a standalone business ($9.5 million, primarily reflected as components of Cost of product salesand services ($3.6 million), Sales and marketing expense ($2.5 million), General and administrative expense($3.1 million) and Research and development expense ($0.3 million) in fiscal 2016, a range of $7.1 million to$7.4 million in fiscal 2017, $3.4 million for the three months ended September 30, 2016, primarily reflected ascomponents of Cost of product sales and services ($1.5 million), Research and development expense($0.1 million), Sales and marketing expense ($0.8 million) and General and administrative expense($1.0 million), and a range of $2.5 million to $2.7 million in the three months ended September 30, 2017); and
(iv) costs incurred by us in connection with this offering, including consultant costs and public company compliancecosts ($0.5 million in fiscal 2016, a range of $8.2 million to $8.4 million in fiscal 2017, $0.2 million for the threemonths ended September 30, 2016 and a range of $4.0 million to $4.1 million in the three months endedSeptember 30, 2017, all reflected as a component of General and administrative expense).
(b) Represents adjustments for the effect of the purchase accounting step-up in the value of inventory to fair valuerecognized in cost of goods sold as a result of the AEA Acquisition and the acquisition of Magneto.
(c) Represents non-cash stock-based compensation expenses related to option awards. See Note 15 to our auditedfinancial statements included elsewhere in this prospectus for further detail.
(d) Represents management fees paid to AEA pursuant to the management agreement. Pursuant to the managementagreement, AEA provided advisory and consulting services to us in connection with the AEA Acquisition, includinginvestment banking, due diligence, financial advisory and valuation services. AEA also provides ongoing advisory andconsulting services (similar in nature to the services provided in connection with the AEA Acquisition) to uspursuant to the management agreement. In connection with this offering, the management agreement will beterminated. See ‘‘Certain Relationships and Related Party Transactions’’ and Note 18 to our audited financialstatements included elsewhere in this prospectus for further detail.
(e) Represents expenses associated with acquisition and divestiture-related activities and post-acquisition integrationcosts and accounting, tax, consulting, legal and other fees and expenses associated with certain acquisitiontransactions ($5.4 million in fiscal 2016, a range of $7.0 million to $7.4 million in fiscal 2017 and $1.4 million in thethree months ended September 30, 2016 and a range of $1.4 million to $1.7 million in the three months endedSeptember 30, 2017).
(f) Represents:
(i) impact of foreign exchange gains and losses ($0.5 million loss in fiscal 2016, a range of $6.8 million to$8.7 million gain in fiscal 2017, $0.9 million gain in the three months ended September 30, 2016 and a range of$5.5 million to $6.0 million gain in the three months ended September 30, 2017);
(ii) impact of gain on the sale of assets, primarily related to the disposition of our non-core waste managementlocation in Vernon, California (the ‘‘Vernon Disposition’’) ($3.5 million in fiscal 2016 and $3.5 million in thethree months ended September 30, 2016);
(iii) foreign exchange impact related to headquarter allocations ($0.7 million gain in fiscal 2016, a range of$1.0 million to $1.1 million loss in fiscal 2017, $0.6 million gain in the three months ended September 30, 2016and a range of $0.0 to $0.0 million gain in the three months ended September 30, 2017); and
(iv) expenses related to maintaining non-operational business locations ($1.8 million in fiscal 2016, a range of$1.8 million to $2.0 million in fiscal 2017, $1.8 million in the three months ended September 30, 2016 and arange of $0.2 million to $0.2 million in the three months ended September 30, 2017).
(g) Represents the impact to earnings from the following acquired entities from the beginning of the period presentedto the date of the acquisition: (i) Magneto, (ii) Delta UV, (iii) VAF, (iv) ETS, (v) Noble, (vi) ADI and (vii) Olson.Such amounts have been based on the individual books and records of the acquired entities. We believe that suchamounts represent a reasonable estimate of earnings for the periods preceding the dates of such acquisitions;however, the individual books and records of the acquired entities have not been audited. As a result, there can beno assurances that such results accurately reflect the actual results of the acquired entities for the periods precedingthe dates of such acquisitions or that such entities would have achieved the same results if we had acquired them atthe beginning of such period. See ‘‘Management’s Discussion and Analysis of Financial Condition and Results ofOperations—Acquisitions’’ for further detail.
19
17OCT201719064168
Organizational Structure
The chart below summarizes our ownership and corporate structure after giving effect to thisoffering.
AEA, co-investors,management, employees
and other holdersInvestors in this offering
EWT Holdings II Corp.
EWT Holdings III Corp.
Borrower under ourRevolving CreditFacility and Term
Loan Facility
OperatingSubsidiaries
Evoqua Water Technologies Corp.(Issuer)
100%
100%
100%
75.5% 24.5%
Corporate Information
Evoqua Water Technologies Corp. (formerly EWT Holdings I Corp.) was incorporated as aDelaware corporation on October 7, 2013 under the name WTG Holdings I Corp. Our principalexecutive office is located at 210 Sixth Avenue, Pittsburgh, Pennsylvania 15222, and our telephonenumber at that address is (724) 772-0044. We maintain a website at www.evoqua.com, which containsinformation about us. The information contained on, or that can be accessed through, our website isnot a part of, and should not be considered as being incorporated by reference into, this prospectus.
20
The Offering
Common stock offered by us . . . . . . . 8,333,333 shares.
Common stock offered by the sellingstockholders . . . . . . . . . . . . . . . . . 19,444,444 shares (or 23,611,110 shares if the underwriters
exercise in full their option to purchase additional shares).
Common stock to be outstandingimmediately after this offering . . . . 113,282,257 shares.
Option to purchase additional sharesfrom the selling stockholders . . . . . The underwriters have an option to purchase up to an
aggregate of 4,166,666 additional shares of common stockfrom the selling stockholders at the initial public offeringprice, less underwriting discounts and commissions. Theunderwriters can exercise this option at any time within30 days from the date of this prospectus.
Use of proceeds . . . . . . . . . . . . . . . . We estimate that the net proceeds to us from this offering,after deducting underwriting discounts and commissions andestimated offering expenses, will be approximately$135.4 million, assuming the shares are offered at $18.00 pershare (the midpoint of the price range set forth on the coverpage of this prospectus).
We intend to use the net proceeds received by us in thisoffering to repay approximately $100.5 million of indebtedness(including accrued and unpaid interest) under the Term LoanFacility and any remainder for general corporate purposes. Wewill not receive any proceeds from the sale of shares by theselling stockholders. See ‘‘Use of Proceeds.’’
Dividend policy . . . . . . . . . . . . . . . . We do not expect to pay any dividends on our common stockfor the foreseeable future. See ‘‘Dividend Policy.’’
Proposed NYSE symbol . . . . . . . . . . ‘‘AQUA.’’
Directed share program . . . . . . . . . . The underwriters have reserved for sale, at the initial publicoffering price, up to 694,444 shares of common stock to beoffered to our directors, officers and certain employees. Wewill offer these shares to the extent permitted underapplicable regulations. The number of shares available for saleto the general public in this offering will be reduced to theextent these persons purchase reserved shares. Any reservedshares not purchased will be offered by the underwriters tothe general public on the same terms as the other shares. See‘‘Underwriting.’’
21

Controlled company . . . . . . . . . . . . . Following this offering, we will continue to be a ‘‘controlledcompany’’ within the meaning of the corporate governancestandards of the NYSE. See ‘‘Risk Factors—Risks Relating toour Common Stock and this Offering—We are a ‘controlledcompany’ within the meaning of the corporate governancestandards of the NYSE and, as a result, will qualify for, andmay rely on, exemptions from certain corporate governancerequirements.’’
Risk factors . . . . . . . . . . . . . . . . . . . Investing in our common stock involves a high degree of risk.See ‘‘Risk Factors’’ beginning on page 28 of this prospectusfor a discussion of factors you should carefully consider beforeinvesting in our common stock.
The number of shares of common stock to be outstanding after this offering excludes:
• 9,168,049 shares of common stock issuable upon the exercise of options outstanding under ourStock Option Plan as of October 16, 2017 at a weighted average exercise price of approximately$5.18 per share;
• 5,100,000 shares reserved for future issuance under our 2017 Equity Incentive Plan, which hasbeen approved in connection with this offering; and
• an estimated 1,406,029 shares underlying grants of stock-settled restricted stock unit awards(estimated using the initial public offering price of $18.00 per share, the midpoint of the pricerange set forth on the cover page of this prospectus) expected to be made in connection withthis offering to certain members of management, the aggregate value of which equals$25 million, with the actual number of restricted stock unit awards to be calculated based on theclosing price of our common stock on the NYSE on the first day of trading.
Unless otherwise indicated, all information contained in this prospectus:
• assumes an initial public offering price of $18.00 per share, which is the midpoint of the pricerange set forth on the cover page of this prospectus;
• assumes the underwriters’ option to purchase additional shares from the selling stockholders willnot be exercised;
• gives effect to an approximate 26.9576-for-one stock split effected on October 16, 2017; and
• gives effect to our amended and restated certificate of incorporation and our amended andrestated bylaws, which became effective on October 16, 2017.
22
Summary Consolidated Financial and Operating Data
Our summary consolidated balance sheet data presented below as of September 30, 2015 and 2016and our summary consolidated statements of operations and cash flow data presented below for theperiod from October 1, 2013 through January 15, 2014 and the period from January 16, 2014 throughSeptember 30, 2014 (each as described below) and for each of the fiscal years ended September 30,2015 and 2016 have been derived from our audited consolidated financial statements includedelsewhere in this prospectus. Our summary consolidated balance sheet data presented below as ofJanuary 15, 2014 and September 30, 2014 has been derived from our unaudited financial informationand our audited consolidated financial statements, respectively, not included in this prospectus. Oursummary consolidated balance sheet data presented below as of June 30, 2017 and our summaryconsolidated statements of operations and cash flow data presented below for the nine months endedJune 30, 2016 and 2017 has been derived from the unaudited consolidated financial statements includedelsewhere in this prospectus. Our summary consolidated balance sheet data presented below as ofJune 30, 2016 has been derived from our unaudited consolidated financial statements not included inthis prospectus. The unaudited consolidated financial statements were prepared on a basis consistentwith that used in preparing our audited consolidated financial statements and include all adjustments,consisting of normal and recurring items, that we consider necessary for a fair presentation of ourfinancial position and results of operations for the unaudited periods. The summary consolidatedfinancial data of our Predecessor as of January 15, 2014 and for the period from October 1, 2013through January 15, 2014 was prepared on a ‘‘carve-out’’ basis for the purpose of presenting ourhistorical financial position, results of operations and cash flows.
On January 15, 2014, Evoqua Water Technologies Corp. (formerly EWT Holdings I Corp.)acquired, through its wholly-owned entities, EWT Holdings II Corp. and EWT Holdings III Corp., allof the capital stock of the Predecessor. As a result of the AEA Acquisition and resulting change incontrol and changes due to the impact of purchase accounting, we are required to present separatelythe operating results for the Predecessor and Successor. We refer to the period from October 1, 2013through January 15, 2014 as ‘‘Predecessor Period 2014,’’ and the consolidated financial statements forthat period include the accounts of the Predecessor. The financial data presented for this period is notnecessarily indicative of our current or future performance and does not reflect what our performancewould have been had we operated as a separate stand-alone entity during this period. We refer to theperiod from January 16, 2014 through September 30, 2014 as ‘‘Successor Period 2014,’’ and theconsolidated financial statements for that period include the accounts of the Successor. The Successorwas incorporated on October 7, 2013. From October 7, 2013 to January 15, 2014, the Successor had noactivities other than the incurrence of transaction costs related to the AEA Acquisition, which areincluded in the Successor Period 2014. Consequently, Successor Period 2014, fiscal 2015 and fiscal 2016may not be comparable to Predecessor Period 2014.
Our historical results presented below are not necessarily indicative of the results to be expectedfor any future period. The summary consolidated financial and operating data presented below shouldbe read in conjunction with ‘‘Capitalization,’’ ‘‘Management’s Discussion and Analysis of FinancialCondition and Results of Operations,’’ ‘‘Selected Historical Consolidated Financial Data,’’ ‘‘UnauditedPro Forma Financial Information’’ and our consolidated financial statements and related notes includedelsewhere in this prospectus.
Our unaudited summary pro forma financial information presented below has been derived fromour unaudited pro forma consolidated financial information included in this prospectus under‘‘Unaudited Pro Forma Financial Information’’ and has been prepared to give effect to the transactionsdescribed in this prospectus under ‘‘Unaudited Pro Forma Financial Information’’ as if they hadoccurred on the dates discussed therein. The following unaudited summary pro forma financialinformation is presented for illustrative purposes only and is not necessarily indicative of the operatingresults or financial position that would have occurred if the relevant transactions had been
23
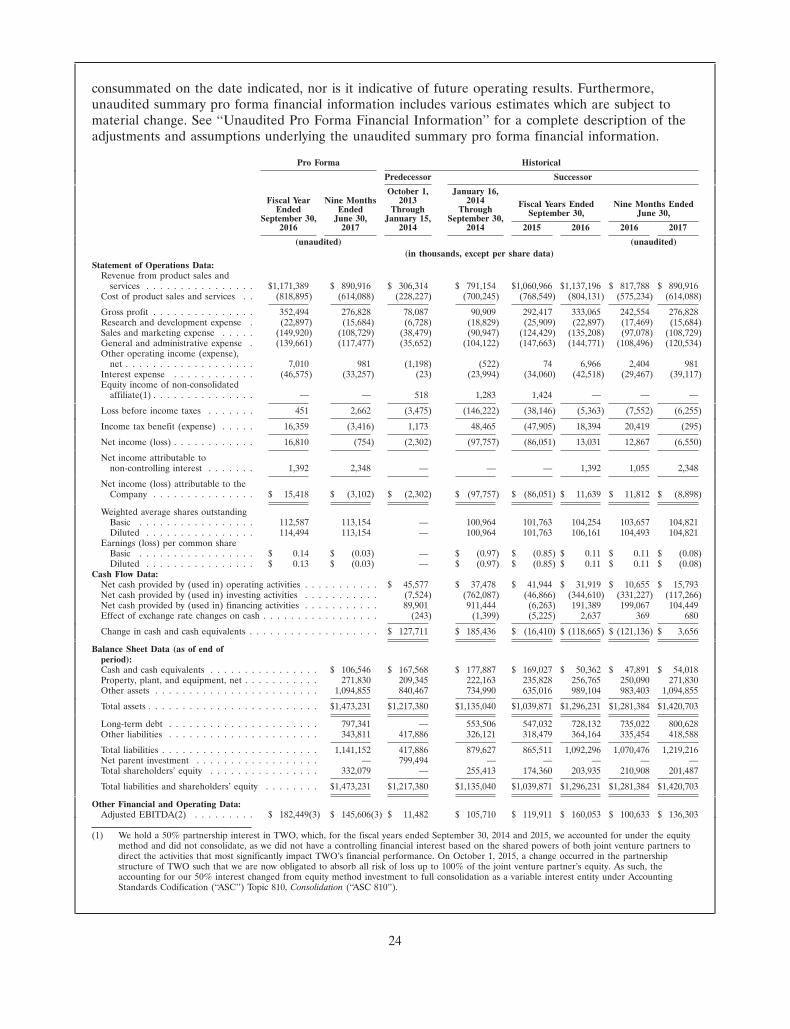
consummated on the date indicated, nor is it indicative of future operating results. Furthermore,unaudited summary pro forma financial information includes various estimates which are subject tomaterial change. See ‘‘Unaudited Pro Forma Financial Information’’ for a complete description of theadjustments and assumptions underlying the unaudited summary pro forma financial information.
Pro Forma Historical
Predecessor Successor
October 1, January 16,Fiscal Year Nine Months 2013 2014 Fiscal Years Ended Nine Months EndedEnded Ended Through Through September 30, June 30,September 30, June 30, January 15, September 30,
2016 2017 2014 2014 2015 2016 2016 2017
(unaudited) (unaudited)(in thousands, except per share data)
Statement of Operations Data:Revenue from product sales and
services . . . . . . . . . . . . . . . . $1,171,389 $ 890,916 $ 306,314 $ 791,154 $1,060,966 $1,137,196 $ 817,788 $ 890,916Cost of product sales and services . . (818,895) (614,088) (228,227) (700,245) (768,549) (804,131) (575,234) (614,088)
Gross profit . . . . . . . . . . . . . . . 352,494 276,828 78,087 90,909 292,417 333,065 242,554 276,828Research and development expense . (22,897) (15,684) (6,728) (18,829) (25,909) (22,897) (17,469) (15,684)Sales and marketing expense . . . . . (149,920) (108,729) (38,479) (90,947) (124,429) (135,208) (97,078) (108,729)General and administrative expense . (139,661) (117,477) (35,652) (104,122) (147,663) (144,771) (108,496) (120,534)Other operating income (expense),
net . . . . . . . . . . . . . . . . . . . 7,010 981 (1,198) (522) 74 6,966 2,404 981Interest expense . . . . . . . . . . . . (46,575) (33,257) (23) (23,994) (34,060) (42,518) (29,467) (39,117)Equity income of non-consolidated
affiliate(1) . . . . . . . . . . . . . . . — — 518 1,283 1,424 — — —
Loss before income taxes . . . . . . . 451 2,662 (3,475) (146,222) (38,146) (5,363) (7,552) (6,255)
Income tax benefit (expense) . . . . . 16,359 (3,416) 1,173 48,465 (47,905) 18,394 20,419 (295)
Net income (loss) . . . . . . . . . . . . 16,810 (754) (2,302) (97,757) (86,051) 13,031 12,867 (6,550)
Net income attributable tonon-controlling interest . . . . . . . 1,392 2,348 — — — 1,392 1,055 2,348
Net income (loss) attributable to theCompany . . . . . . . . . . . . . . . $ 15,418 $ (3,102) $ (2,302) $ (97,757) $ (86,051) $ 11,639 $ 11,812 $ (8,898)
Weighted average shares outstandingBasic . . . . . . . . . . . . . . . . . 112,587 113,154 — 100,964 101,763 104,254 103,657 104,821Diluted . . . . . . . . . . . . . . . . 114,494 113,154 — 100,964 101,763 106,161 104,493 104,821
Earnings (loss) per common shareBasic . . . . . . . . . . . . . . . . . $ 0.14 $ (0.03) — $ (0.97) $ (0.85) $ 0.11 $ 0.11 $ (0.08)Diluted . . . . . . . . . . . . . . . . $ 0.13 $ (0.03) — $ (0.97) $ (0.85) $ 0.11 $ 0.11 $ (0.08)
Cash Flow Data:Net cash provided by (used in) operating activities . . . . . . . . . . . $ 45,577 $ 37,478 $ 41,944 $ 31,919 $ 10,655 $ 15,793Net cash provided by (used in) investing activities . . . . . . . . . . . (7,524) (762,087) (46,866) (344,610) (331,227) (117,266)Net cash provided by (used in) financing activities . . . . . . . . . . . 89,901 911,444 (6,263) 191,389 199,067 104,449Effect of exchange rate changes on cash . . . . . . . . . . . . . . . . . (243) (1,399) (5,225) 2,637 369 680
Change in cash and cash equivalents . . . . . . . . . . . . . . . . . . . $ 127,711 $ 185,436 $ (16,410) $ (118,665) $ (121,136) $ 3,656
Balance Sheet Data (as of end ofperiod):Cash and cash equivalents . . . . . . . . . . . . . . . . $ 106,546 $ 167,568 $ 177,887 $ 169,027 $ 50,362 $ 47,891 $ 54,018Property, plant, and equipment, net . . . . . . . . . . . 271,830 209,345 222,163 235,828 256,765 250,090 271,830Other assets . . . . . . . . . . . . . . . . . . . . . . . . 1,094,855 840,467 734,990 635,016 989,104 983,403 1,094,855
Total assets . . . . . . . . . . . . . . . . . . . . . . . . . $1,473,231 $1,217,380 $1,135,040 $1,039,871 $1,296,231 $1,281,384 $1,420,703
Long-term debt . . . . . . . . . . . . . . . . . . . . . . 797,341 — 553,506 547,032 728,132 735,022 800,628Other liabilities . . . . . . . . . . . . . . . . . . . . . . 343,811 417,886 326,121 318,479 364,164 335,454 418,588
Total liabilities . . . . . . . . . . . . . . . . . . . . . . . 1,141,152 417,886 879,627 865,511 1,092,296 1,070,476 1,219,216Net parent investment . . . . . . . . . . . . . . . . . . — 799,494 — — — — —Total shareholders’ equity . . . . . . . . . . . . . . . . 332,079 — 255,413 174,360 203,935 210,908 201,487
Total liabilities and shareholders’ equity . . . . . . . . $1,473,231 $1,217,380 $1,135,040 $1,039,871 $1,296,231 $1,281,384 $1,420,703
Other Financial and Operating Data:Adjusted EBITDA(2) . . . . . . . . . $ 182,449(3) $ 145,606(3) $ 11,482 $ 105,710 $ 119,911 $ 160,053 $ 100,633 $ 136,303
(1) We hold a 50% partnership interest in TWO, which, for the fiscal years ended September 30, 2014 and 2015, we accounted for under the equitymethod and did not consolidate, as we did not have a controlling financial interest based on the shared powers of both joint venture partners todirect the activities that most significantly impact TWO’s financial performance. On October 1, 2015, a change occurred in the partnershipstructure of TWO such that we are now obligated to absorb all risk of loss up to 100% of the joint venture partner’s equity. As such, theaccounting for our 50% interest changed from equity method investment to full consolidation as a variable interest entity under AccountingStandards Codification (‘‘ASC’’) Topic 810, Consolidation (‘‘ASC 810’’).
24

(2) Adjusted EBITDA is one of the primary metrics used by management to evaluate the financial performance of our business. Adjusted EBITDAis defined as net income (loss) before interest expense, income tax benefit (expense) and depreciation and amortization, adjusted for the impactof certain other items, including restructuring and related business transformation costs, purchase accounting adjustment costs, non-cash stock-based compensation, sponsor fees, transaction costs and other gains, losses and expenses.
We present Adjusted EBITDA, which is not a recognized financial measure under GAAP, because we believe it is frequently used by analysts,investors and other interested parties to evaluate companies in our industry. Further, we believe it is helpful in highlighting trends in ouroperating results, because it excludes the results of decisions that are outside the control of management, while other measures can differsignificantly depending on long-term strategic decisions regarding capital structure, the tax jurisdictions in which we operate and capitalinvestments. Management uses Adjusted EBITDA to supplement GAAP measures of performance as follows:
• to assist investors and analysts in comparing our operating performance across reporting periods on a consistent basis by excludingitems that we do not believe are indicative of our core operating performance;
• in our management incentive compensation which is based in part on components of Adjusted EBITDA;
• in certain calculations under our Senior Secured Credit Facilities, which use components of Adjusted EBITDA;
• to evaluate the effectiveness of our business strategies;
• to make budgeting decisions; and
• to compare our performance against that of other peer companies using similar measures.
You are encouraged to evaluate each adjustment and the reasons we consider it appropriate for supplemental analysis. In addition, in evaluatingAdjusted EBITDA, you should be aware that in the future, we may incur expenses similar to the adjustments in the presentation of AdjustedEBITDA. Our presentation of Adjusted EBITDA should not be construed as an inference that our future results will be unaffected by unusual ornon-recurring items. In addition, Adjusted EBITDA may not be comparable to similarly titled measures used by other companies in our industryor across different industries.
Adjusted EBITDA has its limitations as an analytical tool and you should not consider it in isolation, or as a substitute for analysis of our resultsas reported under GAAP. Some of these limitations include the following:
• Adjusted EBITDA does not reflect every expenditure, future requirements for capital expenditures or contractual commitments;
• Adjusted EBITDA does not reflect changes in our working capital needs;
• Adjusted EBITDA does not reflect the significant interest expense, or the amounts necessary to service interest or principal paymentson our Senior Secured Credit Facilities;
• Adjusted EBITDA does not reflect income tax expense (benefit), and because the payment of taxes is part of our operations, taxexpense is a necessary element of our costs and ability to operate;
• although depreciation and amortization are eliminated in the calculation of Adjusted EBITDA, the assets being depreciated andamortized will often have to be replaced in the future, and Adjusted EBITDA does not reflect any costs of such replacements;
• Adjusted EBITDA does not reflect the noncash component of employee compensation;
• Adjusted EBITDA does not reflect the impact of earnings or charges resulting from matters we consider not to be reflective, on arecurring basis, of our ongoing operations;
• other companies in our industry may calculate Adjusted EBITDA or similarly titled measures differently than we do, limiting itsusefulness as a comparative measure; and
• Adjusted EBITDA (pro forma as adjusted for contributions from insignificant completed acquisitions) does not necessarily reflect theresults of operations of such acquired businesses as if they had been acquired at the beginning of each such period presented.
We compensate for these limitations by relying primarily on our GAAP results and using Adjusted EBITDA only as supplemental information.
(3) Throughout this prospectus, as noted, we make adjustments to Adjusted EBITDA, with respect to the pro forma periods presented herein, togive further effect to contributions from insignificant completed acquisitions for the applicable periods.
25

The following is a reconciliation of our net income (loss) to Adjusted EBITDA:
Pro Forma Historical
Predecessor Successor
October 1, January 16, Nine MonthsFiscal Year Nine Months 2013 2014 Fiscal Years Ended EndedEnded Ended Through Through September 30, June 30,September 30, June 30, January 15, September 30,2016 2017 2014 2014 2015 2016 2016 2017
(unaudited) (unaudited)(in thousands)
Net income (loss) . . . . . . . . . . . . $ 16,810 $ (754) $(2,302) $(97,757) $(86,051) $ 13,031 $ 12,867 $ (6,550)Interest expense . . . . . . . . . . . . 46,575 33,257 23 23,994 34,060 42,518 29,467 39,117Income tax (benefit) expense . . . . . (16,359) 3,416 (1,173) (48,465) 47,905 (18,394) (20,419) 295Depreciation and amortization . . . . 73,751 55,813 14,934 139,933 58,139 69,289 50,986 55,813
EBITDA . . . . . . . . . . . . . . . . . $120,777 $ 91,732 $11,482 $ 17,705 $ 54,053 $106,444 $ 72,901 $ 88,675Restructuring and related business
transformation costs(a) . . . . . . . 43,075 36,382 — 41,027 32,842 43,075 18,208 36,382Purchase accounting adjustment
costs(b) . . . . . . . . . . . . . . . . 1,267 229 18,326 — 1,267 — 229Stock-based compensation(c) . . . . . 1,999 1,634 — 342 1,587 1,999 1,447 1,634Sponsor fees(d) . . . . . . . . . . . . . — — — 4,369 5,012 3,758 2,810 3,042Transaction costs(e) . . . . . . . . . . 3,274 5,659 — 10,121 — 5,374 3,943 5,659Other gains, losses and expenses(f) . . (1,864) 683 — 13,820 26,417 (1,864) 1,324 682
Adjusted EBITDA . . . . . . . . . . . $168,528 $136,319 $11,482 $105,710 $119,911 $160,053 $100,633 $136,303
Contributions from insignificantcompleted acquisitions(g) . . . . . . 13,921 9,287
Adjusted EBITDA (pro forma asadjusted for contributions frominsignificant completedacquisitions) . . . . . . . . . . . . . $182,449 $145,606
(a) Represents:
(i) costs and expenses in connection with various restructuring initiatives since the AEA Acquisition, including severance costs, relocationcosts, recruiting expenses, write-offs of inventory and fixed assets and third-party consultant costs to assist with these initiatives(includes (A) $16.9 million in fiscal 2016 (all of which is reflected as a component of Restructuring charges in‘‘Note 12—Restructuring and Related Charges’’ to our audited consolidated financial statements) and $19.2 million for the ninemonths ended June 30, 2017 (all of which is reflected as a component of Restructuring charges in ‘‘Note 11—Restructuring andRelated Charges’’ to our unaudited condensed consolidated financial statements) related to our voluntary separation plan pursuant towhich approximately 220 employees accepted separation packages, and (B) $12.4 million (of which $4.4 million is reflected as acomponent of Restructuring charges in ‘‘Note 12—Restructuring and Related Charges’’ to our audited consolidated financialstatements) in the Successor Period, $9.2 million (of which $6.5 million is reflected as a component of Restructuring charges in‘‘Note 12—Restructuring and Related Charges’’ to our audited consolidated financial statements) in fiscal 2015, $11.1 million (all ofwhich is reflected as a component of Restructuring charges in ‘‘Note 12—Restructuring and Related Charges’’ to our auditedconsolidated financial statements) in fiscal 2016, $9.3 million (of which $8.1 million is reflected as a component of Restructuringcharges in ‘‘Note 11—Restructuring and Related Charges’’ to our unaudited condensed consolidated financial statements) in the ninemonths ended June 30, 2016 and $6.5 million (of which $2.9 million is reflected as a component of Restructuring charges in‘‘Note 11—Restructuring and Related Charges’’ to our unaudited condensed consolidated financial statements) in the nine monthsended June 30, 2017 related to various other initiatives implemented to restructure and reorganize our business as a standalonebusiness with an appropriate management team and cost structure). Differences between amounts reflected as Restructuring chargesin ‘‘Note 12—Restructuring and Related Charges’’ to our audited financial statements and amounts reflected in this adjustment relateprimarily to retention payments made to employees in the Successor Period of $5.6 million that have been reflected as components ofCost of product sales and services ($1.2 million), Research and development expense ($0.2 million), Sales and marketing expense($1.9 million) and General and administrative expense ($2.3 million) as well as other administrative costs associated with separationfrom the Predecessor that have been reflected in the Successor Period as a component of General and administrative expense(2.4 million). Differences between amounts reflected as Restructuring charges in ‘‘Note 12—Restructuring and Related Charges’’ toour audited financial statements and amounts reflected in this adjustment also relate to retention payments made to employees infiscal 2015 of $2.5 million that have been reflected as components of Cost of product sales and services ($1.1 million), Research anddevelopment expense ($0.1 million), Sales and marketing expense ($1.0 million) and General and administrative expense($0.3 million). Differences between amounts reflected as Restructuring charges in ‘‘Note 11—Restructuring and Related Charges’’ toour unaudited condensed consolidated financial statements in the nine months ended June 30, 2016 and June 30, 2017 and amountsreflected in this adjustment relate primarily to consulting costs and other charges related to implementing such initiatives that haveprimarily been recorded as a component of General and administrative expense ($1.2 million) in the nine months ended June 30, 2016and Cost of product sales and services ($1.4 million), Sales and marketing expenses ($1.0 million) and General and administrativeexpense ($1.0 million) in the nine months ended June 30, 2017;
(ii) legal settlement costs and intellectual property related fees associated with legacy matters prior to the AEA Acquisition, including feesand settlement costs related to product warranty litigation on MEMCOR products and certain discontinued products ($11.7 million inthe Successor Period, reflected as a component of Cost of product sales and services, $11.7 million in fiscal 2015, reflected ascomponents of Cost of product sales and services ($10.7 million) and General and administrative expenses ($1.0 million), $5.1 million,primarily reflected as a component of Cost of product sales and services in fiscal 2016, $2.5 million, primarily reflected as acomponent of Cost of product sales and services in the nine months ended June 30, 2016 and $1.8 million, primarily reflected as acomponent of General and administrative expense in the nine months ended June 30, 2017);
26
(iii) expenses associated with our information technology and functional infrastructure transformation following the AEA Acquisition,including activities to optimize information technology systems and functional infrastructure processes for a standalone business($16.9 million, primarily reflected as a component of General and administrative expense in the Successor Period, $12.1 million,primarily reflected as components of Cost of product sales and services ($3.0 million), Research and development expense($0.4 million), Sales and marketing expense ($0.3 million) and General and administrative expense ($8.4 million) in fiscal 2015,$9.5 million, primarily reflected as components of Cost of product sales and services ($3.6 million), Sales and marketing expense($2.5 million), General and administrative expense ($3.1 million) and Research and development expense ($0.3 million) in fiscal 2016,$6.1 million, primarily reflected as components of Cost of product sales and services ($2.9 million), Sales and marketing expense($1.7 million) and General and administrative expense ($1.5 million) in the nine months ended June 30, 2016 and $4.5 million,primarily reflected as components of Cost of product sales and services ($1.8 million), Sales and marketing expense ($0.7 million) andGeneral and administrative expense ($2.0 million) in the nine months ended June 30, 2017); and
(iv) costs incurred by us in connection with this offering, including consultant costs and public company compliance costs ($0.5 million infiscal 2016, $0.3 million in the nine months ended June 30, 2016 and $4.4 million in the nine months ended June 30, 2017, allreflected as a component of General and administrative expense).
(b) Represents adjustments for the effect of the purchase accounting step-up in the value of inventory to fair value recognized in cost of goodssold as a result of the AEA Acquisition and the acquisition of Magneto.
(c) Represents non-cash stock-based compensation expenses related to option awards. See Note 15 to our audited financial statements includedelsewhere in this prospectus for further detail.
(d) Represents management fees paid to AEA pursuant to the management agreement. Pursuant to the management agreement, AEA providedadvisory and consulting services to us in connection with the AEA Acquisition, including investment banking, due diligence, financial advisoryand valuation services. AEA also provides ongoing advisory and consulting services (similar in nature to the services provided in connectionwith the AEA Acquisition) to us pursuant to the management agreement. In connection with this offering, the management agreement willbe terminated. See ‘‘Certain Relationships and Related Party Transactions’’ and Note 18 to our audited financial statements includedelsewhere in this prospectus for further detail.
(e) Represents expenses associated with acquisition and divestiture-related activities and post-acquisition integration costs and accounting, tax,consulting, legal and other fees and expenses associated with (i) the AEA Acquisition ($10.1 million in the Successor Period) and (ii) otheracquisition transactions ($5.4 million in fiscal 2016, $3.9 million in the nine months ended June 30, 2016 and $5.7 million in the nine monthsended June 30, 2017).
(f) Represents:
(i) impact of foreign exchange gains and losses ($6.8 million loss in the Successor Period, $19.0 million loss in fiscal 2015, $0.5 millionloss in fiscal 2016, $1.4 million loss in the nine months ended June 30, 2016 and $2.1 million gain in the nine months ended June 30,2017);
(ii) $3.5 million gain on the sale of assets, primarily related to the Vernon Disposition;
(iii) foreign exchange impact related to headquarter allocations ($0.7 million gain in fiscal 2016, $0.04 million gain in the nine monthsended June 30, 2016 and $1.0 million loss in the nine months ended June 30, 2017); and
(iv) expenses related to maintaining non-operational business locations ($7.0 million in the Successor Period, $7.4 million in fiscal 2015,$1.8 million in fiscal 2016 and $1.7 million in the nine months ended June 30, 2017).
(g) Represents the impact to earnings from the following acquired entities from the beginning of the period presented to the date of theacquisition: (i) Magneto, (ii) Delta UV, (iii) VAF, (iv) ETS, (v) Noble, (vi) ADI and (vii) Olson. Such amounts have been based on theindividual books and records of the acquired entities. We believe that such amounts represent a reasonable estimate of earnings for theperiods preceding the dates of such acquisitions; however, the individual books and records of the acquired entities have not been audited.As a result, there can be no assurances that such results accurately reflect the actual results of the acquired entities for the periods precedingthe dates of such acquisitions or that such entities would have achieved the same results if we had acquired them at the beginning of suchperiod. See ‘‘Management’s Discussion and Analysis of Financial Condition and Results of Operations—Acquisitions’’ for further detail.
27
RISK FACTORS
Investing in our common stock involves a high degree of risk. You should carefully consider thefollowing risks, together with all of the other information contained in this prospectus, before deciding toinvest in our common stock. Our business, financial condition, results of operations or prospects could bematerially and adversely affected by any of these risks or uncertainties. In that case, the trading price of ourcommon stock could decline, and you may lose all or part of your investment.
Risks Relating to Our Business
General global economic and business conditions may materially adversely affect demand for our products,services and solutions.
We compete in various end markets and geographic regions around the world. Among these, themost significant are global industrial markets and municipal markets. In fiscal 2016, 86% and 14% ofour revenue was from customers located in the United States and Canada and in other markets,respectively. We have experienced, and expect to continue to experience, fluctuations in revenues andoperating results due to economic and business cycles. Important factors for our businesses and thebusinesses of our customers, both in the United States and abroad, include local and globalmacroeconomic conditions, the overall strength of and our customers’ confidence in the economy,industrial and governmental capital spending, governmental fiscal and trading policies, globalenvironmental and regulatory policies, the strength of the residential and commercial real estatemarkets, unemployment rates, consumer spending, availability of financing, interest rates, tax rates andchanges in tax laws, political conditions and energy and commodity prices. The businesses of many ofour industrial customers are, to varying degrees, cyclical, and have experienced periodic downturns.While we attempt to minimize our exposure to economic or market fluctuations by serving a balancedmix of end markets and geographic regions, any of the above factors, individually or in the aggregate,or a significant or sustained downturn in a specific end market or geographic region, could materiallyreduce demand for our products, services and solutions.
Levels of municipal spending may particularly impact our business, financial condition, results ofoperations or prospects. Reduced tax revenue in certain regions, or inability to access traditionalsources of credit, may limit spending and new development by municipalities or local governmentalagencies, which in turn may materially adversely affect the demand for our solutions and reduce ourrevenue.
Failure to compete successfully in our markets could materially adversely affect our business, financialcondition, results of operations or prospects.
We offer our products, services and solutions in highly competitive markets. We believe theprincipal points of competition in our markets are product performance, reliability and innovation ofour solutions, application expertise and process knowledge, brand reputation, energy and waterefficiency, product compliance with environmental and regulatory requirements, product lifecycle cost,scalability, timeliness of delivery, proximity of service centers to our customers, effectiveness of ourdistribution channels and price. Maintaining and improving our competitive position will requiresuccessful management of these factors, including continued investment by us in research anddevelopment, engineering, marketing, customer service and support and our distribution networks. Ourfuture growth rate depends upon our ability to compete successfully, which is impacted by a number offactors, including our ability to (i) identify emerging technological trends in our target end markets,(ii) develop and maintain a wide range of competitive and appropriately priced products, services andsolutions and defend our market share against an ever-expanding number of competitors includingmany new and non-traditional competitors, (iii) enhance our products by adding innovative and, whereapplicable, patented features that differentiate our products from those of our competitors and prevent
28

commoditization of our products, (iv) develop, manufacture, bring to market and drive commercialacceptance of compelling new products quickly and cost-effectively, (v) ensure that our products,services and solutions remain cost-competitive and (vi) attract, develop and retain individuals with therequisite technical expertise and understanding of customers’ needs to develop and sell newtechnologies and products.
We operate in markets that are characterized by customer demand that is often broad in scope butlocalized in delivery. We compete with companies that may be better positioned to capitalize on highlylocalized relationships and knowledge that are difficult for us to replicate. Our potential customers mayprefer local suppliers, in some cases because of existing relationships and in other cases because oflocal legal restrictions or incentives that favor local businesses. Smaller regional suppliers may also havelower cost structures. As a result, efforts to expand or support our service network may not improveour ability to penetrate new local markets or expand our footprint in existing markets.
Further, many of our customers actively monitor and review our company-wide safety record, andapply rigorous safety standards to us and our competitors. Although we take precautions to preventworkplace accidents and mechanical failures, such incidents are difficult to predict and may be outsideof our control. If we are unable to meet our customers’ stringent workplace safety standards, or if ourcustomers perceive us to have a poor safety record, it could materially impact our ability to retain theirbusiness or attract new business.
We may not be successful in maintaining our competitive position for a number of reasons. Wemay fail to identify optimal vertical or geographic markets, focus our attention in suboptimal vertical orgeographic markets or fail to execute an appropriate business model in certain vertical or geographicmarkets. Our competitors may develop disruptive technologies or products that are superior to ourproducts, develop more efficient or effective methods of providing products and services or adapt morequickly than we do to new technologies or evolving customer requirements. The failure of ourtechnologies or products to gain market acceptance due to more attractive offerings by our competitorscould significantly reduce our revenues and materially adversely affect our competitive standing orprospects. Pricing pressures also could cause us to adjust the prices of certain products to staycompetitive, which could materially adversely affect our margins and overall financial performance.Failure to continue competing successfully or to win business with our existing customers couldmaterially adversely affect our business, financial condition, results of operations or prospects.
Our future growth is dependent upon our ability to continue to develop or acquire new products, services andsolutions and adapt our businesses to meet the demands of our customers, comply with changes to governmentregulations and achieve market acceptance with acceptable margins.
Our future success depends upon a number of factors, including our ability to adapt our products,services and solutions to fit localities throughout our end markets, particularly in high growth emergingmarkets, such as China; identify emerging technological and other trends in our target end markets;and develop or acquire competitive products and services and bring them to market quickly andcost-effectively. If we are unable to continue to differentiate our products, services and solutions, or ifwe are forced to cut prices to remain competitive, our business, financial condition, results ofoperations or prospects could be materially and adversely affected.
We are also impacted by changing technology, competitively imposed process and safety standardsand regulatory requirements, particularly under environmental regulations, each of which influences thedemand for our products, services and solutions. Advances in technology and changes in industrialspecifications or in legislative, regulatory and environmental requirements, including the availability ofintellectual property protections in various jurisdictions, may render certain of our products, servicesand solutions obsolete.
29
In addition, our industrial and municipal customers have made considerable fixed-cost investmentsin the installation of their water and wastewater treatment products and systems, and our municipalcustomers are often subject to stringent appropriation requirements and extensive procurementprocesses. The replacement of our customers’ installed products and systems with the new technologiesthat we develop could entail significant costs to such customers. Further, many of our potentialcustomers engage and rely on engineering firms to recommend and select products and systems fortheir facilities, and many of our products are sold to OEMs as components of larger systems. Ourinability to persuade our customers or other parties to adopt the technologies we develop could havean adverse effect on our business, financial condition, results of operations or prospects.
Our growth strategy includes acquisitions, and we may not be able to identify suitable acquisition targets orotherwise successfully implement our growth strategy.
Acquisitions have historically been a significant part of our growth strategy, and we expect tocontinue to grow through acquisitions in the future. We expect to continue evaluating potentialstrategic acquisitions of businesses, assets and product lines. We may not be able to identify suitablecandidates, negotiate appropriate or favorable acquisition terms, obtain financing that may be neededto consummate such transactions or complete proposed acquisitions. There is significant competitionfor acquisition and expansion opportunities in our businesses.
In addition, acquisitions involve numerous risks, including (i) incurring the time and expenseassociated with identifying and evaluating potential acquisitions and negotiating potential transactions,resulting in management’s attention being diverted from the operation of our existing business;(ii) using inaccurate estimates and judgments to evaluate credit, operations, funding, liquidity, business,management and market risks with respect to the target institution or assets; (iii) litigation relating toan acquisition, particularly in the context of a publicly held acquisition target, that could require us toincur significant expenses, result in management’s attention being diverted from the operation of ourexisting business or delay or enjoin the transaction; (iv) failing to properly identify an acquisitioncandidate’s liabilities, potential liabilities or risks; and (v) not receiving required regulatory approvals orsuch approvals being delayed or restrictively conditional. In addition, in connection with anyacquisitions, we must comply with various antitrust requirements. It is possible that perceived or actualviolations of these requirements could give rise to regulatory enforcement action or result in us notreceiving the necessary approvals to complete a desired acquisition.
We routinely evaluate potential acquisition candidates and engage in discussions and negotiationsregarding potential acquisitions; however, even if we execute a definitive agreement for an acquisition,there can be no assurance that we will consummate the transaction within the anticipated closingtimeframe, or at all. Further, acquisitions typically involve the payment of a premium over book- andmarket-values and, therefore, some dilution of our tangible book value and earnings per common sharemay occur in connection with any future transaction.
We may have difficulty in operating or integrating any acquired businesses, assets or product lines profitablyor in otherwise successfully implementing our growth strategy.
The anticipated benefits from any potential acquisitions may not be achieved unless the operationsof the acquired business assets or product lines are successfully integrated in an efficient, effective andtimely manner. The integration of our acquisitions will require substantial attention from managementand operating personnel to ensure that the acquisition does not disrupt any existing operations, oraffect our customers’ opinions and perceptions of our services, products or customer support.
In addition, the integration of any acquisition includes numerous risks, including an acquiredbusiness not performing to our expectations, our not integrating it appropriately, failure to realizeanticipated synergies and cost savings and difficulties, inefficiencies or cost overruns in integrating and
30
assimilating the organizational cultures, operations, technologies, data, services and products of theacquired business with ours.
The process of integrating acquired businesses, assets and product lines could cause theinterruption of, or delays in, the operation of our existing business, which could have a material adverseeffect on our business, financial condition, results of operations or prospects. Acquisitions also place aburden on our information, financial and operating systems and our employees and management. Ourability to manage our growth effectively and integrate the operations of acquired businesses, assets orproduct lines, will require us to continue to attract, train, motivate, manage and retain key employeesand to expand our information technology, operational and financial systems. If we are unable tomanage our growth effectively, we may spend time and resources on such acquisitions that do notultimately increase our profitability or that cause loss of, or harm to, relationships with employees andcustomers.
Delays in enactment or repeals of environmental laws and regulations may make our products, services andsolutions less economically beneficial to our customers, thereby affecting demand for our products, servicesand solutions.
Our products, services and solutions assist various industries and municipalities in meetingstringent environmental and safety requirements enacted for the purpose of making water cleaner andsafer. Our future growth is dependent on the impact and timing of potential new water laws andregulations, as well as potential changes to existing laws and regulations, including the potential impactof environmental policies of the new Presidential administration installed in the United States inJanuary of 2017. If stricter laws or regulations are delayed or are not enacted, or repealed or amendedto be less strict, or enacted with prolonged phase-in periods, or not enforced, demand for our productsand services may be reduced. For example, in response to Presidential Executive Order 13777, callingon each federal agency to establish a regulatory reform task force and evaluate existing rules andrecommend repeal, replacement or modification to reduce regulatory burdens, the U.S. EPAestablished a task force and initiated reviews in several program areas. The U.S. EPA’s Office of Waterconducted such a review, soliciting public comments in the spring of 2017, including hosting a publiclistening session, seeking proposals for Office of Water rules that could be repealed, replaced ormodified to make them less burdensome. We are currently unable to predict whether changes tostatutes and rules which occur will affect demand for our products and services. To the extent that suchchanges have a negative impact on us, including as a result of related uncertainty, these changes maymaterially and adversely impact our business, financial condition, results of operations or prospects.
If we become subject to claims relating to handling, storage, release or disposal of hazardous materials, wecould incur significant cost and time to comply.
Our business activities, including our manufacturing processes and waste recycling and treatmentprocesses, currently involve the use, treatment, storage, transfer, handling and/or disposal of hazardousmaterials, chemicals and wastes. These activities create a risk of significant environmental liabilities andreputational damage. Under applicable environmental laws and regulations, we could be strictly, jointlyand severally liable for releases of regulated substances by us at our current or former properties or theproperties of others or by other businesses that previously owned or used our current or formerproperties, including if such releases result in contamination of air, water or soil, or cause harm toindividuals. We could also be liable or incur reputational damage if we merely generate hazardousmaterials or wastes, or arrange for their transportation, disposal or treatment, or we transport suchmaterials, and they are subsequently released or cause harm, or if some other entity conducted suchactivities and by virtue of an acquisition, under applicable law we are a successor to that entity.
Our business activities also create a risk of contamination or injury to our employees, customers orthird parties, from the use, treatment, storage, transfer, handling and/or disposal of these materials, and
31
these activities could result in accidental contamination or injury to the general public, as end-users ofour industrial and municipal customers’ products and services.
In the event that our business activities result in environmental liabilities, such as those describedabove, we could incur significant costs or reputational damage in connection with the investigation andremediation of environmental contamination, and we could be liable for any resulting damagesincluding natural resource damages. Such liabilities could exceed our available cash or any applicableinsurance coverage we may have. Additionally, we are subject to, on an ongoing basis, federal, stateand local laws and regulations governing the use, storage, handling and disposal of these materials andspecified waste products. The cost of compliance with these laws and regulations may becomesignificant and could have a material adverse effect on our business, financial condition, results ofoperations or prospects.
Further, we may incur costs to defend our position even if we are not liable for consequencesarising out of a release of or exposure to a hazardous substance or waste, or other environmentaldamage. Our insurance policies may not be sufficient to cover the costs of such claims.
Failure to retain our existing senior management, skilled technical, engineering, sales and other key personnelor the inability to attract and retain new qualified personnel could materially adversely impact our ability tooperate or grow our business.
Our success depends to a significant extent on our ability to retain or attract a significant numberof employees in senior management, skilled technical, engineering, sales and other key personnel. Sincethe AEA Acquisition, we have focused on creating a high performance culture, in which our employeesare highly enabled, empowered and accountable. Our inability to continue to develop and maintain ourculture by empowering our senior management, other leaders and employees and promoting anentrepreneurial spirit, could result in our loss of key leaders and employees and have a materialadverse effect on our business, financial condition, results of operations or prospects.
Effective succession planning is also important to our long-term success, as a failure to ensureeffective transfer of knowledge and smooth transitions involving key employees could hinder ourstrategic planning and execution. We have implemented a voluntary separation program intended tomitigate the risks associated with knowledge transfer, but we cannot guarantee that it will be effectiveor cost-efficient.
We will need to continue to develop a roster of qualified talent to support business growth.Without a sufficient number of skilled employees, our operations and manufacturing quality couldsuffer. Our experienced sales team has also developed a number of meaningful customer relationshipsthat would be difficult to replace. Therefore, competition for qualified technical personnel and for salespersonnel with established customer relationships is intense, both in retaining our existing employeesand in replacing or finding additional suitable employees. There can be no assurance that the laborpool from which we hire our personnel will increase or remain stable, and any failure to retain ourexisting technical and sales personnel and other employees or to attract additional skilled personnelcould have a material adverse effect our business, financial condition, results of operations or prospects.
Product defects and unanticipated or improper use of our products could adversely affect our business,reputation and financial statements.
Manufacturing or design defects in (including in products or components that we source from thirdparties), unanticipated or improper use of, or inadequate disclosure of risks relating to the use of ourproducts, services and solutions by our customers or third parties could create product safety,regulatory or other risks, including personal injury, death or property damage. These events could leadto recalls or safety alerts relating to our products, result in the removal of a product from the marketand result in product liability claims being brought against us. Recalls, removals and product liability
32

claims can result in significant costs, as well as negative publicity and damage to our reputation thatcould reduce demand for our products and have a material adverse effect on our business, financialcondition, results of operations or prospects.
Further, it is generally our responsibility to service the equipment we provide our customersthroughout the duration of our contract with such customers, and our customers may be required tomaintain insurance covering loss, damage or injury caused by our equipment. However, we are not ableto monitor our customers’ use or maintenance of their water systems or their compliance with ourcontracts or usage instructions. Customers’ failure to properly use, maintain or safeguard theirequipment or customers’ noncompliance with insurance requirements may reflect poorly on us as theprovider of such equipment and, as a result, damage our reputation.
We may incur liabilities to customers as a result of warranty claims or failure to meet performanceguarantees, which could reduce our profitability.
Our customers typically require product warranties as to the proper operation and conformance tospecifications of the products we manufacture or install and performance guarantees as to any effluentproduced by our equipment and services. Failure of our products to operate properly or to meetspecifications of our customers or our failure to meet our performance guarantees may increase costsby requiring additional engineering resources and services, replacement of parts and equipment andfrequent replacement of consumables or monetary reimbursement to a customer or could otherwiseresult in liability to our customers. We have in the past received warranty claims, and we expect tocontinue to receive them in the future. There are significant uncertainties and judgments involved inestimating warranty and performance guarantee obligations, including changing product designs,differences in customer installation processes and failure to identify or disclaim certain variables in acustomer’s influent. To the extent that we incur substantial warranty or performance guarantee claimsin any period, our reputation, earnings and ability to obtain future business could be materiallyadversely affected.
We may be unable to bid on or enter into significant long-term agreements if we are not able to obtain lettersof credit, bank guarantees or surety bonds, and our liquidity may be adversely affected by bondingrequirements.
A portion of our business, including our water treatment projects and solutions, requires us toprovide letters of credit, bank guarantees or surety bonds in support of our commitments and as part ofthe terms and conditions on water treatment projects. In addition, we are required to provide letters ofcredit or surety bonds to the department of environmental protection or equivalent in some states inorder to maintain our licenses to handle hazardous waste at certain of our regeneration facilities. Wehave in the past been, and may in the future be, required to provide bid bonds or performance bondsto secure our performance under these construction-type customer arrangements or, in some cases, as apre-requisite to submit a bid on a potential project.
Current or future market conditions, as well as changes in surety companies’ assessment of ouroperating and financial risk, could cause our surety providers and lenders to decline to issue or renew,or substantially reduce the amount of, bid or performance bonds for our work, and could increase ourcosts associated with collateral. These actions could be taken on short notice. Our inability to obtainadequate bonding or letters of credit to meet bid requirements or enter into significant long-termagreements could have a material adverse effect on our business, financial condition, results ofoperations or prospects.
Further, surety companies may require that we collateralize a percentage of the bond with cash oranother form of credit enhancement. Some of our customers also require collateral guarantees in theform of letters of credit to secure performance or to fund possible damages as the result of an event of
33

default under our contracts with them. If we enter into significant long-term agreements that requirethe issuance of letters of credit, our liquidity could be negatively impacted.
Our inability to meet our customers’ safety standards or adverse publicity affecting our reputation as a resultof incidents such as workplace accidents, mechanical failures, spills, uncontrolled discharges, damage tocustomer or third-party property or the transmission of contaminants or diseases could have a materialadverse effect on our sales and profitability.
Maintaining a strong and reliable reputation for safety is critical to our business. Many of ourcustomers actively monitor and review our company-wide safety record. Further, reports and mediacoverage of incidents, such as those involving workplace accidents, mechanical failures, spills,uncontrolled discharges, damage to customer or third-party property, the transmission of contaminantsor diseases and other adverse events can result in negative publicity, and considerable expansion in theuse of social media over recent years has increased the ways in which our reputation can be impacted,and the speed with which such an impact can occur. Such incidents, or reports thereof, could lead to anegative perception among our customers, prospective customers and the general public regarding thesafety or quality of our products, services and solutions, and anything that damages our reputation orour customers’ perception of our safety record, whether or not justified, could have a materiallyadverse impact on demand for our products and services, result in additional costs to our business orthe loss of customers, result in litigation against us or increase government or regulatory oversight overus.
Our products and facilities are subject to risks involving workplace accidents, mechanical failuresspills, uncontrolled discharges and damage to customer or third-party property, including, among otherthings, personal injury or death caused by our products or occurring in our facilities, the destruction ofcustomer or third-party property during the execution of a service arrangement or due to themalfunction of our products, delays in or suspension of service or the failure to timely deliver ourproducts. A workplace accident, mechanical failure, spill, uncontrolled discharge or any probleminvolving any one or more of our products or facilities, or any perceived insufficiency in our responseto any such deficiency or problem, could materially adversely affect our reputation. Many of ourcustomers actively monitor and review our company-wide safety record, and apply rigorous safetystandards to us and our competitors. Although we take precautions to prevent workplace accidents andmechanical failures, such incidents are difficult to predict and may be outside of our control. If we areunable to meet our customers’ stringent workplace safety standards or, if our customers perceive us tohave a poor safety record, it could materially impact our ability to retain their business or attract newbusiness.
Water may be subject to contaminants, including hazardous chemicals, or pathogens that cause anumber of illnesses, including cholera, typhoid fever, giardiasis, cryptosporidiosis, amoebiasis and freeliving amoebic infections. Such contaminants or pathogens may be found in the environment, and, as aresult, there is a risk that they could become present in water treated using our systems or products.Illness and death may result if such contaminants or pathogens are not eliminated during the treatmentprocess. In particular, such contamination could result from failing to properly treat reusable productsbefore they are distributed to our customers, or from actions taken by our customers or other thirdparties using our products, which could result in material liability. Further, any pandemic or otherpublic health crisis, including those involving non-waterborne illnesses, might adversely impact ourbusiness by diminishing the public trust in water and wastewater treatment facilities or by causingcustomers to seek sources of water other than those processed using our systems or products. Thepotential impact of a contamination of water treated using our products, services or solutions is difficultto predict and could lead to an increased risk of exposure to product liability claims, increased scrutinyby federal and state regulatory agencies and negative publicity. Further, an outbreak of disease in anyone of the municipal markets we serve could result in a widespread loss of customers across other suchmarkets.
34
Our operations are subject to various hazards that may cause personal injury or property damage andincrease our operating costs, and which may exceed the coverage of our insurance or for which we are notinsured.
There are inherent risks to our operations. We are exposed to risks posed by severe weather andother natural disasters, such as hurricanes and earthquakes. In addition to natural risks, hazards (suchas fire, explosion, collapse or machinery failure) are inherent risks in our operations which may occuras a result of inadequate internal processes, technological flaws, human error or certain events beyondour control. We further utilize approximately 650 vehicles in connection with our offsite services anddistribution operations and, from time to time, these drivers are involved in accidents which may causeinjuries, spills or uncontrolled discharges and in which goods carried by these drivers may be lost ordamaged. The hazards described above can cause significant personal injury or loss of life, severedamage to or destruction of property, plants and equipment, including customer or third-partyproperty, contamination of, or damage to, the environment and suspension of operations. Theoccurrence of any of these events may result in our being subject to investigation, required to performremediation or named as a defendant in lawsuits asserting claims for substantial damages,environmental cleanup costs, personal injury, natural resource damages and fines or penalties. As aresult, we may from time to time become exposed to significant liabilities for which we may not haveadequate insurance coverage. We may also become exposed to certain claims that are excluded fromour insurance coverage, such as claims of fraud or for punitive damages. Although we have liabilityinsurance, we cannot be certain that this insurance coverage will continue to be available to us at areasonable cost or will be adequate to cover any product liability claims. In addition, such events mayaffect the availability of personnel, proper functioning of our information technology infrastructure andavailability of third parties on whom we rely, any of which consequences could have a material adverseeffect on our business, financial condition, results of operations or prospects.
Significant or prolonged disruptions in the supply of goods or services from third parties could materiallyadversely affect our business, financial condition, results of operations or prospects.
We are dependent on a continuing flow of goods and services from suppliers to provide ourproducts, services and solutions to our customers. A disruption or prolonged delays in obtainingsupplies or services, including, for example, chemicals, electricity or other materials, could materiallyadversely affect our ability to provide our products, services and solutions to our customers, and ourability to operate in compliance with all regulatory requirements, which could have a material adverseeffect on our business, financial condition, results of operations or prospects. In certain circumstances,we rely on third parties to provide certain important services and a disruption in these services couldmaterially adversely affect our business, financial condition, results of operations or prospects. Somepossible reasons for a delay or disruption in the supply of important goods and services include:
• our suppliers may not provide materials that meet our specifications in sufficient quantities;
• our suppliers may face production delays due to natural disasters, strikes, lock-outs or other suchevents;
• one or more suppliers could make strategic changes in the lines of products and services theyoffer; and
• some of our suppliers, such as small companies, may be more likely to experience financial andoperational difficulties than larger, well-established companies, because of their limited financialand other resources.
As a result of any of these, or other, factors, we may be required to find alternative suppliers forthe materials and services on which we rely. Accordingly, we may experience delays in obtainingappropriate materials and services on a timely basis and in sufficient quantities from such alternative
35

suppliers at a reasonable price, which could interrupt services to our customers and materially adverselyaffect our business, financial condition, results of operations or prospects.
The loss of, or disruption in, our ability to efficiently operate our distribution network could have a materialadverse impact on our business.
We rely on the orderly operation of our receiving and distribution process, which depends on ourdistribution system, adherence to shipping schedules and effective management of our distributionnetwork. If complications arise with our distribution system or if our shipping or storage facilities (or asignificant portion of inventory located there) is severely damaged or destroyed, our ability to receiveand deliver our products on a timely basis will be significantly impaired. There can be no assurancethat disruptions in operations due to natural or man-made disasters, fire, flooding, terrorism or othercatastrophic events, system failure, labor disagreements or shipping problems will not result in delays inthe delivery of our products to our customers. Such delays could materially adversely impact ourbusiness, financial condition, results of operations or prospects. In addition, we could incur significantlyhigher costs and longer lead times associated with distributing our products to our customers duringthe time it takes for us to reopen or replace our facilities. Moreover, our business interruptioninsurance may not be adequate to cover or compensate us for any losses that may occur.
We rely upon various means of transportation through third parties, including shipments by air,sea, rail and truck, to deliver products to our facilities from vendors and from our facilities to ourcustomers, as well as for direct shipments from vendors to customers. Labor shortages or capacityconstraints in the transportation industry, disruptions to the national and international transportationinfrastructure, fuel shortages or transportation cost increases (such as increases in fuel costs or portfees) could materially adversely affect our business and operating results.
We rely, in part, on third-party sales representatives to assist in selling our products, services and solutionsand the failure of these representatives to perform as expected could reduce our future sales.
Sales of our products, services and solutions to some of our customers, including to OEMs, areaccomplished, in part, through the efforts of third-party sales representatives. We are unable to predictthe extent to which these third-party sales representatives will be successful in marketing and sellingour products. Moreover, many of these third-party sales representatives also market and sell competingproducts and may more aggressively pursue sales of our competitors’ products. Our third-party salesrepresentatives may terminate their relationships with us at any time on short or no notice. Our futureperformance may also depend, in part, on our ability to attract, incentivize and retain additional third-party sales representatives that will be able to market and support our products effectively, especially inmarkets in which we have not previously sold our products. If we cannot retain our current third-partysales representatives or recruit additional or replacement third-party sales representatives or if thesesales representatives are not effective, it could have a material adverse effect on our business, financialcondition, results of operations or prospects.
Our products, services and solutions, or our participation in large-scale projects, could expose us to litigation,regulatory or enforcement actions and reputational risk.
We are subject to various laws, ordinances, regulations and other requirements of governmentauthorities in foreign countries and in the United States, any violation of which could potentially createsubstantial liability for us. Changes in laws, ordinances, regulations or other government policies, thenature, timing and effect of which are uncertain, may significantly increase our expenses and liabilities.
From time to time, we are involved in lawsuits that arise from our business. Litigation may, forexample, relate to product liability claims, personal injury, property damage, accidents, regulatoryissues, contract disputes or employment matters. We may face claims that are broader than the scope
36

of our involvement on a project, including claims that seek to impose liability on us for an entiresolution or system for which we provided only limited components.
The occurrence of any of these matters could also create possible damage to our reputation. Thedefense and ultimate outcome of lawsuits against us may result in higher operating expenses. Higheroperating expenses or reputational damage could have a material adverse effect on our business,financial condition, results of operations or prospects.
It is not possible to predict with certainty the outcome of claims, investigations and lawsuits, andwe could in the future incur judgments, fines or penalties or enter into settlements of lawsuits andclaims that could have a material adverse effect on our business, financial condition, results ofoperations or prospects in any particular period. Additionally, we may be required to change or ceaseoperations at one or more facilities if a regulatory agency determines that we have failed to complywith laws, regulations or orders applicable to our business.
A number of factors may prevent or delay our building new plants, expanding our existing plants or installingequipment at our customers’ facilities, including our dependence on third-party suppliers and constructioncompanies.
A number of factors may prevent or delay construction, expansion or use of our facilities orinstallation of our equipment at our customers’ facilities, including our dependence on third-partysuppliers of equipment and materials, our dependence on third-party construction companies and thetiming of equipment purchases.
Further, we enter into contracts for customers regarding long-term engineering, procurement andconstruction projects. If a construction company we have commissioned to build a new project defaultsor fails to fulfill its contractual obligations, we could face significant delays and cost overruns. Anyconstruction delays could have a material adverse impact on us.
The timing of equipment purchases can pose financial risks to us. We attempt to make purchasesof equipment and/or material as needed. However, from time to time, there may be excess demand forcertain types of equipment with substantial delays between the time we place orders and receivedelivery. In those instances, to avoid construction delays, service disruptions or liquidated damagesassociated with the inability to own and place such equipment or materials into service when needed,we may place orders well in advance of deployment or when actual damage to the equipment ormaterials occurs. Thus, there is a risk that at the time of delivery of such equipment or materials, theremay not yet be a need to use them; however, we are still required to accept delivery and makepayment. In addition, due to the customization of some of our equipment or materials, there may be alimited market for resale of such equipment or material. This can result in our incurrence of materialequipment and/or material costs, with no use for or ability to resell such equipment.
Our financial results may fluctuate from period to period and can be difficult to predict.
Our financial results may be impacted by large projects, the timing of which can change basedupon customer requirements due to a number of factors affecting the project, such as funding,readiness of the project and regulatory approvals. Further, the cancellation of any such large projectsmay have a material adverse effect on our business, financial condition, results of operations orprospects. In addition, of our contracts for large capital water treatment projects, systems and solutionsfor municipal and industrial applications are generally fixed-price contracts with milestone billings.Additionally, competitive-bid processes impose significant uncertainty with respect to our prospects forsuccess, and our failure to properly predict our win rate could reduce our margins. Accordingly, ourfinancial results for any given period may fluctuate and can be difficult to predict.
37

Further, our capital expenditures for any given fiscal year may exceed our initial forecasts and mayvary substantially if we are required to undertake certain actions to comply with new regulatoryrequirements or compete with new technologies. We may not have the capital to undertake the capitalinvestments. If we are unable to do so, we may not be able to effectively compete.
Seasonality of sales and weather conditions may adversely affect, or cause volatility in, our financial results.
We experience seasonal demand in a number of our markets, as demand for infrastructure andmunicipal products and projects follows warm weather trends. Seasonal effects may vary from year toyear and are impacted by weather patterns, particularly by temperatures, heavy flooding and droughts.
Additionally, our operating results and financial condition could be materially and adverselyaffected by severe weather, natural disasters, environmental factors, terrorist or other deliberate attacksor hazards (such as fire, explosion or mechanical failure) resulting from inadequate internal processes,technical flaws, human error or other circumstances. Repercussions of these catastrophic events mayinclude:
• shutting down or curtailing the operation of affected plants and facilities for limited or extendedperiods;
• the need to obtain necessary equipment or supplies, including electricity, which may not beavailable to us in a timely manner or at a reasonable cost;
• evacuation of or injury to personnel;
• damage or catastrophic loss to our equipment, facilities and project work sites, resulting insuspension of operations or delays in building or maintaining our plants;
• loss of productivity;
• interruption to any projects that we may have in process; and
• harm to our brand and reputation.
Government customers involve unique policy-, contract- and performance-related risks, and we may facechallenges to our government contracts or our eligibility to serve government customers, any of which couldmaterially adversely impact our business, financial condition, results of operations or prospects.
We derive, and expect to continue to derive in the future, a substantial portion of our revenuesfrom government customers. Sales to governments and related entities present risks in addition to thoseinvolved in sales to industrial and other customers, including policy-related risks such as potentialdisruption due to appropriation and spending patterns, delays in the adoption of new technologies dueto political, fiscal or bureaucratic processes, delays in approving budgets and the government’s right tocancel contracts and purchase orders for its convenience. General political and economic conditions,which we cannot accurately predict, also directly and indirectly affect policies relating to the quantityand allocation of expenditures by government customers. In addition, government contracts may involvelong purchase and payment cycles, competitive bidding requirements, qualification requirements, delaysor changes in agreed-to funding, budgetary constraints, political agendas, extensive specificationdevelopment and price negotiations, milestone requirements and the potential unenforceability oflimitations on liability or other contractual provisions, any of which may create price pressure andreduce our margins. Because our water treatment projects and solutions for municipal customers ofteninclude fixed-price contracts with milestone billings and liquidated damages for our delay, ourperformance under such contracts involves risks such as not receiving payments, not receiving paymentsin a timely manner or incurring significant damages if certain milestones are not met or not met onschedule. As a result, we could experience a material adverse effect on our business, financialcondition, results of operations or prospects.
38

Each government entity also maintains its own rules and regulations with which we must complyand which can vary significantly among customers. We face risks associated with the failure to complywith such rules and regulations. These risks include bid protests, in which our competitors couldchallenge the contracts we have obtained, or suspension, debarment or similar ineligibility from servinggovernment customers. Challenges to our current or future government contracts or to our eligibility toserve government customers could result in a loss of government sales and have a material adverseeffect on our business, financial condition, results of operations or prospects.
Our contracts with federal, state and local governments may be terminated or adversely modified prior tocompletion, which could adversely affect our business.
Government contracts generally contain provisions, and are subject to laws and regulations, thatgive the government rights and remedies not typically found in commercial contracts, includingprovisions permitting the government to:
• terminate our existing contracts;
• reduce potential future revenues from our existing contracts;
• modify some of the terms and conditions in our existing contracts;
• suspend or permanently prohibit us from doing business with the government or with anyspecific government agency;
• impose fines and penalties;
• subject us to criminal prosecution or debarment;
• subject the award of some contracts to protest or challenge by competitors, which may requirethe contracting agency or department to suspend our performance pending the outcome of theprotest or challenge and which may also require the government to solicit new bids for thecontract or result in the termination, reduction or modification of the awarded contract;
• suspend work under existing multiple year contracts and related task orders if the necessaryfunds are not appropriated by U.S. Congress or state or local legislatures;
• decline to exercise an option to extend an existing multiple year contract; and
• claim rights in technologies and systems invented, developed or produced by us.
The government may terminate a contract with us either for convenience (for instance, due to achange in its perceived needs or its desire to consolidate work under another contract) or if we defaultby failing to perform under the contract. Upon a termination for convenience, we are generally able torecover the purchase price for delivered items and reimbursement of allowable work-in-process costs. Ifthe government terminates a contract with us based upon our default, we generally would be deniedany recovery for undelivered work, and instead may be liable for excess costs incurred by thegovernment in procuring undelivered items from an alternative source and other damages as authorizedby law. We may in the future receive show-cause or cure notices under contracts that, if not addressedto the government’s satisfaction, could give the government the right to terminate those contracts fordefault or to cease procuring our services under those contracts.
The cost of complying with complex governmental regulations applicable to our business, sanctions resultingfrom non-compliance or reduced demand resulting from certain changes in regulations could increase ouroperating costs and reduce our profit.
Our operations are subject to various licensing, permitting, approval and reporting requirementsimposed by federal, state, local and foreign laws. Our operations are subject to inspection and
39

regulation by various governmental agencies, including the U.S. EPA, the Occupational Safety andHealth Administration and equivalent state and local agencies, as well as their counterparts in variousstates and foreign countries. A major risk inherent in our operations is the need to obtain and renewpermits from federal, state and local authorities. Delays in obtaining permits, the failure to obtain apermit or a renewal permit for a project, challenges to our permits by local communities, citizengroups, landowners or others opposed to their issuance or the issuance of a permit with unreasonableconditions or costs could limit our ability to effectively provide our services. We are also required tosecure and maintain licenses required by several states which can take a significant amount of time andresult in our inability or delays in our ability to bid on and execute certain projects. If we fail to secureor maintain any such licenses or if states place burdensome restrictions or limitations on our ability toobtain or maintain such licenses, we may not be able to operate in such states and our business,financial condition, results of operations or prospects may be materially adversely affected as a result.
Our business may be further impacted by changes in federal, state and local requirements that setforth air and wastewater discharge parameters, constrain water availability and set quality andtreatment standards. Our failure or inability to comply with the stringent standards set forth byregulating entities or to provide cost-effective and compliant design and construction solutions couldresult in fines or other penalties, and could have a material adverse effect on our business, financialcondition, results of operations or prospects.
Foreign, federal, state and local environmental, health and safety laws and regulations impose substantialcompliance requirements on our operations. Our operating costs could be significantly increased in order tocomply with new or stricter regulatory standards imposed by foreign, federal and state environmental agencies.
Our operations, products and services are governed by various foreign, federal, state and localenvironmental protection and health and safety laws and regulations, including, without limitation, thefederal Safe Drinking Water Act, the Clean Water Act, the Clean Air Act, the Resource Conservationand Recovery Act, the Occupational Safety and Health Act, the Toxic Substances Control Act and theFederal Insecticide, Fungicide, and Rodenticide Act in the United States, the Registration, Evaluationand Authorization of Chemicals, or REACH, directive in Europe, and similar foreign, federal, state andlocal laws and regulations and permits issued under these laws by the foreign, federal, state and localenvironmental and health and safety regulatory agencies. These laws and regulations establish, amongother things, criteria and standards for drinking water and for discharges into the waters of the UnitedStates and its states, for the proper management of hazardous and non-hazardous solid waste and forprotection of public and worker health and safety. Pursuant to these laws, we are required to obtainvarious environmental permits from environmental regulatory agencies for our operations. We cannotassure you that our operations, products or services will be at all times in total compliance with theselaws, regulations and permits or that we will be able to obtain or renew all required permits. If weviolate or fail to comply with these laws, regulations or permits, we could be fined or otherwisesanctioned by regulators and be subject to lawsuits, civil or criminal, seeking enforcement and/orinjunctive relief. We may also be subject to civil claims by citizens groups seeking to enforceenvironmental laws. In the event of an accident or if we otherwise fail to comply with applicableregulations, we could lose our permits or approvals and/or be held liable for damages and monetarypenalties.
Environmental laws and regulations are complex and change frequently. These laws, and theenforcement thereof, have tended to become more stringent over time. It is possible that new standardscould be imposed, either stricter or more lenient, that could result in the obsolescence of our productsor lead to an interruption or suspension of our operations and have a material adverse effect on theproductivity and profitability of a particular manufacturing facility, service or product or on us as awhole.
40

Wastewater operations entail significant risks that may impose significant costs.
Wastewater treatment involves various unique risks. If our treatment systems fail or do not operateproperly, or if there is a spill, untreated or partially treated wastewater could discharge onto propertyor into nearby streams and rivers, causing various damages and injuries, including environmentaldamage. These risks are most acute during periods of substantial rainfall or flooding, which are themain causes of sewer overflow and system failure. Liabilities resulting from such damages and injuriescould materially adversely affect our business, financial condition, results of operations or prospects.
These risks could be increased by the potential physical impacts of climate change on ouroperations. The physical impacts of climate change are highly uncertain and would vary depending ongeographical location, but could include changing temperatures, water shortages, changes in weatherand rainfall patterns and changing storm patterns and intensities. Many climate change predictions, iftrue, present several potential challenges to water and wastewater service providers, such as increasedprecipitation and flooding, potential degradation of water quality and changes in demand for waterservices.
Failure to comply with applicable anti-corruption and trade laws, regulations and policies, including the U.S.Foreign Corrupt Practices Act, could result in fines and criminal penalties, causing a material adverse effecton our business, financial condition, results of operations or prospects.
Due to our global operations, we are subject to regulation under a wide variety of U.S. federal andstate and non-U.S. laws, regulations and policies related to anti-corruption and trade, including thoserelated to export and import compliance, anti-trust and money laundering. The U.S. Foreign CorruptPractices Act, the U.K. Bribery Act of 2010 and similar anti-bribery laws in other jurisdictions generallyprohibit companies and their intermediaries from making improper payments to government officials orother persons for the purpose of obtaining or retaining business. The International Traffic in ArmsRegulations generally require export licenses from the U.S. Department of State for goods, technicaldata and services sent outside the United States that have military or strategic applications. The ExportAdministration Regulations regulate the export of certain ‘‘dual use’’ goods, software and technologies,and in some cases requires export licenses from the U.S. Department of Commerce. Office of ForeignAsset Control regulations implement various sanctions programs that include prohibitions of restrictionson dealings with certain sanctioned countries, governments, entities and individuals. Our policiesmandate compliance with these anti-bribery and trade laws, regulations and policies, and we haveestablished policies and procedures designed to assist us and our personnel in compliance withapplicable United States and international laws and regulations. However, we operate in parts of theworld that are recognized as having governmental and commercial corruption and in certaincircumstances, strict compliance with anti-bribery and trade laws, regulations and policies may conflictwith local customs and practices. We cannot assure you that our internal control policies andprocedures will always protect us from improper conduct of our employees or business partners. In theevent that we believe or have reason to believe that our employees or agents have or may have violatedapplicable laws, including anti-corruption and trade laws, regulations and policies, we may be requiredto investigate or engage outside counsel to investigate the relevant facts and circumstances, which canbe expensive and require significant time and attention from senior management. Any such violationcould result in substantial fines, sanctions, civil and/or criminal penalties, imprisonment, disgorgementof profits, debarment from government contracts and curtailment of operations in certain jurisdictions,and might materially adversely affect our business, financial condition, results of operations orprospects. In addition, actual or alleged violations could damage our reputation and diminish our abilityto do business. Furthermore, detecting, investigating and resolving actual or alleged violations isexpensive and can consume significant time and attention of our senior management.
41
Our business, results of operations and financial condition may be materially adversely affected by risksassociated with international sales and operations.
Our international sales and operations are subject, in varying degrees, to risks inherent to doingbusiness outside the United States. These risks include the following:
• changes in trade protection measures, including tariff and trade barriers and import and exportlicensing requirements;
• potential negative consequences from changes to taxation policies;
• unanticipated changes in other laws, governmental policies and regulations, or in how suchprovisions are interpreted or administered;
• risks associated with the withdrawal of the United Kingdom from the European Union,commonly known as ‘‘Brexit,’’ including volatility in worldwide and European financial markets,potential restrictions on the free movement of goods and labor between the United Kingdomand the European Union and other impediments to our ability to transact within and betweeneach of the United Kingdom and the European Union;
• potential disruptions in our global supply chain;
• possibility of unfavorable circumstances arising from host country laws or regulations;
• restrictions on, or taxation of, dividends on repatriation of earnings under applicable local law,monetary transfer restrictions and foreign currency exchange regulations in the jurisdictions inwhich our subsidiaries operate;
• currency exchange rate fluctuations and restrictions on currency repatriation;
• labor disturbances;
• safety and security considerations;
• increased costs and risks of developing and managing global operations, including our potentialfailure to implement global best practices, experiences of employee dissatisfaction and theimproper allocation of resources, as a result of distance as well as language and culturaldifferences; and
• political instability insurrection, armed conflict, terrorism or war.
In addition to the general risks that we face outside the United States, our operations in emergingmarkets could involve additional uncertainties for us, including risks that governments may imposelimitations on our ability to repatriate funds; governments may impose withholding or other taxes onremittances and other payments to us, or the amount of any such taxes may increase; an outbreak orescalation of any insurrection or armed conflict may occur; governments may seek to nationalize ourassets; or governments may impose or increase investment barriers or other restrictions affecting ourbusiness. The emerging markets in which we are active, including China, pose other uncertainties,including the difficulty of enforcing agreements, collecting receivables, protecting of our intellectualproperty and other assets and pricing of our products appropriately, as well as higher business conductrisks, less qualified talent and risks of political instability. We cannot predict the impact such eventsmight have on our business, financial condition, results of operations or prospects.
Our operations in China expose us to risks inherent in doing business there.
We currently have operations and source and manufacture certain of our materials and productsfor global distribution from third-party suppliers and manufacturers in China. The political, legal andeconomic climate in China, both nationally and regionally, is fluid and unpredictable, and operating in
42

China exposes us to political, legal and economic risks. Our ability to operate in China may beadversely affected by changes in U.S. and Chinese laws and regulations such as those related to, amongother things, taxation, import and export tariffs, environmental regulations, land use rights, intellectualproperty, currency controls, network security, employee benefits and other matters, and we may notobtain or retain the requisite legal permits to continue to operate in China or we may become subjectto costs or operational limitations imposed in connection with obtaining and complying with suchpermits. In addition, Chinese trade regulations are in a state of flux, and we may become subject toother forms of taxation, tariffs and duties in China. We may experience difficulty in establishingmanagement, legal and financial controls, collecting financial data and preparing financial statements,books of account and corporate records and instituting business practices that meet U.S. andinternational standards. We may also experience difficulty in managing relations with our employees,distributors, suppliers or customers, with whom disagreements or conflicts of interest could materiallyadversely affect our operations or our ability to source and manufacture certain of our materials andproducts in China. Further, the third parties we rely on in China may disclose our confidentialinformation or intellectual property to competitors or third parties, which could result in the illegaldistribution and sale of counterfeit versions of our products. Any of these factors could have a materialadverse effect on our business, financial condition, results of operations or prospects.
Additionally, the rapid development of the Chinese economy has led to increased labor costs, andthe cost of labor in China may continue to increase in the future. Our results of operations will bematerially and adversely affected if our labor costs, or the labor costs of our suppliers andmanufacturers, increase significantly. We and our manufacturers and suppliers may be unable to find asufficient number of qualified workers due to the intensely competitive and fluid market for skilledlabor in China. Furthermore, pursuant to Chinese labor laws, employers in China are subject to variousrequirements when signing labor contracts, paying remuneration, determining the term of employees’probation and unilaterally terminating labor contracts. These labor laws and related regulations imposeliabilities on employers and may significantly increase the costs of workforce reductions. If we decide tochange or reduce our workforce, these labor laws could limit or restrict our ability to make suchchanges in a timely, favorable and effective manner. Any of these events could have a material adverseeffect our business, financial condition, results of operations or prospects.
If we do not or cannot adequately protect our intellectual property, if third parties infringe our intellectualproperty rights, or if third parties claim that we are infringing or misappropriating their intellectual propertyrights, we may suffer competitive injury, expend significant resources enforcing our rights or defending againstsuch claims, or be prevented from selling products or services.
We own numerous patents, trademarks, service marks, copyrights, trade secrets and otherintellectual property and licenses to intellectual property owned by others, which in aggregate areimportant to our business. The intellectual property rights that we obtain, however, may not provideour products and services with a significant competitive advantage because our rights may not besufficiently broad or may be challenged, invalidated, or subject to government march-in or sovereignrights or compulsory licensing, sunshine laws, or be subject to freedom of information requests, orcourt-ordered public disclosure, or be subject to open-source software licensing, or be circumvented,independently developed or designed-around, misappropriated, disparaged, diluted, or stolen,particularly in countries where intellectual property rights laws are not highly developed, protected orenforced. Our failure to obtain or maintain intellectual property rights that convey competitiveadvantage, adequately protect our intellectual property or detect or prevent circumvention orunauthorized use of such property and the cost of enforcing our intellectual property rights couldmaterially adversely impact our business, financial condition, results of operations or prospects.
43

From time to time, we, or on occasion our suppliers, contractors or indemnified parties in oursupply chain including end-users, receive notices from third parties alleging or warning of potentialintellectual property infringement or misappropriation. Any dispute or litigation regarding intellectualproperty could be costly and time-consuming due to the complexity and the uncertainty of intellectualproperty litigation. Our intellectual property portfolio may not be useful in asserting a counterclaim, ornegotiating a license, in response to a claim of infringement or misappropriation. We may incursignificant costs and diversion of management attention and resources as a result of such claims ofinfringement or misappropriation, and we or our suppliers or sub-contractors could lose rights tocritical technology, be unable to license critical technology, provide or sell critical products or services,or be required to pay substantial damages or license fees with respect to the infringed rights or berequired to redesign, rework, re-program, or replace our or our customers’ products, sub-components,software, or systems, or re-cast our valuable brands at substantial cost, any of which could materiallyadversely impact our competitive position, financial condition and results of operations even if wesuccessfully defend against such claims of infringement or misappropriation.
We are increasingly dependent on the continuous and reliable operation of our information technology systems,and a disruption of these systems could materially adversely affect our business.
We rely on our information technology systems in connection with the operation of our business,including with respect to customer service and billing, accounting and, in some cases, the monitoringand operation of our installations. Many of our products, services and solutions depend on the integrityof our information technology systems, including our Water One remote system, monitoring and dataanalytics features and our automated control solutions. In addition, we rely on our systems to managemaintenance and construction projects, materials and supplies and our human resource functions. Aloss of these systems, major problems with the operation of these systems, the failure to properlyimplement these systems, including in customer installations, or the failure to identify market trendsand continuously update our information technology systems could materially adversely affect ouroperations, sales and reputation and have a material adverse effect on our business, financial condition,results of operations or prospects.
Specifically, our information technology systems may be vulnerable to damage or interruptionfrom:
• power loss, computer systems failures and internet, telecommunications or data network failures;
• operator negligence or improper operation by, or supervision of, employees;
• physical and electronic loss of data;
• computer viruses;
• intentional security breaches, hacking, denial of service actions, misappropriation of data andsimilar events; and
• hurricanes, fires, floods, earthquakes and other natural disasters.
Such incidents may result in the loss or compromise of customer, financial or operational data,disruption of billing, collections or normal field service activities, disruption of data analytics andelectronic monitoring and control of operational systems and delays in financial reporting and othernormal management functions. Possible impacts associated with a cybersecurity incident may includeremediation costs related to lost, stolen, or compromised data, repairs to infrastructure, physicalsystems or data processing systems, increased cybersecurity protection costs, adverse effects on ourcompliance with regulatory and environmental laws and regulations, including standards for drinkingwater, litigation and reputational damage.
44
We, and some of our third party vendors, have experienced cybersecurity attacks in the past andmay experience them in the future, potentially with more frequency. To date, most of these attackshave been unsuccessful, and none have resulted in any material adverse impact to our business oroperations. We have adopted measures to mitigate potential risks associated with informationtechnology disruptions and cybersecurity threats, however, given the unpredictability of the timing,nature and scope of such disruptions, we could potentially be subject to production downtimes,operational delays, other detrimental impacts on our operations or ability to provide products andservices to our customers, the compromising of confidential or otherwise protected information,destruction or corruption of data, security breaches, other manipulation or improper use of our systemsor networks, financial losses from remedial actions, loss of business or potential liability, regulatoryenforcement actions and/or damage to our reputation, any of which could have a material adverseeffect on our competitive position, results of operations, cash flows or financial condition. We also havea concentration of operations on certain sites, such as production and shared services centers, wherebusiness interruptions could cause material damage and costs. Transport of goods from suppliers, andto customers, could also be hampered for the reasons stated above.
Although we continue to assess these risks, implement controls and perform business continuityand disaster recovery planning, we cannot be sure that interruptions with material adverse effects willnot occur.
If we experience a significant data security breach or fail to detect and appropriately respond to a significantdata security breach, our business and reputation could suffer.
The nature of our business involves the receipt and storage of information about our customers,suppliers and employees. Further, we rely on various information technology systems to capture,process, store and report data in connection with the products, services and solutions that we provideto our customers, such as our Water One smart water technology. We have procedures in place todetect and respond to data security incidents. However, because the techniques used to obtainunauthorized access, disable or degrade service, or sabotage systems change frequently and may bedifficult to detect for long periods of time, we may be unable to anticipate these techniques orimplement adequate preventive measures. In addition, hardware, software or applications we develop orprocure from third parties may contain defects in design or manufacture or other problems that couldunexpectedly compromise information security. We outsource administration of certain functions tovendors that could be targets of cyber attacks. Any theft, loss and/or fraudulent use of customer,employee or proprietary data as a result of a cyber attack could subject us to significant litigation,liability and costs, as well as adversely impact our reputation with customers and regulators, amongothers. Unauthorized parties may also attempt to gain access to our systems or facilities and to ourproprietary business information. If our efforts to protect the security of information about ourcustomers, suppliers and employees are unsuccessful, a significant data security breach may result incostly government enforcement actions, private litigation and negative publicity resulting in reputationor brand damage with customers, and our business, financial condition, results of operations orprospects could suffer.
Our business could be adversely affected by inflation and other manufacturing and operating cost increases.
Our operating costs are subject to fluctuations, particularly due to changes in commodity prices,raw materials, energy and related utilities, freight and cost of labor. In order to remain competitive, wemay not be able to recuperate all or a portion of these higher costs from our customers throughproduct price increases. In addition, many of our contracts are long-term in nature, and our failure tonegotiate price escalation provisions, or to obtain adequate price escalation provisions, in our long-termcontracts could, in the event of an inflationary or otherwise cost-increasing environment, have amaterial adverse effect on our business, financial condition, results of operations or prospects. Further,
45

in a declining price environment, our operating margins may contract because we account for inventorycosts on the basis of an average or first-in, first-out method. Actions we take to mitigate volatility inmanufacturing and operating costs may not be successful and, as a result, our business, financialcondition, results of operations or prospects could be materially and adversely affected.
Our ability to use our net operating loss carryforwards may be limited.
As of September 30, 2016, we had approximately $88.6 million of U.S. federal and state netoperating loss carryforwards (‘‘NOLs’’). Our NOLs begin to expire in 2019. Utilization of these NOLsdepends on many factors, including our future income, which cannot be assured. We have full valuationallowance against the NOLs. In addition, Section 382 of the Internal Revenue Code of 1986, asamended (‘‘Section 382’’), generally imposes an annual limitation on the amount of taxable income thatmay be offset by NOLs when a corporation has undergone an ‘‘ownership change’’ (as determinedunder Section 382). Generally, a corporation experiences such an ownership change if the percentageof its stock owned by its ‘‘5-percent shareholders,’’ as defined in Section 382, increases by more than50 percentage points (by value) over a three-year period. Any unused annual limitation may, subject tocertain limitations, be carried over to later years. We may undergo an ownership change in the future,including an ownership change as a result of the combined effect of this and future offerings, whichwould result in an annual limitation under Section 382 determined by multiplying the value of ourstock at the time of the ownership change by the applicable long-term tax-exempt rate as defined inSection 382, increased under certain circumstances as a result of recognizing built-in gains in our assetsexisting at the time of the ownership change. The limitations arising from any ownership change mayprevent utilization of our NOLs prior to their expiration. Future ownership changes or regulatorychanges could further limit our ability to utilize our NOLs. To the extent we are not able to offset ourfuture income with our NOLs, this could adversely affect our operating results and cash flows if weattain profitability.
Changes in our effective tax rates may adversely affect our financial results.
We offer our products, services and solutions in more than 100 countries and 16% of our revenuewas generated outside the United States in fiscal 2016. Given the global nature of our business, anumber of factors may increase our future effective tax rates, including:
• our decision to repatriate non-U.S. earnings for which we have not previously provided for U.S.taxes;
• the jurisdictions in which profits are determined to be earned and taxed;
• sustainability of historical income tax rates in the jurisdictions in which we conduct business;
• the resolution of issues arising from tax audits with various tax authorities; and
• changes in the valuation of our deferred tax assets and liabilities, and changes in deferred taxvaluation allowances.
Any significant increase in our future effective tax rates could reduce net income for futureperiods.
46
Our historical consolidated financial information may not be representative of our results if we had operatedindependently of Siemens and does not reflect further changes to our management structure following ourseparation from Siemens and, as a result, may not be a reliable indicator of the results that we will achieve asan independent company.
Prior to the AEA Acquisition in fiscal 2014, we operated as a subsidiary of Siemens. Consequently,some of the financial information included in this prospectus has been derived from the combined andconsolidated financial statements and accounting records of Siemens and reflects assumptions andallocations made by Siemens. Our financial position, results of operations and cash flows, as presented,may be different from those that would have resulted if we had been operated as a standalonecompany or by a company other than Siemens. For example, in preparing our financial statements,Siemens made an allocation of Siemens’ costs and expenses that were attributable to our business.However, these costs and expenses reflect the costs and expenses attributable to our business as part ofa larger organization. They do not necessarily reflect costs and expenses that we would have incurredhad we operated independently, and may not reflect costs and expenses that we would have incurred asa result of the acquisitions and divestitures that we have made since our separation from Siemens. Inaddition, our fiscal 2012 and fiscal 2013 selected historical consolidated financial statements wereprepared on a ‘‘carve-out’’ basis for the purpose of presenting our historical financial position, resultsof operations and cash flows. Because the Predecessor represents a portion of the Siemens’ business,the selected financial data presented for these periods in ‘‘Selected Historical Consolidated FinancialData’’ is not necessarily indicative of our current or future performance and does not reflect what ourperformance would have been had we operated as a separate stand-alone entity during these periods.Further, in fiscal 2016, we effected an organizational redesign to align the management activities ofcertain of our business centers with functional leaders and, in connection with the Neptune-BensonAcquisition, created a new Aquatics and Disinfection division, which we subsequently merged into ourProducts Segment. This realignment has had implications on how we manage our business. As a result,our historical financial information may not be a reliable indicator of our future results or the resultsthat we will achieve following the acquisitions and divestitures that we have made and the realignmentof our management structure following our separation from Siemens.
The unaudited pro forma financial information included in this prospectus is presented for illustrativepurposes only and does not reflect what the financial position or results of operations of the combinedcompany would have been had the transactions reflected therein been completed as of the dates assumed forpurposes of that pro forma information nor does it reflect the actual financial position or results of operationsof the combined company following the completion of such transactions.
The unaudited pro forma financial information included in this prospectus is presented forillustrative purposes only, contains a variety of adjustments, assumptions and preliminary estimates, issubject to numerous other uncertainties and does not reflect what the combined company’s financialposition or results of operations would have been had the transactions reflected therein beencompleted as of the dates assumed for purposes of that pro forma financial information, nor does itreflect the financial position or results of operations of the combined company following thecompletion of any of our other recent acquisitions. The unaudited pro forma financial information doesnot give effect to any unforeseen costs that could result from such transactions, nor does it include anyother items not expected to have a continuing impact on our consolidated results of operations.
Our and Neptune-Benson’s actual results of operations prior to the Neptune-Benson Acquisitionand that of our Company following the Neptune-Benson Acquisition may not be consistent with, orevident from, the unaudited pro forma financial information included in this prospectus. In addition,the assumptions or estimates used in preparing the unaudited pro forma financial information includedin this prospectus may not prove to be accurate and may be affected by other factors. Any significantchanges in the costs associated with the acquisition (whether as a result of contractual purchase price
47
adjustments or otherwise), or in our ability to manage our combined operations, realize anticipatedgrowth opportunities and optimize best practices, from those assumed or used for purposes ofpreparing the estimated pro forma financial information may cause a significant change in the proforma financial information.
We are a holding company with no operations of our own, and we depend on our subsidiaries for cash.
We are a holding company and do not have any material assets or operations other than ownershipof equity interests of our subsidiaries. Our operations are conducted almost entirely through oursubsidiaries, and our ability to generate cash to meet our obligations or to pay dividends, if any, ishighly dependent on the earnings of, and receipt of funds from, our subsidiaries through dividends orintercompany loans. The ability of our subsidiaries to generate sufficient cash flow from operations toallow us and them to make scheduled payments on our debt obligations will depend on their futurefinancial performance, which will be affected by a range of economic, competitive and business factors,many of which are outside of our control. We cannot assure you that the cash flow and earnings of ouroperating subsidiaries will be adequate for our subsidiaries to service their debt obligations.Additionally, under the terms of our Senior Secured Credit Facilities, our operating subsidiaries arecurrently limited in their ability to pay cash dividends to us, and we expect these limitations to continuein the future under the terms of any future credit agreement or any future debt or preferred equitysecurities of ours or of our subsidiaries. If our subsidiaries do not generate sufficient cash flow fromoperations to satisfy corporate obligations, we may have to undertake alternative financing plans (suchas refinancing), restructure debt, sell assets, reduce or delay capital investments or seek to raiseadditional capital. We cannot assure you that any such alternative refinancing would be possible, thatany assets could be sold, or, if sold, of the timing of the sales and the amount of proceeds realizedfrom those sales, that additional financing could be obtained on acceptable terms, if at all, or thatadditional financing would be permitted under the terms of our various debt instruments then in effect.Our inability to generate sufficient cash flow to satisfy our obligations, or to refinance our obligationson commercially reasonable terms, could have a material adverse effect on our business, financialcondition, results of operations or prospects.
Furthermore, we and our subsidiaries may incur substantial additional indebtedness in the futurethat may severely restrict or prohibit our subsidiaries from making distributions, paying dividends, ifany, or making loans to us.
We may incur impairment charges for our goodwill and other indefinite-lived intangible assets which wouldnegatively impact our operating results.
We have a significant amount of goodwill and purchased intangible assets on our balance sheet asa result of the AEA Acquisition and subsequent acquisitions we have completed, including theNeptune-Benson Acquisition. As of June 30, 2017, the net carrying value of our goodwill and otherindefinite-lived intangible assets totaled approximately $657 million. The carrying value of goodwillrepresents the fair value of an acquired business in excess of identifiable assets and liabilities as of theacquisition date. The carrying value of indefinite-lived intangible assets represents the fair value oftrademarks and trade names as of the acquisition date. We do not amortize goodwill and indefinite-lived intangible assets that we expect to contribute indefinitely to our cash flows, but instead weevaluate these assets for impairment at least annually, or more frequently if changes in circumstancesindicate that a potential impairment could exist. In testing for impairment, we will make a qualitativeassessment, and if we believe that it is more likely than not that the fair value of a reporting unit is lessthan its carrying amount, the quantitative two-step goodwill impairment test is required. Significantnegative industry or economic trends, disruptions to our business, inability to effectively integrateacquired businesses, unexpected significant changes or planned changes in use of the assets, divestituresand market capitalization declines may impair our goodwill and other indefinite-lived intangible assets.
48

Any charges relating to such impairments could materially adversely affect our financial condition andresults of operations.
Risks Relating to our Indebtedness
Our substantial indebtedness could adversely affect our financial condition and limit our ability to raiseadditional capital to fund our operations.
We have a significant amount of indebtedness. As of June 30, 2017, we had total indebtedness of$893.2 million, including $818.7 million of borrowings under the Term Loan Facility, $60.0 million inborrowings under the Revolving Credit Facility and $7.5 million of letters of credit issued under theRevolving Credit Facility, with $27.5 million in additional borrowing capacity thereunder. An additional$8.4 million of letters of credit were issued under a separate uncommitted facility as of June 30, 2017.On August 8, 2017, we (i) borrowed $262.7 million in refinancing term loans, the net proceeds of whichwere used to refinance in their entirety the NB Incremental Loans, and (ii) increased the amount ofour existing Term Loan Facility by borrowing $80.0 million of incremental term loans under the TermLoan Facility, the net proceeds of which were used to repay $60.0 million of revolving credit loans thenoutstanding under our Revolving Credit Facility and to pay related fees and expenses, and for othergeneral corporate purposes (including permitted acquisitions and permitted investments pursuant to theFirst Lien Credit Agreement).
Our high level of indebtedness could have important consequences to us, including:
• making it more difficult for us to satisfy our obligations with respect to our debt;
• limiting our ability to obtain additional financing to fund future working capital, capitalexpenditures, investments or acquisitions or other general corporate requirements;
• requiring a substantial portion of our cash flows to be dedicated to debt service payments and/ordebt repayment instead of other purposes, thereby reducing the amount of cash flows availablefor working capital, capital expenditures, investments or acquisitions or other general corporatepurposes;
• increasing our vulnerability to adverse changes in general economic, industry and competitiveconditions;
• exposing us to the risk of increased interest rates as borrowings under our Senior Secured CreditFacilities (to the extent not hedged) bear interest at variable rates, which could further adverselyimpact our cash flows;
• limiting our flexibility in planning for and reacting to changes in our business and the industry inwhich we compete;
• restricting us from making strategic acquisitions or causing us to make non-strategic divestitures;
• impairing our ability to obtain additional financing in the future;
• placing us at a disadvantage compared to other, less leveraged competitors; and
• increasing our cost of borrowing.
Any one of these limitations could have a material effect on our business, financial condition,results of operations, prospects and our ability to satisfy our obligations in respect of our outstandingdebt.
49
Despite our current debt levels, we may incur substantially more indebtedness, which could further exacerbatethe risks associated with our substantial leverage.
We and our subsidiaries may be able to incur additional indebtedness in the future, which may besecured. While our Senior Secured Credit Facilities limit our ability and the ability of our subsidiariesto incur additional indebtedness, these restrictions are subject to a number of qualifications andexceptions and thus, notwithstanding these restrictions, we may still be able to incur substantially moredebt. In addition, provided that no default or event of default (as defined in the First Lien CreditAgreement) has occurred and is continuing, we have the option to add one or more incremental termloan or revolving credit facilities or increase commitments under the Revolving Credit Facility by anaggregate amount which does not cause our total first lien net leverage ratio, on a pro forma basis (ineach case, as defined in the First Lien Credit Agreement), to exceed 4.50 to 1.00, plus up to anadditional $100.0 million (excluding incremental revolving credit facilities or increases under theRevolving Credit Facility in an aggregate principal amount not to exceed $30.0 million) (all of whichremains available as of June 30, 2017). On August 8, 2017, we increased the amount of our existingTerm Loan Facility by borrowing $80.0 million of incremental term loans under the Term Loan Facility,the net proceeds of which were used to repay $60.0 million of revolving credit loans then outstandingunder our Revolving Credit Facility and to pay related fees and expenses, and for other generalcorporate purposes (including permitted acquisitions and permitted investments pursuant to the FirstLien Credit Agreement). To the extent that we incur additional indebtedness, the risks that we nowface related to our substantial indebtedness could increase.
To service our indebtedness, we require a significant amount of cash, which depends on many factors beyondour control.
We cannot assure you that our business will generate sufficient cash flow from operations, or thatfuture borrowings will be available to us under our Senior Secured Credit Facilities in amountssufficient to enable us to fund our liquidity needs.
If we do not generate sufficient cash flow from operations to satisfy our debt obligations, we mayhave to undertake alternative financing plans, such as:
• refinancing or restructuring our debt;
• selling assets; or
• seeking to raise additional capital.
We cannot assure you that we would be able to enter into these alternative financing plans oncommercially reasonable terms or at all. Moreover, any alternative financing plans that we may berequired to undertake would still not guarantee that we would be able to meet our debt obligations.Our inability to generate sufficient cash flow to satisfy our debt obligations, or to obtain alternativefinancing, could materially adversely affect our business, financial condition, results of operations orprospects. See ‘‘Management’s Discussion and Analysis of Financial Condition and Results ofOperations—Liquidity and Capital Resources.’’
We will need to repay or refinance borrowings under our First Lien Facilities.
The Revolving Credit Facility and Term Loan Facility are scheduled to mature in January 2019 andJanuary 2021, respectively. We will need to repay, refinance, replace or otherwise extend the maturityof our First Lien Facilities. Our ability to repay, refinance, replace or extend these facilities by theirmaturity dates will be dependent on, among other things, business conditions, our financialperformance and the general condition of the financial markets. If a financial disruption were to occurat the time that we are required to repay indebtedness outstanding under our First Lien Facilities, we
50
could be forced to undertake alternate financings, including a sale of additional common stock,negotiate for an extension of the maturity of our First Lien Facilities or sell assets and delay capitalexpenditures in order to generate proceeds that could be used to repay indebtedness under our FirstLien Facilities. We cannot assure you that we will be able to consummate any such transaction on termsthat are commercially reasonable, on terms acceptable to us or at all.
Our variable rate indebtedness subjects us to interest rate risk, which could cause our debt service obligationsto increase significantly.
Borrowings under our First Lien Facilities are at variable rates of interest and expose us to interestrate risk. Interest rates are still near historically low levels and are projected to rise in the future. Ifinterest rates rise, our debt service obligations on the variable rate indebtedness will increase eventhough the amount borrowed may remain the same, and our net income and cash flows willcorrespondingly decrease. Assuming no prepayments of the Term Loan Facility (which had$818.7 million outstanding as of June 30, 2017) and that the $95.0 million Revolving Credit Facility wasfully drawn, each 0.125% change in interest rates would result in an approximate change of $1.1 millionin annual interest expense on the indebtedness under our First Lien Facilities.
The covenants in our Senior Secured Credit Facilities impose restrictions that may limit our operating andfinancial flexibility.
Our Senior Secured Credit Facilities contain a number of significant restrictions and covenants thatlimit our ability, among other things, to:
• incur additional indebtedness;
• pay dividends or distributions on our capital stock or repurchase or redeem our capital stock;
• prepay, redeem or repurchase specified indebtedness;
• create certain liens;
• sell, transfer or otherwise convey certain assets;
• make certain investments;
• create dividend or other payment restrictions affecting subsidiaries;
• engage in transactions with affiliates;
• create unrestricted subsidiaries;
• consolidate, merge or transfer all or substantially all of our assets or the assets of oursubsidiaries;
• enter into agreements containing certain prohibitions affecting us or our subsidiaries; and
• enter into new lines of business.
In addition, the Senior Secured Credit Facilities contain a financial covenant requiring us tocomply with a 5.55 to 1.00 first lien net leverage ratio test. This financial covenant is solely for thebenefit of the lenders under our Revolving Credit Facility and is tested as of the last day of a quarteron which the aggregate amount of revolving loans and letters of credit outstanding under the RevolvingCredit Facility (net of cash collateralized letters of credit and undrawn outstanding letters of credit inan amount of up to 50% of the Revolving Credit Facility) exceeds 25% of the total commitmentsthereunder.
51

These covenants could materially adversely affect our ability to finance our future operations orcapital needs. Furthermore, they may restrict our ability to expand and pursue our business strategiesand otherwise conduct our business. Our ability to comply with these covenants may be affected bycircumstances and events beyond our control, such as prevailing economic conditions and changes inregulations, and we cannot assure you that we will be able to comply with such covenants. Theserestrictions also limit our ability to obtain future financings to withstand a future downturn in ourbusiness or the economy in general. In addition, complying with these covenants may also cause us totake actions that may make it more difficult for us to successfully execute our business strategy andcompete against companies that are not subject to such restrictions.
A breach of any covenant in our Senior Secured Credit Facilities or the agreements and indenturesgoverning any other indebtedness that we may have outstanding from time to time would result in adefault under that agreement or indenture after any applicable grace periods. A default, if not waived,could result in acceleration of the debt outstanding under the agreement and in a default with respectto, and an acceleration of, the debt outstanding under other debt agreements. If that occurs, we maynot be able to make all of the required payments or borrow sufficient funds to refinance such debt.Even if new financing were available at that time, it may not be on terms that are acceptable to us orterms as favorable as our current agreements. If our debt is in default for any reason, our business,results of operations and financial condition could be materially and adversely affected.
Risks Relating to our Common Stock and this Offering
There is no existing market for our common stock, and we do not know if one will develop to provide you withadequate liquidity to sell our common stock at prices equal to or greater than the price you paid in thisoffering.
Prior to this offering, there has not been a public market for our common stock. We cannotpredict the extent to which investor interest in us will lead to the development of a trading market onthe NYSE, or otherwise or how active and liquid that market may come to be. Although we haveapplied to list our common stock on the NYSE, if an active trading market for our common stock doesnot develop following this offering, you may not be able to sell your shares quickly or at or above theinitial public offering price. The initial public offering price for our shares will be determined bynegotiations between us, the selling stockholders and representatives of the underwriters and may notbe indicative of prices that will prevail in the open market following this offering. Consequently, youmay not be able to sell our common stock at prices equal to or greater than the price you paid in thisoffering.
The market price of our common stock may be highly volatile, and you may not be able to resell your sharesat or above the initial public offering price.
The trading price of our common stock could be volatile, and you could lose all or part of yourinvestment. We cannot assure you that an active public market for our common stock will be sustained.The following factors, in addition to other factors including those described in this ‘‘Risk Factors’’section and elsewhere in this prospectus, may have a significant impact on the market price of ourcommon stock:
• negative trends in global economic conditions or activity levels in our industry;• changes in our relationship with our customers or in customer needs, expectations or trends;
• announcements concerning our competitors or our industry in general;
• our ability to implement our business strategy;
• our ability to complete and integrate acquisitions;
• actual or anticipated fluctuations in our quarterly or annual operating results;
• trading volume of our common stock;
52

• the failure of securities analysts to cover the Company after this offering or changes in analysts’financial estimates;
• severe weather, natural disasters, acts of war or terrorism or other external events;
• economic, legal and regulatory factors unrelated to our performance;
• changes in accounting principles;
• the loss of any of our management or key personnel;
• sales of our common stock by us, our executive officers and directors or our stockholders(including certain affiliates of AEA) in the future; and
• general economic and market conditions and overall fluctuations in the U.S. equity markets.
In addition, broad market and industry factors may negatively affect the market price of ourcommon stock, regardless of our actual operating performance, and factors beyond our control maycause our stock price to decline rapidly and unexpectedly.
Because AEA controls a significant percentage of our common stock, it may influence major corporatedecisions, and the interests of AEA and its affiliates, including certain of our directors, may conflict with yourinterests as an owner of our common stock and those of the Company.
We are controlled by AEA, which currently owns 58.5% of our common stock and will ownapproximately 43.0% after the completion of this offering (or 40.6% after the completion of thisoffering if the underwriters exercise in full their option to purchase additional shares). Through thisbeneficial ownership and a stockholders’ agreement and irrevocable voting proxies, pursuant to whichcertain of our stockholders prior to this offering have agreed to vote all of their shares to elect oneindividual to our board of directors that has been nominated by AEA (so long as AEA holds anaggregate of at least 10% of our outstanding common stock), AEA may be deemed to beneficially own,after the completion of this offering, approximately 75.7% of the voting power of our outstandingcommon stock (or 72.1% if the underwriters exercise in full their option to purchase additional shares).As a result, AEA will be able to influence matters requiring approval by our stockholders and/or ourboard of directors, including the election of directors and the approval of business combinations ordispositions and other extraordinary transactions. See ‘‘Certain Relationships and Related PartyTransactions.’’
AEA may have interests that are different from yours and may vote in a way with which youdisagree and which may be adverse to your interests. Further, AEA’s concentration of ownership couldhave the effect of delaying or preventing a change in control or otherwise discouraging a potentialacquirer from attempting to obtain control of us, which could cause the market price of our commonstock to decline or prevent our stockholders from realizing a premium over the market price for theircommon stock. Additionally, AEA and its affiliates are in the business of making investments incompanies and may from time to time acquire and hold interests in businesses that compete directly orindirectly with us or supply us with goods and services. Stockholders should consider that the interestsof AEA may differ from their interests in material respects.
Following this offering, three of our seven directors will be affiliated with AEA. These persons willhave fiduciary duties to both us and AEA. As a result, they may have real or apparent conflicts ofinterest on matters affecting both us and AEA, which in some circumstances may have interests adverseto ours. In addition, as described below under ‘‘Description of Capital Stock,’’ our amended andrestated certificate of incorporation provides that the doctrine of ‘‘corporate opportunity’’ will not applywith respect to us, to AEA or certain related parties or any of our directors who are employees ofAEA or its affiliates in a manner that would prohibit them from investing in competing businesses ordoing business with our customers. AEA or its affiliates may also pursue acquisition opportunities that
53
may be complementary to our business and, as a result, those acquisition opportunities may not beavailable to us. To the extent they invest in such other businesses, AEA and its affiliates, includingaffiliates of AEA who serve on our board of directors, may have interests that differ from those of ourother stockholders.
Investors purchasing common stock in this offering will experience immediate and substantial dilution as aresult of this offering and future equity issuances.
Prior investors have paid substantially less per share for our common stock than the price in thisoffering. The initial public offering price of our common stock is substantially higher than the nettangible book value per share of our outstanding common stock prior to completion of the offering.Accordingly, based on the initial public offering price of $18.00 per share (the midpoint of the pricerange set forth on the cover page of this prospectus), if you purchase our common stock in thisoffering, you will pay substantially more for your shares than the amounts paid by our existingstockholders for their shares and you will suffer immediate dilution of approximately $20.87 per sharein net tangible book value of our common stock. To the extent outstanding options are ultimatelyexercised, there will be further dilution to investors in this offering. In addition, if the underwritersexercise their option to purchase additional shares, or if we issue additional equity securities in thefuture, investors purchasing common stock in this offering will experience additional dilution. See‘‘Dilution.’’
Sales, or the potential for sales, of a substantial number of shares of our common stock in the public marketby us or our existing stockholders could cause our stock price to fall.
Sales of a substantial number of shares of our common stock in the public market or theperception that these sales might occur, could depress the market price of our common stock and couldimpair our ability to raise capital through the sale of additional equity securities. Substantially all of ourexisting stockholders are subject to lock-up agreements with the underwriters of this offering thatrestrict the stockholders’ ability to transfer shares of our common stock for at least 180 days from thedate of this prospectus, subject to certain exceptions. The lock-up agreements limit the number ofshares of common stock that may be sold immediately following the public offering. After this offering,we will have 113,282,257 outstanding shares of common stock. Subject to limitations, approximately83,544,087 shares will become eligible for sale upon expiration of the lock-up period, as calculated anddescribed in more detail in the section entitled ‘‘Shares Eligible for Future Sale.’’ In addition, sharesissued or issuable upon exercise of options and warrants vested as of the expiration of the lock-upperiod will be eligible for sale at that time. Sales of stock by these stockholders could have a materialadverse effect on the trading price of our common stock.
Moreover, after this offering, holders of an aggregate of 85,504,480 shares of our common stockwill have rights, subject to certain conditions, to require us to file registration statements covering theirshares or to include their shares in registration statements that we may file for ourselves or otherstockholders. Registration of these shares under the Securities Act, would result in the shares becomingfreely tradable without restriction under the Securities Act, except for shares held by our affiliates asdefined in Rule 144 under the Securities Act. Any sales of securities by these stockholders could have amaterial adverse effect on the trading price of our common stock.
If securities or industry analysts do not publish or cease publishing research or reports about us, our businessor our markets, or if they adversely change their recommendations or publish negative reports regarding ourbusiness or our stock, our stock price and trading volume could materially decline.
The trading market for our common stock will be influenced by the research and reports thatindustry or securities analysts may publish about us, our business, our markets or our competitors. Wedo not have any control over these analysts and we cannot provide any assurance that analysts will
54
cover us or provide favorable coverage. If any of the analysts who may cover us adversely change theirrecommendation regarding our stock, or provide more favorable relative recommendations about ourcompetitors, our stock price could materially decline. If any analyst who may cover us were to ceasecoverage of our Company or fail to regularly publish reports on us, we could lose visibility in thefinancial markets, which in turn could cause our stock price or trading volume to materially decline.
Some provisions of our charter documents and Delaware law may have anti-takeover effects that coulddiscourage an acquisition of us by others, even if an acquisition would be beneficial to our stockholders, andmay prevent attempts by our stockholders to replace or remove our current management.
Provisions in our amended and restated certificate of incorporation and our amended and restatedbylaws, as well as provisions of the Delaware General Corporation Law (the ‘‘DGCL’’), could make itmore difficult for a third party to acquire us or increase the cost of acquiring us, even if doing sowould benefit our stockholders, including transactions in which stockholders might otherwise receive apremium for their shares. These provisions include:
• establishing a classified board of directors such that not all members of the board of directorsare elected at one time;
• allowing the authorized number of our directors to be determined exclusively by resolution ofour board of directors and granting to our board of directors the sole power to fill any vacancyon the board of directors;
• limiting the ability of stockholders to remove directors without cause if the control group,consisting of AEA and certain of our other stockholders, ceases to own 50% or more of thevoting power our common stock;
• providing that our board of directors is expressly authorized to adopt, or to alter or repeal, ourbylaws;
• authorizing the issuance of ‘‘blank check’’ preferred stock by our board of directors, withoutfurther stockholder approval, to thwart a takeover attempt;
• prohibiting stockholder action by written consent (and, thus, requiring that all stockholderactions be taken at a meeting of our stockholders) if the control group, consisting of AEA andcertain of our other stockholders, ceases to own, or have the right to direct the vote of, 50% ormore of the voting power our common stock;
• eliminating the ability of stockholders to call a special meeting of stockholders, if the controlgroup, consisting of AEA and certain of our other stockholders, ceases to own, or have the rightto direct the vote of, 50% or more of the voting power our common stock;
• establishing advance notice requirements for nominations for election to the board of directorsor for proposing matters that can be acted upon at annual stockholder meetings; and
• requiring the approval of the holders of at least two-thirds of the voting power of all outstandingstock entitled to vote thereon, voting together as a single class, to amend or repeal ourcertificate of incorporation or bylaws.
In addition, while we have opted out of Section 203 of the DGCL, our amended and restatedcertificate of incorporation contains similar provisions providing that we may not engage in certain‘‘business combinations’’ with any ‘‘interested stockholder’’ for a three-year period following the timethat the stockholder became an interested stockholder, unless:
• prior to such time, our board of directors approved either the business combination or thetransaction that resulted in the stockholder becoming an interested stockholder;
55
• upon consummation of the transaction that resulted in the stockholder becoming an interestedstockholder, the interested stockholder owned at least 85% of our voting stock outstanding atthe time the transaction commenced, excluding certain shares; or
• at or subsequent to that time, the business combination is approved by our board of directorsand by the affirmative vote of holders of at least two-thirds of our outstanding voting stock thatis not owned by the interested stockholder.
These anti-takeover defenses could discourage, delay or prevent a transaction involving a change incontrol of our Company. These provisions could also discourage proxy contests and make it moredifficult for you and other stockholders to elect directors of your choosing and cause us to takecorporate actions other than those you desire. See ‘‘Description of Capital Stock.’’
Our amended and restated certificate of incorporation designates the Court of Chancery of the State ofDelaware as the exclusive forum for certain litigation that may be initiated by our stockholders, which couldlimit our stockholders’ ability to obtain a favorable judicial forum for disputes with us.
Our amended and restated certificate of incorporation provides that the Court of Chancery of theState of Delaware will be the sole and exclusive forum for (i) any derivative action or proceedingbrought on our behalf, (ii) any action asserting a claim of breach of a fiduciary duty owed to us or ourstockholders by any of our directors, officers, employees or agents, (iii) any action asserting a claimagainst us arising under the DGCL or (iv) any action asserting a claim against us that is governed bythe internal affairs doctrine. By becoming a stockholder in our Company, you will be deemed to havenotice of and have consented to the provisions of our amended and restated certificate of incorporationrelated to choice of forum. The choice of forum provision in our amended and restated certificate ofincorporation may limit our stockholders’ ability to obtain a favorable judicial forum for disputes withus.
We will be exposed to risks relating to evaluations of controls required by Section 404 of the Sarbanes-OxleyAct of 2002.
We are in the process of evaluating our internal controls systems to allow management to reporton, and our independent auditors to audit, our internal controls over financial reporting. We will beperforming the system and process evaluation and testing (and any necessary remediation) required tocomply with the management certification and the auditor attestation requirements of Section 404 ofthe Sarbanes-Oxley Act of 2002 (the ‘‘Sarbanes-Oxley Act’’). We will be required to comply withSection 404 in full (including an auditor attestation on management’s internal controls report) in ourannual report on Form 10-K for the year following our first annual report required to be filed with theSEC (subject to any change in applicable SEC rules). Furthermore, upon completion of this process, wemay identify control deficiencies of varying degrees of severity under applicable SEC and PublicCompany Accounting Oversight Board rules and regulations that remain unremediated. As a publiccompany, we will be required to report, among other things, control deficiencies that constitute a‘‘material weakness’’ or changes in internal controls that, or that are reasonably likely to, materiallyaffect internal controls over financial reporting. A ‘‘material weakness’’ is a deficiency, or acombination of deficiencies, in internal control over financial reporting, such that there is a reasonablepossibility that a material misstatement of our annual or interim financial statements will not beprevented or detected on a timely basis. A ‘‘significant deficiency’’ is a deficiency, or a combination ofdeficiencies, in internal control over financial reporting that is less severe than a material weakness, yetimportant enough to merit attention by those responsible for oversight of our financial reporting.
If we fail to implement the requirements of Section 404 in a timely manner, regulatory authoritiessuch as the SEC or the PCAOB might subject us to sanctions or investigation. If we do not implementimprovements to our disclosure controls and procedures or to our internal controls in a timely manner,
56
our independent registered public accounting firm may not be able to certify as to the effectiveness ofour internal controls over financial reporting pursuant to an audit of our controls. This may subject usto adverse regulatory consequences or a loss of confidence in the reliability of our financial statements.We could also suffer a loss of confidence in the reliability of our financial statements if ourindependent registered public accounting firm reports a material weakness in our internal controls, ifwe do not develop and maintain effective controls and procedures or if we are otherwise unable todeliver timely and reliable financial information.
Additionally, effective internal controls are necessary for us to provide reliable financial reportsand prevent fraud. Any failure to implement required new or improved controls, or difficultiesencountered in their implementation, could harm our operating results or cause us to fail to meet ourreporting obligations. Inadequate internal controls could also cause investors to lose confidence in ourreported financial information. Any loss of confidence in the reliability of our financial statements orother negative reaction to our failure to develop timely or adequate disclosure controls and proceduresor internal controls could result in a decline in the price of our common stock. In addition, if we fail toremedy any material weakness, our financial statements may be inaccurate, we may face restrictedaccess to the capital markets and our stock price may be adversely affected.
We do not currently expect to pay any cash dividends.
We currently anticipate that we will retain future earnings for the development, operation andexpansion of our business, and the continued operation and expansion of our business will requiresubstantial funding. Accordingly, we do not currently anticipate declaring or paying any cash dividendson shares of our common stock in the foreseeable future. Any determination to pay dividends in thefuture will be at the discretion of our board of directors and will depend upon results of operations,financial condition, contractual restrictions, restrictions imposed by applicable law and other factorsthat our board of directors deems relevant. We are a holding company, and substantially all of ouroperations are carried out by our operating subsidiaries. Under our Senior Secured Credit Facilities,our operating subsidiaries are currently limited in their ability to pay cash dividends, and we expectthese limitations to continue in the future. Our ability to pay dividends may also be limited by theterms of any future credit agreement or any future debt or preferred equity securities of ours or of oursubsidiaries. Accordingly, if you purchase shares in this offering, realization of a gain on yourinvestment will depend on the appreciation of the price of our common stock, which may never occur.Investors seeking cash dividends in the foreseeable future should not purchase our common stock.
The requirements of being a public company, including compliance with the reporting requirements of theExchange Act and the requirements of the Sarbanes-Oxley Act and the NYSE, may strain our resources,increase our costs and divert management’s attention, and we may be unable to comply with theserequirements in a timely or cost-effective manner.
As a public company, we will be subject to the reporting requirements of the Securities ExchangeAct of 1934, as amended (the ‘‘Exchange Act’’), and the corporate governance standards of theSarbanes-Oxley Act and the NYSE. These requirements will place a strain on our management, systemsand resources and we will incur significant legal, accounting, insurance and other expenses that we havenot incurred as a private company. The Exchange Act will require us to file annual, quarterly andcurrent reports with respect to our business and financial condition within specified time periods and toprepare a proxy statement with respect to our annual meeting of stockholders. The Sarbanes-Oxley Actwill require that we maintain effective disclosure controls and procedures and internal controls overfinancial reporting. The NYSE will require that we comply with various corporate governancerequirements. To maintain and improve the effectiveness of our disclosure controls and procedures andinternal controls over financial reporting and comply with the Exchange Act and NYSE requirements,significant resources and management oversight will be required. This may divert management’s
57
attention from other business concerns and lead to significant costs associated with compliance, whichcould have a material adverse effect on us and the price of our common stock.
The expenses incurred by public companies generally for reporting and corporate governancepurposes have been increasing. We expect these rules and regulations to increase our legal andfinancial compliance costs and to make some activities more time-consuming and costly, although weare currently unable to estimate these costs with any degree of certainty. These laws and regulationscould also make it more difficult or costly for us to obtain certain types of insurance, including directorand officer liability insurance, and we may be forced to accept reduced policy limits and coverage orincur substantially higher costs to obtain the same or similar coverage. These laws and regulationscould also make it more difficult for us to attract and retain qualified persons to serve on our board ofdirectors or its committees or as our executive officers. Advocacy efforts by stockholders and thirdparties may also prompt even more changes in governance and reporting requirements. We cannotpredict or estimate the amount of additional costs we may incur or the timing of these costs.Furthermore, if we are unable to satisfy our obligations as a public company, we could be subject todelisting of our common stock, fines, sanctions and other regulatory action and potentially civillitigation.
We may be subject to securities litigation, which is expensive and could divert management attention.
Our share price may be volatile and, in the past, companies that have experienced volatility in themarket price of their stock have been subject to securities class action litigation. We may be the targetof this type of litigation in the future. Litigation of this type could result in substantial costs anddiversion of management’s attention and resources, which could have a material adverse effect on ourbusiness, financial condition, results of operations or prospects. Any adverse determination in litigationcould also subject us to significant liabilities.
We are a ‘‘controlled company’’ within the meaning of the corporate governance standards of the NYSE and,as a result, will qualify for, and may rely on, exemptions from certain corporate governance requirements.
Following the completion of this offering, we expect to be a ‘‘controlled company’’ within themeaning of the corporate governance standards of the NYSE. A company of which more than 50% ofthe voting power is held by an individual, a group or another company is a ‘‘controlled company’’within the meaning of the corporate governance standards of the NYSE and may elect not to complywith certain corporate governance requirements of the NYSE, including:
• the requirement that a majority of our board of directors consist of independent directors;
• the requirement that we have a nominating/corporate governance committee that is composedentirely of independent directors with a written charter addressing the committee’s purpose andresponsibilities; and
• the requirement that we have a compensation committee that is composed entirely ofindependent directors with a written charter addressing the committee’s purpose andresponsibilities; and
• the requirement for an annual performance evaluation of the nominating and corporategovernance and compensation committees.
Following this offering, we intend to rely on all of the exemptions listed above. If we do utilize theexemptions, we will not have a majority of independent directors and our nominating and corporategovernance and compensation committees will not consist entirely of independent directors. As a result,our board of directors and those committees may have more directors who do not meet the NYSE’sindependence standards than they would if those standards were to apply. The independence standardsare intended to ensure that directors who meet those standards are free of any conflicting interest that
58

could influence their actions as directors. Accordingly, you will not have the same protections affordedto stockholders of companies that are subject to all of the corporate governance requirements of the
.
In addition, on June 20, 2012, the SEC adopted Rule 10C-1 under the Exchange Act to implementprovisions of the Dodd-Frank Act pertaining to compensation committee independence and the roleand disclosure of compensation consultants and other advisers to the compensation committee. Thenational securities exchanges have since adopted amendments to their existing listing standards tocomply with provisions of Rule 10C-1, and on January 11, 2013, the SEC approved such amendments.The amended listing standards require, among other things, that
• compensation committees be composed of fully independent directors, as determined pursuantto new and existing independence requirements;
• compensation committees be explicitly charged with hiring and overseeing compensationconsultants, legal counsel and other committee advisers; and
• compensation committees are required to consider, when engaging compensation consultants,legal counsel or other advisers, certain independence factors, including factors that examine therelationship between the consultant or adviser’s employer and us.
As a ‘‘controlled company,’’ we will not be subject to these compensation committee independencerequirements, and accordingly, you will not have the same protections afforded to stockholders ofcompanies that are subject to these compensation committee independence requirements.
59

CAUTIONARY NOTE REGARDING FORWARD-LOOKING STATEMENTS
This prospectus contains forward-looking statements that involve risks and uncertainties. You cangenerally identify forward-looking statements by our use of forward-looking terminology such as‘‘anticipate,’’ ‘‘believe,’’ ‘‘continue,’’ ‘‘could,’’ ‘‘estimate,’’ ‘‘expect,’’ ‘‘intend,’’ ‘‘may,’’ ‘‘might,’’ ‘‘plan,’’‘‘potential,’’ ‘‘predict,’’ ‘‘projection,’’ ‘‘seek,’’ ‘‘should,’’ ‘‘will’’ or ‘‘would’’ or the negative thereof orother variations thereon or comparable terminology. In particular, statements about the markets inwhich we operate, including growth of our various markets, and our expectations, beliefs, plans,strategies, objectives, prospects, assumptions, or future events or performance contained in thisprospectus under the headings ‘‘Prospectus Summary,’’ ‘‘Risk Factors,’’ ‘‘Management’s Discussion andAnalysis of Financial Condition and Results of Operations’’ and ‘‘Business’’ are forward-lookingstatements.
We have based these forward-looking statements on our current expectations, assumptions,estimates and projections. While we believe these expectations, assumptions, estimates and projectionsare reasonable, such forward-looking statements are only predictions and involve known and unknownrisks and uncertainties, many of which are beyond our control. These and other important factors,including those discussed in this prospectus under the headings ‘‘Prospectus Summary,’’ ‘‘Risk Factors,’’‘‘Management’s Discussion and Analysis of Financial Condition and Results of Operations’’ and‘‘Business,’’ may cause our actual results, performance or achievements to differ materially from anyfuture results, performance or achievements expressed or implied by these forward-looking statements,or could affect our share price. Some of the factors that could cause actual results to differ materiallyfrom those expressed or implied by the forward-looking statements include:
• general global economic and business conditions;
• our ability to compete successfully in our markets;
• our ability to continue to develop or acquire new products, services and solutions and adapt ourbusiness to meet the demands of our customers, comply with changes to government regulationsand achieve market acceptance with acceptable margins;
• our ability to implement our growth strategy, including acquisitions and our ability to identifysuitable acquisition targets;
• our ability to operate or integrate any acquired businesses, assets or product lines profitably orotherwise successfully implement our growth strategy;
• delays in enactment or repeals of environmental laws and regulations;
• the potential for us to become subject to claims relating to handling, storage, release or disposalof hazardous materials;
• risks associated with product defects and unanticipated or improper use of our products;
• the potential for us to incur liabilities to customers as a result of warranty claims of failure tomeet performance guarantees;
• our ability to meet our customers’ safety standards or the potential for adverse publicityaffecting our reputation as a result of incidents such as workplace accidents, mechanical failures,spills, uncontrolled discharges, damage to customer or third-party property or the transmissionof contaminants or diseases;
• litigation, regulatory or enforcement actions and reputational risk as a result of the nature ofour business or our participation in large-scale projects;
• seasonality of sales and weather conditions;
60
• risks related to government customers, including potential challenges to our governmentcontracts or our eligibility to serve government customers;
• the potential for our contracts with federal, state and local governments to be terminated oradversely modified prior to completion;
• risks related to foreign, federal, state and local environmental, health and safety laws andregulations and the costs associated therewith;
• risks associated with international sales and operations, including our operations in China;
• our ability to adequately protect our intellectual property from third-party infringement;
• our increasing dependence on the continuous and reliable operation of our informationtechnology systems;
• risks related to our substantial indebtedness;
• our need for a significant amount of cash, which depends on many factors beyond our control;
• AEA’s influence over us; and
• other risks and uncertainties, including those listed under ‘‘Risk Factors.’’
Given these risks and uncertainties, you are cautioned not to place undue reliance on suchforward-looking statements. The forward-looking statements contained in this prospectus are notguarantees of future performance and our actual results of operations, financial condition and liquidity,and the development of the industry in which we operate, may differ materially from the forward-looking statements contained in this prospectus. In addition, even if our results of operations, financialcondition and liquidity, and events in the industry in which we operate, are consistent with the forward-looking statements contained in this prospectus, they may not be predictive of results or developmentsin future periods.
Any forward-looking statement that we make in this prospectus speaks only as of the date of suchstatement. Except as required by law, we do not undertake any obligation to update or revise, or topublicly announce any update or revision to, any of the forward-looking statements, whether as a resultof new information, future events or otherwise, after the date of this prospectus.
61

USE OF PROCEEDS
We estimate that the net proceeds to us from our sale of 8,333,333 shares in this offering will beapproximately $135.4 million, based on the assumed initial public offering price of $18.00 per share,which is the midpoint of the price range set forth on the cover page of this prospectus, and afterdeducting underwriting discounts and commissions and estimated offering expenses payable by us. Wewill not receive any of the proceeds from the sale of shares of common stock by the sellingstockholders. We intend to use the net proceeds received by us in this offering to repay approximately$100.5 million of indebtedness (including accrued and unpaid interest) under the Term Loan Facilityand any remainder for general corporate purposes.
The interest rate on borrowings under the Term Loan Facility, including the October 2016Incremental Term Loans, as of June 30, 2017 was London Interbank Offered Rates(‘‘LIBOR’’) + 3.75% and the maturity date is January 15, 2021. The interest rate on borrowings underthe NB Incremental Loans as of June 30, 2017 was LIBOR + 4.50% and the maturity date isJanuary 15, 2021. We incurred the NB Incremental Loans on April 15, 2016, which provided for theborrowing of $185.0 million of incremental term loans under the Term Loan Facility to finance theNeptune-Benson Acquisition, refinance certain then-existing indebtedness of Neptune-Benson and payfees and expenses in connection with such transactions. As of August 8, 2017, the NB IncrementalLoans are no longer outstanding. We entered into the October 2016 Refinancing on October 28, 2016,to (i) borrow an additional $150.0 million of incremental term loans under the Term Loan Facility tofund our repayment in full of the Second Lien Facility and revolving credit loans then outstanding and(ii) increase commitments under the Revolving Credit Facility by $20.0 million to a total of$95.0 million. We entered into the August 2017 Refinancing on August 8, 2017 in order to (i) borrowapproximately $262.7 million of refinancing term loans, the net proceeds of which were used torefinance in their entirety the NB Incremental Loans and (ii) borrow an additional $80.0 million ofincremental term loans under the Term Loan Facility, the net proceeds of which were used to repay$60.0 million of revolving credit loans then outstanding under our Revolving Credit Facility and to payrelated fees and expenses, and for other general corporate purposes (including permitted acquisitionsand permitted investments pursuant to the First Lien Credit Agreement). Pursuant to the August 2017Refinancing, a single tranche of term loans is outstanding under the First Lien Credit Agreement, withthe same terms, including pricing terms, as the First Lien Term Facility immediately prior to theAugust 2017 Refinancing. The terms governing the NB Incremental Loans were superseded in theirentirety by the terms set forth in the August 2017 Refinancing. See ‘‘Description of CertainIndebtedness.’’
Each $1.00 increase (decrease) in the assumed initial public offering price of $18.00 per share, themidpoint of the price range set forth on the cover page of this prospectus, would increase (decrease)the net proceeds to us from this offering by approximately $7.8 million, assuming the number of sharesoffered by us, as set forth on the cover page of this prospectus, remains the same, and after deductingunderwriting discounts and commissions and estimated offering expenses payable by us. Each increase(decrease) of 1.0 million shares in the number of shares sold in this offering, as set forth on the coverpage of this prospectus, would increase (decrease) the net proceeds to us from this offering byapproximately $16.9 million, assuming the assumed initial public offering price of $18.00 per share, themidpoint of the price range set forth on the cover page of this prospectus, remains the same, and afterdeducting underwriting discounts and commissions and estimated offering expenses payable by us. Theinformation discussed above is illustrative only and will adjust based on the actual initial public offeringprice and other terms of this offering determined at pricing.
62
DIVIDEND POLICY
We do not currently expect to pay any cash dividends on our common stock for the foreseeablefuture. Instead, we intend to retain future earnings, if any, for the future operation and expansion ofour business and the repayment of indebtedness. Any determination to pay dividends in the future willbe at the discretion of our board of directors and will depend upon our results of operations, cashrequirements, financial condition, contractual restrictions, restrictions imposed by applicable laws andother factors that our board of directors may deem relevant. Our business is conducted through oursubsidiaries. Dividends from, and cash generated by, our subsidiaries will be our principal sources ofcash to repay indebtedness and fund operations. Accordingly, our ability to pay dividends to ourstockholders is dependent on the earnings and distributions of funds from our subsidiaries. In addition,the covenants in the agreements governing our existing indebtedness, including the First Lien Facilities,significantly restrict the ability of our subsidiaries to pay dividends or otherwise transfer assets to us.See ‘‘Description of Certain Indebtedness,’’ ‘‘Risk Factors—Risks Relating to our Business—We are aholding company with no operations of our own, and we depend on our subsidiaries for cash’’ and‘‘Risk Factors—Risks Relating to our Common Stock and this Offering—We do not currently expect topay any cash dividends.’’
63

CAPITALIZATION
The following table sets forth our cash and cash equivalents and our total capitalization as ofJune 30, 2017:
• on an actual basis;
• on a pro forma basis giving effect to (i) the August 2017 Refinancing; (ii) our issuance and saleof 8,333,333 shares of our common stock in this offering at an assumed initial public offeringprice of $18.00 per share, the midpoint of the price range set forth on the cover page of thisprospectus, after deducting estimated underwriting discounts and commissions and estimatedoffering expenses payable by us; and (iii) the intended use of the net proceeds received by us inthis offering to repay $100.5 million (including accrued and unpaid interest) under the TermLoan Facility and any remainder for general corporate purposes, as set forth in ‘‘Use ofProceeds.’’
You should read the data set forth below in conjunction with ‘‘Unaudited Pro Forma FinancialInformation,’’ ‘‘Selected Historical Consolidated Financial Data’’ and ‘‘Management’s Discussion andAnalysis of Financial Condition and Results of Operations’’ and our consolidated financial statementsand related notes included elsewhere in this prospectus.
As of June 30, 2017
Actual Pro Forma(1)
(unaudited)(in thousands except per
share data)
Cash and cash equivalents . . . . . . . . . . . . . . . . . . . . . . . . . . . . . . . . . . . . . $ 54,018 $ 106,546
Long-term indebtedness (including current portion):First Lien Term Loan Facility, due January 15, 2021(2) . . . . . . . . . . . . . . . . $ 636,003 $ 798,691NB Incremental Loans, due January 15, 2021(2) . . . . . . . . . . . . . . . . . . . . . 182,688 —Revolving Credit Facility(2)(3) . . . . . . . . . . . . . . . . . . . . . . . . . . . . . . . . . . 60,000 —Build Own Operate Financing, due June 30, 2024 . . . . . . . . . . . . . . . . . . . . 7,100 7,100Notes Payable, due June 30, 2018 to July 31, 2023 . . . . . . . . . . . . . . . . . . . . 7,414 7,414Unamortized discount and lender fees . . . . . . . . . . . . . . . . . . . . . . . . . . . . (19,484) (15,864)
Total debt, net of unamortized discount and lender fees . . . . . . . . . . . . . . . . 873,721 797,341
Stockholders’ equity:Common stock, par value $0.01 per share; 1,000,000 shares authorized;
105,359 shares issued and 104,990 outstanding, actual; 113,324 sharesissued and outstanding, pro forma . . . . . . . . . . . . . . . . . . . . . . . . . . . . . . 1,054 1,137
Treasury stock . . . . . . . . . . . . . . . . . . . . . . . . . . . . . . . . . . . . . . . . . . . . . . (2,209) (2,209)Additional paid-in capital . . . . . . . . . . . . . . . . . . . . . . . . . . . . . . . . . . . . . . 388,369 538,286Retained deficit . . . . . . . . . . . . . . . . . . . . . . . . . . . . . . . . . . . . . . . . . . . . . (181,067) (200,475)Accumulated other comprehensive loss, net of tax . . . . . . . . . . . . . . . . . . . . (7,898) (7,898)Non-controlling interest . . . . . . . . . . . . . . . . . . . . . . . . . . . . . . . . . . . . . . . 3,238 3,238
Total stockholders’ equity . . . . . . . . . . . . . . . . . . . . . . . . . . . . . . . . . . . . . . 201,487 332,079
Total capitalization . . . . . . . . . . . . . . . . . . . . . . . . . . . . . . . . . . . . . . . . . . . $1,075,208 $1,129,419
(1) Each $1.00 increase (decrease) in the assumed initial public offering price of $18.00 per share, themidpoint of the price range set forth on the cover page of this prospectus, would increase(decrease) each of cash and cash equivalents, additional paid-in-capital, total stockholders’ equityand total capitalization on a pro forma basis by approximately $7.8 million, assuming the number
64
of shares of common stock offered by us, as set forth on the cover page of this prospectus, remainsthe same, and after deducting underwriting discounts and commissions and estimated offeringexpenses payable by us. Each increase (decrease) of 1.0 million shares in the number of shares ofcommon stock sold in this offering, as set forth on the cover page of this prospectus, wouldincrease (decrease) each of cash and cash equivalents, additional paid-in-capital, total stockholders’equity and total capitalization on a pro forma basis by approximately $16.9 million, assuming aninitial public offering price of $18.00 per share, the midpoint of the price range set forth on thecover page of this prospectus, remains the same, and after deducting underwriting discounts andcommissions and estimated offering expenses payable by us.
(2) On August 8, 2017, we entered into the August 2017 Refinancing pursuant to which we(i) borrowed approximately $262.7 million in refinancing term loans, the net proceeds of whichwere used to refinance in their entirety the NB Incremental Loans and (ii) increased the amountof our existing Term Loan Facility by borrowing $80.0 million of additional incremental term loansunder the Term Loan Facility, the net proceeds of which were used to repay $60.0 million ofrevolving credit loans then outstanding under the Revolving Credit Facility, to pay related fees andexpenses, and for other general corporate purposes (including permitted acquisitions and permittedinvestments pursuant to the First Lien Credit Agreement).
(3) As of August 8, 2017, we had $11.0 million drawn, $7.5 million of letters of credit issued and$76.5 million available to be borrowed under the Revolving Credit Facility. The $11.0 million ofborrowings under the Revolving Credit Facility were subsequently repaid in the normal course ofbusiness prior to this offering using cash on hand, and as of October 16, 2017, we had noborrowings outstanding under the Revolving Credit Facility.
65
DILUTION
If you purchase any of the shares offered by this prospectus, you will experience dilution to theextent of the difference between the offering price per share that you pay in this offering and the nettangible book value (deficit) per share of our common stock immediately after this offering.
Our net tangible book value (deficit) as of June 30, 2017 was $(455.4) million, or $(4.34) per shareof common stock. Net tangible book value (deficit) per share is determined by dividing our net tangiblebook value (deficit), which is total tangible assets less total liabilities, by the aggregate number ofshares of common stock outstanding. Tangible assets represent total assets excluding goodwill and otherintangible assets. Dilution in net tangible book value (deficit) per share represents the differencebetween the amount per share paid by purchasers of shares of our common stock in this offering andthe pro forma net tangible book value (deficit) per share of our common stock immediately afterwards.
After giving effect to the August 2017 Refinancing, our pro forma net tangible book value (deficit)as of June 30, 2017 would have been $(458.4) million, or $(4.37) per share of common stock. Aftergiving further effect to (i) the issuance and sale by us of 8,333,333 shares of our common stock in thisoffering at an assumed initial public offering price of $18.00 per share, the midpoint of the price rangeset forth on the cover page of this prospectus, after deducting estimated underwriting discounts andcommissions and estimated offering expenses payable by us; and (ii) the intended use of the netproceeds to us from this offering to repay $100.5 million of indebtedness (including accrued and unpaidinterest) under the Term Loan Facility, as set forth in ‘‘Use of Proceeds,’’ our pro forma net tangiblebook value (deficit) as of June 30, 2017 would have been approximately $(324.9) million, or $(2.87) pershare. This represents an immediate increase in net tangible book value (deficit) of $1.50 per share toour existing stockholders and an immediate dilution of $20.87 per share to new investors purchasingshares of common stock in this offering.
The following table illustrates this dilution on a per share basis:
Assumed initial public offering price per share . . . . . . . . . . . . . . . . . . . . . . . . . . . . . $18.00Historical net tangible book value (deficit) per share . . . . . . . . . . . . . . . . . . . . . . . . $(4.34)Decrease per share attributable to August 2017 Refinancing . . . . . . . . . . . . . . . . . . . (0.03)
Pro forma net tangible book value (deficit) per share before giving effect to thisoffering . . . . . . . . . . . . . . . . . . . . . . . . . . . . . . . . . . . . . . . . . . . . . . . . . . . . . . (4.37)
Increase per share attributable to this offering . . . . . . . . . . . . . . . . . . . . . . . . . . . . . 1.50
Pro forma net tangible book value (deficit) per share after this offering . . . . . . . . . . . $ (2.87)
Dilution per share to new investors . . . . . . . . . . . . . . . . . . . . . . . . . . . . . . . . . . . . . $20.87
Each $1.00 increase (decrease) in the assumed initial offering price of $18.00 per share, themidpoint of the price range set forth on the cover page of this prospectus, would affect our nettangible book value after this offering by approximately $7.8 million, the net tangible book value pershare after this offering by $0.07 per share, and the dilution per common share to new investors by$(0.93) per share, assuming the number of shares offered by us, as set forth on the cover page of thisprospectus, remains the same, and after deducting underwriting discounts and commissions andestimated offering expenses payable by us. Each increase (decrease) of 1.0 million shares in the numberof shares sold in this offering, as set forth on the cover page of this prospectus, would affect our nettangible book value after this offering by approximately $16.9 million, the net tangible book value pershare after this offering by $0.17 per share, and the dilution per common share to new investors by$0.17 per share, assuming the assumed initial public offering price of $18.00 per share, the midpoint ofthe price range set forth on the cover page of this prospectus, remains the same, and after deductingunderwriting discounts and commissions and estimated offering expenses payable by us.
The following table summarizes, as of June 30, 2017, on an as adjusted basis, the number of sharesof common stock purchased or to be purchased from us, the total consideration paid or to be paid to
66

us and the average price per share paid or to be paid by existing stockholders and by new investorspurchasing shares of common stock from us in this offering, before deducting the underwritingdiscounts and commissions and estimated offering expenses payable by us.
Total AverageShares Purchased Consideration Price perNumber Percent Number Percent Share
Existing stockholders . . . . . . . . . . . . . . . . . 104,990,000 92.6%(1) $398,932,000 72.7% $ 3.80New investors . . . . . . . . . . . . . . . . . . . . . . 8,333,333 7.4%(1) $150,000,000 27.3% $18.00
Total . . . . . . . . . . . . . . . . . . . . . . . . . . . 113,323,333 100.0% $548,932,000 100.0% $ 4.84
(1) Sales of 19,444,444 shares of our common stock by the selling stockholders in this offering will reduce the percentage ofshares of common stock held by existing stockholders to approximately 75.5% of the total shares outstanding after thisoffering, and will increase the percentage of shares held by new investors to approximately 24.5% of the total shares ofcommon stock outstanding after this offering. Further, if the underwriters’ option to purchase additional shares from theselling stockholders is exercised in full, our existing stockholders would own approximately 71.8% and our new investorswould own approximately 28.2% of the total number of shares of our common stock outstanding after this offering
Each $1.00 increase (decrease) in the assumed initial offering price of $18.00 per share, themidpoint of the price range set forth on the cover page of this prospectus, would increase (decrease)total consideration paid by new investors, total consideration paid by all stockholders and average priceper share paid by all stockholders by $8.3 million, $8.3 million and $0.07 per share, respectively,assuming the number of shares offered by us, as set fourth on the cover page of this prospectus,remains the same. Each increase (decrease) of 1.0 million shares in the number of shares sold by us inthis offering, as set forth on the cover page of this prospectus, would increase (decrease) totalconsideration paid by new investors, total consideration paid by all stockholders and average price pershare paid by all stockholders by $18.0 million, $18.0 million and $0.12 per share, respectively, assumingthe assumed initial public offering price of $18.00 per share, the midpoint of the price range set forthon the cover page of this prospectus, remains the same.
The number of shares of our common stock to be outstanding following this offering excludes:
• 9,168,049 shares of common stock issuable upon the exercise of options outstanding under ourStock Option Plan as of October 16, 2017 at a weighted average exercise price of approximately$5.18 per share;
• 5,100,000 shares reserved for future issuance under our 2017 Equity Incentive Plan, which hasbeen approved in connection with this offering; and
• an estimated 1,406,029 shares underlying grants of stock-settled restricted stock unit awards(estimated using the initial public offering price of $18.00 per share, the midpoint of the pricerange set forth on the cover page of this prospectus) expected to be made in connection withthis offering to certain members of management, the aggregate value of which equals$25 million, with the actual number of restricted stock unit awards to be calculated based on theclosing price of our common stock on the NYSE on the first day of trading.
To the extent any options are granted and exercised in the future, there may be additionaleconomic dilution to new investors.
In addition, we may choose to raise additional capital due to market conditions or strategicconsiderations, even if we believe we have sufficient funds for our current or future operating plans. Tothe extent that we raise additional capital through the sale of equity or convertible debt securities, theissuance of these securities by us could result in further dilution to our stockholders.
67

UNAUDITED PRO FORMA FINANCIAL INFORMATION
The following unaudited pro forma condensed consolidated balance sheet as of June 30, 2017 andthe unaudited pro forma condensed consolidated statement of operations for the nine months endedJune 30, 2017 are based on our unaudited condensed consolidated interim financial statements as ofand for the nine months ended June 30, 2017. The unaudited pro forma combined statement ofoperations for the fiscal year ended September 30, 2016 is based on (i) our audited consolidatedfinancial statements for the fiscal year ended September 30, 2016 and (ii) the unaudited financial dataof Neptune-Benson for the period from October 1, 2015 through April 15, 2016.
The historical financial information has been adjusted in the unaudited pro forma financialinformation to give effect to pro forma events that are (i) directly attributable to the Transactions (asdefined below), (ii) factually supportable and (iii) with respect to the unaudited pro forma combinedand unaudited pro forma condensed consolidated statements of operations, expected to have acontinuing impact on the combined results. However, such adjustments are estimates based on certainassumptions and may not prove to be accurate. Information regarding these adjustments is subject torisks and uncertainties that could cause actual results to differ materially from our unaudited pro formafinancial information.
Our unaudited pro forma financial information and accompanying notes present the impact of thefollowing Transactions (collectively, the ‘‘Transactions’’):
• the Neptune-Benson Acquisition completed on April 15, 2016 and our entry into the NBIncremental Loans to finance the Neptune-Benson Acquisition;
• our entry into the October 2016 Refinancing and the August 2017 Refinancing; and
• the issuance and sale of our common stock in this offering after deducting estimatedunderwriting discounts and commissions and estimated offering expenses payable by us and theintended use of net proceeds received by us as described under ‘‘Use of Proceeds.’’
The unaudited pro forma financial information herein has been prepared to illustrate the effects ofthe Transactions in accordance with GAAP and pursuant to Article 11 of Regulation S-X. Theassumptions underlying the pro forma adjustments are described fully in the accompanying notes, whichshould be read in conjunction with the unaudited pro forma financial information.
The unaudited pro forma condensed consolidated balance sheet as of June 30, 2017 gives effect tothe Transactions as if they had occurred on June 30, 2017. The unaudited pro forma condensedconsolidated statement of operations for the nine months ended June 30, 2017 and the combinedstatement of operations for the fiscal year ended September 30, 2016, each give effect to theTransactions as if they had occurred on October 1, 2015. The impact of the Neptune-BensonAcquisition and our entry into the NB Incremental Loans is reflected in our historical condensedconsolidated balance sheet as of June 30, 2017 and in our historical condensed consolidated statementof operations for the nine months ended June 30, 2017. Accordingly, no corresponding pro formaadjustments have been made to the historical condensed consolidated balance sheet as of June 30, 2017or the historical condensed consolidated statement of operations for the nine months ended June 30,2017 for the Neptune-Benson Acquisition and the related financing.
The Neptune-Benson Acquisition was accounted for as a business combination using theacquisition method of accounting under the provisions of ASC Topic 805, Business Combinations(‘‘ASC 805’’), and using the fair value concepts defined in ASC Topic 820, Fair Value Measurements.Under ASC 805, all assets acquired and liabilities assumed are recorded at their acquisition date fairvalue. The determination of the fair values of the assets acquired and liabilities assumed (and therelated determination of estimated useful lives of depreciable and amortizable tangible and identifiableintangible assets) requires significant judgment and estimates. The estimates and assumptions used
68

include the projected timing and amount of future cash flows and discount rates reflecting risk inherentin the future cash flows.
In our opinion, all adjustments necessary to reflect the effects of the Transactions described in thenotes to the unaudited pro forma financial information have been included and are based uponcurrently available information and assumptions that we believe are reasonable as of the date of thisprospectus. Any of the factors underlying these estimates and assumptions may change or prove to bematerially different. The unaudited pro forma financial information also should not be consideredrepresentative of our future financial condition or results of operations.
The unaudited pro forma financial information is provided for informational and illustrativepurposes only and should be read in conjunction with our historical financial statements and thehistorical financial statements of Neptune-Benson, each of which is included elsewhere in thisprospectus, as well as the financial and other information appearing elsewhere in this prospectus,including information contained in ‘‘Risk Factors,’’ ‘‘Use of Proceeds,’’ ‘‘Capitalization,’’ ‘‘SelectedHistorical Consolidated Financial Data’’ and ‘‘Management’s Discussion and Analysis of FinancialCondition and Results of Operations.’’
69
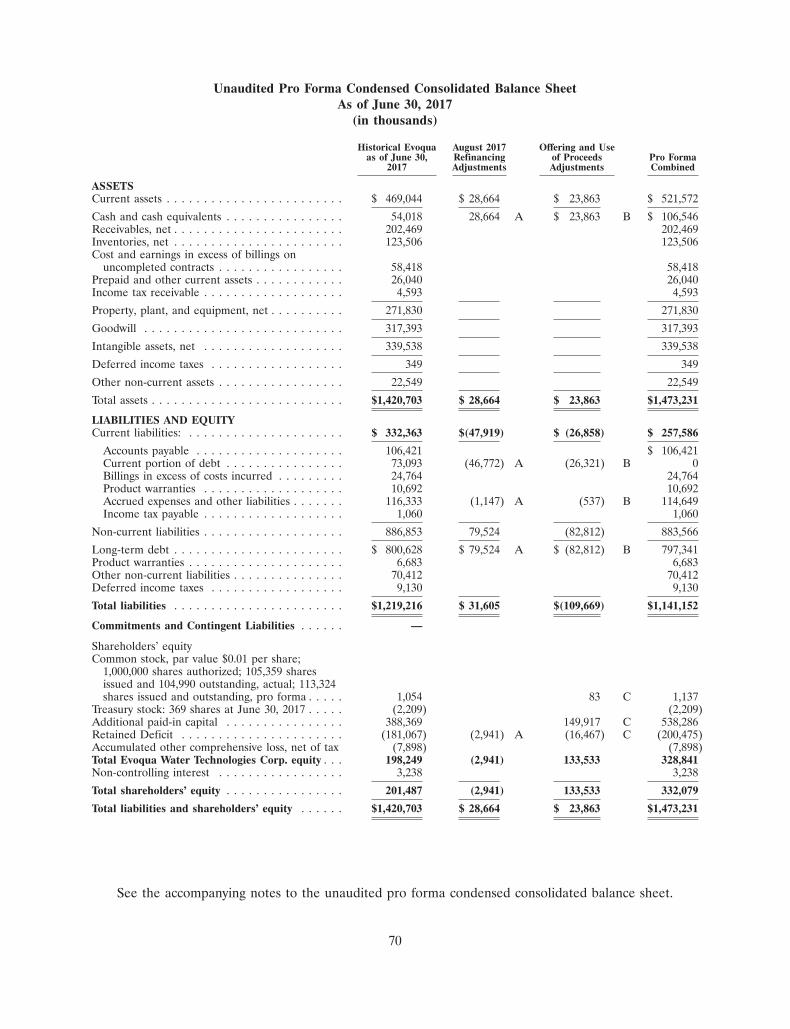
Unaudited Pro Forma Condensed Consolidated Balance SheetAs of June 30, 2017
(in thousands)
Historical Evoqua August 2017 Offering and Useas of June 30, Refinancing of Proceeds Pro Forma
2017 Adjustments Adjustments Combined
ASSETSCurrent assets . . . . . . . . . . . . . . . . . . . . . . . . $ 469,044 $ 28,664 $ 23,863 $ 521,572
Cash and cash equivalents . . . . . . . . . . . . . . . . 54,018 28,664 A $ 23,863 B $ 106,546Receivables, net . . . . . . . . . . . . . . . . . . . . . . . 202,469 202,469Inventories, net . . . . . . . . . . . . . . . . . . . . . . . 123,506 123,506Cost and earnings in excess of billings on
uncompleted contracts . . . . . . . . . . . . . . . . . 58,418 58,418Prepaid and other current assets . . . . . . . . . . . . 26,040 26,040Income tax receivable . . . . . . . . . . . . . . . . . . . 4,593 4,593
Property, plant, and equipment, net . . . . . . . . . . 271,830 271,830
Goodwill . . . . . . . . . . . . . . . . . . . . . . . . . . . 317,393 317,393
Intangible assets, net . . . . . . . . . . . . . . . . . . . 339,538 339,538
Deferred income taxes . . . . . . . . . . . . . . . . . . 349 349
Other non-current assets . . . . . . . . . . . . . . . . . 22,549 22,549
Total assets . . . . . . . . . . . . . . . . . . . . . . . . . . $1,420,703 $ 28,664 $ 23,863 $1,473,231
LIABILITIES AND EQUITYCurrent liabilities: . . . . . . . . . . . . . . . . . . . . . $ 332,363 $(47,919) $ (26,858) $ 257,586
Accounts payable . . . . . . . . . . . . . . . . . . . . 106,421 $ 106,421Current portion of debt . . . . . . . . . . . . . . . . 73,093 (46,772) A (26,321) B 0Billings in excess of costs incurred . . . . . . . . . 24,764 24,764Product warranties . . . . . . . . . . . . . . . . . . . 10,692 10,692Accrued expenses and other liabilities . . . . . . . 116,333 (1,147) A (537) B 114,649Income tax payable . . . . . . . . . . . . . . . . . . . 1,060 1,060
Non-current liabilities . . . . . . . . . . . . . . . . . . . 886,853 79,524 (82,812) 883,566
Long-term debt . . . . . . . . . . . . . . . . . . . . . . . $ 800,628 $ 79,524 A $ (82,812) B 797,341Product warranties . . . . . . . . . . . . . . . . . . . . . 6,683 6,683Other non-current liabilities . . . . . . . . . . . . . . . 70,412 70,412Deferred income taxes . . . . . . . . . . . . . . . . . . 9,130 9,130
Total liabilities . . . . . . . . . . . . . . . . . . . . . . . $1,219,216 $ 31,605 $(109,669) $1,141,152
Commitments and Contingent Liabilities . . . . . . —
Shareholders’ equityCommon stock, par value $0.01 per share;
1,000,000 shares authorized; 105,359 sharesissued and 104,990 outstanding, actual; 113,324shares issued and outstanding, pro forma . . . . . 1,054 83 C 1,137
Treasury stock: 369 shares at June 30, 2017 . . . . . (2,209) (2,209)Additional paid-in capital . . . . . . . . . . . . . . . . 388,369 149,917 C 538,286Retained Deficit . . . . . . . . . . . . . . . . . . . . . . (181,067) (2,941) A (16,467) C (200,475)Accumulated other comprehensive loss, net of tax (7,898) (7,898)Total Evoqua Water Technologies Corp. equity . . . 198,249 (2,941) 133,533 328,841Non-controlling interest . . . . . . . . . . . . . . . . . 3,238 3,238
Total shareholders’ equity . . . . . . . . . . . . . . . . 201,487 (2,941) 133,533 332,079
Total liabilities and shareholders’ equity . . . . . . $1,420,703 $ 28,664 $ 23,863 $1,473,231
See the accompanying notes to the unaudited pro forma condensed consolidated balance sheet.
70
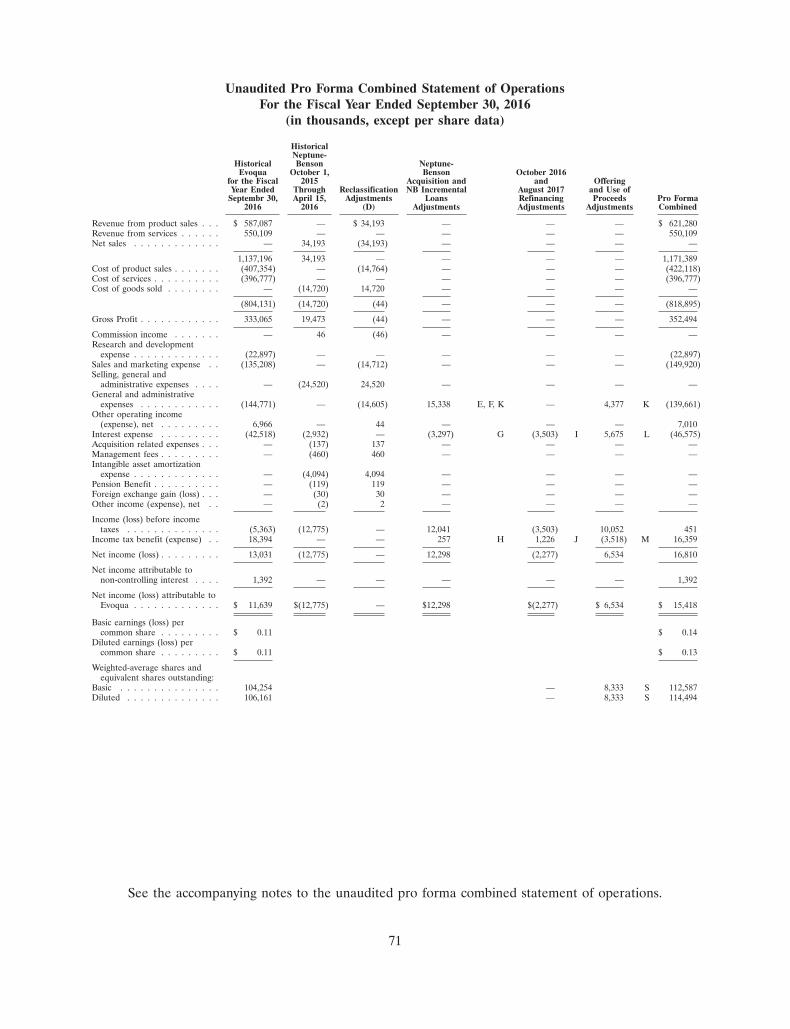
Unaudited Pro Forma Combined Statement of OperationsFor the Fiscal Year Ended September 30, 2016
(in thousands, except per share data)
HistoricalNeptune-
Historical Benson Neptune-Evoqua October 1, Benson October 2016
for the Fiscal 2015 Acquisition and and OfferingYear Ended Through Reclassification NB Incremental August 2017 and Use of
Septembr 30, April 15, Adjustments Loans Refinancing Proceeds Pro Forma2016 2016 (D) Adjustments Adjustments Adjustments Combined
Revenue from product sales . . . $ 587,087 — $ 34,193 — — — $ 621,280Revenue from services . . . . . . 550,109 — — — — — 550,109Net sales . . . . . . . . . . . . . — 34,193 (34,193) — — — —
1,137,196 34,193 — — — — 1,171,389Cost of product sales . . . . . . . (407,354) — (14,764) — — — (422,118)Cost of services . . . . . . . . . . (396,777) — — — — — (396,777)Cost of goods sold . . . . . . . . — (14,720) 14,720 — — — —
(804,131) (14,720) (44) — — — (818,895)
Gross Profit . . . . . . . . . . . . 333,065 19,473 (44) — — — 352,494
Commission income . . . . . . . — 46 (46) — — — —Research and development
expense . . . . . . . . . . . . . (22,897) — — — — — (22,897)Sales and marketing expense . . (135,208) — (14,712) — — — (149,920)Selling, general and
administrative expenses . . . . — (24,520) 24,520 — — — —General and administrative
expenses . . . . . . . . . . . . (144,771) — (14,605) 15,338 E, F, K — 4,377 K (139,661)Other operating income
(expense), net . . . . . . . . . 6,966 — 44 — — — 7,010Interest expense . . . . . . . . . (42,518) (2,932) — (3,297) G (3,503) I 5,675 L (46,575)Acquisition related expenses . . . — (137) 137 — — — —Management fees . . . . . . . . . — (460) 460 — — — —Intangible asset amortization
expense . . . . . . . . . . . . . — (4,094) 4,094 — — — —Pension Benefit . . . . . . . . . . — (119) 119 — — — —Foreign exchange gain (loss) . . . — (30) 30 — — — —Other income (expense), net . . — (2) 2 — — — —
Income (loss) before incometaxes . . . . . . . . . . . . . . (5,363) (12,775) — 12,041 (3,503) 10,052 451
Income tax benefit (expense) . . 18,394 — — 257 H 1,226 J (3,518) M 16,359
Net income (loss) . . . . . . . . . 13,031 (12,775) — 12,298 (2,277) 6,534 16,810
Net income attributable tonon-controlling interest . . . . 1,392 — — — — — 1,392
Net income (loss) attributable toEvoqua . . . . . . . . . . . . . $ 11,639 $(12,775) — $12,298 $(2,277) $ 6,534 $ 15,418
Basic earnings (loss) percommon share . . . . . . . . . $ 0.11 $ 0.14
Diluted earnings (loss) percommon share . . . . . . . . . $ 0.11 $ 0.13
Weighted-average shares andequivalent shares outstanding:
Basic . . . . . . . . . . . . . . . 104,254 — 8,333 S 112,587Diluted . . . . . . . . . . . . . . 106,161 — 8,333 S 114,494
See the accompanying notes to the unaudited pro forma combined statement of operations.
71

Unaudited Pro Forma Condensed Consolidated Statement of OperationsFor the Nine Months Ended June 30, 2017
(in thousands, except per share data)
Historical October 2016Evoqua and
Nine Months August 2017 Offering and UseEnded June 30, Refinancing of Proceeds Pro Forma
2017 Adjustments Adjustments Combined
Revenue from product sales and services . . . . $ 890,916 — $ 890,916Cost of product sales and services . . . . . . . . (614,088) — (614,088)
Gross Profit . . . . . . . . . . . . . . . . . . . . . . . . 276,828 — — 276,828
Research and development expense . . . . . . . (15,684) — (15,684)Sales and marketing expense . . . . . . . . . . . . (108,729) — (108,729)General and administrative expenses . . . . . . . (120,534) — 3,057 P (117,477)Other operating income (expense), net . . . . . 981 — 981Interest expense . . . . . . . . . . . . . . . . . . . . . (39,117) 1,324 N 4,536 Q (33,257)
Income (loss) before income taxes . . . . . . . . (6,255) 1,324 7,593 2,662Income tax benefit (expense) . . . . . . . . . . . . (295) (463) O (2,658) R (3,416)
Net income (loss) . . . . . . . . . . . . . . . . . . . . (6,550) 861 4,935 (754)
Net income attributable to non-controllinginterest . . . . . . . . . . . . . . . . . . . . . . . . . . 2,348 — — 2,348
Net income (loss) attributable to Evoqua . . . $ (8,898) $ 861 $ 4,935 $ (3,102)Income (loss) per share:Basic . . . . . . . . . . . . . . . . . . . . . . . . . . . . . $ (0.08) $ (0.03)Diluted . . . . . . . . . . . . . . . . . . . . . . . . . . . $ (0.08) $ (0.03)
Weighted-average shares and equivalentshares outstanding:
Basic . . . . . . . . . . . . . . . . . . . . . . . . . . . . . 104,821 — 8,333 S 113,154Diluted . . . . . . . . . . . . . . . . . . . . . . . . . . . 104,821 — 8,333 S 113,154
See the accompanying notes to the unaudited pro forma condensed consolidated statement ofoperations.
72

Notes to the Unaudited Pro Forma Financial Information
Description of Transactions
On April 15, 2016, EWT Holdings III Corp., our wholly owned subsidiary, acquired 100% ofprivately held Neptune-Benson, a leading manufacturer of high-quality water filtration and disinfectionproducts for the recreational, industrial and municipal water markets, for total consideration of$283.7 million, less cash received of $2.4 million, of which $185.0 million was funded through the entryinto the NB Incremental Loans, $9.0 million was in the form of shares of the Company provided to thesellers, and the remaining was paid with available cash.
The following summarizes the aggregate consideration paid for Neptune-Benson (in thousands):
Cash consideration . . . . . . . . . . . . . . . . . . . . . . . . . . . . . . . . . . . . . . . . $274,754Registrant shares issued . . . . . . . . . . . . . . . . . . . . . . . . . . . . . . . . . . . . . 8,950
Total . . . . . . . . . . . . . . . . . . . . . . . . . . . . . . . . . . . . . . . . . . . . . . . $283,704
We have accounted for the Neptune-Benson Acquisition under the acquisition method ofaccounting in accordance with the authoritative guidance on business combinations under the provisionsof ASC 805. The major assets acquired and liabilities assumed from Neptune-Benson and theirestimated acquisition date fair values are set forth below (in thousands):
Current assets . . . . . . . . . . . . . . . . . . . . . . . . . . . . . . . . . . . . . . . . . . . . $ 29,521Property, plant and equipment . . . . . . . . . . . . . . . . . . . . . . . . . . . . . . . . 2,480Goodwill . . . . . . . . . . . . . . . . . . . . . . . . . . . . . . . . . . . . . . . . . . . . . . . . 143,680Other intangible assets . . . . . . . . . . . . . . . . . . . . . . . . . . . . . . . . . . . . . . 149,127Other noncurrent assets . . . . . . . . . . . . . . . . . . . . . . . . . . . . . . . . . . . . . 3,576
Total assets acquired . . . . . . . . . . . . . . . . . . . . . . . . . . . . . . . . . . . . $328,384Total liabilities assumed . . . . . . . . . . . . . . . . . . . . . . . . . . . . . . . . . . (44,680)
Net assets acquired . . . . . . . . . . . . . . . . . . . . . . . . . . . . . . . . . . . . . $283,704
On October 28, 2016, we entered into the October 2016 Refinancing, in which we increased theamount of our existing Term Loan Facility by borrowing $150.0 million of additional October 2016Incremental Term Loans under the First Lien Facilities pursuant to an incremental amendment to theFirst Lien Credit Agreement. The net proceeds of the October 2016 Incremental Term Loans wereused, among other things, to repay all amounts then-outstanding under the Second Lien CreditAgreement (the ‘‘Second Lien Repayment’’) and all loans then outstanding under the Revolving CreditFacility (without permanent reduction of commitments thereunder), to pay fees and expenses inconnection with the transactions thereunder, and for working capital, capital expenditures and othergeneral corporate purposes. We refer to the First Lien Facilities and, until the Second Lien Repayment,the Second Lien Facility, collectively as the ‘‘Senior Secured Credit Facilities.’’ We also upsizedcommitments under our existing Revolving Credit Facility by $20.0 million to a total of $95.0 million.
On August 8, 2017, we entered into the August 2017 Refinancing, in which we increased theamount of our existing Term Loan Facility by borrowing $262.7 million of additional incremental termloans under the First Lien Facilities, pursuant to an incremental amendment to the credit agreementgoverning the existing Term Loan Facility. The net proceeds were used to repay all loans thenoutstanding under the NB Incremental Loans, $60.0 million of revolving credit loans then outstandingunder the Revolving Credit Facility and to pay related fees and expenses, and for working capital,capital expenditures and other general corporate purposes.
The initial public offering of shares herein includes the sale of 8,333,333 shares of common stockby us in this offering at the initial public offering price of $18.00 per share, the midpoint of the price
73
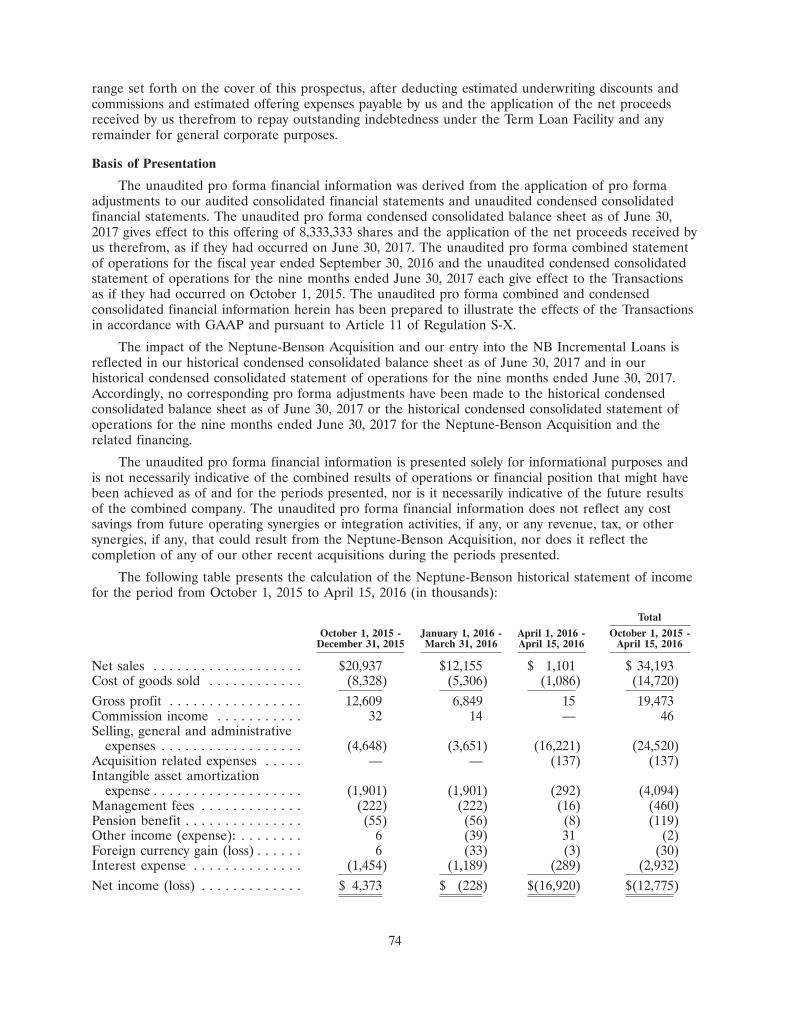
range set forth on the cover of this prospectus, after deducting estimated underwriting discounts andcommissions and estimated offering expenses payable by us and the application of the net proceedsreceived by us therefrom to repay outstanding indebtedness under the Term Loan Facility and anyremainder for general corporate purposes.
Basis of Presentation
The unaudited pro forma financial information was derived from the application of pro formaadjustments to our audited consolidated financial statements and unaudited condensed consolidatedfinancial statements. The unaudited pro forma condensed consolidated balance sheet as of June 30,2017 gives effect to this offering of 8,333,333 shares and the application of the net proceeds received byus therefrom, as if they had occurred on June 30, 2017. The unaudited pro forma combined statementof operations for the fiscal year ended September 30, 2016 and the unaudited condensed consolidatedstatement of operations for the nine months ended June 30, 2017 each give effect to the Transactionsas if they had occurred on October 1, 2015. The unaudited pro forma combined and condensedconsolidated financial information herein has been prepared to illustrate the effects of the Transactionsin accordance with GAAP and pursuant to Article 11 of Regulation S-X.
The impact of the Neptune-Benson Acquisition and our entry into the NB Incremental Loans isreflected in our historical condensed consolidated balance sheet as of June 30, 2017 and in ourhistorical condensed consolidated statement of operations for the nine months ended June 30, 2017.Accordingly, no corresponding pro forma adjustments have been made to the historical condensedconsolidated balance sheet as of June 30, 2017 or the historical condensed consolidated statement ofoperations for the nine months ended June 30, 2017 for the Neptune-Benson Acquisition and therelated financing.
The unaudited pro forma financial information is presented solely for informational purposes andis not necessarily indicative of the combined results of operations or financial position that might havebeen achieved as of and for the periods presented, nor is it necessarily indicative of the future resultsof the combined company. The unaudited pro forma financial information does not reflect any costsavings from future operating synergies or integration activities, if any, or any revenue, tax, or othersynergies, if any, that could result from the Neptune-Benson Acquisition, nor does it reflect thecompletion of any of our other recent acquisitions during the periods presented.
The following table presents the calculation of the Neptune-Benson historical statement of incomefor the period from October 1, 2015 to April 15, 2016 (in thousands):
Total
October 1, 2015 - January 1, 2016 - April 1, 2016 - October 1, 2015 -December 31, 2015 March 31, 2016 April 15, 2016 April 15, 2016
Net sales . . . . . . . . . . . . . . . . . . . $20,937 $12,155 $ 1,101 $ 34,193Cost of goods sold . . . . . . . . . . . . (8,328) (5,306) (1,086) (14,720)Gross profit . . . . . . . . . . . . . . . . . 12,609 6,849 15 19,473Commission income . . . . . . . . . . . 32 14 — 46Selling, general and administrative
expenses . . . . . . . . . . . . . . . . . . (4,648) (3,651) (16,221) (24,520)Acquisition related expenses . . . . . — — (137) (137)Intangible asset amortization
expense . . . . . . . . . . . . . . . . . . . (1,901) (1,901) (292) (4,094)Management fees . . . . . . . . . . . . . (222) (222) (16) (460)Pension benefit . . . . . . . . . . . . . . . (55) (56) (8) (119)Other income (expense): . . . . . . . . 6 (39) 31 (2)Foreign currency gain (loss) . . . . . . 6 (33) (3) (30)Interest expense . . . . . . . . . . . . . . (1,454) (1,189) (289) (2,932)Net income (loss) . . . . . . . . . . . . . $ 4,373 $ (228) $(16,920) $(12,775)
74
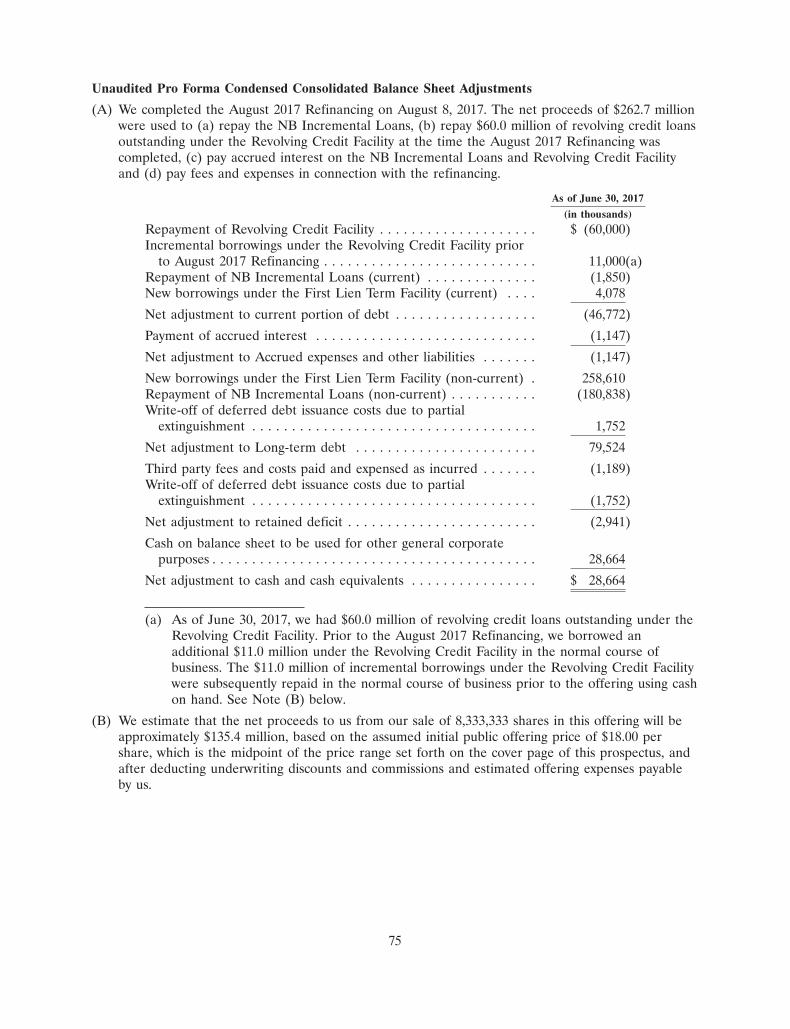
Unaudited Pro Forma Condensed Consolidated Balance Sheet Adjustments
(A) We completed the August 2017 Refinancing on August 8, 2017. The net proceeds of $262.7 millionwere used to (a) repay the NB Incremental Loans, (b) repay $60.0 million of revolving credit loansoutstanding under the Revolving Credit Facility at the time the August 2017 Refinancing wascompleted, (c) pay accrued interest on the NB Incremental Loans and Revolving Credit Facilityand (d) pay fees and expenses in connection with the refinancing.
As of June 30, 2017
(in thousands)
Repayment of Revolving Credit Facility . . . . . . . . . . . . . . . . . . . . $ (60,000)Incremental borrowings under the Revolving Credit Facility prior
to August 2017 Refinancing . . . . . . . . . . . . . . . . . . . . . . . . . . . 11,000(a)Repayment of NB Incremental Loans (current) . . . . . . . . . . . . . . (1,850)New borrowings under the First Lien Term Facility (current) . . . . 4,078
Net adjustment to current portion of debt . . . . . . . . . . . . . . . . . . (46,772)
Payment of accrued interest . . . . . . . . . . . . . . . . . . . . . . . . . . . . (1,147)
Net adjustment to Accrued expenses and other liabilities . . . . . . . (1,147)
New borrowings under the First Lien Term Facility (non-current) . 258,610Repayment of NB Incremental Loans (non-current) . . . . . . . . . . . (180,838)Write-off of deferred debt issuance costs due to partial
extinguishment . . . . . . . . . . . . . . . . . . . . . . . . . . . . . . . . . . . . 1,752
Net adjustment to Long-term debt . . . . . . . . . . . . . . . . . . . . . . . 79,524
Third party fees and costs paid and expensed as incurred . . . . . . . (1,189)Write-off of deferred debt issuance costs due to partial
extinguishment . . . . . . . . . . . . . . . . . . . . . . . . . . . . . . . . . . . . (1,752)
Net adjustment to retained deficit . . . . . . . . . . . . . . . . . . . . . . . . (2,941)
Cash on balance sheet to be used for other general corporatepurposes . . . . . . . . . . . . . . . . . . . . . . . . . . . . . . . . . . . . . . . . . 28,664
Net adjustment to cash and cash equivalents . . . . . . . . . . . . . . . . $ 28,664
(a) As of June 30, 2017, we had $60.0 million of revolving credit loans outstanding under theRevolving Credit Facility. Prior to the August 2017 Refinancing, we borrowed anadditional $11.0 million under the Revolving Credit Facility in the normal course ofbusiness. The $11.0 million of incremental borrowings under the Revolving Credit Facilitywere subsequently repaid in the normal course of business prior to the offering using cashon hand. See Note (B) below.
(B) We estimate that the net proceeds to us from our sale of 8,333,333 shares in this offering will beapproximately $135.4 million, based on the assumed initial public offering price of $18.00 pershare, which is the midpoint of the price range set forth on the cover page of this prospectus, andafter deducting underwriting discounts and commissions and estimated offering expenses payableby us.
75
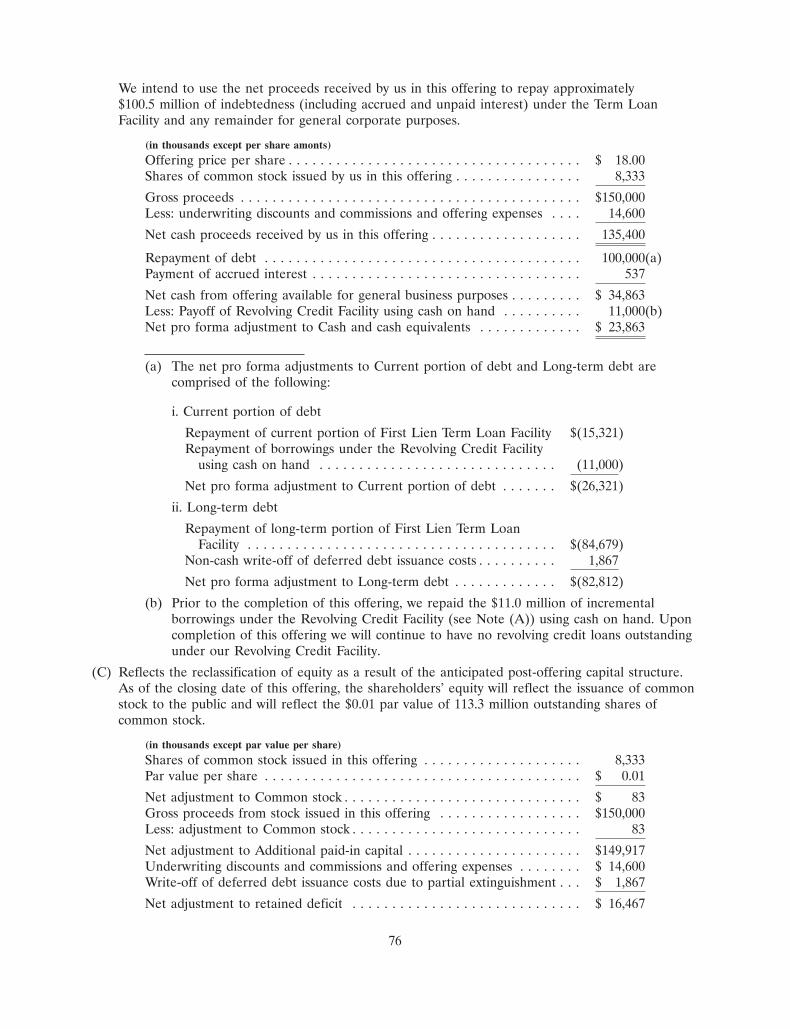
We intend to use the net proceeds received by us in this offering to repay approximately$100.5 million of indebtedness (including accrued and unpaid interest) under the Term LoanFacility and any remainder for general corporate purposes.
(in thousands except per share amonts)
Offering price per share . . . . . . . . . . . . . . . . . . . . . . . . . . . . . . . . . . . . . $ 18.00Shares of common stock issued by us in this offering . . . . . . . . . . . . . . . . 8,333
Gross proceeds . . . . . . . . . . . . . . . . . . . . . . . . . . . . . . . . . . . . . . . . . . . $150,000Less: underwriting discounts and commissions and offering expenses . . . . 14,600
Net cash proceeds received by us in this offering . . . . . . . . . . . . . . . . . . . 135,400
Repayment of debt . . . . . . . . . . . . . . . . . . . . . . . . . . . . . . . . . . . . . . . . 100,000(a)Payment of accrued interest . . . . . . . . . . . . . . . . . . . . . . . . . . . . . . . . . . 537
Net cash from offering available for general business purposes . . . . . . . . . $ 34,863Less: Payoff of Revolving Credit Facility using cash on hand . . . . . . . . . . 11,000(b)Net pro forma adjustment to Cash and cash equivalents . . . . . . . . . . . . . $ 23,863
(a) The net pro forma adjustments to Current portion of debt and Long-term debt arecomprised of the following:
i. Current portion of debt
Repayment of current portion of First Lien Term Loan Facility $(15,321)Repayment of borrowings under the Revolving Credit Facility
using cash on hand . . . . . . . . . . . . . . . . . . . . . . . . . . . . . . (11,000)
Net pro forma adjustment to Current portion of debt . . . . . . . $(26,321)
ii. Long-term debt
Repayment of long-term portion of First Lien Term LoanFacility . . . . . . . . . . . . . . . . . . . . . . . . . . . . . . . . . . . . . . . $(84,679)
Non-cash write-off of deferred debt issuance costs . . . . . . . . . . 1,867
Net pro forma adjustment to Long-term debt . . . . . . . . . . . . . $(82,812)
(b) Prior to the completion of this offering, we repaid the $11.0 million of incrementalborrowings under the Revolving Credit Facility (see Note (A)) using cash on hand. Uponcompletion of this offering we will continue to have no revolving credit loans outstandingunder our Revolving Credit Facility.
(C) Reflects the reclassification of equity as a result of the anticipated post-offering capital structure.As of the closing date of this offering, the shareholders’ equity will reflect the issuance of commonstock to the public and will reflect the $0.01 par value of 113.3 million outstanding shares ofcommon stock.
(in thousands except par value per share)
Shares of common stock issued in this offering . . . . . . . . . . . . . . . . . . . . 8,333Par value per share . . . . . . . . . . . . . . . . . . . . . . . . . . . . . . . . . . . . . . . . $ 0.01
Net adjustment to Common stock . . . . . . . . . . . . . . . . . . . . . . . . . . . . . . $ 83Gross proceeds from stock issued in this offering . . . . . . . . . . . . . . . . . . $150,000Less: adjustment to Common stock . . . . . . . . . . . . . . . . . . . . . . . . . . . . . 83
Net adjustment to Additional paid-in capital . . . . . . . . . . . . . . . . . . . . . . $149,917Underwriting discounts and commissions and offering expenses . . . . . . . . $ 14,600Write-off of deferred debt issuance costs due to partial extinguishment . . . $ 1,867
Net adjustment to retained deficit . . . . . . . . . . . . . . . . . . . . . . . . . . . . . $ 16,467
76

Unaudited Pro Forma Combined Statement of Operations for the Fiscal Year Ended September 30,2016
(D) Certain reclassification adjustments have been made to the Neptune-Benson historical financialstatements to conform to the Company’s presentation (in thousands):
Amount Reclassification description
$34,193 From ‘‘Net sales’’ to ‘‘Revenue from product sales’’14,720 From ‘‘Cost of goods sold’’ to Cost of product sales’’
44 From ‘‘Pension Benefit’’ to ‘‘Cost of product sales’’14,712 From ‘‘Selling, general and administrative expenses’’ to ‘‘Sales and
marketing expense’’9,809 From ‘‘Selling, general and administrative expenses’’ to ‘‘General and
administrative expenses’’137 From ‘‘Acquisition related expenses’’ to ‘‘General and administrative
expenses’’460 From ‘‘Management fees’’ to ‘‘General and administrative expenses’’
4,094 From ‘‘Intangible asset amortization expense’’ to ‘‘General andadministrative expenses’’
75 From ‘‘Pension Benefit’’ to ‘‘General and administrative expenses’’30 From ‘‘Foreign currency (gain) loss’’ to ‘‘General and administrative
expenses’’2 From ‘‘Other income (expense), net’’ to ‘‘Other operating income’’
46 From ‘‘Commission income’’ to ‘‘Other operating income’’
(E) Represents the elimination of historical Neptune-Benson intangible asset amortization expense forthe period from October 1, 2015 through April 15, 2016 of $4.1 million and the recognition of proforma intangible asset amortization expense for the same period of $4.5 million on the portion ofthe purchase price allocated to definite-lived intangible assets as follows (in thousands):
AnnualPreliminary Estimated Useful AmortizationFair Value Life (years) Expense
Trade Name . . . . . . . . . . . . . . . . . . . . . . . $ 10,760 15 $ 717Technology . . . . . . . . . . . . . . . . . . . . . . . . 8,230 10 823Non Compete . . . . . . . . . . . . . . . . . . . . . . 200 1 200Customer Relationships . . . . . . . . . . . . . . . 129,930 20 6,497Favorable Lease . . . . . . . . . . . . . . . . . . . . 7 5 1
Total . . . . . . . . . . . . . . . . . . . . . . . . . . . . $149,127 $8,238
Calculated amortization 10/1/15 to 4/15/16 . . . . . . . . . . . . . . . . . . . . . . 4,462
Less: Historical amortization for period from 10/1/15 - 4/15/16 . . . . . . . . 4,094
Net adjustment to general and administrative expenses . . . . . . . . . . . . . $ 368
Amortization expense has been calculated using the straight-line method over the estimated usefullife.
(F) Reflects the elimination of $15.2 million of direct, incremental transaction costs incurred by us andNeptune-Benson related to the Neptune-Benson Acquisition that are reflected in the historicalstatement of operations. The impact of these direct, incremental transaction costs already incurredhave been eliminated in the unaudited pro forma combined statement of operations because thesecosts are nonrecurring in nature. These charges include financial advisory fees, legal, accountingand other professional fees incurred by us and Neptune-Benson that are directly related to theNeptune-Benson Acquisition.
77

(G) We borrowed an additional $185.0 million to finance the Neptune-Benson Acquisition, includingthe repayment of Neptune-Benson historical outstanding indebtedness. This adjustment representsthe net incremental interest expense of $3.3 million for the period from October 1, 2015 toApril 15, 2016 based on a variable rate subject to a 1% floor plus a 4.5% spread (5.5% as ofSeptember 30, 2016). If the interest rate differed from the rates used in the pro forma interestexpense by 0.125% for the fiscal year ended September 30, 2016, interest expense would haveincreased or decreased by approximately $0.2 million for the fiscal year ended September 30, 2016.
The following summarizes the pro forma adjustment for interest expense (in thousands):
For the Period FromOctober 1, 2015
ThroughApril 15, 2016
Elimination of historical Neptune-Benson interest expense ondebt repaid upon the Neptune-Benson Acquisition . . . . . . . . . . $(2,932)
Interest expense related to the NB Incremental Loans . . . . . . . . . 5,511Amortization of deferred financing costs and debt discount
related to the NB Incremental Loans . . . . . . . . . . . . . . . . . . . . 718
Net adjustment to interest expense . . . . . . . . . . . . . . . . . . . . . . . $ 3,297
(H) Represents the income tax effect for the unaudited pro forma combined statement of operationsadjustments related to the Neptune-Benson Acquisition and our entry into the NB IncrementalLoans calculated using the United Stated federal statutory tax rate of 35%. Because theadjustments contained in this unaudited pro forma combined financial information are based onestimates, the effective tax rate will likely vary from the effective rate in periods subsequent to theNeptune-Benson Acquisition.
As Neptune-Benson was historically a pass-through entity for tax purposes, the pro formaadjustment herein includes application of the U.S. federal statutory tax rate of 35% to thehistorical net loss of Neptune-Benson, resulting in a tax benefit of $4.5 million for the period fromOctober 1, 2015 through April 15, 2016 for pro forma purposes. See the table below for a breakout of the adjustment due to the historical tax structure of Neptune-Benson and due to theNeptune-Benson Acquisition and NB Incremental Loans adjustments (in thousands):
Historical Neptune-Benson net loss . . . . . . . . . . . . . . . . . . . . . . . . . . . . . $(12,775)U.S. federal statutory tax rate . . . . . . . . . . . . . . . . . . . . . . . . . . . . . . . . . 35%Pro forma income tax benefit . . . . . . . . . . . . . . . . . . . . . . . . . . . . . . . . . (4,471)Neptune-Benson Acquisition and NB Incremental Loan adjustments . . . . . 12,041U.S. federal statutory tax rate . . . . . . . . . . . . . . . . . . . . . . . . . . . . . . . . . 35%Pro forma income tax expense . . . . . . . . . . . . . . . . . . . . . . . . . . . . . . . . 4,214Net income tax provision adjustment . . . . . . . . . . . . . . . . . . . . . . . . . . . . $ (257)
(I) We completed the October 2016 Refinancing on October 28, 2016. The net proceeds of $150.0 millionwere used to repay $33.0 million outstanding on the Revolving Credit Facility, as well as to extinguishthe $75.0 million Second Lien Facility. Subsequently, we also completed the August 2017 Refinancingon August 8, 2017. The net proceeds of $262.7 million were used to repay the $182.7 millionremaining on the NB Incremental Loans and $60.0 million of revolving credit loans outstanding on theRevolving Credit Facility at the time the August 2017 Refinancing was completed.
The net adjustment represents incremental interest expense of $3.5 million based on the applicableinterest rates for each tranche of debt repaid or issued in the October 2016 Refinancing and theAugust 2017 Refinancing, plus the incremental interest expense related to deferred refinancingcosts incurred and the impact of commitment fees owed on the upsized Revolving Credit Facility,
78

in accordance with the terms of the credit agreement. If the interest rate differed from the ratesused in the pro forma interest expense by 0.125% for the fiscal year ended September 30, 2016,interest expense would have increased or decreased by approximately $0.5 million for the fiscalyear ended September 30, 2016.
For the Fiscal Year EndedSeptember 30, 2016
(in thousands)
Elimination of interest expense on Second Lien Facility . . . . . (6,862)Elimination of interest expense on NB Incremental Loans . . . (10,253)(a)Elimination of interest expense on Revolving Credit Facility . . (384)Interest expense related to new indebtedness incurred under
the October 2016 Refinancing . . . . . . . . . . . . . . . . . . . . . . 7,125Interest expense related to new indebtedness incurred under
the August 2017 Refinancing . . . . . . . . . . . . . . . . . . . . . . 12,478Interest expense on incremental borrowings under the
Revolving Credit Facility prior to the August 2017Refinancing . . . . . . . . . . . . . . . . . . . . . . . . . . . . . . . . . . . 513
Deferred refinancing cost, debt discount amortization expenseand commitment fee costs related to the new indebtednessincurred under the October 2016 Refinancing andAugust 2017 Refinancing . . . . . . . . . . . . . . . . . . . . . . . . . 886
Net adjustment to interest expense . . . . . . . . . . . . . . . . . . . . $ 3,503
(a) The elimination of interest expense on the NB Incremental Loans consisted of$5.5 million of pro forma interest expense (see footnote G) and $4.7 million of historicalinterest expense incurred for the period of April 16, 2016 through September 30, 2016.
(J) Represents the income tax effect of the pro forma adjustments related to the October 2016Refinancing and August 2017 Refinancing calculated using the U.S. federal statutory tax rate of35%. Because the adjustments contained in this unaudited pro forma combined financialinformation are based on estimates, the effective tax rate will likely vary from the effective rate insubsequent periods.
(K) Included in Neptune-Benson’s consolidated results for the period from October 1, 2015 throughApril 15, 2016 are fees incurred by Neptune-Benson under a management services agreement withthe majority investor in Neptune-Benson’s former parent entity. This agreement was terminatedupon the consummation of the Neptune-Benson Acquisition. The adjustment eliminates the feesrecognized in Neptune-Benson’s unaudited historical financial data. The adjustment to general andadministrative expenses was $0.5 million for the period from October 1, 2015 through April 15,2016.
Included in our consolidated results are fees incurred by us under the management agreement withAEA. This agreement will terminate pursuant to its terms upon the consummation of this offering.The adjustment eliminates the amount of fees recognized in our historical consolidated financialstatements. The adjustment to general and administrative expenses was $4.4 million for the fiscalyear ended September 30, 2016. See ‘‘Certain Relationships and Related Party Transactions’’ andNote 18 to our audited financial statements included elsewhere in this prospectus for furtherdetail.
(L) This adjustment represents reduction of interest expense related to this offering and the use ofproceeds therefrom for the fiscal year ended September 30, 2016. We intend to use the netproceeds received by us in this offering to repay approximately $100.5 million of indebtedness(including accrued and unpaid interest) under the Term Loan Facility and any remainder forgeneral corporate purposes.
79
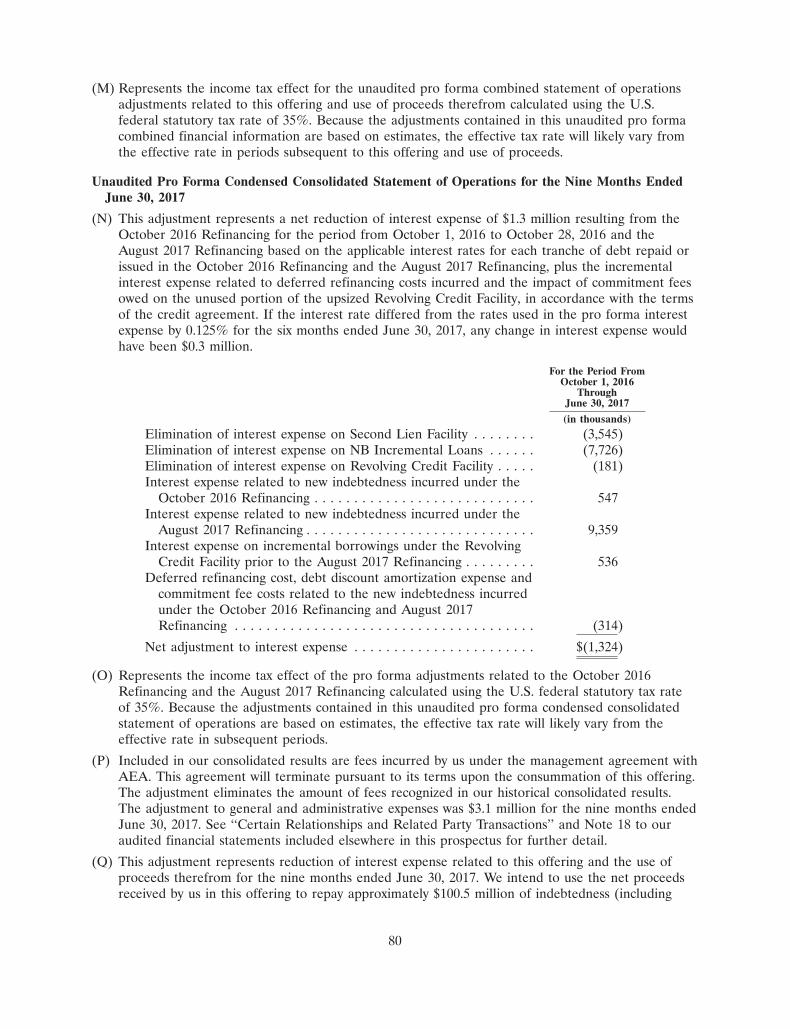
(M) Represents the income tax effect for the unaudited pro forma combined statement of operationsadjustments related to this offering and use of proceeds therefrom calculated using the U.S.federal statutory tax rate of 35%. Because the adjustments contained in this unaudited pro formacombined financial information are based on estimates, the effective tax rate will likely vary fromthe effective rate in periods subsequent to this offering and use of proceeds.
Unaudited Pro Forma Condensed Consolidated Statement of Operations for the Nine Months EndedJune 30, 2017
(N) This adjustment represents a net reduction of interest expense of $1.3 million resulting from theOctober 2016 Refinancing for the period from October 1, 2016 to October 28, 2016 and theAugust 2017 Refinancing based on the applicable interest rates for each tranche of debt repaid orissued in the October 2016 Refinancing and the August 2017 Refinancing, plus the incrementalinterest expense related to deferred refinancing costs incurred and the impact of commitment feesowed on the unused portion of the upsized Revolving Credit Facility, in accordance with the termsof the credit agreement. If the interest rate differed from the rates used in the pro forma interestexpense by 0.125% for the six months ended June 30, 2017, any change in interest expense wouldhave been $0.3 million.
For the Period FromOctober 1, 2016
ThroughJune 30, 2017
(in thousands)
Elimination of interest expense on Second Lien Facility . . . . . . . . (3,545)Elimination of interest expense on NB Incremental Loans . . . . . . (7,726)Elimination of interest expense on Revolving Credit Facility . . . . . (181)Interest expense related to new indebtedness incurred under the
October 2016 Refinancing . . . . . . . . . . . . . . . . . . . . . . . . . . . . 547Interest expense related to new indebtedness incurred under the
August 2017 Refinancing . . . . . . . . . . . . . . . . . . . . . . . . . . . . . 9,359Interest expense on incremental borrowings under the Revolving
Credit Facility prior to the August 2017 Refinancing . . . . . . . . . 536Deferred refinancing cost, debt discount amortization expense and
commitment fee costs related to the new indebtedness incurredunder the October 2016 Refinancing and August 2017Refinancing . . . . . . . . . . . . . . . . . . . . . . . . . . . . . . . . . . . . . . (314)
Net adjustment to interest expense . . . . . . . . . . . . . . . . . . . . . . . $(1,324)
(O) Represents the income tax effect of the pro forma adjustments related to the October 2016Refinancing and the August 2017 Refinancing calculated using the U.S. federal statutory tax rateof 35%. Because the adjustments contained in this unaudited pro forma condensed consolidatedstatement of operations are based on estimates, the effective tax rate will likely vary from theeffective rate in subsequent periods.
(P) Included in our consolidated results are fees incurred by us under the management agreement withAEA. This agreement will terminate pursuant to its terms upon the consummation of this offering.The adjustment eliminates the amount of fees recognized in our historical consolidated results.The adjustment to general and administrative expenses was $3.1 million for the nine months endedJune 30, 2017. See ‘‘Certain Relationships and Related Party Transactions’’ and Note 18 to ouraudited financial statements included elsewhere in this prospectus for further detail.
(Q) This adjustment represents reduction of interest expense related to this offering and the use ofproceeds therefrom for the nine months ended June 30, 2017. We intend to use the net proceedsreceived by us in this offering to repay approximately $100.5 million of indebtedness (including
80
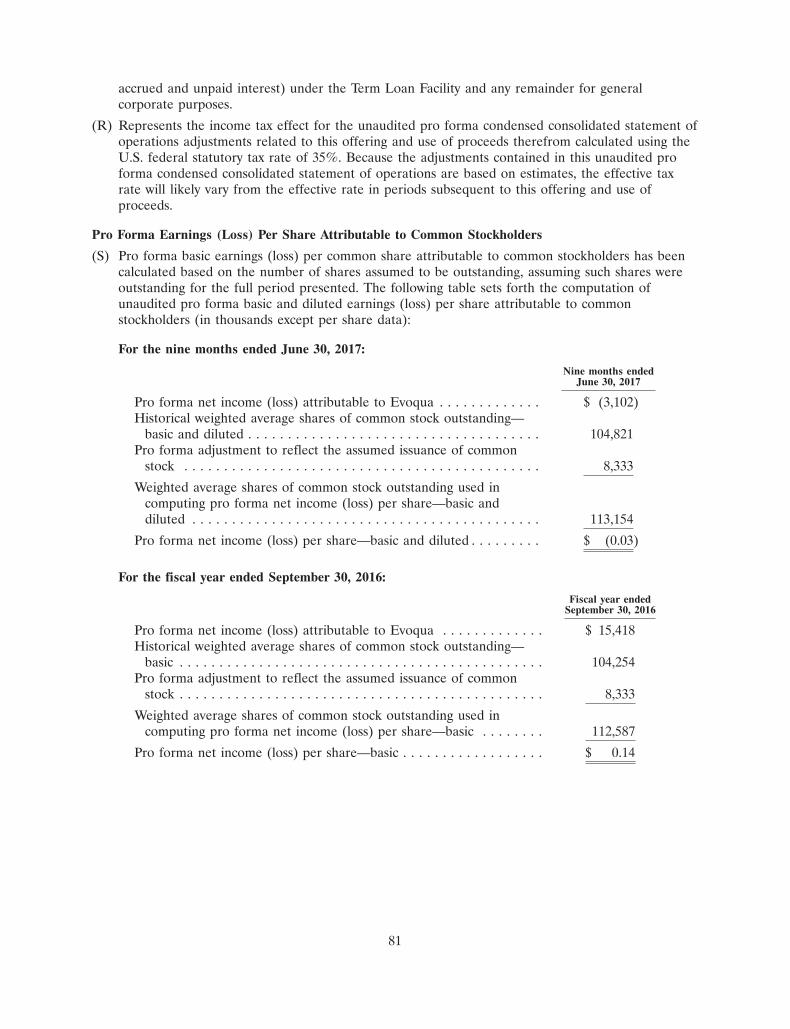
accrued and unpaid interest) under the Term Loan Facility and any remainder for generalcorporate purposes.
(R) Represents the income tax effect for the unaudited pro forma condensed consolidated statement ofoperations adjustments related to this offering and use of proceeds therefrom calculated using theU.S. federal statutory tax rate of 35%. Because the adjustments contained in this unaudited proforma condensed consolidated statement of operations are based on estimates, the effective taxrate will likely vary from the effective rate in periods subsequent to this offering and use ofproceeds.
Pro Forma Earnings (Loss) Per Share Attributable to Common Stockholders
(S) Pro forma basic earnings (loss) per common share attributable to common stockholders has beencalculated based on the number of shares assumed to be outstanding, assuming such shares wereoutstanding for the full period presented. The following table sets forth the computation ofunaudited pro forma basic and diluted earnings (loss) per share attributable to commonstockholders (in thousands except per share data):
For the nine months ended June 30, 2017:
Nine months endedJune 30, 2017
Pro forma net income (loss) attributable to Evoqua . . . . . . . . . . . . . $ (3,102)Historical weighted average shares of common stock outstanding—
basic and diluted . . . . . . . . . . . . . . . . . . . . . . . . . . . . . . . . . . . . . 104,821Pro forma adjustment to reflect the assumed issuance of common
stock . . . . . . . . . . . . . . . . . . . . . . . . . . . . . . . . . . . . . . . . . . . . . 8,333
Weighted average shares of common stock outstanding used incomputing pro forma net income (loss) per share—basic anddiluted . . . . . . . . . . . . . . . . . . . . . . . . . . . . . . . . . . . . . . . . . . . . 113,154
Pro forma net income (loss) per share—basic and diluted . . . . . . . . . $ (0.03)
For the fiscal year ended September 30, 2016:
Fiscal year endedSeptember 30, 2016
Pro forma net income (loss) attributable to Evoqua . . . . . . . . . . . . . $ 15,418Historical weighted average shares of common stock outstanding—
basic . . . . . . . . . . . . . . . . . . . . . . . . . . . . . . . . . . . . . . . . . . . . . . 104,254Pro forma adjustment to reflect the assumed issuance of common
stock . . . . . . . . . . . . . . . . . . . . . . . . . . . . . . . . . . . . . . . . . . . . . . 8,333
Weighted average shares of common stock outstanding used incomputing pro forma net income (loss) per share—basic . . . . . . . . 112,587
Pro forma net income (loss) per share—basic . . . . . . . . . . . . . . . . . . $ 0.14
81

For the fiscal year ended September 30, 2016:
Fiscal year endedSeptember 30, 2016
Pro forma net income (loss) attributable to Evoqua . . . . . . . . . . . . . $ 15,418Historical weighted average shares of common stock outstanding—
diluted . . . . . . . . . . . . . . . . . . . . . . . . . . . . . . . . . . . . . . . . . . . . . 106,161Pro forma adjustment to reflect the assumed issuance of common
stock . . . . . . . . . . . . . . . . . . . . . . . . . . . . . . . . . . . . . . . . . . . . . . 8,333
Weighted average shares of common stock outstanding used incomputing pro forma net income (loss) per share—diluted . . . . . . . 114,494
Pro forma net income (loss) per share—diluted . . . . . . . . . . . . . . . . $ 0.13
82
SELECTED HISTORICAL CONSOLIDATED FINANCIAL DATA
Our selected historical consolidated balance sheet data presented below as of September 30, 2015and 2016 and our selected historical consolidated statements of operations and cash flow datapresented below for the period from October 1, 2013 through January 15, 2014 and the period fromJanuary 16, 2014 through September 30, 2014 (each as described below) and for each of the fiscal yearsended September 30, 2015 and 2016 has been derived from our audited consolidated financialstatements included elsewhere in this prospectus. Our selected historical consolidated balance sheetdata presented below as of January 15, 2014 and September 30, 2014 has been derived from ourunaudited financial information and our audited consolidated financial statements, respectively, notincluded in this prospectus. Our selected historical consolidated balance sheet, statement of operationsand cash flow data presented below as of and for the fiscal year ended September 30, 2013 has beenderived from our audited consolidated financial statements not included in this prospectus. Ourselected historical consolidated balance sheet, statement of operations and cash flow data presentedbelow as of and for the fiscal year ended September 30, 2012 has been derived from our unauditedconsolidated financial information not included in this prospectus. The consolidated financial data ofour Predecessor as of and for the fiscal years ended September 30, 2012 and 2013 and as ofJanuary 15, 2014 and for the period from October 1, 2013 to January 15, 2014 was prepared on a‘‘carve-out’’ basis for the purpose of presenting our historical financial position, results of operationsand cash flows. Because the Predecessor represents a portion of the Siemens’ business, the selectedfinancial data presented for these periods is not necessarily indicative of our current or futureperformance and does not reflect what our performance would have been had we operated as aseparate stand-alone entity during these periods.
Our selected historical consolidated financial data presented below as of June 30, 2017 and for thenine months ended June 30, 2016 and 2017 has been derived from our unaudited condensedconsolidated financial statements included elsewhere in this prospectus. Our selected historicalconsolidated financial data presented below as of June 30, 2016 has been derived from our unauditedcondensed consolidated financial statements not included in this prospectus. The unaudited condensedconsolidated financial statements were prepared on a basis consistent with that used in preparing ouraudited consolidated financial statements and include all adjustments, consisting of normal andrecurring items, that we consider necessary for a fair presentation of our financial position and resultsof operations for the unaudited periods.
On January 15, 2014, Evoqua Water Technologies Corp. (formerly EWT Holdings I Corp.)acquired, through its wholly-owned entities, EWT Holdings II Corp. and EWT Holdings III Corp., allof the capital stock of the Predecessor. As a result of the AEA Acquisition and resulting change incontrol and changes due to the impact of purchase accounting, we are required to present separatelythe operating results for the Predecessor and Successor. We refer to the period from October 1, 2013through January 15, 2014 as ‘‘Predecessor Period 2014,’’ and the consolidated financial statements forthat period include the accounts of the Predecessor. We refer to the period from January 16, 2014through September 30, 2014 as ‘‘Successor Period 2014,’’ and the consolidated financial statements forthat period include the accounts of the Successor. The Successor was incorporated on October 7, 2013.From October 7, 2013 to January 15, 2014, the Successor had no activities other than the incurrence oftransaction costs related to the AEA Acquisition, which are included in the Successor Period 2014.Consequently, Successor Period 2014, fiscal 2015 and fiscal 2016 may not be comparable to PredecessorPeriod 2014.
The historical results presented below are not necessarily indicative of the results to be expectedfor any future period. The selected historical consolidated financial data presented below should beread in conjunction with ‘‘Capitalization,’’ ‘‘Management’s Discussion and Analysis of FinancialCondition and Results of Operations,’’ ‘‘Business’’ and our consolidated financial statements andrelated notes included elsewhere in this prospectus.
83
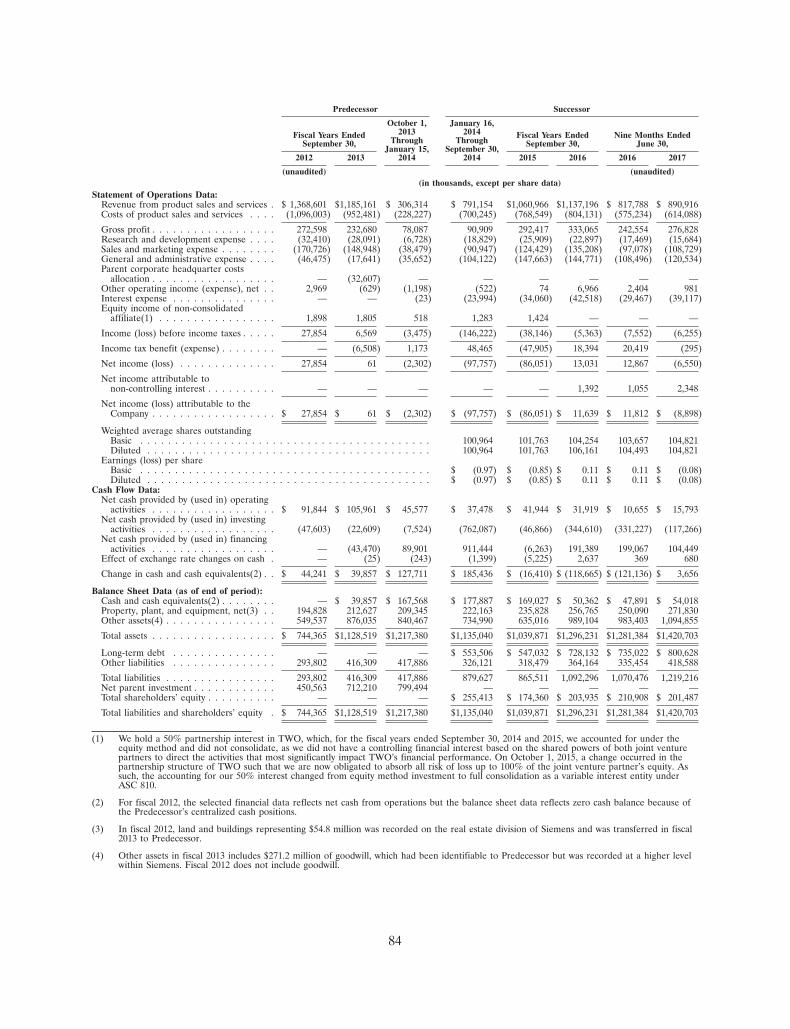
Predecessor Successor
October 1, January 16,2013 2014Fiscal Years Ended Fiscal Years Ended Nine Months Ended
Through ThroughSeptember 30, September 30, June 30,January 15, September 30,
2012 2013 2014 2014 2015 2016 2016 2017
(unaudited) (unaudited)(in thousands, except per share data)
Statement of Operations Data:Revenue from product sales and services . $ 1,368,601 $1,185,161 $ 306,314 $ 791,154 $1,060,966 $1,137,196 $ 817,788 $ 890,916Costs of product sales and services . . . . (1,096,003) (952,481) (228,227) (700,245) (768,549) (804,131) (575,234) (614,088)
Gross profit . . . . . . . . . . . . . . . . . . 272,598 232,680 78,087 90,909 292,417 333,065 242,554 276,828Research and development expense . . . . (32,410) (28,091) (6,728) (18,829) (25,909) (22,897) (17,469) (15,684)Sales and marketing expense . . . . . . . . (170,726) (148,948) (38,479) (90,947) (124,429) (135,208) (97,078) (108,729)General and administrative expense . . . . (46,475) (17,641) (35,652) (104,122) (147,663) (144,771) (108,496) (120,534)Parent corporate headquarter costs
allocation . . . . . . . . . . . . . . . . . . — (32,607) — — — — — —Other operating income (expense), net . . 2,969 (629) (1,198) (522) 74 6,966 2,404 981Interest expense . . . . . . . . . . . . . . . — — (23) (23,994) (34,060) (42,518) (29,467) (39,117)Equity income of non-consolidated
affiliate(1) . . . . . . . . . . . . . . . . . 1,898 1,805 518 1,283 1,424 — — —
Income (loss) before income taxes . . . . . 27,854 6,569 (3,475) (146,222) (38,146) (5,363) (7,552) (6,255)
Income tax benefit (expense) . . . . . . . . — (6,508) 1,173 48,465 (47,905) 18,394 20,419 (295)
Net income (loss) . . . . . . . . . . . . . . 27,854 61 (2,302) (97,757) (86,051) 13,031 12,867 (6,550)
Net income attributable tonon-controlling interest . . . . . . . . . . — — — — — 1,392 1,055 2,348
Net income (loss) attributable to theCompany . . . . . . . . . . . . . . . . . . $ 27,854 $ 61 $ (2,302) $ (97,757) $ (86,051) $ 11,639 $ 11,812 $ (8,898)
Weighted average shares outstandingBasic . . . . . . . . . . . . . . . . . . . . . . . . . . . . . . . . . . . . . . . . . . 100,964 101,763 104,254 103,657 104,821Diluted . . . . . . . . . . . . . . . . . . . . . . . . . . . . . . . . . . . . . . . . . 100,964 101,763 106,161 104,493 104,821
Earnings (loss) per shareBasic . . . . . . . . . . . . . . . . . . . . . . . . . . . . . . . . . . . . . . . . . . $ (0.97) $ (0.85) $ 0.11 $ 0.11 $ (0.08)Diluted . . . . . . . . . . . . . . . . . . . . . . . . . . . . . . . . . . . . . . . . . $ (0.97) $ (0.85) $ 0.11 $ 0.11 $ (0.08)
Cash Flow Data:Net cash provided by (used in) operating
activities . . . . . . . . . . . . . . . . . . $ 91,844 $ 105,961 $ 45,577 $ 37,478 $ 41,944 $ 31,919 $ 10,655 $ 15,793Net cash provided by (used in) investing
activities . . . . . . . . . . . . . . . . . . (47,603) (22,609) (7,524) (762,087) (46,866) (344,610) (331,227) (117,266)Net cash provided by (used in) financing
activities . . . . . . . . . . . . . . . . . . — (43,470) 89,901 911,444 (6,263) 191,389 199,067 104,449Effect of exchange rate changes on cash . — (25) (243) (1,399) (5,225) 2,637 369 680
Change in cash and cash equivalents(2) . . $ 44,241 $ 39,857 $ 127,711 $ 185,436 $ (16,410) $ (118,665) $ (121,136) $ 3,656
Balance Sheet Data (as of end of period):Cash and cash equivalents(2) . . . . . . . . — $ 39,857 $ 167,568 $ 177,887 $ 169,027 $ 50,362 $ 47,891 $ 54,018Property, plant, and equipment, net(3) . . 194,828 212,627 209,345 222,163 235,828 256,765 250,090 271,830Other assets(4) . . . . . . . . . . . . . . . . 549,537 876,035 840,467 734,990 635,016 989,104 983,403 1,094,855
Total assets . . . . . . . . . . . . . . . . . . $ 744,365 $1,128,519 $1,217,380 $1,135,040 $1,039,871 $1,296,231 $1,281,384 $1,420,703
Long-term debt . . . . . . . . . . . . . . . — — — $ 553,506 $ 547,032 $ 728,132 $ 735,022 $ 800,628Other liabilities . . . . . . . . . . . . . . . 293,802 416,309 417,886 326,121 318,479 364,164 335,454 418,588
Total liabilities . . . . . . . . . . . . . . . . 293,802 416,309 417,886 879,627 865,511 1,092,296 1,070,476 1,219,216Net parent investment . . . . . . . . . . . . 450,563 712,210 799,494 — — — — —Total shareholders’ equity . . . . . . . . . . — — — $ 255,413 $ 174,360 $ 203,935 $ 210,908 $ 201,487
Total liabilities and shareholders’ equity . $ 744,365 $1,128,519 $1,217,380 $1,135,040 $1,039,871 $1,296,231 $1,281,384 $1,420,703
(1) We hold a 50% partnership interest in TWO, which, for the fiscal years ended September 30, 2014 and 2015, we accounted for under theequity method and did not consolidate, as we did not have a controlling financial interest based on the shared powers of both joint venturepartners to direct the activities that most significantly impact TWO’s financial performance. On October 1, 2015, a change occurred in thepartnership structure of TWO such that we are now obligated to absorb all risk of loss up to 100% of the joint venture partner’s equity. Assuch, the accounting for our 50% interest changed from equity method investment to full consolidation as a variable interest entity underASC 810.
(2) For fiscal 2012, the selected financial data reflects net cash from operations but the balance sheet data reflects zero cash balance because ofthe Predecessor’s centralized cash positions.
(3) In fiscal 2012, land and buildings representing $54.8 million was recorded on the real estate division of Siemens and was transferred in fiscal2013 to Predecessor.
(4) Other assets in fiscal 2013 includes $271.2 million of goodwill, which had been identifiable to Predecessor but was recorded at a higher levelwithin Siemens. Fiscal 2012 does not include goodwill.
84
MANAGEMENT’S DISCUSSION AND ANALYSIS OFFINANCIAL CONDITION AND RESULTS OF OPERATIONS
The following discussion and analysis of our financial condition and results of operations should beread in conjunction with the sections titled ‘‘Selected Historical Consolidated Financial Data’’ and‘‘Unaudited Pro Forma Financial Information,’’ and our consolidated financial statements and related notesand other information included elsewhere in this prospectus. This discussion contains forward-lookingstatements that involve risks and uncertainties. Our actual results could differ materially from such forward-looking statements. Factors that could cause or contribute to those differences include, but are not limitedto, those identified below and those discussed in the sections titled ‘‘Risk Factors’’ and ‘‘Cautionary NoteRegarding Forward-Looking Statements’’ included elsewhere in this prospectus. Unless otherwise specified,all dollar amounts in this section are referred to in thousands.
Overview and Background
We are a leading provider of mission critical water treatment solutions, offering services, systemsand technologies to support our customers’ full water lifecycle needs. With over 200,000 installationsworldwide, we hold leading positions in the industrial, commercial and municipal water treatmentmarkets in North America. We offer a comprehensive portfolio of differentiated, proprietary technologysolutions sold under a number of market-leading and well-established brands. We deliver and maintainthese mission critical solutions through the largest service network in North America assuring ourcustomers continuous uptime with 86 branches which are located no further than a two-hour drive frommore than 90% of our customers’ sites. We believe that the customer intimacy created through ourservice network is a significant competitive advantage.
Our solutions are designed to provide ‘‘worry-free water’’ by ensuring that our customers haveaccess to an uninterrupted quantity and level of quality of water that meets their unique product,process and recycle or reuse specifications. We enable our customers to achieve lower costs throughgreater uptime, throughput and efficiency in their operations and support their regulatory complianceand environmental sustainability. We have worked to protect water, the environment and ouremployees for over 100 years. As a result, we have earned a reputation for quality, safety and reliabilityand are sought out by our customers to solve the full range of their water treatment needs, andmaintaining our reputation is critical to the success of our business and solution set.
Our vision ‘‘to be the world’s first choice in water solutions’’ and our values of ‘‘integrity,customers and performance’’ foster a corporate culture that is focused on employee enablement,empowerment and accountability, which creates a highly entrepreneurial and dynamic workenvironment. Our purpose is ‘‘Transforming water. Enriching life.’’ We draw from a long legacy ofwater treatment innovations and industry firsts, supported by more than 1,250 granted or pendingpatents, which in aggregate are important to our business. Our core technologies are primarily focusedon removing impurities from water, rather than neutralizing them through the addition of chemicals,and we are able to achieve purification levels which are 1,000 times greater than typical drinking water.
On January 15, 2014, Evoqua Water Technologies Corp. (formerly EWT Holdings I Corp.)acquired, through its wholly-owned entities, EWT Holdings II Corp. and EWT Holdings III Corp., allof the capital stock of the Predecessor. As a result of the AEA Acquisition and resulting change incontrol and changes due to the impact of purchase accounting, we are required to present separatelythe operating results for the Predecessor and Successor. We refer to the period from October 1, 2013through January 15, 2014 as ‘‘Predecessor Period 2014,’’ and the consolidated financial statements forthat period include the accounts of the Predecessor. We refer to the period from January 16, 2014through September 30, 2014 as ‘‘Successor Period 2014,’’ and the consolidated financial statements forthat period include the accounts of the Successor. The Successor was incorporated on October 7, 2013.From October 7, 2013 to January 16, 2014, the Successor had no activities other than the incurrence oftransaction costs related to the AEA Acquisition, which are included in the Successor Period 2014.
85
Consequently, Successor Period 2014, fiscal 2015 and fiscal 2016 may not be comparable to PredecessorPeriod 2014.
Business Segments
Our business is organized by customer base and offerings into three reportable segments that eachdraw from the same reservoir of leading technologies, shared manufacturing infrastructure, commonbusiness processes and corporate philosophies. Our reportable segments consist of: (i) our IndustrialSegment, (ii) our Municipal Segment and (iii) our Products Segment. The key factors used to identifythese reportable segments are the organization and alignment of our internal operations, the nature ofthe products and services and customer type.
• Within the Industrial Segment, we primarily provide tailored solutions in collaboration with ourcustomers backed by life-cycle services including on-demand water, BOO, recycle and reuse andemergency response service alternatives to improve operational reliability, performance andenvironmental compliance.
• Within the Municipal Segment, we primarily deliver solutions, equipment and services toengineering firms, OEMs and municipalities to treat wastewater and purify drinking water.
• Within the Products Segment, we provide a highly differentiated and scalable range of productsand technologies specified by global water treatment designers, OEMs, engineering firms andintegrators.
We evaluate our business segments’ operating results based on income from operations andEBITDA on a segment basis. Corporate activities include general corporate expenses, elimination ofintersegment transactions, interest income and expense and other unallocated charges, which have notbeen allocated to business segments. As such, the segment results provided herein may not becomparable to other companies.
For the fiscal years ended September 30, 2014 (on a combined Predecessor Period 2014 andSuccessor Period 2014 basis), 2015 and 2016, our Industrial Segment accounted for 55.7%, 53.6% and53.1% of our revenues, respectively; our Municipal Segment accounted for 23.5%, 25.8% and 24.4% ofour revenues, respectively; and our Products Segment accounted for 20.8%, 20.6% and 22.5% ofrevenues, respectively.
Organic Growth Drivers
Market Growth
We maintain a leading position among customers in growing industries that utilize water as acritical part of their operations or production processes, including pharmaceuticals and health sciences,microelectronics, food and beverage, hydrocarbon and chemical processing, power, generalmanufacturing, municipal drinking and wastewater, marine and aquatics. Water treatment is anessential, non-discretionary market that is growing in importance as access to clean water has becomean international priority. Underpinning this growth are a number of global, long-term trends that haveresulted in increasingly stringent effluent regulations, along with a growing demand for cleaner andsustainable waste streams for reuse. These trends include the growing global population, increasinglevels of urbanization and continued global economic growth, and we have seen these trends manifestthemselves within our various end markets creating multiple avenues of growth. For example, withinthe industrial market, water is an integral and meaningful component in the production of a wide-rangeof goods spanning from consumer electronics to automobiles.
Our Existing Customer Base
We believe our strong brands, leading position in highly fragmented markets, scalable and globalofferings, leading installed base and unique ability to provide complete treatment solutions will enable
86

us to capture a larger share of our existing customers’ water treatment spend while expanding withexisting and new customers into adjacent end-markets and underpenetrated regions, including byinvesting in our sales force and cross-selling to existing customers. We are uniquely positioned tofurther penetrate our core markets, with over 200,000 installations across over 38,000 global customers.We maintain a customer-intimate business model with strong brand value and provide solutions-focusedofferings capable of serving a customer’s full lifecycle water treatment needs, both in current and newgeographic regions.
Our Service Model
We selectively target high value projects with opportunities for recurring business through service,parts and other aftermarket opportunities over the lifecycle of the process or capital equipment. Inparticular, we have developed a pipeline of smart, internet-connected monitoring technologies throughthe deployment of our Water One smart water platform that provides us with an increasing ability tohandle our customers’ complete water needs through on-demand water management, predictivemaintenance and service response planning. Water One also enables us to transition our customers tomore accurate pricing models based on usage, which otherwise would not have been possible withouttechnological advancement. Our technology solutions provide customers with increased stability andpredictability in water-related costs, while enabling us to optimize our service route network and ondemand offerings through predictive analytics, which we believe will result in market share gains,improved service levels, increased barriers to entry and reduced costs.
Product and Technology Development
We develop our technologies through in-house research, development and engineering andtargeted tuck-in, technology-enhancing and geography-expanding acquisitions. We have a reservoir ofrecently launched technologies and a strong pipeline of new offerings designed to provide customerswith innovative, value-enhancing solutions. Furthermore, we have successfully completed eighttechnology-enhancing and geography-expanding acquisitions since April 2016 to add new capabilitiesand cross-selling opportunities in areas such as electrochemical and electrochlorination cells,regenerative media filtration, anodes, UV disinfection and aerobic and anaerobic biological treatmenttechnologies. We are able to rapidly scale new technologies using our leading direct and third-partysales channels and our relationships with key influencers, including municipal representatives,engineering firms, designers and other system specifiers. We believe our continued investment indriving penetration of our recently launched technologies, robust pipeline of new capabilities andbest-in-class channels to market will allow us to continue to address our customer needs across thewater lifecycle.
Operational Excellence
We believe that continuous improvement of our operations, processes and organizational structureis a key driver of our earnings growth. Since fiscal 2014, we have realigned our organizational structure,achieved significant cost savings through operational efficiencies and revitalized our culture, which hasenergized our workforce and reduced employee turnover. We have identified and are pursuing anumber of discrete initiatives which, if successful, we expect could result in additional cost savings overthe next three years. These initiatives include our ePro and supply chain improvement programs toconsolidate and manage global spending, our improved logistics and transportation managementprogram, further optimizing our engineering cost structure, capturing benefits of our Water One remotesystem monitoring and data analytics offerings. We refer to these initiatives as ‘‘Value Creators’’ asthese improvements focus on creating value for customers through reduced leadtimes, improved qualityand superior customer support, while also creating value for stockholders through enhanced earningsgrowth. Furthermore, as a result of significant investments we have made in our footprint and facilities,we have capacity to support our planned growth without commensurate increase in fixed costs.
87

Acquisitions
We believe that tuck-in acquisitions present a key opportunity within our overall growth strategy,which we will continue to evaluate strategically. These strategic acquisitions will enable us to accelerateour growth in our current addressable market, as well as in new geographies and new end marketverticals. Our existing customer relationships, best-in-class channels to market and ability to rapidlycommercialize technologies provide a strong platform to drive rapid growth in the businesses weacquire. To capitalize on these opportunities, we have built an experienced team dedicated to mergersand acquisitions that has successfully completed eight technology-enhancing and geography-expandingacquisitions since April 2016, with purchase prices ranging from approximately $3.3 million toapproximately $283.7 million, and pre-acquisition revenues ranging from approximately $3.1 million toapproximately $55.7 million. We will continue to actively evaluate acquisition opportunities that areconsistent with our business strategy and financial model, and, although we may not be able to continueto identify suitable acquisition targets and implement our growth strategy, we currently have a pipelinewhich includes more than 60 potential targets, which has been developed proactively by our team aswell as informed by our customer base. Our acquisitions include:
• Magneto—On April 11, 2016, we completed the acquisition of 100% of the issued andoutstanding capital stock of privately held Magneto, a leader in the development andmanufacture of anodes for the electrochemical industry and refurbishment of electrochlorinationcells for seawater electrolysis for A23.4 million (or approximately $26.5 million). Magneto isincluded in the results of our Products Segment.
• Neptune-Benson—On April 15, 2016, we completed the acquisition of 100% of the issued andoutstanding capital stock of privately held Neptune-Benson, a leading manufacturer ofhigh-quality water filtration and disinfection products for the commercial, industrial andmunicipal water markets for $283.7 million. Neptune-Benson is included in the results of ourProducts Segment.
• VAF—On July 1, 2016, we completed the acquisition of substantially all of the assets of VAF forapproximately $3.3 million, consisting of $2.7 million cash at closing and $0.6 million related to a$1.0 million maximum earnout payment subject to various performance metrics over the nextfive years. VAF is a leading screen filtration manufacturer based in Arvada, Colorado. VAF isincluded in the results of our Products Segment.
• Delta UV—On August 3, 2016, we completed the acquisition of 100% of the issued andoutstanding capital stock of Delta UV, a leading manufacturer and marketer of UV-C technologyin North America for $4.8 million. Delta UV is included in the results of our Products Segment.
• ETS—On November 1, 2016, we completed the acquisition of substantially all of the assets ofETS, which adds organic wastewater treatment capability to our industrial treatment solutions,for $10.7 million. ETS further allows us to insource manufacturing of dissolved air flotationunits, the production of which we previously outsourced. ETS is included in the results of ourIndustrial Segment.
• Noble—On May 9, 2017, we completed the acquisition of substantially all of the assets of Noble,which provides water equipment and treatment systems for commercial buildings, industrialplants, medical laboratories and the pharmaceutical industry, with a focus on the Texas market,for $7.6 million, consisting of $5.9 million cash paid at closing and $1.7 million related to a$2.4 million maximum earnout payment subject to various performance metrics measured at theend of the 12 month period following closing. Noble supports our existing high-purity watercapabilities and is based in Dallas, Texas. Noble will be included in the results of our IndustrialSegment going forward.
• ADI—On June 30, 2017, we completed the acquisition of ADI, a leader in anaerobic digestion,aerobic treatment and biogas treatment, green energy recovery and water reuse technologies, as
88
well as industrial wastewater cover liners and containment systems for a base purchase price ofCAD 71.4 million (or approximately $54.9 million), of which CAD 67.3 million ($51.8 million) incash was paid at closing and included the fair value of the earnout payments of CAD 4.1 million($3.1 million). The maximum earnout payment of CAD 7.5 million (or approximately$5.7 million), is payable over a period of twenty-four months based upon the achievement ofcertain specified performance metrics. ADI will be included in the results of our IndustrialSegment going forward.
• Olson—On June 30, 2017, we completed the acquisition of all of the issued and outstandingshares of capital stock of privately held Olson, a leading designer and producer of filters andirrigation components for the agriculture and industrial markets, for $9.4 million. Olson will beincluded in the results of our Products Segment going forward.
Key Factors and Trends Affecting Our Business and Financial Statements
Various trends and other factors affect or have affected our operating results, including:
Overall economic trends. The overall economic environment and related changes in industrial,commercial and municipal spending impact our business. In general, positive conditions in the broadereconomy promote industrial, commercial and municipal customer spending, while economic weaknessresults in a reduction of new industrial, commercial and municipal project activity. Macroeconomicfactors that can affect customer spending patterns, and thereby our results of operations, includepopulation growth, total water consumption, municipal budgets, employment rates, business conditions,the availability of credit or capital, interest rates, tax rates and regulatory changes. Since the businessesof our customers vary in cyclicality, periodic downturns in any specific sector typically have modestimpacts on our overall business.
New products and technologies. Our ability to maintain our appeal to existing customers andattract new customers depends on our ability to originate, develop and offer a compelling array ofproducts, services and solutions responsive to evolving customer innovations, preferences andspecifications. We expect that increased use of water in industrial and commercial processes will driveincreased customer demand in the future, and our ability to grow will depend in part on effectivelyresponding to innovation in our customers’ processes and systems. Further, our ability to provideproducts that comply with evolving government regulations will also be a driver of the appeal of ourproducts, services and solutions to industrial and commercial customers.
Changes in costs. We have significant exposures to certain commodities, including steel, caustic,carbon, calcium nitrate and iridium, and volatility in the market price of these commodity inputmaterials has a direct impact on our costs. If we are unable to manage commodity fluctuations throughpricing actions, cost savings projects and sourcing decisions as well as through consistent productivityimprovements, it may adversely impact our gross profit and gross margin. Further, additional potentialacquisitions and international expansion will place increased demands on our operational, managerial,administrative and other resources. Managing our growth effectively will require us to continue toenhance our management systems, financial and management controls and information systems. We willalso be required to hire, train and retain operational and sales personnel, which affects our operatingmargins.
Government policies. Decaying water systems in the United States will require critical drinkingwater and wastewater repairs, often led by municipal governments. Further, as U.S. states increaseregulation on existing and emerging contaminants, we expect that our customers will increasinglyrequire sustainable solutions to their water-related needs. In general, increased infrastructureinvestment and more stringent municipal, state and federal regulations promote increased spending onour products, services and solutions, while a slowdown in investment in public infrastructure or the
89
elimination of key environmental regulations could result in lower industrial and municipal spending onwater systems and products.
Availability of water. In general, we expect demand for our products and services to increase asthe availability of clean water from public sources decreases. Secular trends that will drive demand forwater across a multitude of industrial, commercial and municipal applications include global populationgrowth, urbanization, industrialization and overall economic growth. In addition, the supply of cleanwater could be adversely impacted by factors including an aging water infrastructure within NorthAmerica and increased levels of water stress from seasonal rainfall, inadequate water storage options ortreatment technologies. Because water is a critical component and byproduct of many processes,including in manufacturing and product development, we expect that, as global consumption patternsevolve and water shortages persist, demand for our equipment and services will continue to increase.
Operational investment. Our historical operating results reflect the impact of our ongoinginvestments to support our growth. We have made significant investments in our business that webelieve have laid the foundation for continued profitable growth. We believe that our strengthenedsales force, mergers and acquisitions team, enhanced information systems, research, development andengineering investments and other factors enable us to support our operating model.
Our ability to source and distribute products effectively. Our revenues are affected by our ability topurchase our inputs in sufficient quantities at competitive prices. While we believe our suppliers haveadequate capacity to meet our current and anticipated demand, our level of revenues could beadversely affected in the event of constraints in our supply chain, including the inability of our suppliersto produce sufficient quantities of raw materials in a manner that is able to match demand from ourcustomers.
Fluctuation in quarterly results. Our quarterly results have historically varied depending upon avariety of factors, including funding, readiness of projects and regulatory approvals. In addition, ourcontracts for large capital water treatment projects, systems and solutions for industrial, commercialand municipal applications are generally fixed-price contracts with milestone billings. As a result ofthese factors, our working capital requirements and demands on our distribution and delivery networkmay fluctuate during the year.
Contractual relationships with customers. Due to our large installed base and the nature of ourcontractual relationships with our customers, we have high visibility into a large portion of our revenue.The one- to twenty-year terms of many of our service contracts and the regular delivery andreplacement of many of our products help to insulate us from the negative impact of any economicdecline.
Inflation and deflation trends. Our financial results can be expected to be directly impacted bysubstantial increases in costs due to commodity cost increases or general inflation which could lead to areduction in our revenues as well as greater margin pressure as increased costs may not be able to bepassed on to customers. To date, changes in commodity prices and general inflation have not materiallyimpacted our business.
Exchange rates. The reporting currency for our financial statements is the U.S. dollar. We operatein numerous countries around the world and therefore, certain of our assets, liabilities, revenues andexpenses are denominated in functional currencies other than the U.S. dollar, primarily in the euro,U.K. sterling, Chinese renminbi, Canadian dollar, Australian dollar and Singapore dollar. To prepareour consolidated financial statements we must translate those assets, liabilities, revenues and expensesinto U.S. dollars at the applicable exchange rate. As a result, increases or decreases in the value of theU.S. dollar against these other currencies will affect the amount of these items recorded in ourconsolidated financial statements, even if their value has not changed in the functional currency. Whilewe believe we are not susceptible to any material impact on our results of operations caused by
90

fluctuations in exchange rates because our operations are primarily conducted in the United States, ifwe expand our foreign operations in the future, substantial increases or decreases in the value of theU.S. dollar relative to these other currencies could have a significant impact on our results ofoperations.
Public company costs. As a result of this initial public offering, we will incur additional legal,accounting and other expenses that we did not previously incur, including costs associated with SECreporting and corporate governance requirements. These requirements include compliance with theSarbanes-Oxley Act as well as other rules implemented by the SEC and the NYSE. Our financialstatements following this offering will reflect the impact of these expenses. In addition, the one-timegrant of stock-settled restricted stock unit awards expected to be made in connection with this offeringto certain members of management will result in increased non-cash stock-based compensation expense,which will be incremental to our ongoing stock-based compensation expense. This stock-basedcompensation expense will be finalized following the pricing of this offering and is expected to beexpensed beginning in the fiscal quarter in which this offering closes and continuing over the followingeight fiscal quarters. For more information, please see ‘‘Compensation Discussion and Analysis—IPOAwards—Restricted Stock Units.’’
Debt refinancings. In October 2016, we repaid our Second Lien Facility in full and revolving creditloans then-outstanding and borrowed an additional $150.0 million of term loans under the Term LoanFacility at lower rates, and we have the option to add one or more incremental term loan under theTerm Loan Facility or revolving credit facilities or increase commitments under our Revolving CreditFacility. Further, the Revolving Credit Facility and Term Loan Facility are scheduled to mature inJanuary 2019 and January 2021, respectively, and we will need to repay, refinance, replace or otherwiseextend the maturity of our First Lien Facilities. Accordingly, our results have been and will be impactedby substantial changes in our net interest expense throughout the periods presented and in the future.See ‘‘—Liquidity and Capital Resources’’ below.
How We Assess the Performance of Our BusinessIn assessing the performance of our business, we consider a variety of performance and financial
measures. The key indicators of the financial condition and operating performance of our business arerevenue, gross profit, gross margin, operating expenses, net income (loss) and Adjusted EBITDA.
RevenueOur sales are a function of sales volumes and selling prices, each of which is a function of the mix
of product and service sales, and consist primarily of:• sales of tailored light industry technologies, heavy industry technologies and environmental
products, services and solutions in collaboration with our industrial customers, backed bylifecycle services including emergency response services and build-own-operate alternatives, to abroad group of industrial customers in our U.S., Canada and Singapore markets;
• sales of products, services and solutions to engineering firms and municipalities to purifydrinking water and treat wastewater globally; and
• sales of a wide variety of differentiated products and technologies, to an array of OEM,distributor, end-user, engineering firm and integrator customers in all of our geographic marketsand aftermarket channels.
Cost of Sales, Gross Profit and Gross MarginGross profit is determined by subtracting cost of product sales and cost of services from our
product and services revenue. Gross margin measures gross profit as a percentage of our combinedproduct and services revenue.
Cost of product sales consists of all manufacturing costs required to bring a product to a ready forsale condition, including direct and indirect materials, direct and indirect labor costs including benefits,freight, depreciation, information technology, rental and insurance, repair and maintenance, utilities,other manufacturing costs, warranties and third party commissions.
91

Cost of services primarily consists of the cost of personnel and travel for our field service, supplychain and technicians, depreciation of equipment and field service vehicles and freight costs.
Operating Expenses
Operating expenses consist primarily of sales and marketing, general and administrative andresearch and development expenses.
Sales and Marketing. Sales and marketing expenses consist primarily of advertising and marketingpromotions of our products, services and solutions and related personnel expenses (including allEvoqua sales and application employees’ base compensation and incentives), as well as sponsorshipcosts, consulting and contractor expenses, travel, display expenses and related amortization. We expectour sales and marketing expenses to increase as we continue to actively promote our products, servicesand solutions.
General and Administrative. General and administrative expenses consist of fixed overheadpersonnel expenses associated with our service organization (including district and branch managers,customer service, contract renewals and regeneration plant management). We expect our general andadministrative expenses to increase due to the anticipated growth of our business and relatedinfrastructure as well as legal, accounting, insurance, investor relations and other costs associated withbecoming a public company.
Research and Development. Research and development expenses consist primarily of personnelexpenses related to research and development, patents, sustaining engineering, consulting andcontractor expenses, tooling and prototype materials and overhead costs allocated to such expenses.Substantially all of our research and development expenses are related to developing new products andservices and improving our existing products and services. To date, research and development expenseshave been expensed as incurred, because the period between achieving technological feasibility and therelease of products and services for sale has been short and development costs qualifying forcapitalization have been insignificant.
We expect our research and development expenses to increase as we continue to invest indeveloping new products, services and solutions and enhancing our existing products, services andsolutions.
Net Income (Loss)
Net income (loss) is determined by subtracting operating expenses and interest expense from, andadding other operating income (expense), equity income from our partnership interest in TWO andincome tax benefit (expense) to, gross profit. For more information on how we determine gross profit,see ‘‘—Gross Profit.’’
Adjusted EBITDA
Adjusted EBITDA is one of the primary metrics used by management to evaluate the financialperformance of our business. We present Adjusted EBITDA, which is not a recognized financialmeasure under GAAP, because we believe it is frequently used by analysts, investors and otherinterested parties to evaluate companies in our industry. Further, we believe it is helpful in highlightingtrends in our operating results, because it excludes the results of decisions that are outside the controlof management, while other measures can differ significantly depending on long-term strategicdecisions regarding capital structure, the tax jurisdictions in which we operate and capital investments.Management uses Adjusted EBITDA to supplement GAAP measures of performance as follows:
• to assist investors and analysts in comparing our operating performance across reporting periodson a consistent basis by excluding items that we do not believe are indicative of our coreoperating performance;
92
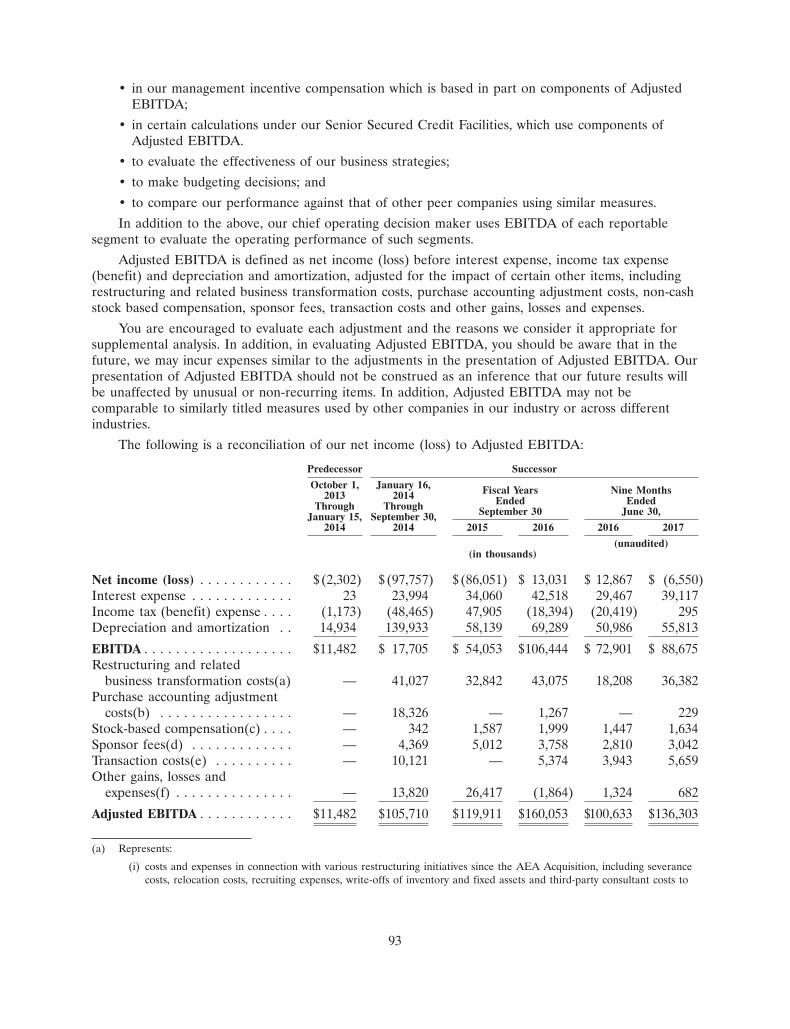
• in our management incentive compensation which is based in part on components of AdjustedEBITDA;
• in certain calculations under our Senior Secured Credit Facilities, which use components ofAdjusted EBITDA.
• to evaluate the effectiveness of our business strategies;
• to make budgeting decisions; and
• to compare our performance against that of other peer companies using similar measures.
In addition to the above, our chief operating decision maker uses EBITDA of each reportablesegment to evaluate the operating performance of such segments.
Adjusted EBITDA is defined as net income (loss) before interest expense, income tax expense(benefit) and depreciation and amortization, adjusted for the impact of certain other items, includingrestructuring and related business transformation costs, purchase accounting adjustment costs, non-cashstock based compensation, sponsor fees, transaction costs and other gains, losses and expenses.
You are encouraged to evaluate each adjustment and the reasons we consider it appropriate forsupplemental analysis. In addition, in evaluating Adjusted EBITDA, you should be aware that in thefuture, we may incur expenses similar to the adjustments in the presentation of Adjusted EBITDA. Ourpresentation of Adjusted EBITDA should not be construed as an inference that our future results willbe unaffected by unusual or non-recurring items. In addition, Adjusted EBITDA may not becomparable to similarly titled measures used by other companies in our industry or across differentindustries.
The following is a reconciliation of our net income (loss) to Adjusted EBITDA:
Predecessor Successor
October 1, January 16, Fiscal Years Nine Months2013 2014 Ended EndedThrough Through September 30 June 30,January 15, September 30,2014 2014 2015 2016 2016 2017
(unaudited)(in thousands)
Net income (loss) . . . . . . . . . . . . $ (2,302) $(97,757) $(86,051) $ 13,031 $ 12,867 $ (6,550)Interest expense . . . . . . . . . . . . . 23 23,994 34,060 42,518 29,467 39,117Income tax (benefit) expense . . . . (1,173) (48,465) 47,905 (18,394) (20,419) 295Depreciation and amortization . . 14,934 139,933 58,139 69,289 50,986 55,813
EBITDA . . . . . . . . . . . . . . . . . . . $11,482 $ 17,705 $ 54,053 $106,444 $ 72,901 $ 88,675Restructuring and related
business transformation costs(a) — 41,027 32,842 43,075 18,208 36,382Purchase accounting adjustment
costs(b) . . . . . . . . . . . . . . . . . — 18,326 — 1,267 — 229Stock-based compensation(c) . . . . — 342 1,587 1,999 1,447 1,634Sponsor fees(d) . . . . . . . . . . . . . — 4,369 5,012 3,758 2,810 3,042Transaction costs(e) . . . . . . . . . . — 10,121 — 5,374 3,943 5,659Other gains, losses and
expenses(f) . . . . . . . . . . . . . . . — 13,820 26,417 (1,864) 1,324 682
Adjusted EBITDA . . . . . . . . . . . . $11,482 $105,710 $119,911 $160,053 $100,633 $136,303
(a) Represents:
(i) costs and expenses in connection with various restructuring initiatives since the AEA Acquisition, including severancecosts, relocation costs, recruiting expenses, write-offs of inventory and fixed assets and third-party consultant costs to
93
assist with these initiatives (includes (A) $16.9 million in fiscal 2016 (all of which is reflected as a component ofRestructuring charges in ‘‘Note 12—Restructuring and Related Charges’’ to our audited consolidated financialstatements) and $19.2 million for the nine months ended June 30, 2017 (all of which is reflected as a component ofRestructuring charges in ‘‘Note 11—Restructuring and Related Charges’’ to our unaudited condensed consolidatedfinancial statements) related to our voluntary separation plan pursuant to which approximately 220 employeesaccepted separation packages, and (B) $12.4 million (of which $4.4 million is reflected as a component ofRestructuring charges in ‘‘Note 12—Restructuring and Related Charges’’ to our audited consolidated financialstatements) in the Successor Period, $9.2 million (of which $6.5 million is reflected as a component of Restructuringcharges in ‘‘Note 12—Restructuring and Related Charges’’ to our audited consolidated financial statements) in fiscal2015, $11.1 million (all of which is reflected as a component of Restructuring charges in ‘‘Note 12—Restructuring andRelated Charges’’ to our audited consolidated financial statements) in fiscal 2016, $9.3 million (of which $8.1 millionis reflected as a component of Restructuring charges in ‘‘Note 11—Restructuring and Related Charges’’ to ourunaudited condensed consolidated financial statements) in the nine months ended June 30, 2016 and $6.5 million (ofwhich $2.9 million is reflected as a component of Restructuring charges in ‘‘Note 11—Restructuring and RelatedCharges’’ to our unaudited condensed consolidated financial statements) in the nine months ended June 30, 2017related to various other initiatives implemented to restructure and reorganize our business as a standalone businesswith an appropriate management team and cost structure). Differences between amounts reflected as Restructuringcharges in ‘‘Note 12—Restructuring and Related Charges’’ to our audited financial statements and amounts reflectedin this adjustment relate primarily to retention payments made to employees in the Successor Period of $5.6 millionthat have been reflected as components of Cost of product sales and services ($1.2 million), Research anddevelopment expense ($0.2 million), Sales and marketing expense ($1.9 million) and General and administrativeexpense ($2.3 million) as well as other administrative costs associated with separation from the Predecessor that havebeen reflected in the Successor Period as a component of General and administrative expense ($2.4 million).Differences between amounts reflected as Restructuring charges in ‘‘Note 12—Restructuring and Related Charges’’ toour audited financial statements and amounts reflected in this adjustment also relate to retention payments made toemployees in fiscal 2015 of $2.5 million that have been reflected as components of Cost of product sales and services($1.1 million), Research and development expense ($0.1 million), Sales and marketing expense ($1.0 million) andGeneral and administrative expense ($0.3 million). Differences between amounts reflected as Restructuring charges in‘‘Note 11—Restructuring and Related Charges’’ to our unaudited condensed consolidated financial statements in thenine months ended June 30, 2016 and June 30, 2017 and amounts reflected in this adjustment relate primarily toconsulting costs and other charges related to implementing such initiatives that have primarily been recorded as acomponent of General and administrative expense ($1.2 million) in the nine months ended June 30, 2016 and Cost ofproduct sales and services ($1.4 million), Sales and marketing expenses ($1.0 million) and General and administrativeexpense ($1.0 million) in the nine months ended June 30, 2017;
(ii) legal settlement costs and intellectual property related fees associated with legacy matters prior to the AEAAcquisition, including fees and settlement costs related to product warranty litigation on MEMCOR products andcertain discontinued products ($11.7 million in the Successor Period, reflected as a component of Cost of productsales and services, $11.7 million in fiscal 2015, reflected as components of Cost of product sales and services($10.7 million) and General and administrative expenses ($1.0 million), $5.1 million, primarily reflected as acomponent of Cost of product sales and services in fiscal 2016, $2.5 million, primarily reflected as a component ofCost of product sales and services in the nine months ended June 30, 2016 and $1.8 million, primarily reflected as acomponent of General and administrative expense in the nine months ended June 30, 2017);
(iii) expenses associated with our information technology and functional infrastructure transformation following the AEAAcquisition, including activities to optimize information technology systems and functional infrastructure processes fora standalone business ($16.9 million, primarily reflected as a component of General and administrative expense in theSuccessor Period, $12.1 million, primarily reflected as components of Cost of product sales and services ($3.0 million),Research and development expense ($0.4 million), Sales and marketing expense ($0.3 million) and General andadministrative expense ($8.4 million) in fiscal 2015, $9.5 million, primarily reflected as components of Cost of productsales and services ($3.6 million), Sales and marketing expense ($2.5 million), General and administrative expense($3.1 million) and Research and development expense ($0.3 million) in fiscal 2016, $6.1 million, primarily reflected ascomponents of Cost of product sales and services ($2.9 million), Sales and marketing expense ($1.7 million) andGeneral and administrative expense ($1.5 million) in the nine months ended June 30, 2016 and $4.5 million, primarilyreflected as components of Cost of product sales and services ($1.8 million), Sales and marketing expense($0.7 million) and General and administrative expense ($2.0 million) in the nine months ended June 30, 2017); and
(iv) costs incurred by us in connection with this offering, including consultant costs and public company compliance costs($0.5 million in fiscal 2016, $0.3 million in the nine months ended June 30, 2016 and $4.4 million in the nine monthsended June 30, 2017, all reflected as a component of General and administrative expense).
(b) Represents adjustments for the effect of the purchase accounting step-up in the value of inventory to fair value recognizedin cost of goods sold as a result of the AEA Acquisition and the acquisition of Magneto.
94

(c) Represents non-cash stock-based compensation expenses related to option awards. See Note 15 to our audited financialstatements included elsewhere in this prospectus for further detail.
(d) Represents management fees paid to AEA pursuant to the management agreement. Pursuant to the managementagreement, AEA provided advisory and consulting services to us in connection with the AEA Acquisition, includinginvestment banking, due diligence, financial advisory and valuation services. AEA also provides ongoing advisory andconsulting services (similar in nature to the services provided in connection with the AEA Acquisition) to us pursuant tothe management agreement. In connection with this offering, the management agreement will be terminated. See ‘‘CertainRelationships and Related Party Transactions’’ and Note 18 to our audited financial statements included elsewhere in thisprospectus for further detail.
(e) Represents expenses associated with acquisition and divestiture-related activities and post-acquisition integration costs andaccounting, tax, consulting, legal and other fees and expenses associated with (i) the AEA Acquisition ($10.1 million in theSuccessor Period) and (ii) other acquisition transactions ($5.4 million in fiscal 2016, $3.9 million in the nine months endedJune 30, 2016 and $5.7 million in the nine months ended June 30, 2017).
(f) Represents:
(i) impact of foreign exchange gains and losses ($6.8 million loss in the Successor Period, $19.0 million loss in fiscal 2015,$0.5 million loss in fiscal 2016, $1.4 million loss in the nine months ended June 30, 2016 and $2.1 million gain in thenine months ended June 30, 2017);
(ii) $3.5 million gain on the sale of assets, primarily related to the Vernon Disposition;
(iii) foreign exchange impact related to headquarter allocations ($0.7 million gain in fiscal 2016, $0.04 million gain in thenine months ended June 30, 2016 and $1.0 million loss in the nine months ended June 30, 2017); and
(iv) expenses related to maintaining non-operational business locations ($7.0 million in the Successor Period, $7.4 millionin fiscal 2015, $1.8 million in fiscal 2016 and $1.7 million in the nine months ended June 30, 2017).
95
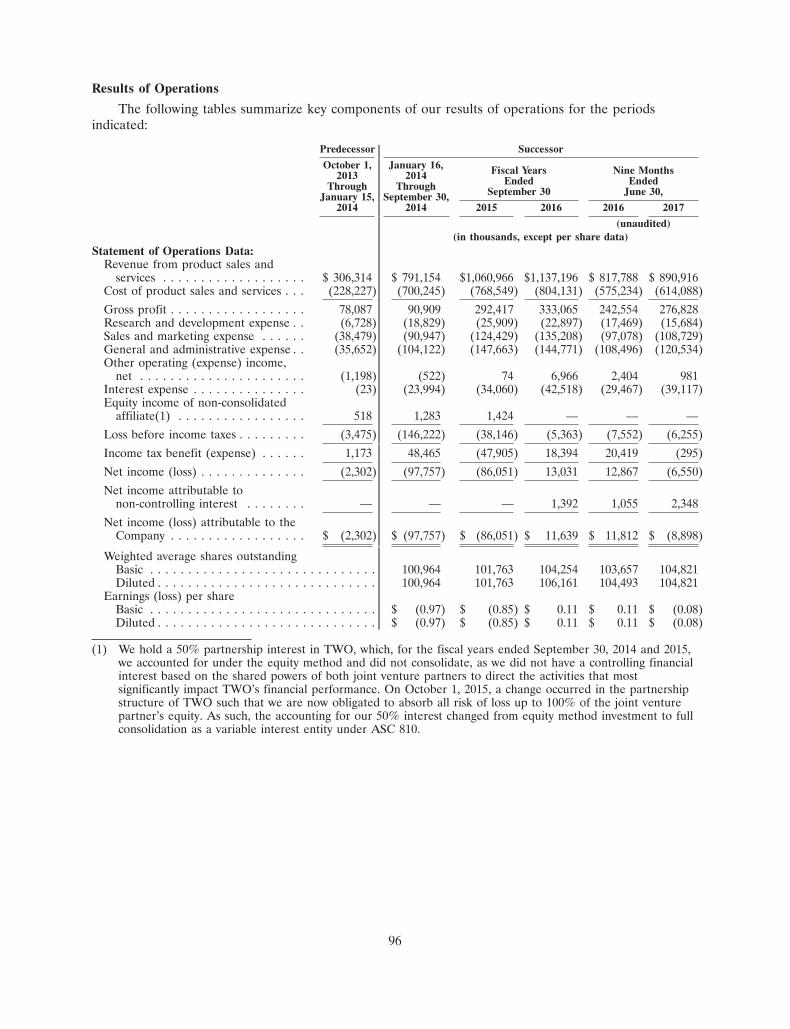
Results of Operations
The following tables summarize key components of our results of operations for the periodsindicated:
Predecessor Successor
October 1, January 16, Fiscal Years Nine Months2013 2014 Ended EndedThrough Through September 30 June 30,January 15, September 30,2014 2014 2015 2016 2016 2017
(unaudited)(in thousands, except per share data)
Statement of Operations Data:Revenue from product sales and
services . . . . . . . . . . . . . . . . . . . $ 306,314 $ 791,154 $1,060,966 $1,137,196 $ 817,788 $ 890,916Cost of product sales and services . . . (228,227) (700,245) (768,549) (804,131) (575,234) (614,088)
Gross profit . . . . . . . . . . . . . . . . . . 78,087 90,909 292,417 333,065 242,554 276,828Research and development expense . . (6,728) (18,829) (25,909) (22,897) (17,469) (15,684)Sales and marketing expense . . . . . . (38,479) (90,947) (124,429) (135,208) (97,078) (108,729)General and administrative expense . . (35,652) (104,122) (147,663) (144,771) (108,496) (120,534)Other operating (expense) income,
net . . . . . . . . . . . . . . . . . . . . . . (1,198) (522) 74 6,966 2,404 981Interest expense . . . . . . . . . . . . . . . (23) (23,994) (34,060) (42,518) (29,467) (39,117)Equity income of non-consolidated
affiliate(1) . . . . . . . . . . . . . . . . . 518 1,283 1,424 — — —
Loss before income taxes . . . . . . . . . (3,475) (146,222) (38,146) (5,363) (7,552) (6,255)
Income tax benefit (expense) . . . . . . 1,173 48,465 (47,905) 18,394 20,419 (295)
Net income (loss) . . . . . . . . . . . . . . (2,302) (97,757) (86,051) 13,031 12,867 (6,550)
Net income attributable tonon-controlling interest . . . . . . . . — — — 1,392 1,055 2,348
Net income (loss) attributable to theCompany . . . . . . . . . . . . . . . . . . $ (2,302) $ (97,757) $ (86,051) $ 11,639 $ 11,812 $ (8,898)
Weighted average shares outstandingBasic . . . . . . . . . . . . . . . . . . . . . . . . . . . . . . 100,964 101,763 104,254 103,657 104,821Diluted . . . . . . . . . . . . . . . . . . . . . . . . . . . . . 100,964 101,763 106,161 104,493 104,821
Earnings (loss) per shareBasic . . . . . . . . . . . . . . . . . . . . . . . . . . . . . . $ (0.97) $ (0.85) $ 0.11 $ 0.11 $ (0.08)Diluted . . . . . . . . . . . . . . . . . . . . . . . . . . . . . $ (0.97) $ (0.85) $ 0.11 $ 0.11 $ (0.08)
(1) We hold a 50% partnership interest in TWO, which, for the fiscal years ended September 30, 2014 and 2015,we accounted for under the equity method and did not consolidate, as we did not have a controlling financialinterest based on the shared powers of both joint venture partners to direct the activities that mostsignificantly impact TWO’s financial performance. On October 1, 2015, a change occurred in the partnershipstructure of TWO such that we are now obligated to absorb all risk of loss up to 100% of the joint venturepartner’s equity. As such, the accounting for our 50% interest changed from equity method investment to fullconsolidation as a variable interest entity under ASC 810.
96
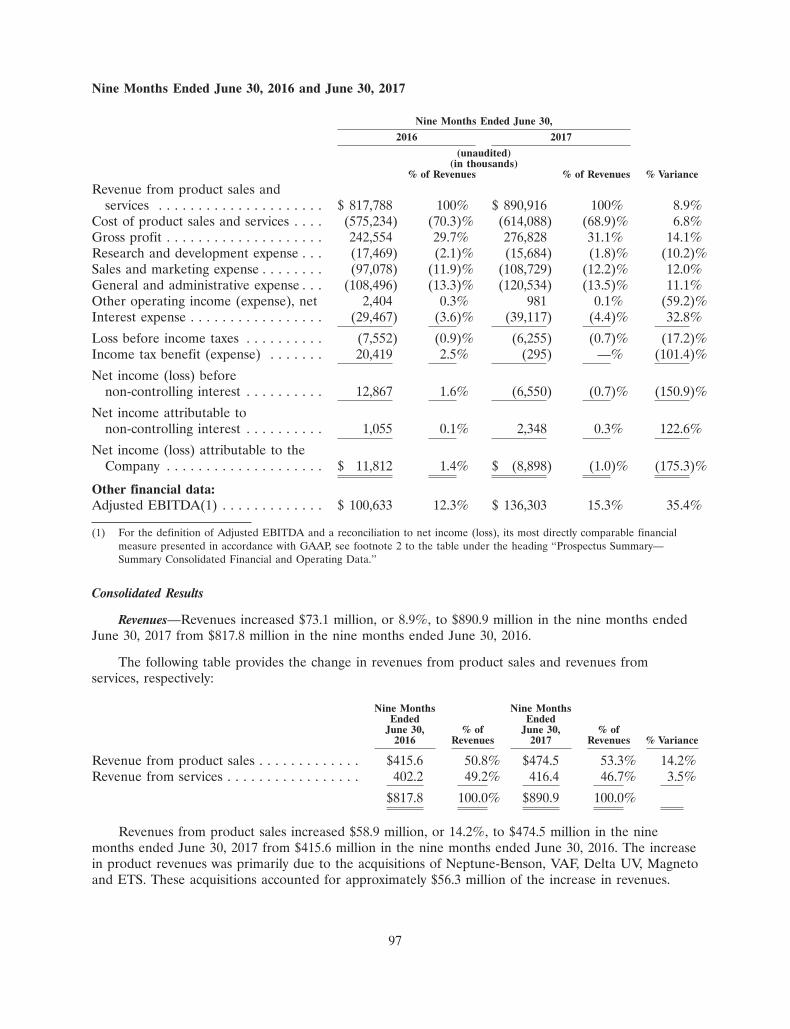
Nine Months Ended June 30, 2016 and June 30, 2017
Nine Months Ended June 30,
2016 2017
(unaudited)(in thousands)
% of Revenues % of Revenues % Variance
Revenue from product sales andservices . . . . . . . . . . . . . . . . . . . . . $ 817,788 100% $ 890,916 100% 8.9%
Cost of product sales and services . . . . (575,234) (70.3)% (614,088) (68.9)% 6.8%Gross profit . . . . . . . . . . . . . . . . . . . . 242,554 29.7% 276,828 31.1% 14.1%Research and development expense . . . (17,469) (2.1)% (15,684) (1.8)% (10.2)%Sales and marketing expense . . . . . . . . (97,078) (11.9)% (108,729) (12.2)% 12.0%General and administrative expense . . . (108,496) (13.3)% (120,534) (13.5)% 11.1%Other operating income (expense), net 2,404 0.3% 981 0.1% (59.2)%Interest expense . . . . . . . . . . . . . . . . . (29,467) (3.6)% (39,117) (4.4)% 32.8%
Loss before income taxes . . . . . . . . . . (7,552) (0.9)% (6,255) (0.7)% (17.2)%Income tax benefit (expense) . . . . . . . 20,419 2.5% (295) —% (101.4)%
Net income (loss) beforenon-controlling interest . . . . . . . . . . 12,867 1.6% (6,550) (0.7)% (150.9)%
Net income attributable tonon-controlling interest . . . . . . . . . . 1,055 0.1% 2,348 0.3% 122.6%
Net income (loss) attributable to theCompany . . . . . . . . . . . . . . . . . . . . $ 11,812 1.4% $ (8,898) (1.0)% (175.3)%
Other financial data:Adjusted EBITDA(1) . . . . . . . . . . . . . $ 100,633 12.3% $ 136,303 15.3% 35.4%
(1) For the definition of Adjusted EBITDA and a reconciliation to net income (loss), its most directly comparable financialmeasure presented in accordance with GAAP, see footnote 2 to the table under the heading ‘‘Prospectus Summary—Summary Consolidated Financial and Operating Data.’’
Consolidated Results
Revenues—Revenues increased $73.1 million, or 8.9%, to $890.9 million in the nine months endedJune 30, 2017 from $817.8 million in the nine months ended June 30, 2016.
The following table provides the change in revenues from product sales and revenues fromservices, respectively:
Nine Months Nine MonthsEnded Ended
June 30, % of June 30, % of2016 Revenues 2017 Revenues % Variance
Revenue from product sales . . . . . . . . . . . . . $415.6 50.8% $474.5 53.3% 14.2%Revenue from services . . . . . . . . . . . . . . . . . 402.2 49.2% 416.4 46.7% 3.5%
$817.8 100.0% $890.9 100.0%
Revenues from product sales increased $58.9 million, or 14.2%, to $474.5 million in the ninemonths ended June 30, 2017 from $415.6 million in the nine months ended June 30, 2016. The increasein product revenues was primarily due to the acquisitions of Neptune-Benson, VAF, Delta UV, Magnetoand ETS. These acquisitions accounted for approximately $56.3 million of the increase in revenues.
97

Additionally, there was organic revenue growth of approximately $5.0 million in the power andmicroelectronics markets in the Asia region driven by product sales of Electrodeionization equipmentin the Asia market, approximately $6.0 million related to increased Municipal wastewater business, and$0.8 million in the power market in the U.S. driven by product sales of dewatering equipment andintake screens. These revenue increases were partially offset by lower sales volumes in certain productlines, including a decline of $6.1 million in revenues related to our Municipal MEMCOR product lineas we transition to higher growth end markets in both Municipal wastewater and Industrial, a declineof $3.4 million in revenues related to our Electro-catalytic equipment sales, which provide chlorinationproducts for the global marine and hydrocarbon markets, and $1.9 million of revenue decline related toour Italian operations in the nine months ended June 30, 2016 that did not reoccur due to the winddown of our Italian operations.
Revenues from services increased $14.2 million, or 3.5%, to $416.4 million in the nine monthsended June 30, 2017 from $402.2 million in the nine months ended June 30, 2016. The increase wasdriven by organic revenue growth, including volume driven increases in Industrial service revenue ofapproximately $18.5 million associated with higher U.S. customer production levels in the generalmanufacturing and pharmaceutical and healthcare end markets and new account penetration in thepower and hydrocarbon and chemical processing end markets, and an increase of approximately$1.4 million related to our Municipal services business. These increases were offset by approximately$6.0 million in revenues related to our Vernon location in the nine months ended June 30, 2016 thatdid not reoccur because of the Vernon Disposition as of September 30, 2016.
Cost of Sales and Gross Margin—Total gross margin increased to 31.1% in the nine months endedJune 30, 2017 from 29.7% in the nine months ended June 30, 2016.
The following table provides the change in cost of product sales and cost of services, respectively,along with related gross margins:
Nine Months Ended June 30,
2016 2017
Gross GrossMargin % Margin %
Cost of product sales . . . . . . . . . . . . . . . . . . . . . . . . . . . . . . . . $287.6 30.8% $316.8 33.2%Cost of services . . . . . . . . . . . . . . . . . . . . . . . . . . . . . . . . . . . . 287.6 28.5% 297.3 28.6%
$575.2 29.7% $614.1 31.1%
Cost of product sales increased by approximately $29.2 million in the nine months ended June 30,2017 as compared to the nine months ended June 30, 2016. The increase in cost of product sales wasprimarily driven by the impact of the acquisitions of Neptune Benson, VAF, Delta UV and Magneto,which accounted for approximately $27.7 million of the increase. These accretive acquisitions were theprimary driver of the 2.4% increase in gross margin. The remaining increase in cost of product saleswas due to organic growth driven by higher sales volumes due to increased U.S. customer productionlevels in the general manufacturing and pharmaceutical and healthcare end markets and the power andmicroelectronics markets in the Asia region. These increases in cost of product sales were partiallyoffset by a decrease of $3.6 million in cost of sales related to the wind down of our Italian operations.
Cost of services increased by approximately $9.7 million in the nine months ended June 30, 2017as compared to the nine months ended June 30, 2016. The increase in cost of services was related tothe overall increase in revenue volume, which increased cost of sales by approximately $14.3 million,offset by the decrease in cost of services related to the Vernon Disposition as of September 30, 2016.
98

Operating Expenses—Operating expenses increased $21.9 million, or 9.8%, to $244.9 million in thenine months ended June 30, 2017 from $223.0 million in the nine months ended June 30, 2016. Theincrease in operating expense was primarily due to the operating expenses associated with the acquiredcompanies of Neptune-Benson, VAF, Delta UV and Magneto, which accounted for $17.4 million of theoperating expense increase. A discussion of operating expenses by category is as follows:
Research and Development Expense—Research and development expenses decreased $1.8 million,or 10.2%, to $15.7 million in the nine months ended June 30, 2017 from $17.5 million in the ninemonths ended June 30, 2016. Research and development expenses increased $0.6 million with theacquisition of Magneto and their extensive research and development programs related to anodecoatings, but was offset by decrease of approximately $1.5 million in research and developmentexpenses in connection with the consolidation and restructuring of our Singaporean research anddevelopment center as well as a reduction of approximately $0.9 million associated with thecompletion of a research and development program in the Municipal Segment in the nine monthsended June 30, 2016.
Sales and Marketing Expense—Sales and marketing expenses increased $11.6 million, or 12.0%, to$108.7 million in the nine months ended June 30, 2017 from $97.1 million in the nine monthsended June 30, 2016. The driving factor in the increase in sales and marketing expense was anincrease of $8.5 million associated with the sales and marketing activities of the acquiredcompanies of Neptune Benson, VAF, Delta UV and Magneto.
General and Administrative Expense—General and administrative expenses increased$12.0 million, or 11.1%, to $120.5 million in the nine months ended June 30, 2017 from$108.5 million in the nine months ended June 30, 2016. The acquisitions of Neptune-Benson, VAF,Delta UV, and Magneto accounted for $8.2 million of the increase. The balance of the increase ingeneral and administrative expenses was primarily due to changes in foreign currency, costs relatedto restructuring and the integration of acquisitions.
Other Operating Income (Expense), Net—Other operating income (expense), net decreased$1.4 million, or 58.3%, to $1.0 million of income in the nine months ended June 30, 2017 from$2.4 million of income in the nine months ended June 30, 2016. The net decrease in other income wasprimarily due to a gain on the sale of property in the nine months ended June 30, 2016 that did notreoccur in the nine months ended June 30, 2017.
Interest Expense—Interest expense increased $9.7 million, or 32.7%, to $39.1 million in the ninemonths ended June 30, 2017 from $29.5 million in the nine months ended June 30, 2016. The increasein interest expense was primarily due to an increase in borrowing for acquisitions, interest on capitalleases and fees associated with the Senior Secured Credit Facilities.
Income Tax Benefit (Expense)—Income tax was an expense of $0.3 million in the nine months endedJune 30, 2017 as compared to a benefit of $20.4 million in the nine months ended June 30, 2016, anincrease of 101.4%. The effective tax rate in the nine months ended June 30, 2017 was (4.7%) ascompared to 270.4% in the nine months ended June 30, 2016. The increase in tax expense wasprimarily the result of applying a higher than expected annual tax rate in a jurisdiction that excludescertain items from the valuation allowance analysis. The decrease in the effective tax rate in the ninemonths ended June 30, 2017 is attributable to higher pre-tax losses in proportion to income taxbenefits.
Net Income—Net income attributable to Evoqua Water Technologies Corp. decreased by$20.7 million, or 175.4%, to a net loss of $8.9 million for the nine months ended June 30, 2017 ascompared to net income of $11.8 million for the nine months ended June 30, 2016. This decrease wasprimarily driven by increased tax expense of $0.3 million in the nine months ended June 30, 2017 as
99
compared to a tax benefit of $20.4 million in the nine months ended June 30, 2016, a difference of$20.7 million. Furthermore, $9.6 million of additional interest expense was incurred in the nine monthsended June 30, 2017. These factors offset the increased revenue volume and profitability associatedwith the acquisitions of Neptune-Benson, VAF, Delta UV and Magneto, which accounted for$6.7 million of increased net income for the nine months ended June 30, 2017. Furthermore, increasedvolume and profitability as well as incremental benefits from restructuring activities and operationalefficiencies that were implemented in the prior year (net of charges from additional restructuringactions taken in the nine months ended June 30, 2017) contributed $2.9 million to net income for thenine months ended June 30, 2017.
Adjusted EBITDA—Adjusted EBITDA increased $35.7 million, or 35.4%, to $136.3 million for thenine months ended June 30, 2017 from $100.6 million for the nine months ended June 30, 2016.Increased volume and carry over benefits from restructuring and operational efficiencies that weimplemented in the prior year provided $21.0 million of the increase in Adjusted EBITDA.Additionally, revenue volume and profitability associated with the acquisitions of Neptune-Benson,VAF, Delta UV and Magneto contributed the remainder of the $14.7 million increase in AdjustedEBITDA.
100

Segment Results
Nine MonthsEnded June 30,
2016 2017
(unaudited)(in thousands) % Variance
RevenuesIndustrial . . . . . . . . . . . . . . . . . . . . . . . . . . . . . . . . . . . . . . . . . $443,813 $ 460,861 3.8%Municipal . . . . . . . . . . . . . . . . . . . . . . . . . . . . . . . . . . . . . . . . 199,481 198,927 (0.3)%Products . . . . . . . . . . . . . . . . . . . . . . . . . . . . . . . . . . . . . . . . . 174,494 231,128 32.5%
Total Consolidated . . . . . . . . . . . . . . . . . . . . . . . . . . . . . . . . . . $817,788 $ 890,916 8.9%
Percentage of total consolidated revenuesIndustrial . . . . . . . . . . . . . . . . . . . . . . . . . . . . . . . . . . . . . . . . . 54.3% 51.7%Municipal . . . . . . . . . . . . . . . . . . . . . . . . . . . . . . . . . . . . . . . . 24.4% 22.3%Products . . . . . . . . . . . . . . . . . . . . . . . . . . . . . . . . . . . . . . . . . 21.3% 26.0%
Total Consolidated . . . . . . . . . . . . . . . . . . . . . . . . . . . . . . . . . . 100.0% 100.0%
Operating ProfitIndustrial . . . . . . . . . . . . . . . . . . . . . . . . . . . . . . . . . . . . . . . . . $ 61,244 $ 74,501 21.6%Municipal . . . . . . . . . . . . . . . . . . . . . . . . . . . . . . . . . . . . . . . . 21,401 23,525 9.9%Products . . . . . . . . . . . . . . . . . . . . . . . . . . . . . . . . . . . . . . . . . 28,170 45,254 60.6%Corporate . . . . . . . . . . . . . . . . . . . . . . . . . . . . . . . . . . . . . . . . (88,900) (110,418) 24.9%
Total Consolidated . . . . . . . . . . . . . . . . . . . . . . . . . . . . . . . . . . $ 21,915 $ 32,862 50.0%
Operating profit as a percentage of total consolidated revenuesIndustrial . . . . . . . . . . . . . . . . . . . . . . . . . . . . . . . . . . . . . . . . . 7.5% 8.4%Municipal . . . . . . . . . . . . . . . . . . . . . . . . . . . . . . . . . . . . . . . . 2.6% 2.6%Products . . . . . . . . . . . . . . . . . . . . . . . . . . . . . . . . . . . . . . . . . 3.4% 5.1%Corporate . . . . . . . . . . . . . . . . . . . . . . . . . . . . . . . . . . . . . . . . (10.8)% (12.4)%
Total Consolidated . . . . . . . . . . . . . . . . . . . . . . . . . . . . . . . . . . 2.7% 3.7%
EBITDAIndustrial . . . . . . . . . . . . . . . . . . . . . . . . . . . . . . . . . . . . . . . . . $ 89,716 $ 102,133 13.8%Municipal . . . . . . . . . . . . . . . . . . . . . . . . . . . . . . . . . . . . . . . . 27,427 29,644 8.1%Products . . . . . . . . . . . . . . . . . . . . . . . . . . . . . . . . . . . . . . . . . 31,941 53,667 68.0%Corporate and unallocated costs . . . . . . . . . . . . . . . . . . . . . . . . (76,183) (96,754) 27.0%
Total Consolidated . . . . . . . . . . . . . . . . . . . . . . . . . . . . . . . . . . $ 72,901 $ 88,690 21.7%
EBITDA as a percentage of total consolidated revenuesIndustrial . . . . . . . . . . . . . . . . . . . . . . . . . . . . . . . . . . . . . . . . . 11.0% 11.5%Municipal . . . . . . . . . . . . . . . . . . . . . . . . . . . . . . . . . . . . . . . . 3.4% 3.3%Products . . . . . . . . . . . . . . . . . . . . . . . . . . . . . . . . . . . . . . . . . 3.9% 6.0%Corporate and unallocated costs . . . . . . . . . . . . . . . . . . . . . . . . (9.3)% (10.9)%
Total Consolidated . . . . . . . . . . . . . . . . . . . . . . . . . . . . . . . . . . 8.9% 10.0%
101

EBITDA on a segment basis is defined as earnings before interest, taxes, depreciation andamortization. The following is a reconciliation of our segment operating profit to EBITDA on asegment basis:
Nine Months Ended June 30,
2016 2017
Industrial Municipal Products Industrial Municipal Products
(unaudited)(in thousands)
Operating Profit . . . . . . . . . . . . . . . . . . . . . . . $61,244 $21,401 $28,170 $ 74,501 $23,525 $45,254Interest expense(1) . . . . . . . . . . . . . . . . . . . . . — — — — — —Income tax expense (benefit)(1) . . . . . . . . . . . . — — — — — —Depreciation and amortization . . . . . . . . . . . . . 28,472 6,026 3,771 27,632 6,119 8,413
EBITDA . . . . . . . . . . . . . . . . . . . . . . . . . . . . . $89,716 $27,427 $31,941 $102,133 $29,644 $53,667
(1) Interest expense and Income tax expense (benefit) are corporate activities that are not allocated to our three reportablesegments.
Industrial
Revenues in the Industrial Segment increased $17.0 million, or 4%, to $460.9 million in the ninemonths ended June 30, 2017 from $443.8 million in the nine months ended June 30, 2016. The increasein revenues was primarily due to an increase in service revenues of $18.3 million driven by highercustomer production levels in general manufacturing and pharmaceutical and healthcare end marketsand new account penetration in power and hydrocarbon and chemical processing end markets. Inaddition, an increase of $3.6 million of revenue was attributable to our acquisition of ETS onNovember 1, 2016. Our increased revenues were partially offset by a decrease of $6.0 million inrevenues related to the Vernon Disposition as of September 30, 2016.
Operating profit in the Industrial Segment increased $13.3 million, or 22%, to $74.5 million in thenine months ended June 30 2017 from $61.2 million in the nine months ended June 30 2016. Theincrease in operating profit was primarily related to an increase in volume of $5.3 million as well as$7.1 million of benefits experienced as a result of our Value Creator initiatives. Value Creator benefitsinclude carry over benefits from ePro initiatives that we implemented in the prior year and continuedbenefits from operational efficiencies.
EBITDA in the Industrial Segment increased $12.4 million, or 14%, to $102.1 million in the ninemonths ended June 30 2017 from $89.7 million in the nine months ended June 30 2016. The increasein EBITDA resulted from the same factors which impacted operating profit in the Industrial Segmentduring this period.
Municipal
Revenues in the Municipal Segment decreased $0.6 million, or 0.3%, to $198.9 million in the ninemonths ended June 30 2017 from $199.5 million in the nine months ended June 30 2016. The decreasein revenues was primarily related to the closure of operations in Italy of $1.9 million, but also driven bythe changes in product mix with the decline in our MEMCOR product line by $6.1 million, as wetransition to higher growth end markets in both municipal wastewater and industrial. This is offset bygrowth in both our municipal services and waste water businesses of $7.5 million as compared to theprior year.
Operating profit in the Municipal Segment increased $2.1 million, or 9.9%, to $23.5 million in thenine months ended June 30 2017 from $21.4 million in the nine months ended June 30 2016. The
102
increase in operating profit was primarily due to continued Value Creator benefits in both projectexecution and ePro of $1.3 million, benefits from the alignment to a more customer focusedorganizational structure of $1.9 million and reduced warranty expense of $0.7 million. This was partiallyoffset by declining revenue volumes and increased labor costs.
EBITDA in the Municipal Segment increased $2.2 million, or 8.1%, to $29.6 million in the ninemonths ended June 30 2017 from $27.4 million in the nine months ended June 30 2016. EBITDAincreased as a result of the same factors which impacted operating profit in the Municipal Segmentduring this period.
Products
Revenues in the Products Segment increased $56.6 million, or 32%, to $231.1 million in the ninemonths ended June 30 2017 from $174.5 million in the nine months ended June 30 2016. The increasein revenues was primarily due to the acquisitions of Neptune-Benson, VAF, Delta UV and Magneto.These acquisitions accounted for an aggregate of $52.7 million of the increased revenues. The ProductsSegment also increased revenues in the amount of $5.0 million in our power and microelectronicsmarkets in the Asia region and $0.8 million in the power market in the U.S. These increases wereprincipally due to higher product sales of electrodeionization equipment in our legal entity in China.Increases in these markets more than offset a decline of $3.3 million in the global marine andhydrocarbon markets. The downturn in these markets impacted the Products Segment sale of electro-catalytic equipment which provides chlorination products for the offshore oil and gas and marineindustries.
Operating profit in the Products Segment increased $17.1 million, or 61%, to $45.3 million in thenine months ended June 30 2017 from the $28.2 million in the nine months ended June 30 2016. Theincrease in operating profit was primarily due to the additional revenue volume and profitabilityassociated with the acquisitions of Neptune-Benson, VAF, Delta UV and Magneto. These acquisitionsaccounted for $12.7 million of the operating profit increase during the nine months ended June 302017. Operating profit in the electrodeionization equipment product lines also improved due to theincreased revenues of $5.8 million in the Asia region. This accounted for $2.0 million in additionaloperating profit. In the Electro-catalytic market, operating profits actually increased by $0.6 milliondespite the downturn due to a carryover benefit from prior year operational efficiency initiatives whichreduced operating expense. The balance of $1.8 million in operating profit resulted from otherrestructure and cost improvement activities in the Products Segment.
EBITDA in the Products Segment increased $21.7 million, or 68%, to $53.7 million in the ninemonths ended June 30 2017 from $31.9 million in the nine months ended June 30 2016 with$17.4 million attributable to the Neptune-Benson, VAF, Delta UV and Magneto. The balance of$4.3 million was due to growth in the other product lines and reduced operating expenses fromrestructuring in the prior period.
103

Fiscal Years Ended September 30, 2015 and September 30, 2016
Fiscal Years Ended September 30
2015 2016
% of Revenues % of Revenues % Variance
(in thousands)
Revenue from product sales andservices . . . . . . . . . . . . . . . . . . . . $1,060,966 100% $1,137,196 100% 7.2%
Cost of product sales and services . . . (768,549) (72.4)% (804,131) (70.7)% 4.6%Gross profit . . . . . . . . . . . . . . . . . . . 292,417 27.6% 333,065 29.3% 13.9%Research and development expense . (25,909) (2.4)% (22,897) (2.0)% (11.6)%Sales and marketing expense . . . . . . (124,429) (11.7)% (135,208) (11.9)% 8.7%General and administrative expense . (147,663) (13.9)% (144,771) (12.7)% (2.0)%Other operating income (expense),
net . . . . . . . . . . . . . . . . . . . . . . . 74 0.0% 6,966 0.6% N/MInterest expense . . . . . . . . . . . . . . . . (34,060) (3.2)% (42,518) (3.7)% 24.8%Equity income of a non-consolidated
affiliate(1) . . . . . . . . . . . . . . . . . . 1,424 0.1% — —% N/MLoss before income taxes . . . . . . . . . (38,146) (3.6)% (5,363) (0.5)% (85.9)%Income tax benefit (expense) . . . . . . (47,905) (4.5)% 18,394 1.6% 138.4%Net income (loss) . . . . . . . . . . . . . . (86,051) (8.1)% 13,031 1.1% 115.1%Net income attributable to
non-controlling interest . . . . . . . . . — —% 1,392 0.1% N/MNet income (loss) attributable to the
Company . . . . . . . . . . . . . . . . . . . $ (86,051) (8.1)% $ 11,639 1.0% 113.5%
Other financial data:Adjusted EBITDA(2) . . . . . . . . . . . . $ 119,911 11.3% $ 160,053 14.1% 33.5%
(1) We hold a 50% partnership interest in TWO, which, for the fiscal years ended September 30, 2014 and 2015, we accountedfor under the equity method and did not consolidate, as we did not have a controlling financial interest based on the sharedpowers of both joint venture partners to direct the activities that most significantly impact TWO’s financial performance.On October 1, 2015, a change occurred in the partnership structure of TWO such that we are now obligated to absorb allrisk of loss up to 100% of the joint venture partner’s equity. As such, the accounting for our 50% interest changed fromequity method investment to full consolidation as a variable interest entity under ASC 810.
(2) For the definition of Adjusted EBITDA and a reconciliation to net income (loss), its most directly comparable financialmeasure presented in accordance with GAAP, see footnote 2 to the table under the heading ‘‘Prospectus Summary—Summary Consolidated Financial and Operating Data.’’
N/M—Not meaningful
Consolidated Results
Revenues—Revenues increased $76.2 million, or 7.2%, to $1,137.2 million in the fiscal year endedSeptember 30, 2016 from $1,061.0 million in the fiscal year ended September 30, 2015.
104

The following table provides the change in revenues from product sales and revenues fromservices, respectively:
Fiscal Years Ended September 30,
2015 2016
% of Revenues % of Revenues % Variance
Revenue from product sales . . . . . . . . . . $ 533.7 50.3% $ 587.1 51.6% 10.0%Revenue from services . . . . . . . . . . . . . . 527.3 49.7% 550.1 48.4% 4.3%
$1,061.0 100.0% $1,137.2 100.0%
Revenues from product sales increased $53.4 million, or 10.0%, to $587.1 million in the fiscal yearended September 30, 2016 from $533.7 million in the fiscal year ended September 30, 2015. Theincrease in revenues was primarily due to the acquisitions of Neptune-Benson, VAF, Delta UV, ETSand Magneto. These acquisitions accounted for $44.4 million of the increase in product revenues. Otherareas of product revenue growth included an increase in the execution of capital project orders ofapproximately $17.3 million as compared to the prior year in the power and pulp and paper endmarkets, as well as an increase of approximately $7.8 million for products related to highly purifiedwater in the microelectronics and power markets with the establishment of a new legal entity and salespresence in the China market. This increase was partially offset by delays in the marine and powerproduct retrofit markets, which experienced a decrease in product revenues of approximately$14.0 million.
Revenues from services increased $22.8 million, or 4.3%, to $550.1 million in the fiscal year endedSeptember 30, 2016 from $527.3 million in the fiscal year ended September 30, 2015. Service andcapital system support revenues increased in the power, hydrocarbon and chemical processing endmarkets for approximately $6.4 million, driven by penetration into new and existing customer accounts,as well as service business growth in the Municipal Segment for approximately $4.4 million throughgeographical expansion and rollout of new service offerings. The consolidation of TWO, our jointventure that sells water management equipment and services, also accounted for approximately$11.6 million of the increase in service revenues.
Cost of Sales and Gross Margin—Total gross margin increased to 29.3% in the fiscal year endedSeptember 30, 2016 from 27.6% in the fiscal year ended September 30, 2015.
The following table provides the change in cost of product sales and cost of services, respectively,along with related gross margins:
Fiscal Years Ended September 30,
2015 2016
Gross GrossMargin % Margin %
Cost of product sales . . . . . . . . . . . . . . . . . . . . . . . . . . . . . . . . $385.2 27.8% $407.4 30.6%Cost of services . . . . . . . . . . . . . . . . . . . . . . . . . . . . . . . . . . . . 383.3 27.3% 396.8 27.9%
$768.5 27.6% $804.2 29.3%
Cost of product sales increased by approximately $22.2 million in the year ended September 30,2016 as compared to the year ended September 30, 2015. The increase in cost of sales for our productsbusiness was primarily due to the impact of the acquisitions of Neptune-Benson, VAF, Delta UV andMagneto. These acquisitions accounted for $21.2 million of the increase in cost of sales as well as acorresponding gross profit increase of approximately $23.2 million and were the primary driver of the2.8% increase in gross margin. Increases in revenues related to capital project orders and sales in themicroelectronics and power markets drove an increase in cost of sales of approximately $17.4 million,
105

however, purchasing and supply chain productivity measures that were implemented to adjust for thestandalone nature of the Company supported a reduction in cost of sales of approximately $6.2 million.Cost of product sales was also favorably impacted by the final stages of the wind down of our Italianoperations, which drove a decrease of approximately $11.7 million in cost of sales and a correspondingincrease in gross profit of $4.5 million as compared to the prior year. Additionally, commensurate withthe delays in revenues, cost of sales were reduced in the marine and power product retrofit markets byapproximately $9.7 million.
Cost of services increased approximately $13.5 million in the year ended September 30, 2016 ascompared to the year ended September 30, 2015. This was commensurate with the increase in revenuevolume, offset by the beneficial impact of various restructuring initiatives put in place over the previousperiod.
Operating Expenses—Operating expenses increased $4.9 million, or 1.6%, to $302.9 million in thefiscal year ended September 30, 2016 from $298.0 million in the fiscal year ended September 30, 2015.The largest driver in the increase in operating expenses was primarily due to the acquisitions ofNeptune-Benson, VAF and Delta UV accounting for $9.8 million of the operating expense increase andMagneto accounting for $2.7 million of the increase. These increases in operating expenses were offsetwith decreases in expenses in the other segments. A discussion of operating expenses by category is asfollows:
Research and Development Expense—Research and development expenses decreased $3.0 million,or 11.6%, to $22.9 million in the fiscal year ended September 30, 2016 from $25.9 million in thefiscal year ended September 30, 2015. Research and development expenses increased $0.2 millionwith the acquisition of Magneto and their extensive research and development programs related toanode coatings.
Sales and Marketing Expense—Sales and marketing expenses increased $10.8 million, or 8.7%, to$135.2 million in the fiscal year ended September 30, 2016 from $124.4 million in the fiscal yearended September 30, 2015. The driving factor for the increase in sales and marketing expensesassociated with reinvigoration and expansion of the sales force, which drove an increase in salariesand benefits of approximately $9.8 million, coupled with implementation of sales initiatives such astraining and rebranding, which incurred approximately $1.2 million of additional cost.
General and Administrative Expense—General and administrative expenses decreased $2.9 million,or 2.0%, to $144.8 million in the fiscal year ended September 30, 2016 from $147.7 million in thefiscal year ended September 30, 2015. The acquisitions of Neptune-Benson, VAF, Delta UV andMagneto accounted for a $11.7 million increase in general and administrative expenses, which wasoffset by a $14.6 million decrease in general and administrative expenses as a result ofrestructuring actions and other cost savings initiatives taken across the business.
Other Operating Income, Net—Other operating income increased $6.9 million to $7.0 million in thefiscal year ended September 30, 2016 from $0.1 million in the fiscal year ended September 30, 2015.The increase in other operating income was primarily due to a gain on disposal of assets, including theVernon Disposition.
Interest Expense—Interest expense increased $8.4 million, or 24.8%, to $42.5 million in the fiscalyear ended September 30, 2016 from $34.1 million in the fiscal year ended September 30, 2015. Theincrease in interest expense is due to an increase in borrowing for acquisitions, interest on capitalleases and fees associated with the Senior Secured Credit Facilities.
Income Tax Benefit (Expense)—Income tax expense decreased $66.3 million, or 138.4%, to anincome tax benefit of $18.4 million in the fiscal year ended September 30, 2016 from an expense of$47.9 million in the fiscal year ended September 30, 2015. The effective tax rate in the fiscal year
106

ended September 30, 2016 was 343.0% compared to an effective tax rate of (125.6)% in the fiscal yearended September 30, 2015. The decrease in income tax expense and effective tax rate in the fiscal yearended September 30, 2016 was primarily due to the benefit resulting from the release of valuationallowance as a result of additional deferred tax liabilities recognized in connection with theNeptune-Benson Acquisition.
Net Income—Net income increased $99.1 million, or 115.1%, to net income of $13.0 million for thefiscal year ended September 30, 2016 from a net loss of $86.1 million for the fiscal year endedSeptember 30, 2015. The primary driver of the increase in net income was the transition from a largetax expense of $47.9 million in the fiscal year ended September 30, 2015 to a tax benefit of$18.4 million in the fiscal year ended September 30, 2016, a change of approximately $66.3 million. Thechange in tax expense was related to the establishment and subsequent partial release of valuationallowance. Additional contributors to the increase in net income included the improvement in grossprofit of approximately $40.7 million driven by revenue volume and profitability as discussed above, aswell as the increase in other operating income of approximately $6.9 million discussed above. Thesecontributors to net income were offset by the overall increase in operating expenses of approximately$4.9 million.
Adjusted EBITDA—Adjusted EBITDA increased $40.2 million, or 33.5%, to $160.1 million for thefiscal year ended September 30, 2016 from $119.9 million for the fiscal year ended September 30, 2015.Increased volume and carry over benefits from restructuring and operational efficiencies that weimplemented in the prior year provided $17.1 million of the increase in Adjusted EBITDA.Additionally, revenue volume and profitability associated with the acquisitions of Neptune-Benson,VAF, Delta UV and Magneto contributed approximately $15.9 million of the increase in AdjustedEBITDA, while the final stages in closure of our Italian operations improved our profitability by$5.9 million for the fiscal year ended September 30, 2016.
107

Segment Results
Fiscal Years EndedSeptember 30,
2015 2016 % Variance
(in thousands)
RevenuesIndustrial . . . . . . . . . . . . . . . . . . . . . . . . . . . . . . . . . . . . . . . . $ 569,007 $ 604,192 6.2%Municipal . . . . . . . . . . . . . . . . . . . . . . . . . . . . . . . . . . . . . . . 273,574 278,000 1.6%Products . . . . . . . . . . . . . . . . . . . . . . . . . . . . . . . . . . . . . . . . 218,335 255,004 16.8%Other . . . . . . . . . . . . . . . . . . . . . . . . . . . . . . . . . . . . . . . . . . 50 — N/M
Total Consolidated . . . . . . . . . . . . . . . . . . . . . . . . . . . . . . . . . $1,060,966 $1,137,196 7.2%
Percentage of total consolidated revenuesIndustrial . . . . . . . . . . . . . . . . . . . . . . . . . . . . . . . . . . . . . . . . 53.6% 53.1%Municipal . . . . . . . . . . . . . . . . . . . . . . . . . . . . . . . . . . . . . . . 25.8% 24.4%Products . . . . . . . . . . . . . . . . . . . . . . . . . . . . . . . . . . . . . . . . 20.6% 22.5%
Total Consolidated . . . . . . . . . . . . . . . . . . . . . . . . . . . . . . . . . 100% 100%
Operating ProfitIndustrial . . . . . . . . . . . . . . . . . . . . . . . . . . . . . . . . . . . . . . . . $ 86,316 $ 91,396 5.9%Municipal . . . . . . . . . . . . . . . . . . . . . . . . . . . . . . . . . . . . . . . 22,141 31,287 41.3%Products . . . . . . . . . . . . . . . . . . . . . . . . . . . . . . . . . . . . . . . . 37,528 48,712 29.8%Corporate . . . . . . . . . . . . . . . . . . . . . . . . . . . . . . . . . . . . . . . (150,071) (134,240) (10.5)%
Total Consolidated . . . . . . . . . . . . . . . . . . . . . . . . . . . . . . . . . $ (4,086) $ 37,155 N/M
Operating profit as a percentage of total consolidated revenuesIndustrial . . . . . . . . . . . . . . . . . . . . . . . . . . . . . . . . . . . . . . . . 8.1% 8.0%Municipal . . . . . . . . . . . . . . . . . . . . . . . . . . . . . . . . . . . . . . . 2.1% 2.8%Products . . . . . . . . . . . . . . . . . . . . . . . . . . . . . . . . . . . . . . . . 3.5% 4.3%Corporate . . . . . . . . . . . . . . . . . . . . . . . . . . . . . . . . . . . . . . . (14.1)% (11.8)%
Total Consolidated . . . . . . . . . . . . . . . . . . . . . . . . . . . . . . . . . (0.4)% 3.3%
EBITDAIndustrial . . . . . . . . . . . . . . . . . . . . . . . . . . . . . . . . . . . . . . . . $ 116,883 $ 129,662 10.9%Municipal . . . . . . . . . . . . . . . . . . . . . . . . . . . . . . . . . . . . . . . 29,797 39,434 32.3%Products . . . . . . . . . . . . . . . . . . . . . . . . . . . . . . . . . . . . . . . . 39,223 55,099 40.5%Corporate and unallocated costs . . . . . . . . . . . . . . . . . . . . . . . (131,850) (117,751) (10.7)%
Total Consolidated . . . . . . . . . . . . . . . . . . . . . . . . . . . . . . . . . $ 54,053 $ 106,444 96.9%
EBITDA as a percentage of total consolidated revenuesIndustrial . . . . . . . . . . . . . . . . . . . . . . . . . . . . . . . . . . . . . . . . 11.0% 11.4%Municipal . . . . . . . . . . . . . . . . . . . . . . . . . . . . . . . . . . . . . . . 2.8% 3.5%Products . . . . . . . . . . . . . . . . . . . . . . . . . . . . . . . . . . . . . . . . 3.7% 4.8%Corporate and unallocated costs . . . . . . . . . . . . . . . . . . . . . . . (12.4)% (10.4)%
Total Consolidated . . . . . . . . . . . . . . . . . . . . . . . . . . . . . . . . . 5.1% 9.4%
N/M—Not meaningful
108
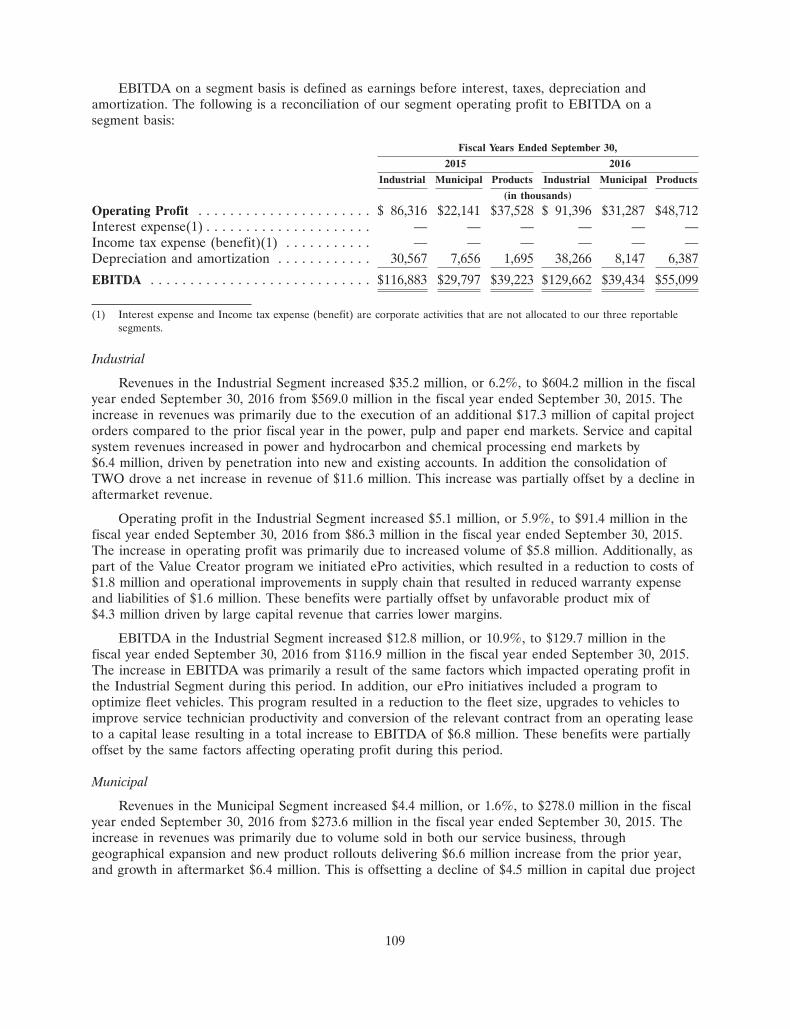
EBITDA on a segment basis is defined as earnings before interest, taxes, depreciation andamortization. The following is a reconciliation of our segment operating profit to EBITDA on asegment basis:
Fiscal Years Ended September 30,
2015 2016
Industrial Municipal Products Industrial Municipal Products
(in thousands)
Operating Profit . . . . . . . . . . . . . . . . . . . . . . $ 86,316 $22,141 $37,528 $ 91,396 $31,287 $48,712Interest expense(1) . . . . . . . . . . . . . . . . . . . . . — — — — — —Income tax expense (benefit)(1) . . . . . . . . . . . — — — — — —Depreciation and amortization . . . . . . . . . . . . 30,567 7,656 1,695 38,266 8,147 6,387
EBITDA . . . . . . . . . . . . . . . . . . . . . . . . . . . . $116,883 $29,797 $39,223 $129,662 $39,434 $55,099
(1) Interest expense and Income tax expense (benefit) are corporate activities that are not allocated to our three reportablesegments.
Industrial
Revenues in the Industrial Segment increased $35.2 million, or 6.2%, to $604.2 million in the fiscalyear ended September 30, 2016 from $569.0 million in the fiscal year ended September 30, 2015. Theincrease in revenues was primarily due to the execution of an additional $17.3 million of capital projectorders compared to the prior fiscal year in the power, pulp and paper end markets. Service and capitalsystem revenues increased in power and hydrocarbon and chemical processing end markets by$6.4 million, driven by penetration into new and existing accounts. In addition the consolidation ofTWO drove a net increase in revenue of $11.6 million. This increase was partially offset by a decline inaftermarket revenue.
Operating profit in the Industrial Segment increased $5.1 million, or 5.9%, to $91.4 million in thefiscal year ended September 30, 2016 from $86.3 million in the fiscal year ended September 30, 2015.The increase in operating profit was primarily due to increased volume of $5.8 million. Additionally, aspart of the Value Creator program we initiated ePro activities, which resulted in a reduction to costs of$1.8 million and operational improvements in supply chain that resulted in reduced warranty expenseand liabilities of $1.6 million. These benefits were partially offset by unfavorable product mix of$4.3 million driven by large capital revenue that carries lower margins.
EBITDA in the Industrial Segment increased $12.8 million, or 10.9%, to $129.7 million in thefiscal year ended September 30, 2016 from $116.9 million in the fiscal year ended September 30, 2015.The increase in EBITDA was primarily a result of the same factors which impacted operating profit inthe Industrial Segment during this period. In addition, our ePro initiatives included a program tooptimize fleet vehicles. This program resulted in a reduction to the fleet size, upgrades to vehicles toimprove service technician productivity and conversion of the relevant contract from an operating leaseto a capital lease resulting in a total increase to EBITDA of $6.8 million. These benefits were partiallyoffset by the same factors affecting operating profit during this period.
Municipal
Revenues in the Municipal Segment increased $4.4 million, or 1.6%, to $278.0 million in the fiscalyear ended September 30, 2016 from $273.6 million in the fiscal year ended September 30, 2015. Theincrease in revenues was primarily due to volume sold in both our service business, throughgeographical expansion and new product rollouts delivering $6.6 million increase from the prior year,and growth in aftermarket $6.4 million. This is offsetting a decline of $4.5 million in capital due project
109

timing. This revenue growth was also partially offset by a decline of $4.1 million in revenues due to thefinal stages in closure of our Italian operations.
Operating profit in the Municipal Segment increased $9.2 million, or 41.3%, to $31.3 million in thefiscal year ended September 30, 2016 from $22.1 million in the fiscal year ended September 30, 2015.The increase in operating profit excluding Italy was primarily due to $2.6 million from volume, and theimplementation of the Value Creator program, which delivered efficiencies in order execution and$2.8 million savings in ePro. The final stages in closure of our Italian operations improved ouroperating profit by $5.9 million, while operational efficiencies in both project execution and ePro notedabove, and continued alignment to a more customer focused organizational structure favorably drovethe results by $2.1 million. This increase was partially offset by sales investments.
EBITDA in the Municipal Segment increased $9.6 million, or 32.3%, to $39.4 million in the fiscalyear ended September 30, 2016 from $29.8 million in the fiscal year ended September 30, 2015.EBITDA increased because of the same factors that affected operating profit in the Municipal Segmentduring this period, with the addition of our fleet optimization as part of our Value Creator program,converting it from an operating lease to a capital lease driving an increase of approximately$0.8 million in EBITDA.
Products
Revenues in the Products Segment increased $36.7 million, or 16.8%, to $255.0 million in the fiscalyear ended September 30, 2016 from $218.3 million in the fiscal year ended September 30, 2015. Theincrease was primarily due to the acquisitions of Neptune-Benson, VAF, Delta UV and Magneto whichaccounted for $42.9 million of additional revenues. The increase was partially offset by delays in themarine and power product retrofit markets which experienced a decrease in product revenues of$14.0 million. Revenues for highly purified water in the microelectronics and power markets increasedby $7.8 million with the establishment of a new legal entity and sales presence in China.
Operating profit in the Products Segment increased $11.2 million, or 29.8%, to $48.7 million in thefiscal year ended September 30, 2016 from $37.5 million in the fiscal year ended September 30, 2015.The increase in operating profit was primarily due to the Neptune-Benson, VAF, Delta UV andMagneto acquisitions. The declines in operating profit in the electrochlorination, dewatering and intakeproduct lines were offset by increases in the IonPure product line with our expansion in China.
EBITDA in the Products Segment increased $15.9 million, or 40.5%, to $55.1 million in the fiscalyear ended September 30, 2016 from $39.2 million in the fiscal year ended September 30, 2015. Theincrease in EBITDA was primarily due to the Neptune-Benson, VAF, Delta UV and Magnetoacquisitions.
110

Fiscal Year Ended September 30, 2015, Successor Period 2014 and Predecessor Period 2014
Predecessor Successor
October 1, January 16,2013 2014 Fiscal Year
Through Through EndedJanuary 15, September 30, September 30,
2014 2014 2015
(in thousands)
Revenue from product sales and services . . . . . . . . . . . . . . . . . . . $ 306,314 $ 791,154 $1,060,966Cost of product sales and services . . . . . . . . . . . . . . . . . . . . . . . . (228,227) (700,245) (768,549)
Gross profit . . . . . . . . . . . . . . . . . . . . . . . . . . . . . . . . . . . . . . . . 78,087 90,909 292,417Research and development expense . . . . . . . . . . . . . . . . . . . . . . (6,728) (18,829) (25,909)Sales and marketing expense . . . . . . . . . . . . . . . . . . . . . . . . . . . (38,479) (90,947) (124,429)General and administrative expense . . . . . . . . . . . . . . . . . . . . . . (35,652) (104,122) (147,663)Other operating (expense) income, net . . . . . . . . . . . . . . . . . . . . (1,198) (522) 74Interest expense . . . . . . . . . . . . . . . . . . . . . . . . . . . . . . . . . . . . (23) (23,994) (34,060)Equity income of a non-consolidated affiliate . . . . . . . . . . . . . . . 518 1,283 1,424
Loss before income taxes . . . . . . . . . . . . . . . . . . . . . . . . . . . . . . (3,475) (146,222) (38,146)Income tax benefit (expense) . . . . . . . . . . . . . . . . . . . . . . . . . . . 1,173 48,465 (47,905)
Net income (loss) . . . . . . . . . . . . . . . . . . . . . . . . . . . . . . . . . . . $ (2,302) $ (97,757) $ (86,051)
Other financial data:Adjusted EBITDA(1) . . . . . . . . . . . . . . . . . . . . . . . . . . . . . . . . . $ 11,482 $ 105,710 $ 119,911
(1) For the definition of Adjusted EBITDA and a reconciliation to net income (loss), its most directly comparable financialmeasure presented in accordance with GAAP, see footnote 2 under the heading ‘‘Prospectus Summary—SummaryConsolidated Financial and Operating Data.’’
Consolidated Results
Revenues—Revenues were $1,061.0 million in the fiscal year ended September 30, 2015. Revenuesduring the Successor Period 2014 and the Predecessor Period 2014 were $791.2 million and$306.3 million, respectively, for a combined $1,097.5 million.
The following table delineates the change in revenues from product sales and revenues fromservices, respectively:
Predecessor Successor
October 1, January 16,2013 2014 September 30, 2015through through Combined
January 15, September 30, Combined % of % of %2014 2014 Revenues Revenues Revenues Variance
Revenue from product sales . . . . . $169.1 $414.9 $ 584.0 53.2% $ 533.7 50.3% (8.6)%Revenue from services . . . . . . . . . 137.2 376.3 513.5 46.8% 527.3 49.7% 2.7%
$306.3 $791.2 $1,097.5 100.0% $1,061.0 100.0%
Revenues from product sales decreased $50.3 million, or 8.6%, to $533.7 million in the fiscal yearended September 30, 2015 from $169.1 million and $414.9 million for the Predecessor and Successorperiods, respectively, or $584.0 million for the combined Predecessor and Successor periods in the fiscalyear ended September 30, 2014. Our fiscal 2015 performance in product revenues was impacted by thetiming of large capital project orders in the microelectronics and power markets, which experienced adecline of approximately $43.8 million year over year. Product sales associated with the hydrocarbonand marine markets also declined by approximately $10.1 million, along with an impact ofapproximately $10 million associated with weakening foreign currencies associated with the product
111

operations in Europe and Asia. This overall decline in product revenues was offset somewhat byincreases in aftermarket product sales in both the Industrial and Municipal Segments of approximately$13.8 million.
Revenue from services increased $13.8 million, or 2.7%, to $527.3 million in the fiscal year endedSeptember 30, 2015 from $137.2 million and $376.3 million for the Predecessor and Successor periods,respectively, or $513.5 million for the combined Predecessor and Successor periods in the fiscal yearended September 30, 2014. Growth in service revenues was driven primarily by $6.1 million additionalvolume within the Industrial Segment and $6.1 million additional volume in the Municipal Segment.
Cost of Sales and Gross Margin—Total gross margin increased to 27.6% in the fiscal year endedSeptember 30, 2015 from 15.4% for the combined Predecessor and Successor periods in the fiscal yearended September 30, 2014.
The following table provides the change in cost of product sales and cost of services, respectively,along with related gross margins:
Predecessor Successor
October 1, January 16,2013 2014 September 30, 2015through through Combined Combined
January 15, September 30, Cost of Gross Gross2014 2014 Sales Margin % Margin %
Cost of product sales . . . . . . . . . . . $124.8 $366.1 $490.9 15.9% $385.2 27.8%Cost of services . . . . . . . . . . . . . . . 103.4 334.1 437.5 14.8% 383.3 27.3%
$228.2 $700.2 $928.4 15.4% $768.5 27.6%
Cost of product sales decreased by approximately $105.7 million to $385.2 million in the fiscal yearended September 30, 2015 as compared to $124.8 million and $366.1 million in the Predecessor andSuccessor periods, respectively, or $490.9 million for the combined. Predecessor and Successor periodsin the fiscal year ended September 30, 2014. The cost of product sales in the combined periods of theSuccessor Period 2014 and Predecessor Period 2014 were impacted by the amortization expensing ofthe step up in inventory for approximately $18.3 million and amortization of the step up in projectbacklog of approximately $43.7 million related to the AEA Acquisition in the Successor Period 2014.Additionally, the step up in fixed assets from Successor Period 2014 to fiscal 2015 associated with theAEA Acquisition drove approximately $5.1 million in additional depreciation expense. Cost of productsales in the combined periods ended September 30, 2014 were also impacted by $6.1 million for therecognition of warranty provisions for specific product issues. The remaining decline in cost of salesfrom fiscal 2015 as compared to the Successor Period 2014 and Predecessor Period 2014 was related tothe overall decline in volume in product revenues noted above, which drove a corresponding decreasein cost of sales of approximately $37.6 million.
Cost of services decreased by approximately $54.2 million in the year ended September 30, 2015 to$383.3 million as compared to $103.4 million and $334.1 million in the Predecessor and Successorperiods, respectively, or $437.5 million for the combined Predecessor and Successor periods in the fiscalyear ended September 30, 2014. Cost of services in the combined periods ended 2014 was impacted byvarious purchase accounting items including the amortization of the step-up in project backlog ofapproximately $43.7 million in the Successor Period and accelerated depreciation of certain fixed assetsof approximately $5.1 million related to the AEA Acquisition in the Successor Period 2014.
Operating Expenses—Operating expenses were $298.0 million in the fiscal year endedSeptember 30, 2015. Operating expenses for the Successor Period 2014 and the Predecessor Period
112

2014 were $213.9 million and $80.9 million, respectively, for a combined total of $294.8 million. Adiscussion of operating expenses by category is as follows:
Research and Development Expense—Research and development expenses were $25.9 million inthe fiscal year ended September 30, 2015. Research and development expenses during theSuccessor Period 2014 and the Predecessor Period 2014 were $18.8 million and $6.7 million,respectively, for a combined $25.5 million. There were no significant changes during this periodother than normal currency fluctuations and inflation explaining the increase in research anddevelopment expenses of $0.4 million.
Sales and Marketing Expense—Sales and marketing expenses were $124.4 million in the fiscal yearended September 30, 2015. Sales and marketing expenses during the Successor Period 2014 andthe Predecessor Period 2014 were $90.9 million and $38.5 million, respectively, for a combined$129.4 million. The decrease in sales and marketing expenses is attributable to cost savingsassociated with restructure and reorganization.
General and Administrative Expense—General and administrative expenses were $147.7 million inthe fiscal year ended September 30, 2015. General and administrative expenses during theSuccessor Period 2014 and the Predecessor Period 2014 were $104.1 million and $35.7 million,respectively, for a combined $139.8 million. The increase in general and administrative expenseswas principally attributable to increased costs of restructure and reorganization.
Other Operating (Expense) Income, Net—Other operating income was $0.1 million in the fiscal yearended September 30, 2015. Other operating expense for the Successor Period 2014 and the PredecessorPeriod 2014 was $0.5 million and $1.2 million, respectively, for a combined total of $1.7 million. Ourperformance in other operating income was primarily impacted by the gain on disposal of fixed assets.
Interest Expense—Interest expenses were $34.1 million in the fiscal year ended September 30, 2015.Interest expenses during the Successor Period 2014 and the Predecessor Period 2014 were $24.0 millionand $0.0 million, respectively for a combined $24.0 million. The increase in interest expense isexplained by our senior secured credit facility being in place for a full year in fiscal 2015 as comparedto only 8.5 months in the Successor Period 2014. The senior secured credit facility was not in placeduring the Predecessor Period 2014.
Income Tax Benefit (Expense)—Income tax expense was $47.9 million in the fiscal year endedSeptember 30, 2015. Income tax benefit for the Successor Period 2014 and the Predecessor Period 2014was $48.5 million and $1.2 million, respectively. The effective tax rate in the fiscal year endedSeptember 30, 2015 was (125.6)%. We experienced an increase in income tax expense and effective taxrate in the fiscal year ended September 30, 2015 primarily due to the establishment of valuationreserves of $63.5 million against our net deferred tax assets.
Net Loss—Net loss was $86.1 million for the fiscal year ended September 30, 2015. Net loss duringthe Successor Period 2014 and the Predecessor Period 2014 were a loss of $97.8 million and$2.3 million, respectively, for a combined loss of $100.1 million. The improvement in net loss in fiscal2015 as compared to the prior periods was primarily related to the significant charges incurred in theSuccessor period related to the AEA Acquisition, including $18.3 million in amortization of inventorystep-up, amortization of $87.4 million in project backlog intangible and an additional $10.1 million infixed asset depreciation, which combined for total charges of approximately $115.8 million. Thesecharges did not reoccur for the fiscal year ended September 30, 2016. However, we recognized anincome tax charge for establishment of valuation reserves against our net deferred tax assets of$63.5 million, which drove overall income tax expense of $47.9 million for the year endedSeptember 30, 2015 as compared to a combined income tax benefit of $49.7 million for the Successorand Predecessor periods. The impact of these activities were the primary drivers of the overall changein net loss period over period.
113
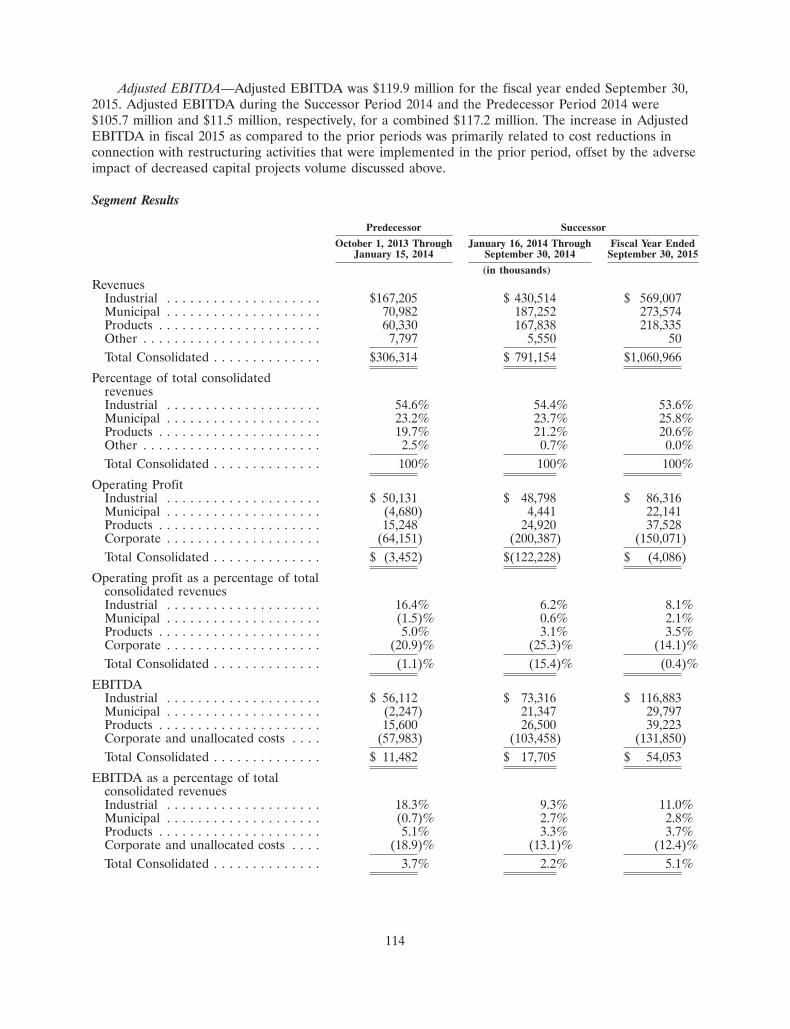
Adjusted EBITDA—Adjusted EBITDA was $119.9 million for the fiscal year ended September 30,2015. Adjusted EBITDA during the Successor Period 2014 and the Predecessor Period 2014 were$105.7 million and $11.5 million, respectively, for a combined $117.2 million. The increase in AdjustedEBITDA in fiscal 2015 as compared to the prior periods was primarily related to cost reductions inconnection with restructuring activities that were implemented in the prior period, offset by the adverseimpact of decreased capital projects volume discussed above.
Segment Results
Predecessor Successor
October 1, 2013 Through January 16, 2014 Through Fiscal Year EndedJanuary 15, 2014 September 30, 2014 September 30, 2015
(in thousands)Revenues
Industrial . . . . . . . . . . . . . . . . . . . . $167,205 $ 430,514 $ 569,007Municipal . . . . . . . . . . . . . . . . . . . . 70,982 187,252 273,574Products . . . . . . . . . . . . . . . . . . . . . 60,330 167,838 218,335Other . . . . . . . . . . . . . . . . . . . . . . . 7,797 5,550 50Total Consolidated . . . . . . . . . . . . . . $306,314 $ 791,154 $1,060,966
Percentage of total consolidatedrevenuesIndustrial . . . . . . . . . . . . . . . . . . . . 54.6% 54.4% 53.6%Municipal . . . . . . . . . . . . . . . . . . . . 23.2% 23.7% 25.8%Products . . . . . . . . . . . . . . . . . . . . . 19.7% 21.2% 20.6%Other . . . . . . . . . . . . . . . . . . . . . . . 2.5% 0.7% 0.0%Total Consolidated . . . . . . . . . . . . . . 100% 100% 100%
Operating ProfitIndustrial . . . . . . . . . . . . . . . . . . . . $ 50,131 $ 48,798 $ 86,316Municipal . . . . . . . . . . . . . . . . . . . . (4,680) 4,441 22,141Products . . . . . . . . . . . . . . . . . . . . . 15,248 24,920 37,528Corporate . . . . . . . . . . . . . . . . . . . . (64,151) (200,387) (150,071)Total Consolidated . . . . . . . . . . . . . . $ (3,452) $(122,228) $ (4,086)
Operating profit as a percentage of totalconsolidated revenuesIndustrial . . . . . . . . . . . . . . . . . . . . 16.4% 6.2% 8.1%Municipal . . . . . . . . . . . . . . . . . . . . (1.5)% 0.6% 2.1%Products . . . . . . . . . . . . . . . . . . . . . 5.0% 3.1% 3.5%Corporate . . . . . . . . . . . . . . . . . . . . (20.9)% (25.3)% (14.1)%Total Consolidated . . . . . . . . . . . . . . (1.1)% (15.4)% (0.4)%
EBITDAIndustrial . . . . . . . . . . . . . . . . . . . . $ 56,112 $ 73,316 $ 116,883Municipal . . . . . . . . . . . . . . . . . . . . (2,247) 21,347 29,797Products . . . . . . . . . . . . . . . . . . . . . 15,600 26,500 39,223Corporate and unallocated costs . . . . (57,983) (103,458) (131,850)Total Consolidated . . . . . . . . . . . . . . $ 11,482 $ 17,705 $ 54,053
EBITDA as a percentage of totalconsolidated revenuesIndustrial . . . . . . . . . . . . . . . . . . . . 18.3% 9.3% 11.0%Municipal . . . . . . . . . . . . . . . . . . . . (0.7)% 2.7% 2.8%Products . . . . . . . . . . . . . . . . . . . . . 5.1% 3.3% 3.7%Corporate and unallocated costs . . . . (18.9)% (13.1)% (12.4)%Total Consolidated . . . . . . . . . . . . . . 3.7% 2.2% 5.1%
114
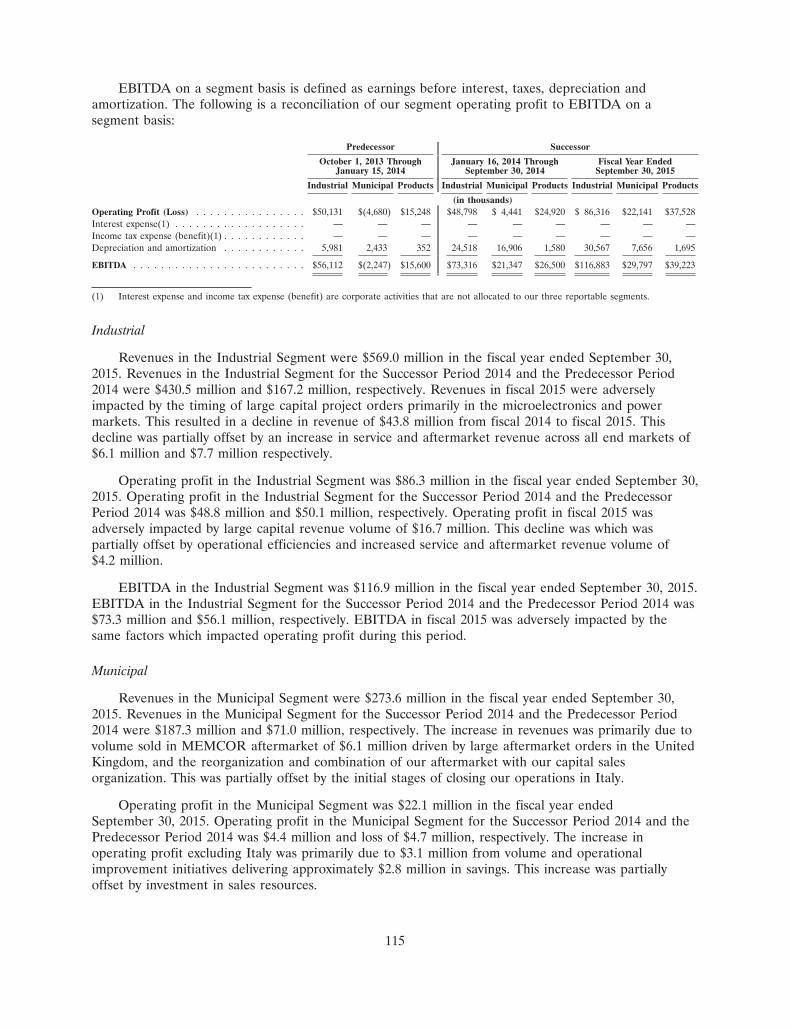
EBITDA on a segment basis is defined as earnings before interest, taxes, depreciation andamortization. The following is a reconciliation of our segment operating profit to EBITDA on asegment basis:
Predecessor Successor
October 1, 2013 Through January 16, 2014 Through Fiscal Year EndedJanuary 15, 2014 September 30, 2014 September 30, 2015
Industrial Municipal Products Industrial Municipal Products Industrial Municipal Products
(in thousands)Operating Profit (Loss) . . . . . . . . . . . . . . . . $50,131 $(4,680) $15,248 $48,798 $ 4,441 $24,920 $ 86,316 $22,141 $37,528Interest expense(1) . . . . . . . . . . . . . . . . . . . — — — — — — — — —Income tax expense (benefit)(1) . . . . . . . . . . . . — — — — — — — — —Depreciation and amortization . . . . . . . . . . . . 5,981 2,433 352 24,518 16,906 1,580 30,567 7,656 1,695
EBITDA . . . . . . . . . . . . . . . . . . . . . . . . . $56,112 $(2,247) $15,600 $73,316 $21,347 $26,500 $116,883 $29,797 $39,223
(1) Interest expense and income tax expense (benefit) are corporate activities that are not allocated to our three reportable segments.
Industrial
Revenues in the Industrial Segment were $569.0 million in the fiscal year ended September 30,2015. Revenues in the Industrial Segment for the Successor Period 2014 and the Predecessor Period2014 were $430.5 million and $167.2 million, respectively. Revenues in fiscal 2015 were adverselyimpacted by the timing of large capital project orders primarily in the microelectronics and powermarkets. This resulted in a decline in revenue of $43.8 million from fiscal 2014 to fiscal 2015. Thisdecline was partially offset by an increase in service and aftermarket revenue across all end markets of$6.1 million and $7.7 million respectively.
Operating profit in the Industrial Segment was $86.3 million in the fiscal year ended September 30,2015. Operating profit in the Industrial Segment for the Successor Period 2014 and the PredecessorPeriod 2014 was $48.8 million and $50.1 million, respectively. Operating profit in fiscal 2015 wasadversely impacted by large capital revenue volume of $16.7 million. This decline was which waspartially offset by operational efficiencies and increased service and aftermarket revenue volume of$4.2 million.
EBITDA in the Industrial Segment was $116.9 million in the fiscal year ended September 30, 2015.EBITDA in the Industrial Segment for the Successor Period 2014 and the Predecessor Period 2014 was$73.3 million and $56.1 million, respectively. EBITDA in fiscal 2015 was adversely impacted by thesame factors which impacted operating profit during this period.
Municipal
Revenues in the Municipal Segment were $273.6 million in the fiscal year ended September 30,2015. Revenues in the Municipal Segment for the Successor Period 2014 and the Predecessor Period2014 were $187.3 million and $71.0 million, respectively. The increase in revenues was primarily due tovolume sold in MEMCOR aftermarket of $6.1 million driven by large aftermarket orders in the UnitedKingdom, and the reorganization and combination of our aftermarket with our capital salesorganization. This was partially offset by the initial stages of closing our operations in Italy.
Operating profit in the Municipal Segment was $22.1 million in the fiscal year endedSeptember 30, 2015. Operating profit in the Municipal Segment for the Successor Period 2014 and thePredecessor Period 2014 was $4.4 million and loss of $4.7 million, respectively. The increase inoperating profit excluding Italy was primarily due to $3.1 million from volume and operationalimprovement initiatives delivering approximately $2.8 million in savings. This increase was partiallyoffset by investment in sales resources.
115

EBITDA in the Municipal Segment was $29.8 million in the fiscal year ended September 30, 2015.EBITDA in the Municipal Segment for the Successor Period 2014 and the Predecessor Period 2014 was$21.3 million and a loss of $2.2 million, respectively. EBITDA increased because of the same factorsthat affected operating profit in the Municipal Segment during this period.
Products
Revenues in the Products Segment were $218.3 million in the fiscal year ended September 30,2015. Revenues in the Products Segment for the Successor Period 2014 and the Predecessor Period2014 were $167.8 million and $60.3 million, respectively. The decrease in revenues in the ProductsSegment in fiscal 2015 was affected by the timing of capital project orders in the hydrocarbon andmarine markets and weakening foreign currencies impacting the product operations in the Europe andAsia. The impacts to revenues in these markets was partially offset by revenue increases in themicroelectronic market in Asia.
Operating profit in the Products Segment was $37.5 million in the fiscal year ended September 30,2015. Operating profit in the Products Segment for the Successor Period 2014 and the PredecessorPeriod 2014 was $24.9 million and $15.2 million, respectively. Operating profit in fiscal 2015 wasadversely impacted by delays in our capital projects, weakening foreign currencies and investmentsbeing made in additional sales resources for the Products Segment, which was partially offset by areduction in operating expense for back-office functions.
EBITDA in the Products Segment was $39.2 million in the fiscal year ended September 30, 2015.EBITDA in the Products Segment for the Successor Period 2014 and the Predecessor Period 2014 was$26.5 million and $15.6 million, respectively. EBITDA in fiscal 2015 was adversely impacted by thecapital projects and currency impacts that affected our operating profit in the same period, partiallyoffset by cost reductions related to operational improvement initiatives.
Liquidity and Capital Resources
Liquidity describes the ability of a company to generate sufficient cash flows to meet the cashrequirements of its business operations, including working capital needs, debt service, acquisitions,other commitments and contractual obligations. We consider liquidity in terms of cash flows fromoperations and their sufficiency to fund our operating and investing activities.
Our principal sources of liquidity are our cash generated by operating activities and borrowingsunder our Revolving Credit Facility. Historically, we have financed our operations primarily from cashgenerated from operations and periodic borrowings under our Revolving Credit Facility. Our primarycash needs are for day to day operations, to pay interest and principal on our indebtedness, to fundworking capital requirements and to make capital expenditures.
We expect to continue to finance our liquidity requirements through internally generated funds,the proceeds of this offering and borrowings under our Revolving Credit Facility. We believe that ourprojected cash flows generated from operations, together with a portion of the proceeds of this offeringand borrowings under our Revolving Credit Facility are sufficient to fund our principal debt payments,interest expense, our working capital needs and our expected capital expenditures for the next twelvemonths. We currently anticipate incurring between $55 million and $60 million of capital expendituresduring fiscal 2017. However, our budgeted capital expenditures can vary from period to period basedon the nature of capital intensive project awards. We may draw on our Revolving Credit Facility fromtime to time to fund or partially fund an acquisition.
In connection with the AEA Acquisition, we entered into the Senior Secured Credit Facilities,which originally consisted of (a) a seven-year $505.0 million senior secured first lien term loan facility,
116
scheduled to mature on January 15, 2021 and a $75.0 million senior secured revolving credit facility,scheduled to mature on January 15, 2019 and (b) a seven-year $75.0 million senior secured second lienterm loan facility, scheduled to mature on January 15, 2022 (which is no longer outstanding). OnApril 15, 2016, we entered into an amendment to the First Lien Credit Agreement, to borrow anadditional $185.0 million of term loans under the Term Loan Facility to fund a portion of theconsideration for the Neptune-Benson Acquisition. On October 28, 2016, we entered into the October2016 Refinancing to (i) borrow an additional $150.0 million of term loans under the Term Loan Facilityto fund our repayment in full of the Second Lien Facility and revolving credit loans then outstandingand (ii) increase commitments under the Revolving Credit Facility by $20.0 million to a total of$95.0 million. On August 8, 2017, we entered into the August 2017 Refinancing pursuant to which we(i) borrowed approximately $262.7 million in refinancing term loans, the net proceeds of which wereused to refinance in their entirety the NB Incremental Loans and (ii) increased the amount of ourexisting Term Loan Facility by borrowing $80.0 million of incremental term loans under the Term LoanFacility, the net proceeds of which were used to repay $60.0 million of revolving credit loans thenoutstanding under the Revolving Credit Facility and to pay related fees and expenses, and for othergeneral corporate purposes (including permitted acquisitions and permitted investments pursuant to theFirst Lien Credit Agreement). Our Senior Secured Credit Facilities also include an uncommittedincremental facility, which, subject to certain conditions, provides for additional term loans and/orrevolving loans in an aggregate amount that does not cause our first lien net leverage ratio to exceed4.50 to 1.00 (calculated as the ratio of consolidated funded first lien debt for borrowed money (net ofunrestricted cash and cash equivalents) to trailing four-quarter Consolidated EBITDA (as definedtherein), plus an additional $100 million (excluding incremental revolving credit loans or increases inrevolving credit commitments not exceeding $30.0 million) (all of which remained available as ofJune 30, 2017).
As of June 30, 2017, we had total indebtedness of $893.2 million, including $818.7 million ofborrowings under the Term Loan Facility, $60.0 million in borrowings under the Revolving CreditFacility and $7.5 million of letters of credit issued under the Revolving Credit Facility, with$27.5 million in additional borrowing capacity thereunder. An additional $8.4 million of letters of creditwere issued under a separate uncommitted facility as of June 30, 2017.
The Senior Secured Credit Facilities contain a number of covenants imposing certain restrictionson our business. These restrictions may affect our ability to operate our business and may limit ourability to take advantage of potential business opportunities as they arise. The restrictions thesecovenants place on our business operations, include limitations on our or our subsidiaries’ ability to:
• incur or guarantee additional indebtedness;
• make certain investments;
• pay dividends or make distributions on our capital stock;
• sell assets, including capital stock of restricted subsidiaries;
• agree to payment restrictions affecting our restricted subsidiaries;
• consolidate, merge, sell or otherwise dispose of all or substantially all of our assets;
• enter into transactions with our affiliates;
• incur liens; or
• designate any of our subsidiaries as unrestricted subsidiaries.
117

Evoqua Water Technologies Corp. is a holding company that does not conduct any businessoperations of its own. As a result, our ability to pay cash dividends on our common stock, if any, isdependent upon cash dividends and distributions and other transfers from our operating subsidiaries.Under the terms of our Senior Secured Credit Facilities, our operating subsidiaries are currently limitedin their ability to pay cash dividends to Evoqua Water Technologies Corp., and we expect theselimitations to continue in the future under the terms of any future credit agreement or any future debtor preferred equity securities of ours or of our subsidiaries.
In addition, our Revolving Credit Facility, but not the Term Loans, contains a financial covenantwhich requires us to comply with the maximum first lien net leverage ratio of 5.55 to 1.00 as of the lastday of any quarter on which the aggregate amount of revolving loans and letters of credit outstandingunder the Revolving Credit Facility (net of cash collateralized letters of credit and undrawn outstandingletters of credit in an amount of up to 50% of the Revolving Credit Facility) exceeds 25% of the totalcommitments thereunder.
As of September 30, 2016 and June 30, 2017, we were in compliance with the covenants containedin the Senior Secured Credit Facilities.
Our indebtedness could adversely affect our ability to raise additional capital, limit our ability toreact to changes in the economy or our industry, expose us to interest rate risk and prevent us frommeeting our obligations. See ‘‘Risk Factors—Risks Relating to Our Indebtedness—Our substantialindebtedness could adversely affect our financial condition and limit our ability to raise additionalcapital to fund our operations.’’
Cash Flows
The following table summarizes the changes to our cash flows for the periods presented:
Predecessor Successor
October 1, January 16, Years Ended Nine Months Ended2013 Through 2014 Through September 30, June 30,January 15, September 30,2014 2014 2015 2016 2016 2017
(in thousands) (unaudited)
Statement of Cash FlowsDataNet cash provided by
(used in) operatingactivities . . . . . . . . . . . $ 45,577 $ 37,478 $ 41,944 $ 31,919 $ 10,655 $ 15,793
Net cash provided by(used in) investingactivities . . . . . . . . . . . (7,524) (762,087) (46,866) (344,610) (331,227) (117,266)
Net cash provided by(used in) financingactivities . . . . . . . . . . . 89,901 911,444 (6,263) 191,389 199,067 104,449
Effect of exchange ratechanges on cash . . . . . . (243) (1,399) (5,225) 2,637 369 680
Change in cash and cashequivalents . . . . . . . . . $127,711 $ 185,436 $(16,410) $(118,665) $(121,136) $ 3,656
118

Operating Activities
Cash flows from operating activities can fluctuate significantly from period-to-period as workingcapital needs and the timing of payments for restructuring activities and other items impact reportedcash flows.
Net cash provided by operating activities increased to $15.8 million in the nine months endedJune 30, 2017 from $10.7 million in the nine months ended June 30, 2016.
• Operating cash flows in the nine months ended June 30, 2017 reflect a decrease in net incomeof $19.4 million as compared to the comparable period in 2016 and increased non-cash chargesof $28.5 million primarily relating to deferred taxes and increased depreciation and amortization.The increased deferred tax impacts relate to increases in valuation allowances as compared tothe nine months ended June 30, 2016 driven by realizing tax expense in a jurisdiction thatexcludes certain items from the valuation allowance analysis. The increased depreciation andamortization expense primarily relates to the amortization of intangible assets acquired inconnection with the AEA Acquisition in fiscal 2014 and additional intangible assets obtainedthrough various acquisitions completed in fiscal 2016 and fiscal 2017.
• The aggregate of receivables, inventories, cost and earnings in excess of billings on uncompletedcontracts, accounts payable and billings in excess of costs incurred on uncompleted contractsused $24.1 million in operating cash flows in the nine months ended June 30, 2017 compared to$11.4 million in operating cash flows in the comparable period in 2016. The amount of cash flowgenerated from or used by the above mentioned accounts depends upon how effectively wemanage our cash conversion cycle, which is a representation of the number of days that elapsefrom the date of purchase of raw materials and components to the collection of cash fromcustomers. Our cash conversion cycle can be significantly impacted by the timing of collectionsand payments in a period. Further, as it relates to capital projects, fiscal 2016 represented acontinued rebuilding of the pipeline of capital projects as compared to the period prior to theAEA Acquisition, which represented a depletion of the pipeline of capital projects. This build-upof capital project activity contributed to the variability of accounts receivable, inventories, excessbillings on uncompleted contracts or billings in excess of costs incurred on uncompletedcontracts from period to period.
• The aggregate of prepaid expense and other assets and other non-current assets and liabilitiesused $3.9 million in operating cash flows in the nine months ended June 30, 2017 compared to$7.9 million provided in the comparable period of 2016. The use of operational cash flow in theperiod ended June 30, 2017 was primarily related to the continued payments received from anoutstanding lease receivable, offset by an $8.3 million increase in capital lease liabilities. Theincrease in capital leases of approximately $6.6 million was the primary driver of operationalcash flows in fiscal 2016.
• Accrued expenses and other liabilities used $10.7 million in operating cash flows in the ninemonths ended June 30, 2017 compared to a use of $32.8 million in the comparable period of2016. The use of operational cash flow in both periods resulted primarily from the timing ofcash payments for various employee-related liabilities.
Net cash provided by operating activities decreased $10.0 million to $31.9 million in the fiscal yearended September 30, 2016 from $41.9 million in the fiscal year ended September 30, 2015. Thisdecrease was primarily due to the following:
• Operating cash flows in the fiscal year ended September 30, 2016 reflected an increase in netincome of $99.1 million from fiscal 2015. Net income in fiscal 2016 included a benefit from therelief of the income tax valuation allowance of $15.4 million compared to establishing an incometax valuation allowance of $63.3 million in fiscal 2015. Additionally in fiscal 2016, net income
119

included the non-cash impact of foreign currency losses for intracompany loans primarilydenominated in euro of $0.1 million compared to $19.3 million in fiscal 2015.
• The aggregate of receivables, inventories, cost and earnings in excess of billings on uncompletedcontracts, accounts payable and billings in excess of costs incurred on uncompleted contractsused $14.5 million in operating cash flows in fiscal 2016 compared to $19.9 million of operatingcash flows provided in fiscal 2015. The amount of cash flow generated from or used by theabove mentioned accounts depends upon how effectively we manage our cash conversion cycle,which is a representation of the number of days that elapse from the date of purchase of rawmaterials and components to the collection of cash from customers. Our cash conversion cyclecan be significantly impacted by the timing of collections and payments in a period. Further, asit relates to capital projects, fiscal 2016 represented a continued rebuilding of the pipeline ofcapital projects as compared to the period prior to the AEA Acquisition, which represented adepletion of the pipeline of capital projects. This build-up of capital project activity contributedto the variability of accounts receivable, inventories, excess billings on uncompleted contracts orbillings in excess of costs incurred on uncompleted contracts from period to period.
• Accrued expenses and other liabilities used $31.4 million in operating cash flows in fiscal 2016compared to $14.6 million used in fiscal 2015. This increased use of operational cash flowresulted primarily from the timing of cash payments for various employee-related and otherrestructuring activities during fiscal 2016 compared to fiscal 2015.
• The aggregate of non-current assets and non-current liabilities provided $16.0 million inoperating cash flows in fiscal 2016 compared to $3.2 million used in fiscal 2015. The cash flowsrelated to this increase in fiscal 2016 include an increase in pension liabilities of $8.1 millioncompared to a decrease of pension liability of $0.3 million in fiscal 2015, driven by declines indiscount rates used to value projected benefit obligations. Additionally, $8.8 million of long termcapital leases were entered into in fiscal 2016.
Net cash provided by operating activities decreased $41.2 million to $41.9 million in the fiscal yearended September 30, 2015 from $37.5 million in the Successor Period 2014 and $45.6 million in thePredecessor Period 2014. This decrease was primarily due to the following:
• Fiscal 2015 operating cash flows reflected a decrease in net loss of $14.0 million as compared tothe comparable 2014 period. The Successor Period 2014 included a tax benefit of $48.5 million.In fiscal 2015, net loss included a valuation allowance on deferred tax assets of $63.5 million.Additionally, net loss in the Predecessor and Successor periods 2014 included depreciation andamortization of $154.9 million compared to $58.1 million in fiscal 2015 primarily resulting from$87.4 million of backlog (useful life of one year) amortization recognized in the Successor Periodof 2014. Intangible amortization expense primarily relates to the amortization of intangible assetsacquired in connection with the AEA Acquisition. Additionally, in fiscal 2015, net loss includeda non-cash impact of foreign currency losses for intracompany loans primarily denominated ineuro of $19.3 million compared to $6.8 million in Successor Period 2014.
• In fiscal 2014, operating cash flow included the build-up a $36.3 million payment on balancesdue to affiliates of the Predecessor which were settled as part of the AEA Acquisition.
• The aggregate of receivables, inventories, cost and earnings in excess of billings on uncompletedcontracts, accounts payable and billings in excess of costs incurred on uncompleted contractsprovided $19.9 million in operating cash flows in fiscal 2015 compared to $55.8 million ofoperating cash flows provided in fiscal 2014. The amount of cash flow generated from or used bythe above mentioned accounts depends upon how effectively we manage our cash conversioncycle, which is a representation of the number of days that elapse from the date of purchase ofraw materials and components to the collection of cash from customers. Our cash conversioncycle can be significantly impacted by the timing of collections and payments in a period.
120

Further, as it relates to capital projects, fiscal 2015 represented a rebuilding of the pipeline ofcapital projects, as compared to the period prior to the AEA Acquisition, which represented adepletion of the pipeline of capital projects. This build-up of capital project activity contributedto the variability accounts receivable, inventories, of excess billings on uncompleted contracts orbillings in excess of costs incurred on uncompleted contracts from period to period.
• Prepaid expense and other assets provided $4.3 million in operating cash flows in fiscal 2015compared to $17.3 million provided in fiscal 2014. This change in operational cash flow resultedprimarily from the timing of cash payments for income taxes and prepaid rents during fiscal2015 compared to fiscal 2014.
Investing Activities
Net cash used in investing activities decreased $214.0 million from $331.3 million in the ninemonths ended June 30, 2016 to $117.3 million in the nine months ended June 30, 2017. This decreasewas largely driven by the relative size of acquisitions completed during the comparative periods. Duringthe nine months ended June 30, 2016 we completed the acquisitions of Magneto and Neptune-Benson,requiring a net cash outlay of $299.6 million, while the acquisitions of ETS, Noble, Olson and ADIcompleted during the nine months ended June 30, 2017, were significantly smaller, requiring a net cashoutlay of only $77.8 million. This reduction in net cash used in acquisitions was offset, in part, by aperiod over period increase of $5.8 million in cash outlays for the purchase of property, plant andequipment in support of customer orders, and a period over period increase of $3.9 million in cashoutlays for intangible assets related to the purchase of software licenses with varying useful lives.
Net cash used in investing activities increased $297.7 million from $46.9 million in the fiscal yearended September 30, 2015 to $344.6 million in the fiscal year ended September 30, 2016. This increasewas primarily due to the acquisitions of Neptune Benson, Magneto, VAF and Delta UV, which wereconsummated during fiscal 2016 with a total cash outlay of $306.4 million. This cash outlay onacquisitions was offset, in part, by proceeds of $4.5 million from the Vernon Disposition, and$5.2 million on the sale of vacant facilities.
Net cash used in investing activities decreased $722.7 million to $46.9 million in the fiscal yearended September 30, 2015 from $762.1 million in the Successor Period 2014 and $7.5 million in thePredecessor Period 2014. This decrease primarily resulted from the occurrence of the AEA Acquisitionin fiscal 2014 for $730.6 million, which did not recur in fiscal 2015. The overall decrease in net cashused in investing activities was partially offset by a $7.4 million increase in purchases of property, plantand equipment related to ongoing maintenance of our facilities and equipment.
Financing Activities
Net cash provided by financing activities decreased $94.6 million from $199.1 million of net cashprovided by financing activities in the nine months ended June 30, 2016 to net cash provided byfinancing activities of $104.4 million in the nine months ended June 30, 2017. This lower amount ofcash provided by financing activities in the nine months ended June 30, 2017 was primarily due tohigher repayment of outstanding debt. During the nine months ending June 30, 2017, we refinanced$75.0 million of our Second Lien Facilities into the First Lien Facilities and used proceeds from ourRevolving Credit Facility for two acquisitions which closed in June 2017. In addition, we continued torepay debt in accordance with each applicable credit agreement’s terms, including repayment ofamounts borrowed from the Revolving Credit Facility during fiscal 2016.
Net cash provided by financing activities increased $197.7 million from $6.3 million of net cashused in financing activities in the fiscal year ended September 30, 2015 to net cash provided byfinancing activities of $191.4 million in the fiscal year ended September 30, 2016. This increase wasprimarily due to issuance of debt of $185.0 million under the Senior Secured Credit Facilities proceeds
121

from capital contributions and issuance of common stock of approximately $17.2 million, both insupport of acquisition activities.v
Net cash provided by financing activities decreased $1,007.6 million from net cash provided byfinancing activities of $911.4 million in the Successor Period 2014 and $89.9 million in the PredecessorPeriod 2014 to net cash used in financing activities of $6.3 million in the fiscal year endedSeptember 30, 2015. This decrease was primarily due to issuance of debt related to the AEAAcquisition and the related proceeds from issuance of common stock in the Successor Period 2014,partially offset by the reduction in borrowings under the Senior Secured Credit Facilities and investortransaction fees.
Seasonality
While we do not believe it to be significant, our business does exhibit seasonality resulting fromour customers’ increasing demand for our products and services during the spring and summer monthsas compared to the fall and winter months. For example, our Municipal Segment experiences increaseddemand for our odor control product lines and services in the warmer months which, together withother factors, typically results in improved performance in the second half of our fiscal year. Inclementweather, such as hurricanes, droughts and floods, can also drive increased demand for our products andservices. As a result, our results from operations may vary from period to period.
Off-Balance Sheet Arrangements
As of September 30, 2016 and June 30, 2017, we had letters of credit totaling $18.1 million and$15.9 million, respectively, and surety bonds totaling $102.2 million and $80.3 million respectively,outstanding under our credit arrangements. The longest maturity date of the letters of credit and suretybonds related to commercial contracts in effect as of June 30, 2017 was March 31, 2024. Additionally,as of September 30, 2016 and June 30, 2017, we had letters of credit totaling $1.5 million and$1.1 million, respectively, and surety bonds totaling $43.7 million and $14.3 million, respectively,outstanding under our prior arrangement with Siemens.
Contractual Obligations
We enter into long-term obligations and commitments in the normal course of business, primarilydebt obligations and non-cancelable operating leases. As of September 30, 2016, without giving effect tothis offering or the use of proceeds therefrom, our contractual cash obligations over the next severalperiods were as follows (in thousands):
Less than 1 to 3 to More thanTotal 1 year 3 years 5 years 5 years
Operating lease commitments(a) . . . . . . . . . . $ 47,369 $13,232 $ 17,665 $ 10,688 $5,784Capital lease commitments(b) . . . . . . . . . . . . 28,354 7,530 13,013 6,972 839Long-term debt obligations . . . . . . . . . . . . . . 779,411 30,024 18,314 730,355 718Interest payments on long-term debt
obligations . . . . . . . . . . . . . . . . . . . . . . . . 171,201 40,315 79,921 50,965 —
Total . . . . . . . . . . . . . . . . . . . . . . . . . . . . . . $1,026,335 $91,101 $128,913 $798,980 $7,341
(a) We occupy certain facilities and operate certain equipment and vehicles under non-cancelable leasearrangements. Lease agreements may contain lease escalation clauses and purchase and renewaloptions. We recognize scheduled lease escalation clauses over the course of the applicable leaseterm on a straight-line basis.
(b) We lease certain equipment classified as capital leases. The leased equipment is depreciated on astraight line basis over the life of the lease and is included in depreciation expense.
122

Critical Accounting Policies and Estimates
The preparation of financial statements in accordance with accounting principles generallyaccepted in the United States requires management to make estimates and assumptions about futureevents that affect amounts reported in our consolidated financial statements and related notes, as wellas the related disclosure of contingent assets and liabilities at the date of the financial statements.Management evaluates its accounting policies, estimates and judgments on an on-going basis.Management bases its estimates and judgments on historical experience and various other factors thatare believed to be reasonable under the circumstances. Actual results may differ from these estimatesunder different assumptions and conditions.
Management evaluated the development and selection of its critical accounting policies andestimates and believes that the following involve a higher degree of judgment or complexity and aremost significant to reporting our results of operations and financial position, and are thereforediscussed as critical. The following critical accounting policies reflect the significant estimates andjudgments used in the preparation of our consolidated financial statements. With respect to criticalaccounting policies, even a relatively minor variance between actual and expected experience canpotentially have a materially favorable or unfavorable impact on subsequent results of operations. Moreinformation on all of our significant accounting policies can be found in ‘‘Note 2—Summary ofSignificant Accounting Policies’’ to our audited consolidated financial statements included elsewhere inthis prospectus.
Use of Estimates
Our consolidated financial statements are prepared in conformity with GAAP and requiremanagement to make estimates and assumptions. These assumptions affect the reported amounts ofassets and liabilities and disclosure of contingent assets and liabilities at the date of the consolidatedfinancial statements and the reported amounts of revenue and expenses during the reporting period.Estimates and assumptions are used for, but not limited to: (i) revenue recognition; (ii) allowance fordoubtful accounts; (iii) inventory valuation, asset valuations, impairment and recoverability assessments;(iv) depreciable lives of assets; (v) useful lives of intangible assets; (vi) income tax reserves andvaluation allowances and (vii) product warranty and litigation reserves. Estimates are revised asadditional information becomes available. Actual results could differ from these estimates.
Accounts Receivable
Receivables are primarily comprised of uncollected amounts owed to us from transactions withcustomers and are presented net of allowances for doubtful accounts. Allowances are estimated basedon historical write-offs and the economic status of customers. We consider a receivable delinquent if itis unpaid after the term of the related invoice has expired. Write-offs are recorded at the time allcollection efforts have been exhausted.
Inventories
Inventories are stated at the lower of cost or market, where cost is generally determined on thebasis of an average or first-in, first-out method. Production costs comprise direct material and laborand applicable manufacturing overheads, including depreciation charges. We regularly review inventoryquantities on hand and write off excess or obsolete inventory based on estimated forecasts of productdemand and production requirements. Manufacturing operations recognize cost of product sales usingstandard costing rates with overhead absorption which generally approximates actual cost.
123
Property, Plant, and Equipment
Property, plant, and equipment is valued at cost less accumulated depreciation and impairmentlosses. If the costs of certain components of an item of property, plant, and equipment are significantin relation to the total cost of the item, they are accounted for and depreciated separately.Depreciation expense is recognized using the straight-line method. Useful lives are reviewed annuallyand, if expectations differ from previous estimates, adjusted accordingly. Estimated useful lives formajor classes of depreciable assets are as follows:
Asset Class Estimated Useful Life
Machinery and equipment . . . . . . . . . . . . . . . . . . . . . . . . . . . . . 3 to 20 yearsBuildings and improvements . . . . . . . . . . . . . . . . . . . . . . . . . . . 10 to 40 years
Leasehold improvements are depreciated over the shorter of their estimated useful life or the termof the lease. Costs related to maintenance and repairs that do not extend the assets’ useful life areexpensed as incurred.
Goodwill and Other Intangible Assets
We review goodwill to determine potential impairment annually during the fourth quarter of ourfiscal year, or more frequently if events and circumstances indicate that the asset might be impaired.Impairment testing for goodwill is performed at a reporting unit level. We have determined that wehave four reporting units. Our quantitative impairment testing utilizes both a market (guideline publiccompany) and income (discounted cash flows) method for determining fair value. In estimating the fairvalue of the reporting unit utilizing a discounted cash flow valuation technique, we incorporate ourjudgment and estimates of future cash flows, future revenue and gross profit growth rates, terminalvalue amount, capital expenditures and applicable weighted-average cost of capital used to discountthese estimated cash flows. The estimates and projections used in the estimate of fair value areconsistent with our current budget and long-range plans, including anticipated change in marketconditions, industry trend, growth rates and planned capital expenditures, among other considerations.If the carrying value of the reporting unit is greater than the fair value, the second step is performed,where the implied fair value of goodwill is compared to its carrying value.
Impairment of Long-Lived Assets
Long-lived assets, such as property, plant and equipment, and purchased intangibles subject toamortization, are reviewed for impairment whenever events or changes in circumstances indicate thatthe carrying amount of an asset or asset group may not be recoverable. Conditions that may indicateimpairment include, but are not limited to, a significant adverse change in customer demand orbusiness climate that could affect the value of an asset, a product recall or an adverse action by aregulator. Recoverability of the asset or asset group is measured by comparison of its carrying amountto undiscounted future net cash flows the asset or asset group is expected to generate. If the carryingamount of an asset or asset group is not recoverable, we recognize an impairment loss based on theexcess of the carrying amount of the asset or asset group over its respective fair value which isgenerally determined as the present value of estimated future cash flows or as the appraised value.
We amortize these assets with finite lives over their estimated useful lives on a straight-line basis.This amortization methodology best matches the pattern of economic benefit that is expected from thedefinite-lived intangible assets.
124

Revenue Recognition
Sales of goods and services are recognized when persuasive evidence of an arrangement exists, theprice is fixed or determinable, collectability is reasonably assured and delivery has occurred or serviceshave been rendered.
For sales of aftermarket parts or products with a low level of customization and engineering time,we recognize revenues at the time title and risks and rewards of ownership pass, which is generallywhen products are shipped or delivered to the customer as we have no obligation for installation. Salesof short-term service arrangements are recognized as the services are performed, and sales of long-termservice arrangements are typically recognized on a straight-line basis over the life of the agreement.
For certain arrangements where there is significant customization to the product, we recognizerevenue under the provisions of ASC 605-35, Revenue Recognition—Construction-Type andProduction-Type Contracts. These products include large capital water treatment projects, systems andsolutions for municipal and industrial applications. Revenues from construction-type contracts aregenerally recognized under the percentage-of-completion method, based on the input of costs incurredto date as a percentage of total estimated contract costs. The nature of the contracts are generally fixedprice with milestone billings. As needed, we update estimates of future costs for agreements in processand report any cumulative effect of such adjustments in current operations. Approximately$33.5 million, $29.7 million and $21.6 million of revenues from construction-type contracts wererecognized on a completed contract method, which is typically when the product is delivered andaccepted by the customer, during the fiscal years ended September 30, 2016, 2015 and 2014. Thecompleted contract method is principally used when the contract is short in duration (generally lessthan twelve months) and where results of operations would not vary materially from those resultingfrom the use of the percentage-of-completion method. Cost and earnings in excess of billings underconstruction-type arrangements are recorded when contracts have net asset balances where contractcosts plus recognized profits less recognized losses exceed progress billings. Billings in excess of costsincurred are recorded when contract progress billings exceed costs and recognized profit less recognizedlosses.
Product Warranties
Accruals for estimated expenses related to warranties are made at the time products are sold andare recorded as a component of cost of product sales in the Consolidated Statements of Operationsand Comprehensive Loss in our financial statements included elsewhere in this prospectus. Theestimated warranty obligation is based on product warranty terms offered to customers, ongoingproduct failure rates, material usage and service delivery costs expected to be incurred in correcting aproduct failure, as well as specific obligations for known failures and other currently available evidence.We assess the adequacy of the recorded warranty liabilities on a regular basis and adjust amounts asnecessary.
Income Taxes
We recognize deferred tax assets and liabilities for the future tax consequences attributable todifferences between the financial statement carrying amounts of existing assets and liabilities and theirrespective tax bases. Deferred tax assets and liabilities are measured using enacted tax rates expected toapply to taxable income in the years in which those temporary differences are expected to be recoveredor settled. The effect on deferred tax assets and liabilities of a change in tax rates is recognized inincome in the period that included the enactment date. Valuation allowances are provided againstdeferred tax assets when it is deemed more likely than not that some portion or all of the deferred taxasset will not be realized within a reasonable time period. We assess tax positions using a two-stepprocess. A tax position is recognized if it meets a more-likely-than-not threshold, and is measured at
125

the largest amount of benefit that is greater than 50% of being realized. Uncertain tax positions arereviewed each balance sheet date.
In November 2015, the Financial Accounting Standards Board (‘‘FASB’’) issued AccountingStandard Update (‘‘ASU’’) 2015-17, Balance Sheet Classification of Deferred Taxes. This update simplifiesthe presentation of deferred income taxes. The amendments in this update require that deferred taxliabilities and assets be classified as noncurrent for all entities that present a classified statement offinancial position. The current requirement that deferred tax liabilities and assets of a tax-payingcomponent of an entity be offset and presented as a single amount is not affected by the amendmentsin this update. The amendments in this update are effective for non-public entity financial statementsissued for annual periods beginning after December 15, 2017, and interim periods with annual periodsbeginning after December 15, 2018. Earlier application is permitted for all entities as of the beginningof an interim or annual reporting period. The amendments in this update may be applied eitherprospectively to all deferred tax liabilities and assets or retrospectively to all periods presented.Management has elected to prospectively adopt this update early as of October 1, 2015. By adoptingthis update prospectively, prior periods were not retrospectively adjusted.
Equity-based Compensation
We account for awards of equity instruments in accordance with relevant authoritative literature.Given the absence of a public trading market for our common stock, the fair value of the commonstock underlying our share-based awards was determined by our board, with input from management,in each case using the income and market valuation approach. We believe that our board has therelevant experience and expertise to determine the fair value of our common stock. In accordance withthe Accounting and Valuation Guide: Valuation of Privately-Held-Company Equity Securities Issued asCompensation published by the American Institute of Certified Public Accountants, our board exercisedreasonable judgment and considered numerous objective and subjective factors to determine the bestestimate of the fair value of our common stock including:
• our historical and projected operating and financial results, including capital expenditures;
• current business conditions and performance, including dispositions and discontinued operations;
• present value of estimated future cash flows;
• the market performance and financial results of comparable publicly-traded companies;
• amounts of indebtedness;
• industry or company-specific considerations;
• likelihood of achieving a liquidity event, such as an initial public offering or a sale of thecompany;
• lack of marketability of our common stock; and
• the U.S. and global capital market conditions.
These estimates will not be necessary to determine the fair value of new awards once theunderlying shares begin trading publicly. Stock options are granted with exercise prices equal to orgreater than the estimated fair market value on the date of grant as authorized by our compensationcommittee. Options granted vest ratably at 25% per year and are exercisable at the time of vesting.Stock option grants are generally subject to forfeiture if employment terminates prior to vesting. Wehave selected the Black-Scholes option pricing model for estimating the grant date fair value of stockoption awards granted. We have considered the retirement and forfeiture provisions of the options andutilized our historical experience and the experience of similar public companies to estimate theexpected life of the options. We base the risk-free interest rate on the yield of a zero coupon U.S.
126

Treasury security with a maturity generally equal to the expected life of the option from the date of thegrant. We estimate the volatility of the share price of our common stock by considering the historicalvolatility of the stock of similar public entities. We estimate the dividend yield to be zero as we do notintend to pay dividends in the future. In determining the appropriateness of the public entities includedin the volatility assumption we considered a number of factors, including the entity’s life cycle stage,growth profile, size, financial leverage and products offered. Stock-based compensation cost ismeasured at the grant date based on the value of the award, net of estimated forfeitures, and isrecognized as a component of general and administrative expense over the requisite vesting period.
In March 2016, the FASB issued ASU 2016-09, Improvements to Employee Share-Based PaymentAccounting, which amends ASC Topic 718, Compensation—Stock Compensation. The ASU includesprovisions intended to simplify various aspects related to how share-based payments are accounted forand presented in the financial statements. ASU 2016-09 will be effective for non-public entities for thequarter ending December 31, 2017. This update is not expected to have an impact on our consolidatedfinancial statements.
Retirement Benefits
We apply ASC Topic 715, Compensation—Retirement Benefits, which requires the recognition inpension obligations and accumulated other comprehensive income of actuarial gains or losses, priorservice costs or credits and transition assets or obligations that have previously been deferred. Thedetermination of retirement benefit pension obligations and associated costs requires the use ofactuarial computations to estimate participant plan benefits to which the employees will be entitled.The significant assumptions primarily relate to discount rates, expected long-term rates of return onplan assets, rate of future compensation increases, mortality, years of service and other factors. Wedevelop each assumption using relevant experience in conjunction with market-related data for eachindividual country in which such plans exist. All actuarial assumptions are reviewed annually with third-party consultants and adjusted as necessary. For the recognition of net periodic postretirement cost, thecalculation of the expected return on plan assets is generally derived by applying the expectedlong-term rate of return on the market-related value of plan assets. The fair value of plan assets isdetermined based on actual market prices or estimated fair value at the measurement date.
Recent Accounting Pronouncements
In May 2014, the FASB issued ASU No. 2014-09, Revenue from Contracts with Customers(Topic 606). ASU No. 2014-09 clarifies the principles for recognizing revenue when an entity eitherenters into a contract with customers to transfer goods or services or enters into a contract for thetransfer of non-financial assets. ASU 2014-09 may be adopted using either of two acceptablemethods: (1) retrospective adoption to each prior period presented with the option to elect certainpractical expedients; or (2) adoption with the cumulative effect recognized at the date of initialapplication and providing certain disclosures. To assess at which time revenue should be recognized, anentity should use the following steps: (1) identify the contract(s) with a customer; (2) identify theperformance obligations in the contract; (3) determine the transaction price; (4) allocate the transactionprice to the performance obligations in the contract; and (5) recognize revenue when, or as, the entitysatisfies a performance obligation. The standard is effective for the Company for the quarter endingDecember 31, 2018. We have engaged a third party to assist in assessing the impact adoption of thisguidance will have on its consolidated financial statements.
In February 2016, the FASB issued ASU 2016-02, Leases (Topic 842). ASU 2016-02 requiresrecognition of operating leases as lease assets and liabilities on the balance sheet, and disclosure of keyinformation about leasing arrangements. ASU 2016-02 will be effective retrospectively for us for thequarter ending December 31, 2019, with early adoption permitted. We are currently assessing theimpact adoption of this guidance will have on our consolidated financial statements.
127
In March 2016, the FASB issued (ASU) 2016-09, Improvements to Employee Share-Based PaymentAccounting, which amends ASC Topic 718, Compensation—Stock Compensation. The ASU includesprovisions intended to simplify various aspects related to how share-based payments are accounted forand presented in the financial statements. ASU No. 2016-09 will be effective for the Company for thequarter ending December 31, 2017. This update is not expected to have an impact on the Company’sconsolidated financial statements. The Company is currently assessing the impact adoption of thisguidance will have on its consolidated financial statements.
In August 2016, the FASB issued ASU 2016-15, Statement of Cash Flows (Topic 230): Classificationof Certain Cash Receipts and Cash Payments (a consensus of the Emerging Issues Task Force). This newguidance is intended to reduce diversity in practice in how certain transactions are classified in thestatement of cash flows. ASU 2016-15 will be effective for us for the quarter ending December 31,2018, with early adoption permitted. The guidance should be applied retrospectively to all periodspresented, unless deemed impracticable, in which case prospective application is permitted. We arecurrently evaluating the potential impact of adoption on our consolidated financial statements.
In October 2016, the FASB issued ASU 2016-17, Consolidations (Topic 810): Interests Held throughRelated Parties that are under Common Control. The ASU changes how a single decision maker of aVIE that holds indirect interest in the entity through related parties that are under common controldetermines whether it is the primary beneficiary of the VIE. The new guidance amends ASU 2015-02,Consolidation (Topic 810): Amendments to the Consolidation Analysis, issued in February 2015. Theguidance should be applied coincidentally with the adoption of ASU 2015-02, which was effective for usfor the quarter ended December 31, 2016. The adoption of this guidance did not have a significantimpact on our consolidated financial statements.
In January 2017, the FASB issued ASU 2017-04, Simplifying the Test for Goodwill Impairment. ThisASU simplifies how an entity is required to test goodwill for impairment by eliminating Step 2 from thegoodwill impairment test. Step 2 measures goodwill impairment loss by comparing the implied value ofa reporting unit’s goodwill with the carrying amount of that goodwill. The amendments in this ASU areeffective for us for the quarter ending December 31, 2020. We do not expect the adoption of this ASUto have a material impact on our consolidated financial statements.
In May 2017, the FASB issued ASU 2017-09, Scope of Modification Accounting, which amendedAccounting Standards Code Topic 718. FASB issued ASU 2017-09 to reduce the cost and complexitywhen applying Topic 718 and standardize the practice of applying Topic 718 to financial reporting. TheASU was not developed to fundamentally change the definition of a modification, but instead toprovide guidance for what changes would qualify as a modification. ASU No. 2017-09 will be effectivefor us for the quarter ending December 31, 2018. We are currently evaluating the potential impact ofadoption on the Company’s Consolidated Financial Statements.
Quantitative and Qualitative Disclosures about Market Risk
Interest Rate Risk
We have market risk exposure arising from changes in interest rates on our Senior Secured CreditFacilities, which bear interest at rates that are benchmarked against LIBOR. Based on our overallinterest rate exposure to variable rate debt outstanding as of June 30, 2017, a 1% increase or decreasein interest rates would increase or decrease income (loss) before income taxes by approximately$8.1 million.
Impact of Inflation
Our results of operations and financial condition are presented based on historical cost. While it isdifficult to accurately measure the impact of inflation due to the imprecise nature of the estimates
128

required, we believe the effects of inflation, if any, on our results of operations and financial conditionhave been immaterial. We cannot assure you, however, that our results of operations and financialcondition will not be materially impacted by inflation in the future.
Foreign Currency Risk
We have global operations and therefore enter into transactions denominated in various foreigncurrencies. While we believe we are not susceptible to any material impact on our results of operationscaused by fluctuations in exchange rates because our operations are primarily conducted in the UnitedStates, if we expand our foreign operations in the future, substantial increases or decreases in the valueof the U.S. dollar relative to these other currencies could have a significant impact on our results ofoperations.
To mitigate cross-currency transaction risk, we analyze significant exposures where we have receiptsor payments in a currency other than the functional currency of our operations, and from time to timewe may strategically enter into short-term foreign currency forward contracts to lock in some or all ofthe cash flows associated with these transactions. We also are subject to currency translation riskassociated with converting our foreign operations’ financial statements into U.S. dollars. We useshort-term foreign currency forward contracts and swaps to mitigate the impact of foreign exchangefluctuations on consolidated earnings. We use foreign currency derivative contracts in order to managethe effect of exchange fluctuations on forecasted sales, purchases, acquisitions, inventory, capitalexpenditures and certain intercompany transactions that are denominated in foreign currencies. We donot use derivative financial instruments for trading or speculative purposes.
Internal Control over Financial Reporting
The process of improving our internal controls has required and will continue to require us toexpend significant resources to design, implement and maintain a system of internal controls that isadequate to satisfy our reporting obligations as a public company. There can be no assurance that anyactions we take will be completely successful. We will continue to evaluate the effectiveness of ourdisclosure controls and procedures and internal control over financial reporting on an on-going basis.As part of this process, we may identify specific internal controls as being deficient.
In fiscal 2016, we began evaluating and implementing our internal control procedures in order tocomply with the requirements of Section 404 of the Sarbanes-Oxley Act. Section 404 requires annualmanagement assessments of the effectiveness of our internal control over financial reporting and areport by our independent auditors addressing these assessments. We will be required to comply withSection 404 in full (including the management certification requirements and an auditor attestation onmanagement’s internal controls report) in our annual report on Form 10-K for the year following ourfirst annual report required to be filed with the SEC (subject to any change in applicable SEC rules).
129

BUSINESS
Company Overview
We are a leading provider of mission critical water treatment solutions, offering services, systemsand technologies to support our customers’ full water lifecycle needs. With over 200,000 installationsworldwide, we hold leading positions in the industrial, commercial and municipal water treatmentmarkets in North America. We offer a comprehensive portfolio of differentiated, proprietary technologysolutions sold under a number of market-leading and well-established brands. We deliver and maintainthese mission critical solutions through the largest service network in North America, assuring ourcustomers continuous uptime with 86 branches which are located no further than a two-hour drive fromover 90% of our customers’ sites. We believe that the customer intimacy created through our servicenetwork is a significant competitive advantage.
Our solutions are designed to provide ‘‘worry-free water’’ by ensuring that our customers haveaccess to an uninterrupted quantity and level of quality of water that meets their unique product,process and recycle or reuse specifications. We enable our customers to achieve lower costs throughgreater uptime, throughput and efficiency in their operations and support their regulatory complianceand environmental sustainability. We have worked to protect water, the environment and ouremployees for over 100 years. As a result, we have earned a reputation for quality, safety and reliabilityand are sought out by our customers to solve the full range of their water treatment needs, andmaintaining our reputation is critical to the success of our business.
Our vision ‘‘to be the world’s first choice in water solutions’’ and our values of ‘‘integrity,customers and performance’’ foster a corporate culture that is focused on employee enablement,empowerment and accountability, which creates a highly entrepreneurial and dynamic workenvironment. Our purpose is ‘‘Transforming water. Enriching life.’’ We draw from a long legacy ofwater treatment innovations and industry firsts, supported by more than 1,250 granted or pendingpatents, which in aggregate are important to our business and solution set. Our core technologies areprimarily focused on removing impurities from water, rather than neutralizing them through theaddition of chemicals, and we are able to achieve purification levels which are 1,000 times greater thantypical drinking water.
We provide solutions across the entire water cycle. The water cycle begins with ‘‘influent’’ water,which is sourced from oceans, rivers, lakes, as well as other sources. We treat the influent water so thatit can be used for a wide variety of industrial, commercial and municipal applications. In industrialapplications, influent water, after it is treated, is used as process water for applications, such asmicroelectronic production, as an ingredient in the production of food and beverage and other goodsand in utility applications including boiler feed water, cooling water and steam condensate. Commercialapplications for influent water include laboratory testing and aquatic activities, while municipalapplications for influent water include treatment to produce safe drinking water and wastewater that iscompliant with applicable regulations. After the water is used it is considered ‘‘effluent water,’’ and weenable its treatment through the removal of impurities so that it can be discharged safely back into theenvironment or reused for industrial, commercial or municipal applications. As our solutions span theentire water cycle, we believe we have the most comprehensive and innovative range of solutions in theentire water treatment industry. Our future growth is dependent upon our ability to accretively develop
130

13JUL201703110877
and acquire products, services and solutions, adapt our business to meet the demands of our customers,comply with changes to government regulations and achieve market acceptance.
We have developed a broad set of well-established, unique relationships across a highly diversecustomer base. These relationships produce a visible flow of reoccurring business, with approximately58% of our revenue for fiscal 2016 derived from service, consumables and aftermarket parts that comefrom our repeat business and backlog. Additionally, approximately 24% of our revenue for fiscal 2016consisted of capital orders already in backlog at the beginning of fiscal 2016, resulting in significantvisibility into over 82% of our overall annual sales for fiscal 2016. In the industrial market we serveover 25,000 customers, including a substantial majority of the industrial companies within the Fortune500. We partner with our industrial customers through our direct sales and service team, which isorganized geographically and by specific end market. In the municipal market we serve over 7,800 U.S.wastewater sites and over 1,800 global drinking water treatment sites, providing solutions that help treatover 40% of the U.S. municipal wastewater sites as of June 30, 2017. Our deep institutionalrelationships with independent sales representatives across North America, who serve as the primarychannel for new municipal water treatment projects, and upon whom we depend to successfully marketand sell our products, services and solutions provide us significant access to new projects up for bid andfor servicing our installed base.
For the fiscal year ended September 30, 2016, we generated 86% of our revenues in NorthAmerica with a strong and growing international presence and we currently employ approximately 4,000individuals across eight countries. For the fiscal year ended September 30, 2016, we generated revenue,net income and Adjusted EBITDA of $1.1 billion, $13.0 million and $160.1 million, respectively. Forthe fiscal year ended September 30, 2016, we generated pro forma revenue, pro forma net income andAdjusted EBITDA (pro forma as adjusted for contributions from insignificant completed acquisitions)of $1.2 billion, $16.8 million and $182.4 million, respectively. For more information on AdjustedEBITDA, including a reconciliation to the most directly comparable GAAP financial measure, see‘‘—Summary Consolidated Financial and Operating Data.’’
131
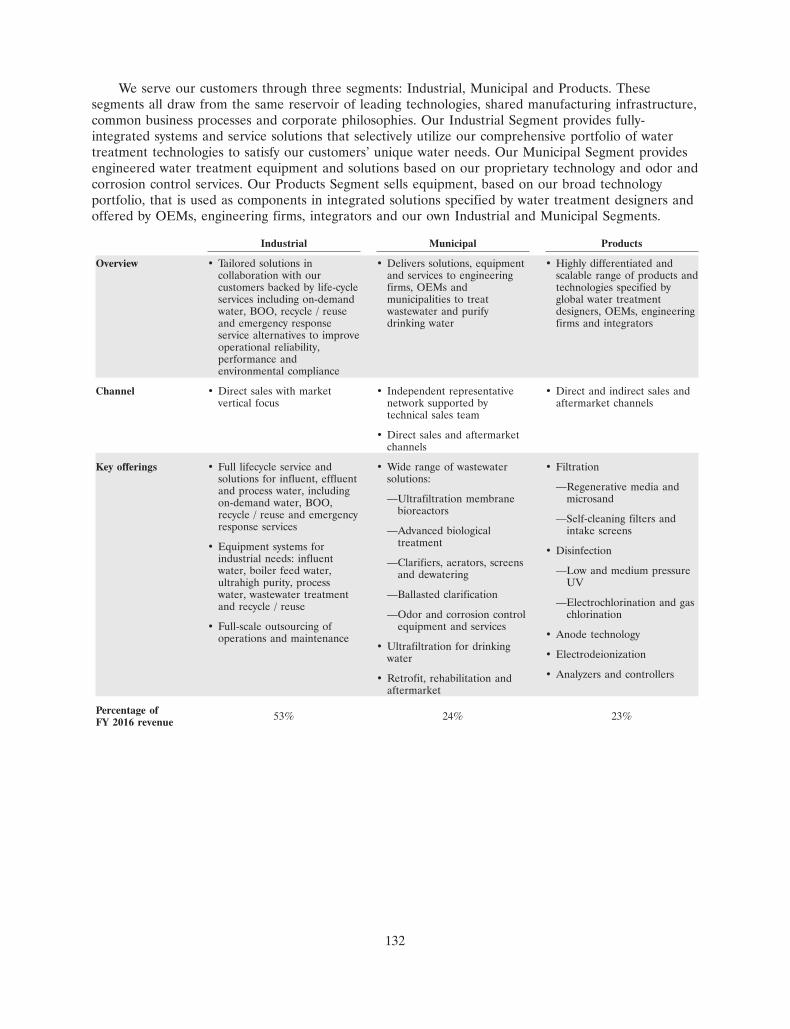
We serve our customers through three segments: Industrial, Municipal and Products. Thesesegments all draw from the same reservoir of leading technologies, shared manufacturing infrastructure,common business processes and corporate philosophies. Our Industrial Segment provides fully-integrated systems and service solutions that selectively utilize our comprehensive portfolio of watertreatment technologies to satisfy our customers’ unique water needs. Our Municipal Segment providesengineered water treatment equipment and solutions based on our proprietary technology and odor andcorrosion control services. Our Products Segment sells equipment, based on our broad technologyportfolio, that is used as components in integrated solutions specified by water treatment designers andoffered by OEMs, engineering firms, integrators and our own Industrial and Municipal Segments.
Industrial Municipal Products
Overview • Tailored solutions in • Delivers solutions, equipment • Highly differentiated andcollaboration with our and services to engineering scalable range of products andcustomers backed by life-cycle firms, OEMs and technologies specified byservices including on-demand municipalities to treat global water treatmentwater, BOO, recycle / reuse wastewater and purify designers, OEMs, engineeringand emergency response drinking water firms and integratorsservice alternatives to improveoperational reliability,performance andenvironmental compliance
Channel • Direct sales with market • Independent representative • Direct and indirect sales andvertical focus network supported by aftermarket channels
technical sales team
• Direct sales and aftermarketchannels
Key offerings • Full lifecycle service and • Wide range of wastewater • Filtrationsolutions for influent, effluent solutions:
—Regenerative media andand process water, including—Ultrafiltration membrane microsandon-demand water, BOO,
bioreactorsrecycle / reuse and emergency —Self-cleaning filters andresponse services —Advanced biological intake screens
treatment• Equipment systems for • Disinfectionindustrial needs: influent —Clarifiers, aerators, screenswater, boiler feed water, —Low and medium pressureand dewateringultrahigh purity, process UVwater, wastewater treatment —Ballasted clarification
—Electrochlorination and gasand recycle / reuse—Odor and corrosion control chlorination
• Full-scale outsourcing of equipment and services• Anode technologyoperations and maintenance
• Ultrafiltration for drinking• Electrodeionizationwater• Analyzers and controllers• Retrofit, rehabilitation and
aftermarket
Percentage of 53% 24% 23%FY 2016 revenue
132
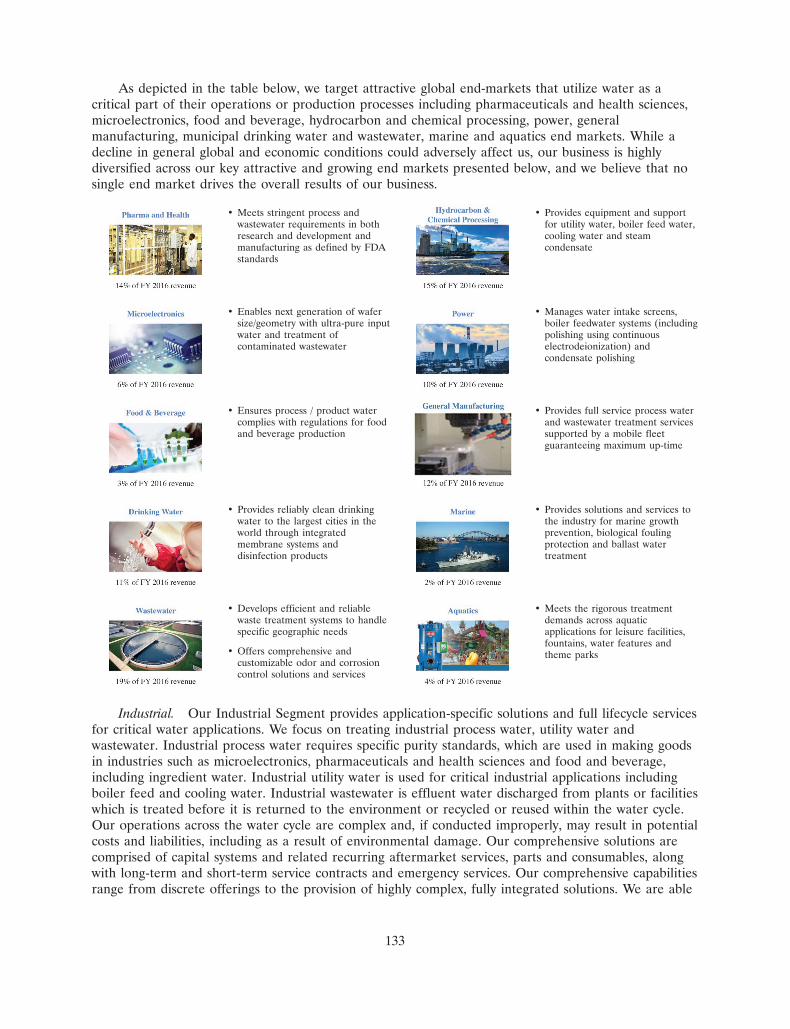
16JUL201720113272 14JUL201717404035
14JUL201717404583 14JUL201717405191
13JUL20170311160614JUL201717403738
16JUL201720112808 14JUL201717404310
14JUL201717405557 14JUL201717403161
As depicted in the table below, we target attractive global end-markets that utilize water as acritical part of their operations or production processes including pharmaceuticals and health sciences,microelectronics, food and beverage, hydrocarbon and chemical processing, power, generalmanufacturing, municipal drinking water and wastewater, marine and aquatics end markets. While adecline in general global and economic conditions could adversely affect us, our business is highlydiversified across our key attractive and growing end markets presented below, and we believe that nosingle end market drives the overall results of our business.
• Meets stringent process and • Provides equipment and supportwastewater requirements in both for utility water, boiler feed water,research and development and cooling water and steammanufacturing as defined by FDA condensatestandards
• Enables next generation of wafer • Manages water intake screens,size/geometry with ultra-pure input boiler feedwater systems (includingwater and treatment of polishing using continuouscontaminated wastewater electrodeionization) and
condensate polishing
• Ensures process / product water • Provides full service process watercomplies with regulations for food and wastewater treatment servicesand beverage production supported by a mobile fleet
guaranteeing maximum up-time
• Provides reliably clean drinking • Provides solutions and services towater to the largest cities in the the industry for marine growthworld through integrated prevention, biological foulingmembrane systems and protection and ballast waterdisinfection products treatment
• Develops efficient and reliable • Meets the rigorous treatmentwaste treatment systems to handle demands across aquaticspecific geographic needs applications for leisure facilities,
fountains, water features and• Offers comprehensive and theme parks
customizable odor and corrosioncontrol solutions and services
Industrial. Our Industrial Segment provides application-specific solutions and full lifecycle servicesfor critical water applications. We focus on treating industrial process water, utility water andwastewater. Industrial process water requires specific purity standards, which are used in making goodsin industries such as microelectronics, pharmaceuticals and health sciences and food and beverage,including ingredient water. Industrial utility water is used for critical industrial applications includingboiler feed and cooling water. Industrial wastewater is effluent water discharged from plants or facilitieswhich is treated before it is returned to the environment or recycled or reused within the water cycle.Our operations across the water cycle are complex and, if conducted improperly, may result in potentialcosts and liabilities, including as a result of environmental damage. Our comprehensive solutions arecomprised of capital systems and related recurring aftermarket services, parts and consumables, alongwith long-term and short-term service contracts and emergency services. Our comprehensive capabilitiesrange from discrete offerings to the provision of highly complex, fully integrated solutions. We are able
133

to leverage our broad range of products and technologies to deliver a tailored solution that bestaddresses a specific customer’s needs, including a growing portfolio of smart water technologiesencompassed in our Water One platform. Key capital and related aftermarket service and productofferings include filtration, reverse osmosis, ion exchange and continuous deionization. As a result ofour speed, capabilities and experience, we are a trusted partner to 25,000 industrial customers,including a substantial majority of Fortune 500 industrial companies. As water is a critical componentin many industrial production processes, unavailability of proper water purity, specification or qualitycan lead to significant constraints, downtime and increased operating costs.
The cost of an installation can range from a few thousand dollars to a few million dollars andoften presents an ongoing service and aftermarket revenue opportunity that can reach or exceed theoriginal project cost. The service and aftermarket sales component is supported by our broadapplication and process expertise and the largest integrated industrial service network in NorthAmerica, based on management’s estimate. Our network is comprised of certified technicians and thelargest fleet of mobile reverse osmosis and deionization water treatment systems in North Americabased on management’s estimate, and enables us to provide a complete range of services spanning fromregular maintenance and emergency support to our unique Water One platform. Water One providesremote monitoring capabilities which enable us to optimize our routine service calls through predictiveanalytics and provide customers a more predictable, cost-efficient water solution. We offer serviceswhich include water on-demand, mobile solutions and smart water systems that leverage our extensivebranch network, technical personnel and technology portfolio.
We market our Industrial offerings through our direct sales force, which is organized by marketvertical and is complemented by an inside sales force, field sales engineers and a growing e-commerceplatform.
Municipal. Our Municipal Segment provides engineered solutions and equipment for thetreatment of wastewater, purification of drinking water and odor and corrosion control formunicipalities. Our portfolio of solutions includes ultrafiltration systems, advanced biological treatment,clarifiers, aerators, odor and corrosion control services, equipment for new municipal plant builds andretrofit, rehabilitation and aftermarket parts and services for our extensive installed base. We haveprovided solutions across a large municipal installed base with capacities ranging from 25,000 gallonsper day to over 100 million gallons per day. Our operations are focused within the U.S. market, with apresence in the United Kingdom, Australia, Canada and Singapore.
We maintain a comprehensive municipal representative network that broadly covers theUnited States, providing us with a differentiated ability to influence specifications and the basis ofdesign for new treatment facilities. We also maintain relationships with engineering firms, operators andother key influencers through our direct technical sales force to drive adoption of our offerings.
Products. Our Products Segment sells differentiated technologies to a diverse set of watertreatment system specifiers, integrators and end users globally. Our offerings are highlighted by ourfiltration and disinfection, electrodeionization and electrochlorination technologies, separationtechnologies and anodes offerings. Our filtration and disinfection offerings include our Defender line ofproducts, which is a regenerative media filtration leader in the commercial aquatics market. OurIONPURE electrodeionization solutions allow customers to achieve ultrahigh purity water without theuse of chemicals in the treatment process. Our electrochlorination products provide extensive watertreatment solutions for the maritime, oil and gas and power markets. We also have extensivecapabilities in anode technologies, cathodic protection, solid and liquid separation technologies andvarious aftermarket parts, consumables and accessories. All of our offerings are highly scalable anddesigned to meet current and future water treatment needs, with a focus on generating repeat businessfrom our customers. We generally service the equipment we provide our customers: however, theirfailure to properly use, safeguard or maintain their equipment of product defects or unanticipated useof our products could result in liability to us.
134

27JUL201723370685
Our portfolio of technologies and products are sold either as discrete offerings or as componentsof broader Evoqua solutions through our Industrial and Municipal Segments. Our Products Segmentalso sells externally to a customer base comprised of globally located OEMs, integrators, regionaldistributors, customers, regional engineering firms and various other end users that we reach throughmultiple established sales and aftermarket channels.
Our Industry
We estimate the global water and wastewater market to represent more than $600 billion in totalrevenue and include both capital and operating expenditures for the treatment and transportation ofwater by industrial, municipal, commercial and residential end users. Within the global water andwastewater market, we estimate our addressable market, comprised of equipment, consumables,aftermarket parts and operations-related and maintenance-related services for the treatment of waterfor industrial, commercial and municipal end users, to represent over $85 billion in total revenue. Ouraddressable market is further refined to include our served market, which is currently focused on theNorth American region, and totals approximately $10 billion in total revenue according to AmaneAdvisors. As compared to our larger addressable market, our served market excludes sectors that wouldrequire meaningful growth investment on our part to capture new customers or market opportunities.The following diagram illustrates the breakdown of total revenue in our total market and ouraddressable global market:
Source: Management estimates, Amane Advisors; data is as of 2016.
(1) Evoqua does not provide EPC services, but does sell products and solutions to EPC firms.
While a decline in general global economic and business conditions may adversely affect demandfor our products, services and solutions, we believe the global water market will continue to experiencegrowth, supported by a variety of anticipated secular trends that will drive the demand for water across
135

a multitude of industrial, commercial and municipal applications. These secular trends include globalpopulation growth, urbanization, industrialization and overall economic growth. In addition, the supplyof clean water could be adversely impacted by factors including an aging water infrastructure withinNorth America and increased levels of water stress from seasonal rainfall, inadequate water storageoptions or treatment technologies. More specific to our business, water is a critical component andbyproduct of many processes, including in manufacturing and product development. As such as globalconsumption patterns evolve and water shortages persist, demand for equipment and services willcontinue to increase. We estimate the global water market is expected to grow in total revenue byapproximately 3% annually from 2017 to 2020, although such growth may not be concentrated in themarkets that we serve or may be otherwise affected by global or regional economic conditions.
We hold the number one position, with approximately 11% market share, in the highly fragmentedNorth American water treatment market we serve, based on fiscal 2016 revenue, according to AmaneAdvisors. Our approximately 11% market share is over 1.5 times that of our nearest competitor acrossthe combined industrial, commercial and municipal market verticals, according to Amane Advisors. Asa result of the complex route to market and diverse set of customers, most market participants areniche-offering focused, with a majority of the broader market served by a large number of small,regional providers. More specifically, according to Amane Advisors, the top five market participantscomprised approximately 30% of the North American market share in 2016 with a significant tail ofsmaller, regionally focused competitors. Our leading positions in our market verticals have beencultivated by our suite of differentiated solutions and our comprehensive service network, which hadover four times as many locations as our closest competitor at June 30, 2017. Despite our leadingpositions in the individual market verticals where we participate, our market share did not exceed 25%in any single market vertical in which we participated during fiscal 2016. We must continue to maintainand improve our competitive position, which requires focus on product performance, applicationexpertise and compliance with environmental and regulatory requirements.
We serve three primary market verticals: (i) industrial, (ii) commercial and (iii) municipal.Industrial and commercial customers vary in size, scope and the complexity of their water treatmentneeds and include small manufacturing clients with a single facility, large commercial waterparks andmultinational corporations with a significant global footprint. The municipal market consists of potablewater and wastewater treatment solutions that are sold to municipalities and private companiesoperating under a concession agreement to own and operate treatment facilities on behalf ofmunicipalities. We serve each market with a full range of solutions, services, technologies andaftermarket offerings.
Industrial and commercial markets. The served North America industrial and commercial marketsrepresent an approximately $6 billion revenue opportunity, according to Amane Advisors. Our servedNorth America industrial and commercial water markets consist of industrial process water, industrialutility and wastewater and commercial aquatics. Industrial process water includes the treatment of aninfluent water source prior to its direct use within a specific industrial application such as an ingredientin the development of a product. Industrial customers rely on specific purity standards for processwater with purity needs that range from a small volume of water requiring minimal treatment toultrapure water that support advanced manufacturing processes and are derived from highly advancedwater treatment systems. Industrial utility water treatment includes solutions to remove contaminantsbefore water is utilized to support an industrial process such as boiler feed water. Wastewater is thentreated before it is either discharged to a municipal wastewater system or discharged directly to theenvironment or reused within the facility. Commercial aquatics include the filtration and disinfection ofwater within large commercial applications including pools and water parks.
The industrial market is comprised of direct end market distribution channels. The commercialmarket includes a variety of routes to market including direct and third-party channel relationships.
136

Municipal market. There were more than 19,500 municipalities in the United States as of 2012,according to the United States Census Bureau. Together, these municipalities provided drinking andwastewater services to over 282 million people in 2016, according to the U.S. EPA. According toAmane Advisors, our served municipal market in North America is estimated to be approximately$4 billion in total revenue. The criticality of water has also increased due to heightened safetystandards, stricter environmental regulation and aging infrastructure. The municipal market iscomprised of a wide range of drinking and wastewater treatment facilities. Key market participantsinclude engineering firms and EPC companies that drive plant design and specifications, along withlocal municipal sales representatives.
Our Strengths
Number one market position in North America offering comprehensive, mission-critical lifecycle watertreatment solutions. According to Amane Advisors, we are the leader in the highly fragmentedapproximately $10 billion North American served water treatment market across industrial, commercialand municipal process and wastewater treatment, based on our fiscal 2016 revenue. We have a globalinstalled base that exceeds 200,000 installations and supports the full breadth of our water lifecyclesolutions including application specific treatment equipment, aftermarket parts, consumables androutine or emergency service. Our approximately 11% market share in the North American watertreatment market is nearly 1.5 times that of our closest competitor according to Amane Advisors, andyet we still enjoy room for growth given the highly fragmented nature of the market made uppredominately of smaller, local companies. According to Amane Advisors, we operate in a highlycompetitive but fragmented industry, with the top five companies in our industry representingapproximately 30% of the market. Our growth is supported by our global manufacturing capabilities,differentiated channels to market and deep technology reservoir.
We believe our market position is derived from our ability to provide holistic water solutions ascompared to our competitors who lack both the breadth of our product and technology portfolio andour extensive North American service network. We have a vast array of products and systems with theexpertise to adapt core technologies to meet specific customer needs, particularly within the industrialspace. Additionally, we are able to offer our clients a full outsourced water experience with guaranteedwater quality and quantity through a full suite of mobile technologies, including our national fleet ofover 600 mobile treatment assets as of June 30, 2017.
Positioned to capitalize on favorable industry growth dynamics and benefit from diverse end-marketexposure. While a decline in general global economic and business conditions may adversely affectdemand for our products, services and solutions, water treatment is an essential, non-discretionarymarket that is growing in importance as access to clean water has become an international priority. Anumber of global, long-term secular trends underpin anticipated industry growth dynamics and haveresulted in increasingly stringent effluent regulations along with a growing demand for cleaner andsustainable waste streams for reuse. These trends include the growing global population, increasinglevels of urbanization and continued global economic growth. We have seen these trends manifestthemselves within our various end markets creating multiple avenues of growth, but we are unable topredict the impact of potential countervailing considerations. For example, within the industrial market,water is an integral component in the production of a wide range of goods spanning from consumerelectronics to automobiles. Additionally, recent events such as the crisis in Flint, Michigan haverenewed focus on clean drinking water in the United States, which, combined with historical increasesin infrastructure investment, translates to growing demand for our solutions and services in themunicipal market. Furthermore, our long-standing reputation among engineering firms and independentsales representatives positions us to benefit from increased municipal demand, particularly as watertreatment plants are upgraded and expanded.
Given the wide use and importance of water, we enjoy low concentration within our end markets,with no single market vertical comprising over 19% of our revenue and no single customer comprising
137

over 1% of our revenue for the fiscal year ended September 30, 2016. As a result, we believe ourbusiness is diversified and insulated from dislocations in specific market verticals. We estimate our endmarkets are growing at a weighted average of approximately 3% per annum. Further, we believe manyof our end markets represents significant market opportunities because they are highly fragmented andnot yet fully penetrated.
Unparalleled channels to market and service network to support our diversified, blue-chip customer base.With over four times as many branches as our next largest competitor based on management’sestimates and analysis, our 86 service branches are located within a two-hour drive of approximately90% of our more than 25,000 industrial customer sites in North America. Across our global servicebranches, we have nearly 600 sales and support personnel and 800 field technicians. We believe ourdirect sales force is important to our customers. Most of our sales personnel are assigned to specificend markets and possess extensive application-specific knowledge, allowing us to provide customizedand fully integrated solutions leading to a unique level of intimacy with our end users. Our continuedsuccess depends on our ability to retain or attract skilled technical, engineering, sales and other keypersonnel, for whom competition is intense, both in retaining our existing employees and in replacingor finding additional employees. We complement our sales approach with our Global CorporateAccounts Management team, which we use to drive greater penetration across our extensive portfolioof large blue-chip customers and engineering firms. The efforts of our sales force are further enhancedby the ongoing dialogue and interactions our field technicians have with customers, which provides usreal-time feedback and serve as a source of leads on new sales opportunities. We also have a growingglobal product network that provides us access to commercial opportunities beyond our installed baseand core geographic regions. Overall, we believe that our channels to market play a key role in oursuccess in our core market while also allowing us to rapidly commercialize new technologies as well asscale tuck-in acquisitions. Further, our customer base consists of over 38,000 customers including asubstantial majority of the industrial companies within the Fortune 500 and spans a wide array ofend-markets. We face low customer concentration, with no single customer accounting for over 1% ofour revenue for the fiscal year ended September 30, 2016.
Iconic brands supported by leading proprietary and differentiated technologies. We believe our brandsare known across the water treatment marketplace for innovation, quality, customer service, safety andreliability. Our customers’ familiarity with our brands enhances our sales capabilities and allows us tomore effectively engage existing and new customers. Our reputation depends on our ability to provideour industry-leading water treatment solution offering, and we have a number of patent-protectedcornerstone technologies that support our business. Leveraging these technologies allows us to offersolutions across the entire spectrum of the water treatment lifecycle. Our innovation process issupported through six global research, development and engineering facilities, along with partnershipsspanning leading universities research centers and other outside agencies. Our internal RD&Eframework, the Evoqua Innovation Process, is fully deployed and uses a stage-gate approach toidentifying, prioritizing and implementing innovation projects across the organization.
Our innovation platform has generated an extensive portfolio of intellectual property with morethan 1,250 granted or pending patents. In the fiscal year ended September 30, 2016, excluding partsand service, approximately 47% of our revenue was directly or indirectly covered by our granted orpending patents. Our core and established technologies include electrodeionization and advancedoxidation, which allow for chemical free ultra-high purity water solutions; Water One, which leveragesadvanced sensing and analytics to provide water on demand, remote condition monitoring andpredictive maintenance; and mobile treatment services, which provide expedited services in emergencysituations. Our newly developed and acquired technologies include our recently acquired Defender lineof regenerative media filtration, which is a leader in commercial aquatics filtration; BioMag andCoMag, which address the need for capital-light solutions to increase throughput within municipaltreatment facilities; and SeaCURE, which treats ballast water in order to actively remove, kill orinactivate organisms before discharge. We must continue to develop and acquire new products, services
138
and solutions to meet the demands of our customers and compete in our markets. Our current pipelineof technologies in development includes biological wastewater diffused aeration, on-site electrolyticchlorination and electrochemical desalination, which are designed to help lower customer costs andexpand our market reach.
Stable, recurring flow of business with a large installed base drives superior topline visibility. We hadhigh visibility into over 82% of our overall revenue at the beginning of fiscal 2016. Approximately 58%of our revenue for fiscal 2016 was related to service, consumables and aftermarket parts that comefrom our repeat business and backlog. A portion of this revenue is covered by annual and multi-yearindustrial contracts that had a 98% and 99% renewal rate in fiscal 2015 and 2016, respectively. Wegenerate service and aftermarket revenue from a wide range of activities, including the regular deliveryand installation of consumable ion-exchange replacement bottles across 25,000 industrial customer sitesand the regular replacement of approximately 400,000 ultra-filtration membranes installed across 1,800locations on 4-6 year cycles as of June 30, 2017. In particular, more than 80% of Industrial customerswho purchased capital equipment during the two fiscal years ended September 30, 2015 and 2016 havealso purchased services and/or aftermarket products over the past three years. Approximately 24% ofour revenue for fiscal 2016 consisted of capital orders already contracted in backlog. The remainingapproximately 18% of revenue for the fiscal year ended September 30, 2016 represented book-to-billprojects, which we typically win and convert to revenue within the same fiscal year. For our capitalrelated sales, we selectively focus on projects that we believe have the potential to produce continuingservice, aftermarket and consumables sales. We believe the visibility and predictability we experiencewith our revenue enhances our ability to consistently drive profitability.
Well invested manufacturing and service footprint provides operating leverage and supports our growth.We believe our manufacturing, service and sales functions are capable of supporting our long-termgrowth targets. Our manufacturing base is currently operating at approximately 40% of its maximumcapacity levels at June 30, 2017, creating an opportunity for volume and margin expansion withoutsignificant new capital investments. This dynamic also enhances our ability to absorb new acquisitionsinto our existing operations, though we may not be able to successfully identify, integrate or competefor acquisition targets. We have also identified and are pursuing several operational improvementcampaigns including ePro and LEAN, our supply chain excellence initiative that centralizes andstandardizes purchasing across the organization. These initiatives, combined with low levels ofmaintenance capital expenditures and efficient working capital management, create flexibility to deploycash flow for accretive investments.
Experienced management team with proven operational capabilities that has made Evoqua an employerof choice. We are highly dependent on our leadership team, which consists of industry veterans with atrack record of executing effective strategies and achieving profitable growth. Ron Keating, our CEO, isa highly experienced executive with a strategic, commercial and operational background developed insenior roles, where he reshaped organizations and corporate portfolios for growth. Ben Stas, our CFO,has held a variety of senior financial and business roles in the capital goods sector. Our leadershipdeveloped and deployed standard operating processes under the Evoqua Growth System thatrepositioned the business and improved margins through operational programs and standards such asLEAN operating systems, service growth and ePro, among others. These programs combined with ournewly implemented sales methodology, Evoqua EDGE, have improved our free cash flow profile andgrowth prospects. Our management team has also expanded our operations to new target markets andgeographies and has demonstrated successful acquisition and integration capabilities. Our successdepends to a significant extent on our ability to retain or attract employees in senior management,skilled technical, engineering, sales and other key personnel.
After the AEA Acquisition, we began a transformation of our business into a global organizationwith an independent, professional management team. We believe our transformation has made us intoa premier partner and employer in our industry, resulting in differentiated capabilities and talent within
139
our organization. We have instilled an entrepreneurial environment where employees believe in themission and leverage the collective intellect and expertise of service technicians and engineers. Todevelop a safety focused culture, we have invested heavily in our EH&S program, which is committedto providing employees with a safe and healthy workplace while protecting our shared environment.Following the completion of this offering, we expect to be a ‘‘controlled company’’ within the meaningof the corporate governance standards of the NYSE. See ‘‘Risk Factors—Risks Relating to ourCommon Stock and this Offering—We are a ‘controlled company’ within the meaning of the corporategovernance standards of the NYSE and, as a result, will qualify for, and may rely on, exemptions fromcertain corporate governance requirements.’’
Our Growth Strategy
The key elements of our strategy include:
Grow and further penetrate our existing customer base. We believe our strong brands, leadingposition in highly fragmented markets, scalable and global offerings, leading installed base and uniqueability to provide complete treatment solutions will enable us to capture a larger share of our existingcustomers’ water treatment spend while expanding with existing and new customers into adjacentend-markets and underpenetrated regions, including by investing in our sales force and cross-selling toexisting customers. Despite having the leading market share in the North American water treatmentmarket, our share does not exceed 25% in any single market vertical according to Amane Advisors.Furthermore, our share of any given customer’s water treatment related spend is often limited to selectregions, thereby creating a significant opportunity to further penetrate existing customer accounts byoffering additional solutions and serving more sites, both in current and new geographic regions. Ourgrowth initiatives include both expanding our presence in our core North American market as well asreplicating our leading position and strategies into underpenetrated global regions. For example,through innovative technologies such as IONPURE continuous electrodeionization and Defenderaquatic regenerative media filtration systems, we have expanded our positions in markets such as Asiaand the Middle East.
In order to maintain and enhance our customers relationships, we intend to continue to invest inour sales force. Since fiscal 2014 we have increased the proportion of customer facing employees byover 25%, developed a best-in-class training program, restructured our customer relationshipmanagement system and realigned our compensation packages. Sales of our products, services andsolutions to some of our customers are accomplished in part, through the efforts of third-party salesrepresentatives. Through direct sales efforts, outreach and education, we plan to continue to enhanceour relationships and enable further adoption of our products, technologies and solutions by endcustomers and key influencers, including municipal representatives, engineering firms, designers andother system specifiers. Our performance depends, in part, on our ability to attract, incentivize andretain third-party sales representatives that will be able to market and support our products effectively,and competing for sales personnel with established customer relationships intense.
Continued transition of our customers to a higher value-add service-based business model. Our goal isto provide ‘‘worry-free water’’ by combining our products and technologies with extensive service anddistribution capabilities. We selectively target high value projects with opportunities for recurringbusiness through service, parts and other aftermarket opportunities over the lifecycle of the process orcapital equipment. In particular, we have developed a pipeline of smart, internet-connected monitoringtechnologies through the deployment of our Water One smart water platform that provides us with anincreasing ability to handle our customers’ complete water needs through on-demand watermanagement, predictive maintenance and service response planning. Water One also enables us totransition our customers to more accurate pricing models based on usage, which otherwise would nothave been possible without technological advancement. We estimate that approximately 1.6% of ourindustrial customers utilized our Water One technology in fiscal 2016. Our technology solutions provide
140

customers with increased stability and predictability in water-related costs, while enabling us to optimizeour service route network and on demand offerings through predictive analytics, which we believe willresult in market share gains, improved service levels, increased barriers to entry and reduced costs. Ourfuture growth depends, in part, on our ability to develop or acquire new products, services andsolutions, identify emerging technological trends in our target end markets and maintain the integrity ofour information technology systems.
Drive margin expansion and cash flow improvements through continued focus on operational excellenceand execution. Since fiscal 2014, we have realigned our organizational structure, achieved significantcost savings through operational efficiencies and revitalized our culture, which has energized ourworkforce and reduced employee turnover. This organizational realignment transformed our businessinto a streamlined organization focused on improved accountability, responsiveness and resulted in anoverall lower cost structure. We have identified and are pursuing a number of discrete initiatives which,if successful, we expect could result in additional cost savings over the next three years. Theseinitiatives include our ePro and supply chain improvement program to consolidate and manage globalspending, our improved logistics and transportation management program, further optimizing ourengineering cost structure, capturing benefits of our Water One remote system monitoring and dataanalytics offerings. Furthermore, as a result of significant investments we have made in our footprintand facilities, we believe have capacity to support our planned growth without commensurate increasesin fixed costs.
Commercialize and drive adoption of nascent and newly acquired technologies by leveraging our saleschannels and application expertise. We offer a full range of services, systems and technologies that wecontinually develop to meet our customers’ evolving water lifecycle needs. We develop our technologiesthrough in-house research, development and engineering and targeted tuck-in, technology-enhancingand geography-expanding acquisitions and have a reservoir of recently launched technologies and apipeline of new offerings designed to provide customers with innovative, value-enhancing solutions.Furthermore, we have successfully completed eight technology-enhancing and geography-expandingacquisitions since April 2016 to add new capabilities and cross-selling opportunities in areas such aselectrochemical and electrochlorination cells, regenerative media filtration, anodes, UV disinfection andaerobic and anaerobic biological treatment technologies. We must continue to develop and acquire newproducts, services and solutions to successfully compete in our markets.
We believe a key differentiator for our technology development program is our strong record ofincorporating new technologies into the comprehensive solutions we provide to our customers acrossour platform. We are able to rapidly scale new technologies using our leading direct and third-partysales channels and our relationships with key influencers, including municipal representatives,engineering firms, designers and other system specifiers. Through our service network, we have a directview of our customers’ water needs which allows us to focus on developing and acquiring the mostrelevant and sought-after solutions.
We believe our continued investment in driving penetration of our recently launched technologies,robust pipeline of new capabilities and best-in-class channels to market will allow us to continue toaddress our customer needs across the water lifecycle.
Continue to evaluate and pursue accretive tuck-in acquisitions to add new technologies, attractivegeographic regions and end-markets. As a complement to our organic growth initiatives, we view tuck-inacquisitions as a key element of our overall growth strategy which will enable us to accelerate ourgrowth in our current addressable market, new geographies and new end market verticals. Our existingcustomer relationships, channels to market and ability to rapidly commercialize technologies provide astrong platform to drive growth in the businesses we acquire. To capitalize on these opportunities wehave built an experienced team dedicated to mergers and acquisitions that has successfully completedeight technology-enhancing and geography-expanding acquisitions since April 2016, including theaddition of capabilities in the attractive aquatics market, which we have typically financed through
141

borrowings under our revolving credit facility and cash on hand. Although we may not continue toidentify suitable acquisition targets and implement our growth strategy, we currently have a pipelinewhich includes more than 60 potential targets, which has been developed proactively by our team aswell as informed by our customer base.
Our Industrial Segment
Our Industrial Segment provides application-specific solutions and full lifecycle services for criticalwater applications. We focus on treating industrial process water, utility water and wastewater.Industrial process water requires specific purity standards, which are used in making goods in industriessuch as microelectronics, pharmaceuticals and health sciences and food and beverage, includingingredient water. Industrial utility water is used for critical industrial applications, including as boilerfeed and cooling water. Industrial wastewater is effluent water discharged from plants or facilities whichis treated before it is returned to the environment or recycled or reused within the water cycle. Ouroperations across the water cycle are complex and, if conducted improperly, may result in potentialcosts and liabilities, including as a result of environmental damage. Our comprehensive solutions arecomprised of capital systems and related recurring aftermarket services, parts and consumables, alongwith long-term and short-term service contracts and emergency services. Our comprehensive capabilitiesrange from discrete offerings to the provision of highly complex, fully integrated solutions. We are ableto leverage our broad range of products and technologies to deliver a tailored solution that bestaddresses a specific customer’s needs, including a growing portfolio of smart water technologiesencompassed in our Water One platform. Key capital and related aftermarket service and productofferings include filtration, reverse osmosis, ion exchange and continuous deionization. As a result ofour speed, capabilities and experience, we are a trusted partner to 25,000 industrial customers,including a substantial majority of Fortune 500 industrial companies. As water is a critical componentin many industrial production processes, unavailability of proper water purity, specification or qualitycan lead to significant constraints, downtime and increased operating costs.
The cost of an installation can range from a few thousand dollars to a few million dollars andtypically provides an ongoing service and aftermarket revenue opportunity that itself reaches or exceedsthe original project cost. The service and aftermarket sales component is supported by our broadapplication and process expertise and what we believe to be the largest integrated industrial servicenetwork in North America. Our network is comprised of certified technicians and the largest fleet ofmobile reverse osmosis and deionization water treatment systems in North America, based onmanagement’s estimate, and enables us to provide a complete range of services spanning from regularmaintenance and emergency support to our unique Water One platform. Water One provides remotemonitoring capabilities which enable us to optimize our routine service calls through predictive analyticsand provide customers a more predictable, cost-efficient water solution. We offer services which includewater on-demand, mobile solutions and smart water systems that leverage our extensive branchnetwork, technical personnel and technology portfolio.
We partner with our industrial customers through our direct sales and service team, which isorganized geographically and by market vertical and is complemented by an inside sales force, fieldsales engineers and a growing e-commerce platform. We primarily target three broad categories ofcustomers in our Industrial Segment, principally based on their end markets and primary applications:Light Industries, Heavy Industries and Environmental Solutions.
142

Light Industries
Our light industries offerings include our usage-based, Water One deionized water service,preventative maintenance service contracts, integrated process and wastewater systems and aftermarketconsumables and spare parts. We generally provide light industries services to general manufacturing,light industrial, pharmaceutical, food and beverage, microelectronics and health sciences customers.
Heavy Industries
Our heavy industries offerings include mobile, rapidly deployable services based on short-termoperating contracts, ‘‘build-own-operate’’ outsourcing services and accompanying technological support,integrated process and wastewater systems and aftermarket consumables and spare parts. We generallyprovide heavy industries services to power generation, chemical processing, hydrocarbon processing andmining and pulp and paper customers.
Environmental Solutions
Our environmental solutions offerings include activated carbon, wastewater ion exchange andgroundwater remediation solutions. We generally provide environmental solutions to hydrocarbonprocessing, chemical processing, food and beverage and municipal water customers.
Our Municipal Segment
Our Municipal Segment leverages its proven application expertise to provide engineered solutionsand equipment for the treatment of wastewater, purification of drinking water and odor and corrosioncontrol for municipalities. Our portfolio of solutions includes ultrafiltration systems, advanced biologicaltreatment, clarifiers, aerators, odor and corrosion control services, equipment for new municipal plantbuilds and retrofit, rehabilitation and aftermarket parts and services for our extensive installed base. Wehave provided solutions across a large municipal installed base with capacities ranging from25,000 gallons per day to over 100 million gallons per day. Our operations are focused within the U.S.market, with a presence in the United Kingdom, Australia, Canada and Singapore.
We maintain a comprehensive municipal representative network that broadly covers the U.S.,providing us with a differentiated ability to influence specifications and the basis of design for newtreatment facilities. We also maintain relationships with engineering firms, operators and other keyinfluencers through our direct technical sales force to drive adoption of our offerings. We primarilytarget three broad categories of customers in our Municipal Segment, principally based on their endmarkets and primary application: Wastewater Treatment, Municipal Services and MEMCOR.
Wastewater Treatment
Our wastewater treatment offerings include advanced biological treatment, clarification, filtration,nutrient removal, odor and corrosion control, biosolid and field-erected biological wastewater treatmentplant solutions. We generally provide wastewater treatment solutions to both municipal and industrialwastewater treatment facilities. We provide aftermarket and retrofit solutions to our extensive installedbase.
Municipal Services
Our municipal service offerings include odor and corrosion control and disinfection capabilities,including advanced remote-monitoring and automated control solutions and multi-product liquid andvapor phase product combinations for wastewater collection. We also provide municipal servicesolutions for drinking water treatment and distribution.
143
MEMCOR
Our MEMCOR membrane technology offerings include CPII membrane systems, membranebioreactor systems and XP and XP-E technologies. These include custom solutions built from standardcomponents, modular designs for flexibility and fast installation and membrane modules for aftermarketreplacement. We generally provide MEMCOR solutions to municipal drinking water treatmentfacilities, municipal and industrial wastewater treatment facilities and industrial utility and processwater facilities.
Our Products Segment
Our Products Segment sells differentiated technologies to a diverse set of water treatment systemspecifiers, integrators and end users globally. Our offerings are highlighted by our filtration anddisinfection, electrodeionization and electrochlorination technologies, separation technologies andanodes offerings. Our filtration and disinfection offerings include our Defender line of products, whichis a regenerative media filtration leader in the commercial aquatics market. Our IONPUREelectrodeionization solutions allow customers to achieve ultrahigh purity water without the use ofchemicals in the treatment process. Our electrochlorination products provide extensive water treatmentsolutions for the maritime, oil and gas and power markets. We also have extensive capabilities in anodetechnologies, cathodic protection, solid and liquid separation technologies and various aftermarketparts, consumables and accessories. All of our offerings are highly scalable and designed to meetcurrent and future water treatment needs, with a focus on generating repeat business from ourcustomers. We generally service the equipment we provide our customers; however, their failure toproperly use, safeguard or maintain their equipment or product defects or unanticipated use of ourproducts could result in liability to us.
Our portfolio of technologies and products are sold either as discrete offerings or as componentsof broader solutions through our Industrial and Municipal Segments. Our Products Segment also sellsexternally to a customer base comprised of globally located OEMs, integrators, regional distributors,customers, regional engineering firms and various other end users that we reach through multipleestablished sales and aftermarket channels. We target customers in our Products Segment principallybased on their end markets and primary application: Aquatics and Disinfection, Process and DrinkingWater, Electrochlorination, Separation Technology and Anodes.
Aquatics and Disinfection
Our aquatics and disinfection products include a wide range of filtration (regenerative mediafilters, high rate sand filters, microsand filters and screen filters), chlorination and UV disinfectionsystems, analyzers, controllers and related accessories. We sell to commercial aquatics, municipaldrinking water, industrial and light manufacturing and commercial customers worldwide. Primaryapplications include filtration and disinfection of municipal and recreational pools and leisure facilities,fountains and water features and recreational water and waterparks, gas chlorination, UV and on-sitechlorination and disinfection and water chemistry measurement and control for municipal drinkingwater, as well as pre-treatment and purification systems where ultrapure water polishing is required.
Process and Drinking Water
Our process and drinking water products include chemical-free ultrafiltration, microelectronicprocessing technologies and desalination solutions. We generally provide these products to municipal,power, microelectronic processing, solar, hydrocarbon and chemical processing and pharmaceuticalcustomers. Primary applications include high purity process water for use in pharmaceutical, laboratoryand microelectronic processing plants and the removal of dissolved salts from seawater, brackish waterand municipal wastewater.
144
Electrochlorination
Our electrochlorination products are used with seawater for on-site sodium hypochlorite generatingsystems for maritime, oil and gas, power, military and ballast water customers. Our maritime growthprevention systems are used on military and commercial ships and in offshore oil and gas applications,and our ballast water management systems enable ships’ owners and operators in all global waters tosafely comply with stringent U.S. Coast Guard and future International Maritime Organizationregulations.
Separation Technology
Our products separate solids from liquids in a variety of slurries, for either disposal or reuse. Wegenerally provide separation technology products and solutions to power, mining, microelectronics,solar, heavy and light industrial and municipal customers, for applications including the separation ofsolids from liquids in mining companies’ tailings ponds and the separation and recovery of mineralsfrom slurry for further processing within mineral companies’ manufacturing processes.
Anodes
We produce custom-designed, state-of-the-art mixed-metal oxide anodes, provide recoating andrepair services to our external customers and supply the anodes used across our own internalprocessing capabilities. We provide anode products and solutions to mining, chemical processing, lightindustrial and microelectronics customers for primary applications including biotechnology, watertreatment, cathodic protection, seawater electrolysis, metal finishing and electroplating and swimmingpool chlorination.
For financial information regarding our reportable segments, see Note 21 to our audited financialstatements included elsewhere in this prospectus.
Customers and Suppliers
Customers
We serve three primary market verticals: (i) industrial, (ii) commercial and (iii) municipal.Industrial and commercial customers vary in size, scope and the complexity of their water treatmentneeds and include small manufacturing clients with a single facility, large commercial waterparks andmultinational corporations with a significant global footprint. The municipal market consists of potablewater and wastewater treatment solutions that are sold to municipalities and private companiesoperating under a concession agreement to own and operate a treatment facility on behalf of amunicipality. We serve each market with a full range of solutions, services, technologies andaftermarket offerings.
The industrial market is comprised of direct end market distribution channels. The commercialmarket includes a variety of routes to market including direct and third-party channel relationships.The municipal market is comprised of a wide range of drinking and wastewater treatment facilities.
As of June 30, 2017, we had over 38,000 customers spanning a diverse range of industries andinclude the twenty largest U.S. companies in each of the pharmaceutical, hydrocarbon processing,power, chemical and food and beverage industries as well as U.S. wastewater sites and global drinkingwater treatment sites. We also have customers in the health science, microelectronics, drinking water,wastewater, general manufacturing, commercial aquatics, maritime and other industries. We provideproducts, services and solutions to federal, state and local government customers both directly andindirectly as a supplier to general contractors. In the fiscal year ended September 30, 2016, ourgovernment contracts and subcontracts (i.e., sales to third parties who are prime contractors to federal,state or municipal governments) accounted for no more than 24% of our revenue. Many of our
145

government contracts contain a termination for convenience clause, regardless of whether we are theprime contractor or a subcontractor. Upon a termination for convenience, we are generally able torecover the purchase price for delivered items and reimbursement of allowable work-in-process costs.See ‘‘Risk Factors—Risks Relating to Our Business—Our contracts with federal, state and localgovernments may be terminated or adversely modified prior to completion, which could adversely affectour business’’. In the industrial market we served over 25,000 customers as of June 30, 2017, includinga substantial majority of the industrial companies within the Fortune 500. In the municipal market, wehad equipment installed in over 40% of the U.S. municipal wastewater sites as of June 30, 2017.
We strengthen our customer relationships through our large service branch network and strongbrand value, and we focus on maintaining relationships with influencers such as municipalrepresentatives, engineering firms, designers and other system specifiers, and many of our customerrelationships span over twenty years. As of June 30, 2017, we had over 25,000 industrial contracts,which include both long-term and short-term service contracts and have an average length of 1.7 yearsand a 98% rate of renewal. During fiscal 2016, no single customer accounted for more than 1% of ourrevenues, and our top ten customers accounted for approximately 7% of our revenues.
Suppliers
We maintain a cost-effective, diversified procurement program through strong relationships withstrategic suppliers across key inputs. We have implemented ePro, our supply chain excellence initiativethat centralizes and standardizes purchasing across the organization. The top materials in our supplychain include metal, calcium nitrate, membranes and ion exchange resin. Further, we seek to insourcecertain products that align with our existing core competencies, including our manufacturingcapabilities, and further enable us to provide our customers with a complete lifecycle solution. We seeksources of supply from multiple suppliers and often from multiple geographies, and we believe that oursupply chain is well positioned to remain stable and cost-effective.
Sales and Marketing
Our sales organization is positioned across our segments to drive top-line growth and increasemarket share for our Company. Our network includes third-party representatives, internal generalmanagers, sales directors, sales engineers, third-party distributors and other personnel who support ourday-to-day sales and marketing operations.
Industrial Segment
We market our offerings through our direct sales and service team, which is organizedgeographically and by end market and is complemented by an inside sales force, field sales engineersand a growing e-commerce platform. Our Industrial Segment sales organization focuses on direct saleswith a market-vertical focus across geographic, strategic and e-commerce channels to market. As ofJune 30, 2017, our Industrial Segment services network consisted of 80 industrial service branchesacross North America, with 624 field service and 149 engineering employees, and over 90% of ourcustomers are within two hours’ travel of one of our branches.
Municipal Segment
We maintain a comprehensive municipal representative network in the United States, providing uswith a unique ability to influence specifications and the basis of design for new treatment facilities. Wealso maintain relationships with engineering firms, operators and other key influencers through ourdirect technical sales force to drive adoption of our offerings. As of June 30, 2017, our MunicipalSegment sales organization consisted of an independent representative network supported by our
146

approximately 110 field service technicians and approximately 130 sales personnel, organized acrosswastewater treatment, municipal services and MEMCOR structures.
Products Segment
Our Products Segment customer base includes water treatment designers, OEMs, engineeringfirms, integrators and our own Industrial and Municipal Segments. Our Products Segment salesorganization consists of five direct and indirect sales and aftermarket channels: (i) our direct and third-party aquatics and disinfection sales representatives target commercial aquatics, municipal andindustrial water treatment in Americas, Europe, Middle East and Africa and Asia Pacific geographies,(ii) our process and drinking water sales channels work with non-exclusive OEMs and with ourIndustrial Segment to build small, ‘‘skidded’’ solutions for global industrial customers, to get ourmodular solutions specified into larger units and projects, (iii) our electrochlorination sales managerstypically work with representatives of ship builders, shipyards, ship owners, service providers andmanufacturers to have our products, services and solutions specified into commercial and military shipsand offshore oil and gas rigs, (iv) our separation technology channel managers and sales representativeswork with a large network of third-party manufacturers’ representatives that are exclusive to specificterritories or industries and leverage direct sales in industries not covered by third-party representativesand (v) our direct sales force sell our anodes into Americas, Europe and China geographies, andopportunistically cross-sell electrocatalytic products to our anode customers. As of June 30, 2017, wehad active relationships with more than 200 OEM partnerships and managed over 300 channelpartners.
Research, Development and Engineering
We utilize a disciplined, stage-gate process—consisting of development, field test,commercialization, supply chain and sourcing decisions—to identify and develop new technologies tocommercialize, focus our efforts on and engage early with supply-chain management to promoteprofitability. We focus on tuck-in acquisitions as additional resources for new product innovation anddevelopment.
Our global research, development and engineering footprint includes six facilities located in theUnited States, the Netherlands, Germany, Singapore and Australia, staffed with managers, scientists,researchers, engineers and technicians, along with partnerships spanning leading universities researchcenters and other outside agencies. We spent approximately $22.9 million in fiscal 2016 on research,development and engineering, primarily related to employee costs. In fiscal 2016, excluding parts andservice, approximately 47% of our revenue was directly or indirectly covered by our granted or pendingpatents.
Information Technology
Our information technology systems consist of enterprise management, e-commerce, customerrelationship and field service management, customer quoting and billing, environmental compliance,business and operational support, procurement and sales force management systems. We utilize ane-commerce platform that makes our products available to customers at all times, and we provide oure-commerce customers with both general and customer-specific portals, which provide customizedpricing for strategic customer accounts. Further, in connection with our ePro initiative, we haveadopted SAP Ariba to assist in automating and centralizing our procurement process. We update andbuild our information technology infrastructure through further investments focused on costefficiencies, reliability, functionality and scalability.
147
Intellectual Property
Our intellectual property and proprietary rights are important to our business. We currently haveover 1,250 granted or pending patents, which in total directly or indirectly covered approximately 47%of our revenue for fiscal 2016, excluding parts and service. We undertake to strategically andproactively develop our intellectual property portfolio by pursuing patent protection, obtainingcopyrights and registering our trademarks in the United States and in foreign countries. We currentlyrely primarily on patent, trademark, copyright and trade secret laws, and control access to ourintellectual property through license agreements, confidentiality procedures, non-disclosure agreementswith third parties, employment agreements and other contractual rights, to protect our intellectualproperty rights.
Competition
Our industry is highly fragmented, and includes a number of regional and niche-offering focusedcompetitors. Competition is largely based on product performance, reliability and innovativeness ofproducts, services and solutions, application expertise and process knowledge, brand reputation, energyand water efficiency, product compliance with regulatory and environmental requirements, productlifecycle cost, scalability, timeliness of delivery, proximity of service centers to our customers,effectiveness of our distribution channels and price. We believe that we are well-positioned in ourindustry due to our application expertise and process knowledge, our trusted brands, our broad productlines and the high quality of our products, services and solutions, our advanced technologies, our largeservice network and strong support capabilities, our manufacturing capabilities and our extensive multi-channel distribution. Within each of our segments and the various businesses that comprise them, wecompete with a fragmented range of companies, but do not have any individually key competitors.
Backlog
Backlog represents the total amount of revenue we expect to receive as a result of contracts andorders awarded to us. However, because many of our contracts and orders are subject to reduction,cancellation or termination at the option of our customer, backlog is not an indication of our futureperformance. In 2017 we implemented a new methodology to record service orders to improve visibilityof backlog and revenues associated with service contracts. Under this new methodology a servicecontract is recorded as an order when both parties have agreed to the terms and conditions, includingcontract value and length. The value assigned to the order is based on the fixed portion of the contractfor the entire contract term. Utilizing our new methodology, as of June 30, 2017, our backlog wasapproximately $664 million.
Employees
As of June 30, 2017, we had approximately 4,000 employees. Of these employees, 58% werefull-time salaried level staff and the remaining employees consisted of a mix of full-time and part-timehourly workers. Approximately 74% of our employees work in our U.S. operations and approximately26% work in foreign operations. None of our facilities in the United States or Canada are covered bycollective bargaining agreements. As is common in Germany and the Netherlands, our employeepopulations there are represented by works councils. We are not involved in any material disputes withour employees and believe that relations with our employees and, to the extent applicable, with ourorganized labor unions, are good.
Properties
We operate 160 locations located in the United States, Canada, the United Kingdom, theNetherlands, Germany, Australia, China and Singapore, including 18 manufacturing facilities, six
148

research and development facilities and 87 service branches. Of our facilities, we own 23 properties andlease 137 properties. Our North American presence includes 11 resin regeneration plants, three carbonreactivation plants and a wastewater ion exchange facility. As of June 30, 2017, the covered squarefootage of our facilities is equal to an aggregate of approximately 3.3 million square feet.
Geographic Regions
For financial information regarding our geographic regions, see Note 17 to our audited financialstatements included elsewhere in this prospectus.
Insurance
We maintain insurance policies to cover directors’ and officers’ liability, fiduciary, crime, specialaccident, property, business interruption, cargo, workers’ compensation, automobile, general liability,environmental, umbrella and excess liability insurance.
All of our insurance policies are with third-party carriers and syndicates with financial ratings of anA or better. We and our global insurance broker regularly review our insurance policies and believe thepremiums, deductibles, coverage limits and scope of coverage under such policies are reasonable andappropriate for our business. The continued availability of appropriate insurance policies oncommercially reasonable terms is important to our ability to operate our business and to maintain ourreputation. See ‘‘Risk Factors—Risks Relating to Our Business—Our operations are subject to varioushazards that may cause personal injury or property damage and increase our operating costs, and whichmay exceed the coverage of our insurance or for which we are not insured.’’
Government Regulation
We are subject to extensive and varied laws and regulations in the jurisdictions in which weoperate, including those relating to anti-corruption and trade, data security and privacy, employment,workplace safety, public health and safety, product safety, intellectual property, transportation, zoningand fire codes. We operate our business in accordance with standards and procedures designed tocomply with applicable laws and regulations.
In particular, our international operations subject us to laws and regulations related toanti-corruption and trade, including those related to export and import compliance, anti-trust andmoney laundering. Our policies mandate compliance with these laws and regulations, and we haveestablished policies and procedures designed to assist us and our personnel in compliance withapplicable United States and international laws and regulations. However, any violation of such laws,regulations or policies could result in substantial fines, sanctions, civil and/or criminal penalties,imprisonment, disgorgement of profits, debarment from government contracts and curtailment ofoperations in certain jurisdictions, and might materially adversely affect our business, financialcondition, results of operations or prospects. See ‘‘Risk Factors—Risks Relating to Our Business—Failure to comply with applicable anti-corruption and trade laws, regulations and policies, including theU.S. Foreign Corrupt Practices Act, could result in fines and criminal penalties, causing a materialadverse effect on our business, financial condition, results of operations or prospects.’’
In certain countries where we operate, our employees are represented by a works council, asrequired by local law. In such countries, we are required to consult and seek the consent or advice ofthese works councils in connection with certain corporate decisions, such as a major restructuring, achange of control or changes to local management. Certain other decisions that directly involveemployment matters applicable either to all employees or certain groups of employees may also requireworks council approval. Further, certain of our international operations offer employees defined-benefitplans in compliance with applicable local legal provisions requiring payments of, among other things,mandatory pension payments or allocations for severance pay. None of our U.S. employees are
149
represented by unions or works councils, and our U.S. operations do not maintain defined-benefitplans.
In addition, there are numerous U.S. federal, state and local laws and regulations and foreign lawsand regulations regarding data security, privacy and the collection, sharing, use, processing, disclosureand protection of personal information and other user data, the scope of which is changing, subject todiffering interpretations, and may be inconsistent among different jurisdictions. If our efforts to protectthe security of information about our customers, suppliers and employees are unsuccessful, a significantdata security breach may result in costly government enforcement actions, private litigation andnegative publicity resulting in reputation or brand damage with customers, and our business, financialcondition, results of operations or prospects could suffer. See ‘‘Risk Factors—Risks Relating to OurBusiness—If we experience a significant data security breach or fail to detect and appropriately respondto a significant data security breach, our business and reputation could suffer.’’ Further, governmentsare continuing to focus on privacy and data security and it is possible that new privacy or data securitylaws will be passed or existing laws will be amended in a way that is material to our business.
Environmental Matters
The geographic breadth of our facilities and the nature of our operations subject us to extensiveenvironmental, health and safety laws and regulations in jurisdictions throughout the world. Such lawsand regulations relate to, among other things, emissions to air, the treatment and discharge of drinkingwater and wastewater, the discharge of hazardous materials into the environment, the handling, storage,use, transport, treatment and disposal of hazardous materials and solid, hazardous and other wastes,product safety and workplace health and safety. These laws and regulations impose a variety ofrequirements and restrictions on our operations and the products we distribute. The failure by us tocomply with these laws and regulations could result in fines, penalties, enforcement actions, third-partyclaims, damage to property or natural resources and personal injury claims, requirements to investigateor cleanup property or to pay for the costs of investigation or cleanup or regulatory or judicial ordersrequiring corrective measures, including the installation of pollution control equipment, remedialactions or the pulling of products from the market, and could negatively impact our reputation withcustomers. We are not aware of any pending environmental compliance or remediation matters that, inthe opinion of management, are reasonably likely to have a material effect on our business, financialcondition, results of operations or prospects. However, environmental, health and safety laws andregulations applicable to our business, the products we distribute, the services we provide and thebusiness of our customers, and the interpretation or enforcement of these laws and regulations, areconstantly evolving and it is impossible to predict accurately the effect that changes in these laws andregulations, or their interpretation or enforcement, may have upon our business, financial condition,results of operations or prospects. Should environmental, health and safety laws and regulations, ortheir interpretation or enforcement, become more stringent, our costs could increase and significantcapital expenditures or operational restrictions could be required, which may have an adverse effect onour business, financial condition, results of operations or prospects. However, such increased stringencycould also increase demand for our products, services and solutions, which assist various industries andmunicipalities in meeting environmental and safety requirements for the treatment and discharge ofdrinking water and wastewater. In addition, increased public awareness of the presence and humanhealth impacts of man-made chemicals and naturally occurring contaminants in drinking water mayincrease demand for our municipal service offerings. Correspondingly, if stringent laws or regulationsare delayed or are not enacted, or repealed or amended to be less stringent, or enacted with prolongedphase-in periods, or not enforced, then demand for our products and services may also be reduced.
The nature of our operations, which involve the handling, storage, use, transport, treatment anddisposal of hazardous materials and solid, hazardous and other wastes, exposes us to the risk of liabilityand claims associated with contamination at our current and former facilities or sites where we have
150

disposed of or arranged for the disposal of waste, or with the impact of our products and services onhuman health and safety and the environment. Laws and regulations with respect to the investigationand remediation of contaminated sites can impose joint and several liability for releases or threatenedreleases of hazardous materials upon statutorily defined parties, including us, regardless of fault or thelawfulness of the original activity or disposal. We have been subject to claims and remediationobligations, including having been named as a potentially responsible party, in certain proceedingsinitiated pursuant to the Comprehensive Environmental Response, Compensation, and Liability Act, orCERCLA, and similar state and foreign laws, regulations and statutes, and may be named a potentiallyresponsible party in other similar proceedings in the future. Unforeseen expenditures or liabilities mayarise in connection with such matters.
Legal Proceedings
From time to time, we are subject to various claims, charges and litigation matters that arise in theordinary course of business. We believe these actions are a normal incident of the nature and kind ofbusiness in which we are engaged. While it is not feasible to predict the outcome of these matters withcertainty, we do not believe that any asserted or unasserted legal claims or proceedings, individually orin the aggregate, will have a material adverse effect on our business, financial condition, results ofoperations or prospects.
151
MANAGEMENT
Executive Officers and Directors
The following table sets forth information about our executive officers and directors, includingtheir ages as of June 30, 2017. With respect to our directors, each biography contains informationregarding the person’s service as a director, business experience, director positions held currently or atany time during the past five years, information regarding involvement in certain legal or administrativeproceedings, and the experience, qualifications, attributes or skills that caused our board of directors todetermine that the person should serve as a director of our company.
Name Age Position
Ronald C. Keating . . . . . . 49 President, Chief Executive Officer and DirectorBenedict J. Stas . . . . . . . . 49 Executive Vice President, Chief Financial Officer & TreasurerRodney Aulick . . . . . . . . . 50 Executive Vice President, Industrial Segment PresidentMalcolm Kinnaird . . . . . . 51 Executive Vice President, Municipal Segment PresidentKenneth Rodi . . . . . . . . . 47 Executive Vice President, Products Segment PresidentVincent Grieco . . . . . . . . 48 Executive Vice President, Secretary and General CounselJames Irwin . . . . . . . . . . . 45 Executive Vice President, Corporate Development and Mergers &
AcquisitionsJames Kohosek . . . . . . . . 58 Executive Vice President, Corporate Strategy & Business OperationsEdward May . . . . . . . . . . 49 Executive Vice President, Chief Supply Chain OfficerAnthony J. Webster . . . . . 48 Executive Vice President, Chief Human Resources OfficerMartin Lamb . . . . . . . . . . 57 Chairman of the Board and DirectorNick Bhambri . . . . . . . . . 53 DirectorGary Cappeline . . . . . . . . 68 DirectorJudd Gregg . . . . . . . . . . . 70 DirectorBrian R. Hoesterey . . . . . 49 DirectorVinay Kumar . . . . . . . . . . 39 Director
Ronald C. Keating
Mr. Keating has served on our board of directors and as our President and Chief Executive Officersince December 2014. Prior to joining Evoqua, Mr. Keating served as President and Chief ExecutiveOfficer of Contech Engineered Solutions, an infrastructure site solutions provider, from 2007 to 2014.Before heading Contech, Mr. Keating served as President of the Metalworking Solutions and ServicesGroup of Kennametal Inc., a supplier of tooling and industrial materials. He had also held previousroles at Kennametal as the Vice President and General Manager of the Energy, Mining andConstruction Group and for the Electronics Products Group from 2001 to 2007. Mr. Keating started hiscareer at Ingersoll-Rand Inc. in 1992 where he held various roles of increasing responsibility untildeparting in 2001. Mr. Keating is presently on the board of directors of US Ecology Inc., a publiclytraded company. Mr. Keating received an M.B.A. from the Kellogg School of Management atNorthwestern University and received a B.S. in Industrial Distribution from Texas A&M University.Mr. Keating was selected to serve on our board of directors because of the perspective, management,leadership experience and operational expertise in our business that he has developed as our Presidentand Chief Executive Officer.
Benedict J. Stas
Mr. Stas has served as our Executive Vice President, Chief Financial Officer and Treasurer sinceMarch 2015. Prior to joining Evoqua, Mr. Stas held a variety of senior financial and business roles atKennametal Inc., a supplier of tooling and industrial materials, from 1997 to 2015, including roles asVice President Finance of Business Groups from 2010 to 2013 and as Vice President of Manufacturing
152
for the Industrial Segment from 2014 to 2015. While at Kennametal Inc., Mr. Stas also served as ChiefFinancial Officer of the Industrial Business Group, Chief Financial Officer of KennametalEurope GmbH, Director of Global Manufacturing Finance, Controller of Metalworking Americas, andSenior Financial Analyst for Global Financial Sales and Marketing from 1997 to 1999. Prior to joiningKennametal Inc., Mr. Stas worked for DuPont Co., as a Plant Controller, Accountant and TeamLeader, from 1991 to 1997. Mr. Stas received an M.B.A. from Duquesne University and received a B.S.in Business Administration from Drexel University.
Rodney Aulick
Mr. Aulick has served as our Executive Vice President, Industrial Segment President since October2015. Prior to joining Evoqua in October 2001, Mr. Aulick served as a Regional Manager ofChem-Aqua, a specialty chemical company in water treatment, from 1997 to 2001. Mr. Aulick attendedNorthwestern University, Kellogg School of Management’s Executive Management Program from 2001to 2003.
Malcolm Kinnaird
Mr. Kinnaird has served as our Executive Vice President, Municipal Segment President sinceMarch 2014. Prior to joining Evoqua in 2012, Mr. Kinnaird served as Senior Vice President ofMarketing, Sales and Corporate Development at Watts Water Technology from 2010 to 2012.Mr. Kinnaird has held leadership roles at multiple companies, including as General Manager ofPentair plc Residential and Commercial Water Business from 2006 to 2009, as Vice President of WaterTreatment for Cytec Industries Inc. from 2000 to 2005, and in various industrial water Sales, Marketingand Management roles at Nalco from 1989 to 1999. Mr. Kinnaird received a B.S. in Chemistry and anExecutive M.B.A., both from the University of Pittsburgh.
Kenneth Rodi
Mr. Rodi has served as our Executive Vice President, Products Segment President since October2016. Prior to joining Evoqua in May 2016, Mr. Rodi served as Chief Executive Officer of Neptune-Benson LLC from 2013 to 2016. Prior to joining Neptune-Benson, Mr. Rodi held leadership roles atmultiple companies, including as President, Food and Beverage Systems at SPX Corporation from 2011to 2013, President of SPX Flow Technology Europe, Middle East and Africa from 2009 to 2011 basedout of the UK and President of SPX Process Equipment from 2007 to 2009. Mr. Rodi also served asVice President of Business Development for SPX Flow Technology from 2005 to 2007. Mr. Rodireceived a B.S. in Accounting from Marquette University.
Vincent Grieco
Mr. Grieco has served as our Executive Vice President, Secretary and General Counsel sinceJanuary 2015, and as acting General Counsel since we became an independent company in January2014. Mr. Grieco joined our Company in January 2003 and served as a senior counsel prior to beingnamed acting General Counsel. Prior to joining Evoqua, Mr. Grieco was a member of the corporatepractice of Morgan Lewis & Bockius LLP from 1997 to 2002 and at Dickie, McCamey & Chilcote from1993 to 1997. Mr. Grieco received a J.D. from the University of Virginia and received a B.S. inEconomics from St. Vincent College.
James Irwin
Mr. Irwin has served as our Executive Vice President, Corporate Development and Mergers &Acquisitions since May 2016. Prior to joining Evoqua, Mr. Irwin worked for A. Schulman, Inc., aninternational supplier of high-performance plastic compounds and resins, where he served as Vice
153

President Corporate Business Development from 2014 to 2016. Mr. Irwin also spent four years withCliffs Natural Resources Inc., from 2009 to 2013, where he served in various mergers and acquisitions,business development and strategy roles including Senior Director—M&A and Business Development.Mr. Irwin started his career in 1995 with KeyBanc Capital Markets where he held various roles ofincreasing responsibility related to mergers and acquisitions and private equity. Mr. Irwin received aM.B.A. from the Weatherhead School of Management at Case Western Reserve University and aB.B.A. from the University of Toledo.
James Kohosek
Mr. Kohosek has served as our Executive Vice President, Corporate Strategy & BusinessOperations since January 2017. Prior to joining Evoqua in January 2016, Mr. Kohosek held seniormanagement positions at a number of companies, including as President, Infrastructure Division ofKennametal Inc. from 2014 to 2015, as Vice President and Chief Financial Officer, IndustrialTechnologies Sector of Ingersoll Rand plc from 2002 to 2007 and as President of WestinghouseCommunications from 1998 to 2001. Mr. Kohosek received a B.S.B.A. in Accounting and a B.S.B.A. inFinance, both from Shippensburg University.
Edward May
Mr. May has served as our Executive Vice President, Chief Supply Chain Officer since October2014. Prior to joining Evoqua, Mr. May led the Global Supply Chain organization for the GilbarcoVeeder-Root operating company at Danaher Corporation from 2012 to 2014. Prior to joining Danaher,Mr. May served as Vice President of Global Supply Chain at Pall Corporation from 2006 to 2011.Mr. May received a B.S. in Operations Management from the Quinlan School of Business, LoyolaUniversity Chicago. He also received an M.B.A. in Corporate Strategy from the Kellstadt GraduateSchool of Business, DePaul University.
Anthony J. Webster
Mr. Webster has served as our Executive Vice President, Chief Human Resource Officer sinceMarch 2016. Prior to joining Evoqua, Mr. Webster served as Vice President of Human Resources,Europe & Americas, for Glaxo Smith Kline Consumer Health, a joint venture between Novartis andGlaxo Smith Kline plc, from 2015 to 2016 and as Senior Vice President and Global Head of HumanResources for Novartis Consumer Health from 2011 to 2015. Mr. Webster has held senior humanresources roles with numerous companies, including as Regional Vice President, Human Resources,EMEA for Bristol-Myers Squibb from 2008 to 2011; as Senior Director, Research & Development forBristol-Myers Squibb from 2006 to 2008; as Director, Human Resources, Latin America & Canada forBristol-Myers Squibb from 2004 to 2006; as Director, Global Business Support Functions for MeadJohnson Nutritionals from 2001 to 2004; in senior human resources and labor relations managementcapacities for Phelps Dodge Corporation from 1994 to 2001; and as Manager, Human Resources forConsolidation Coal Co. from 1992 to 1994. Mr. Webster received a B.S. in Business Administration andreceived an M.S. in Industrial and Labor Relations from West Virginia University.
Martin Lamb
Mr. Lamb has served as Chairman of our Board since March 2014. Mr. Lamb retired as ChiefExecutive of IMI plc in December 2013, after 13 years in this position and 33 years with IMI plc, apublicly traded company on the London Stock Exchange (‘‘LSE’’). He is presently Chairman andinterim Chief Executive of Rotork plc, a publicly traded company on the LSE. He also serves on theEuropean Advisory Board of AEA. Previously, Mr. Lamb has served as a Non Executive Director onthe board of Severn Trent plc, from 2008 to 2016; and as a Non Executive Director of Spectris plc,from 1999 to 2006; both publicly traded companies on the LSE. Mr. Lamb received a B.S. in
154

Mechanical Engineering from Imperial College, London and an M.B.A. from Cranfield BusinessSchool. Mr. Lamb was selected to serve as Chairman of our board of directors because of hisexperience managing and developing large businesses and complex projects in all parts of the world andhis engineering and industrial expertise.
Nick Bhambri
Mr. Bhambri has served on our board of directors since 2014. From 2007 to 2011, Mr. Bhambriwas President and Chief Executive Officer of MECS Inc., a process technology provider to the sulfuricacid industry serving the refining, metallurgical, uranium and fertilizer industries. Mr. Bhambri is amember of the American Securities Executive Council, a group of business executives and industryexperts. Mr. Bhambri served on the board of MPG Performance Group, prior to the company beingacquired by American Axle & Manufacturing Inc., in 2017. He is also a past president of the OlinEMBA alumni board and member of the Olin National Council at Washington University in St. Louis.Mr. Bhambri received a B.S. in Mechanical Engineering and an M.B.A., both from WashingtonUniversity in St. Louis. Mr. Bhambri was selected to serve on our board of directors because of hismanagement and leadership experience and his technology and industrial expertise.
Gary Cappeline
Mr. Cappeline has served on our board of directors since 2014. Mr. Cappeline currently serves asan Operating Partner of AEA. Prior to joining AEA in 2007, Mr. Cappeline was President and ChiefOperating Officer of Ashland Inc., a diversified company, to which he returned in 2002 after service asGroup VP of Engelhard Corporation from 1997 to 1999 and as President, Chemicals of HoneywellInternational from 1998 to 2000. He also served as chemical industry partner at Bear Stearns MerchantBank from 2000 to 2001. Mr. Cappeline currently serves as Lead Director on the board of directors ofInnophos Holdings, Inc., a publicly traded company, where he has been a member of theCompensation Committee for the last ten years. He previously served as a board and executivecommittee member of the American Chemistry Council, a chemical industry trade association, adirector of Unifrax Corporation, a manufacturer of high temperature insulation products, chairman anda director of Houghton International Inc., a manufacturer of metal working fluids, a director of Shoesfor Crews, LLC, a manufacturer of slip resistant footwear, a director of RelaDyne Inc., a distributor oflubricants and fuels and a director of Tampico Beverages Inc., a manufacturer of fruit drinks.Mr. Cappeline received B.S. and M.S. degrees in Chemical Engineering from the City College of NewYork and attended Harvard Business School’s Executive Management Program in 1993. Mr. Cappelinewas selected to serve on our board of directors because he possesses particular knowledge andexperience in corporate finance, strategic planning and investments.
Judd Gregg
Senator Gregg has served on our board of directors since 2014. He has spent over three decades inpublic office, most recently serving as the United States Senator from the State of New Hampshirefrom January 1993 until January 2011. During his tenure in the Senate, Senator Gregg served on anumber of key Senate Committees including Budget, Appropriations, Government Affairs, Banking,Housing and Urban Affairs, Commerce, Science and Transportation, Foreign Relations and Health,Education, Labor and Pensions. He has served as the Chairman and Ranking Member of the Health,Education, Labor and Pensions Committee and the Chairman and Ranking Member of the SenateBudget Committee as well as chairman of various sub-committees. Senator Gregg served as a chiefnegotiator of the Emergency Economic Stabilization Act of 2008 and was the lead sponsor of theDeficit Reduction Act of 2005, and, along with the late Senator Ted Kennedy, co-authored the NoChild Left Behind Act of 2001. In March 2010, Senator Gregg was appointed to President Obama’sbipartisan National Commission on Fiscal Responsibility and Reform. From 1989 to 1993, Senator
155

Gregg was the Governor of New Hampshire and prior to that was a U.S. Representative from 1981 to1989. Senator Gregg was named as Dartmouth College’s first distinguished fellow and he teaches at thecollege and its graduate schools. He serves as a director of Honeywell International Inc., a publiclytraded company, and previously served as a director of Intercontinental Exchange, Inc. from 2011 to2013. Senator Gregg received an A.B. from Columbia University and a J.D. and an L.L.M. fromBoston University. Senator Gregg was selected to serve on our board of directors because of hisexperience in local, state, national and international issues and in government, public policy, financialregulation, tax, capital markets, science, renewable technology and research, environmental protectionand conservation and foreign policy and his insight into fiscal affairs, governmental relations, legislativeand regulatory issues.
Brian R. Hoesterey
Mr. Hoesterey has served on our board of directors since 2014. Mr. Hoesterey is a Partner withAEA, which he joined in 1999, where he focuses on investments in the specialty chemicals and value-added industrial products sectors. Prior to joining AEA, Mr. Hoesterey was with BT Capital Partners,the private equity investment vehicle of Bankers Trust from 1998 to 1999. Mr. Hoesterey has alsopreviously worked for McKinsey & Co. from 1994 to 1997 and the investment banking division ofMorgan Stanley from 1989 to 1993. Mr. Hoesterey is currently a director of At Home Group Inc.,GMS, Inc., Swanson Industries and VC GB Holdings. He also serves on the Board of Trustees forMadison Square Boys and Girls Club. Mr. Hoesterey was previously on the board of CPGInternational, Houghton, SRS, Henry Company, Unifrax, Pregis and Noveon. Mr. Hoesterey currentlyserves on the Oversight Committee for Patagonia Sur, a for-profit venture that invests in, protects andenhances scenically remarkable and ecologically valuable properties in Chilean Patagonia.Mr. Hoesterey received a B.B.A. in Accounting, summa cum laude, from Texas Christian University andreceived an M.B.A. with honors from Harvard Business School. Mr. Hoesterey was selected to serve onour board of directors because he possesses particular knowledge and experience in corporate finance,strategic planning and investments.
Vinay Kumar
Mr. Kumar has served on our board of directors since 2014. He is a Partner with AEA, which hejoined in 2004, where he has focused on investments in the value-added industrial, specialty chemicaland business services sectors. Mr. Kumar was previously on the board of Dematic and involved inAEA’s investments in CPG International, Cogent Healthcare and Pregis. Prior to joining AEA,Mr. Kumar was a strategy consultant with Bain & Company in San Francisco and London from 2001 to2004. Mr. Kumar received an A.B. in History and Science with honors from Harvard University.Mr. Kumar was selected to serve on our board of directors because he possesses particular knowledgeand experience in corporate finance, strategic planning and investments.
Board Composition
Our board of directors consists of seven directors. Each director will serve until a successor is dulyelected and qualified or until his or her death, resignation or removal. There are no familyrelationships between any of our directors or executive officers. Our executive officers are elected byand serve at the discretion of the board of directors.
Our amended and restated certificate of incorporation and amended and restated bylaws providethat the authorized number of directors may be changed only by resolution of the board of directors.Our amended and restated certificate of incorporation and amended and restated bylaws also providethat our directors may be removed only for cause, and that any vacancy on our board of directors,including a vacancy resulting from an enlargement of our board of directors, may be filled only by voteof a majority of our directors then in office.
156

In accordance with the terms of our amended and restated certificate of incorporation andamended and restated bylaws, our board of directors will be divided into three classes, Class I, Class IIand Class III, with members of each class serving staggered three-year terms. The members of theclasses will be divided as follows:
• the Class I directors will be Judd Gregg and Nick Bhambri, and their terms will expire at theannual meeting of stockholders for fiscal 2018;
• the Class II directors will be Ronald C. Keating and Martin Lamb, and their terms will expire atthe annual meeting of stockholders for fiscal 2019; and
• the Class III directors will be Vinay Kumar, Brian R. Hoesterey and Gary Cappeline, and theirterms will expire at the annual meeting of stockholders for fiscal 2020.
The classification of the board of directors may have the effect of delaying or preventing changesin control of our company. We expect that additional directorships resulting from an increase in thenumber of directors, if any, will be distributed among the three classes so that, as nearly as possible,each class will consist of one-third of the directors.
Leadership Structure of the Board of Directors
Our board of directors currently separates the roles of Chief Executive Officer and Chairman.These positions are currently held by Ronald C. Keating, as our Chief Executive Officer, and MartinLamb, as the Chairman. We believe this leadership structure is appropriate for our company due to thedifferences between the two roles. The Chief Executive Officer is responsible for setting our strategicdirection, providing day-to-day leadership and managing our business, while the Chairman providesguidance to the Chief Executive Officer, chairs meetings of the board of directors, sets the agendas formeetings of our board of directors as well as provides information to the members of our board ofdirectors in advance of such meetings. In addition, separating the roles of Chief Executive Officer andChairman allows the Chairman to provide oversight of our management.
Director Independence and Controlled Company Exception
Our board of directors has affirmatively determined that Judd Gregg, Nick Bhambri and MartinLamb are independent directors under the rules of the NYSE and independent directors as such termis defined in Rule 10A-3(b)(1) under the Exchange Act. Our remaining directors are not independentbecause of their affiliations with AEA, which, together with its affiliates, indirectly holds more than50% of our common stock.
After completion of this offering, we expect to be a ‘‘controlled company’’ within the meaning ofthe corporate governance standards of the NYSE. Under these rules, a ‘‘controlled company’’ may electnot to comply with certain corporate governance requirements, including:
• the requirement that a majority of our board of directors consist of independent directors;
• the requirement that we have a nominating and corporate governance committee that iscomposed entirely of independent directors with a written charter addressing the committee’spurpose and responsibilities;
• the requirement that we have a compensation committee that is composed entirely ofindependent directors with a written charter addressing the committee’s purpose andresponsibilities; and
• the requirement for an annual performance evaluation of the nominating and corporategovernance committee and compensation committee.
157
Following this offering, we intend to utilize certain of these exemptions. As a result, we will nothave a majority of independent directors, our nominating and corporate governance committee andcompensation committee will not consist entirely of independent directors and such committees will notbe subject to annual performance evaluations. Accordingly, you will not have the same protectionsafforded to stockholders of companies that are subject to all of the applicable stock exchange rules. See‘‘Risk Factors—Risks Relating to Our Common Stock and this Offering—We are a ‘controlledcompany’ within the meaning of the corporate governance standards of the NYSE and, as a result, willqualify for, and may rely on, exemptions from certain corporate governance requirements.’’
Committees of the Board of Directors
Our board of directors has three committees: the audit committee, the compensation committeeand the nominating and corporate governance committee. Our board of directors may establish othercommittees to facilitate the management of our business. The expected composition and functions ofthe audit committee, compensation committee and nominating and corporate governance committeeare described below.
Audit Committee
The members of the audit committee are Gary Cappeline, as Chairman, Nick Bhambri and VinayKumar. Gary Cappeline qualifies as our ‘‘audit committee financial expert’’ within the meaning ofregulations adopted by the SEC. Our board of directors has also determined that Nick Bhambri is‘‘independent’’ as defined under the NYSE rules and the Exchange Act and rules and regulationspromulgated thereunder. The audit committee recommends the annual appointment and reviewsindependence of auditors and reviews the scope of audit and non-audit assignments and related fees,the results of the annual audit, accounting principles used in financial reporting, internal auditingprocedures, the adequacy of our internal control procedures, related party transactions andinvestigations into matters related to audit functions. The audit committee is also responsible foroverseeing risk management on behalf of our board of directors. See ‘‘—Risk Oversight.’’
Compensation Committee
The members of the compensation committee are Brian R. Hoesterey, as Chairman, GaryCappeline, Vinay Kumar and Martin Lamb. The principal responsibilities of the compensationcommittee are to review and approve matters involving executive and director compensation,recommend changes in employee benefit programs, authorize equity and other incentive arrangementsand authorize our company to enter into employment and other employee-related agreements.
Nominating and Corporate Governance Committee
The members of the nominating and corporate governance committee will be Vinay Kumar, asChairman, Gary Cappeline and Brian R. Hoesterey. The nominating and corporate governancecommittee assists our board of directors in identifying individuals qualified to become board members,makes recommendations for nominees for committees and develops, recommends to the board ofdirectors and reviews our corporate governance principles.
Compensation Committee Interlocks and Insider Participation
None of our executive officers serves, or in the past year has served, as a member of the board ofdirectors or compensation committee (or other committee performing equivalent functions) of anyentity that has one or more executive officers serving on our board of directors or compensationcommittee. No interlocking relationship exists between any member of the compensation committee (orother committee performing equivalent functions) and any executive, member of the board of directors
158

or member of the compensation committee (or other committee performing equivalent functions) ofany other company.
Risk Oversight
Our board of directors administers its risk oversight function primarily through the auditcommittee. To that end, our audit committee meets semi-annually with our Chief Financial Officer andour independent registered public accounting firm, who provide regular updates regarding ourmanagement’s assessment of risk exposures including liquidity, credit and operational risks and theprocess in place to monitor such risks and review results of operations, financial reporting andassessments of internal controls over financial reporting. Our board of directors believes that itsadministration of risk management has not affected its leadership structure, as described above.
Code of Ethics
We have adopted a Code of Ethics and Business Conduct applicable to all of our directors, officers(including our principal executive officer, principal financial officer and principal accounting officer)and all global employees. Our Code of Ethics and Business Conduct is available on our website atwww.evoqua.com under About Us—Ethics and Compliance. In the event that we amend or waivecertain provisions of our Code of Ethics and Business Conduct applicable to our principal executiveofficer, principal financial officer or principal accounting officer that requires disclosure underapplicable SEC rules, we intend to disclose the same on our website. Our website is not part of thisprospectus.
159
COMPENSATION DISCUSSION AND ANALYSIS
The discussion that follows describes the fiscal 2017 executive compensation program for theexecutive officers listed below (our ‘‘NEOs’’):
Name Title
Ronald Keating . . . . . . . . . . . . . . . . President, Chief Executive Officer and DirectorBenedict J. Stas . . . . . . . . . . . . . . . . Executive Vice President, Chief Financial Officer & TreasurerAnthony J. Webster . . . . . . . . . . . . . Executive Vice President, Chief Human Resources OfficerVincent Grieco . . . . . . . . . . . . . . . . . Executive Vice President, Secretary and General CounselJames Kohosek . . . . . . . . . . . . . . . . . Executive Vice President, Corporate Strategy & Business
Operations
Background
Prior to the AEA Acquisition, we operated as the Water Technologies Business Unit of Siemens.All compensation programs implemented since the AEA Acquisition through fiscal 2017 in which ourNEOs participated, and all decisions made with regard to the compensation of our NEOs, wereprograms of, or decisions made by, the Compensation Committee. As part of its overall review theCompany’s compensation program in light of the anticipated initial public offering, the CompensationCommittee determined it was appropriate to provide all members of our executive leadership teamgenerally comparable employment terms. In connection therewith, effective as of September 2017, theCompensation Committee amended the employment agreements for each of the Company’s executiveofficers, including those NEOs who had entered into an employment agreement in connection with hiscommencement of employment with the Company, and entered into a new employment agreement witheach of Messrs. Grieco and Kohosek, who were not previously party to an employment agreement (theemployment agreements (as amended) collectively, the ‘‘Employment Agreements’’ and each, an‘‘Employment Agreement’’). The Employment Agreements generally set forth the material terms of theNEOs’ respective compensation packages and are described in greater detail below in the sectionentitled ‘‘Employment Agreements.’’ AEA also adopted the Evoqua Water Technologies Corp. StockOption Plan (the ‘‘Option Plan’’) for purposes of providing management team members equitycompensation following the AEA Acquisition.
Since the AEA Acquisition, the Compensation Committee has had the responsibility for reviewingthe executive compensation arrangements in place for NEOs and it will continue to exercise theseduties with the overall intent of structuring future compensation in a way that maximizes long-termCompany growth and aligns the interests of our management team members, including the NEOs, withthe interests of our stockholders.
2017 Compensation Goals and Philosophy
The appropriate mix and amount of compensation for each NEO vary based on the level of theexecutive’s responsibilities and, as discussed above, were generally individually negotiated and initiallyestablished at the time of the executive’s commencement of employment with the Company, with thematerial terms relating to cash compensation and short-term incentive compensation being set forth inthe Employment Agreements (subject to adjustment by the Compensation Committee as part of itsperiodic review of the NEOs’ executive compensation arrangements) and long-term equitycompensation taking the form of options granted under the Option Plan.
For fiscal 2017, general objectives of the executive compensation program included the following:
• balancing an entrepreneurial focus with the need to set and achieve pre-determined goals;
• aligning with best practices and standards as determined by institutional shareholders andshareholder advisors;
160

• basing annual reward opportunities on performance measures linked to shareholder valuecreation;
• providing substantial upside opportunity that is linked to superior performance; and
• requiring a threshold level of performance in order for any award to be earned.
Beginning in fiscal 2016 management has retained the Hay Group to review and advise on ourcompany-wide compensation structure, including as the structure applied to the named executive officerroles. At the request of management, the Hay Group evaluated corporate profiles and referenced itsUS Industrial Compensation Report, which report includes information for over 450 companies in theUnited States. For purposes of its analysis, the Hay Group utilized information from the report,specifically focusing on industrial companies of a size range similar to us (with an annual revenue of$1 billion-$2 billion) for the purpose of reviewing the internal and external competitiveness ofcompensation levels. Their initial report was presented to the Compensation Committee in June 2016,and the analysis was used as a comparative tool by the Compensation Committee to understand theCompany’s executive compensation program in context of the current practices and compensation levelsin the industrial sector. Based in part on the information learned from the industrial sector studyprovided by the Hay Group as well as informal market surveys, other publicly available information aswell as the Chief Executive Officer’s and Chief Human Resource Officer’s input, the CompensationCommittee implemented certain changes to our executive compensation program for fiscal 2017. TheCompensation Committee believes, as compared to the industry sector data, the Company’s cashcompensation levels are positioned at approximately the 50th percentile as compared to total cashcompensation levels provided for similar positions in our industry generally with certain individualspotentially earning higher amounts based on performance. The Compensation Committee has not, todate, utilized a specific, more narrowly-tailored peer group, however, in the third quarter of fiscal 2017,the Board retained Pearl Meyer & Partners (‘‘Pearl Meyer’’) as a compensation consultant for thepurpose of aiding in the evaluation of the Company’s compensation program for fiscal 2018, and inconnection therewith, Pearl Meyer has commenced the process of identifying a peer group which theCompensation Committee may refer to for the purpose of making compensation decisions in fiscal2018.
It is expected that in future years, the Compensation Committee will continue to review basesalaries, awards of cash bonuses and equity grants on an annual basis in order to determine whetherthe levels and allocation of the various elements of our NEOs’ compensation packages are appropriate.The Compensation Committee will conduct its review after the Chief Executive Officer and the ChiefHuman Resources Officer have presented recommendations regarding the level and mix ofcompensation for our NEOs (other than for the Chief Executive Officer), including with respect tobase salary, short-term incentive compensation and long-term incentive compensation. The ChiefExecutive Officer’s recommendations will be developed in consultation with our Chief HumanResources Officer and other Company representatives. In the future, the Compensation Committeemay commission specific peer group data as part of its analysis.
The Compensation Committee does not maintain any formal policy or formula for allocating theappropriate mix of compensation as it believes it is more important to remain flexible to respond toshifts in the marketplace in which the Company must compete to recruit and retain executive talent.Therefore, the Compensation Committee retains the authority to review our NEOs’ compensationperiodically and to use its discretion to adjust the mix of compensation and the amount of any elementof compensation as it deems appropriate for each NEO.
Base Salary
We believe that the provision of base salary plays an important role in attracting and retaining topexecutive talent by providing executives with a predictable level of income. Base salaries represent afixed portion of our NEOs’ compensation and vary, principally based on job responsibility. It is
161
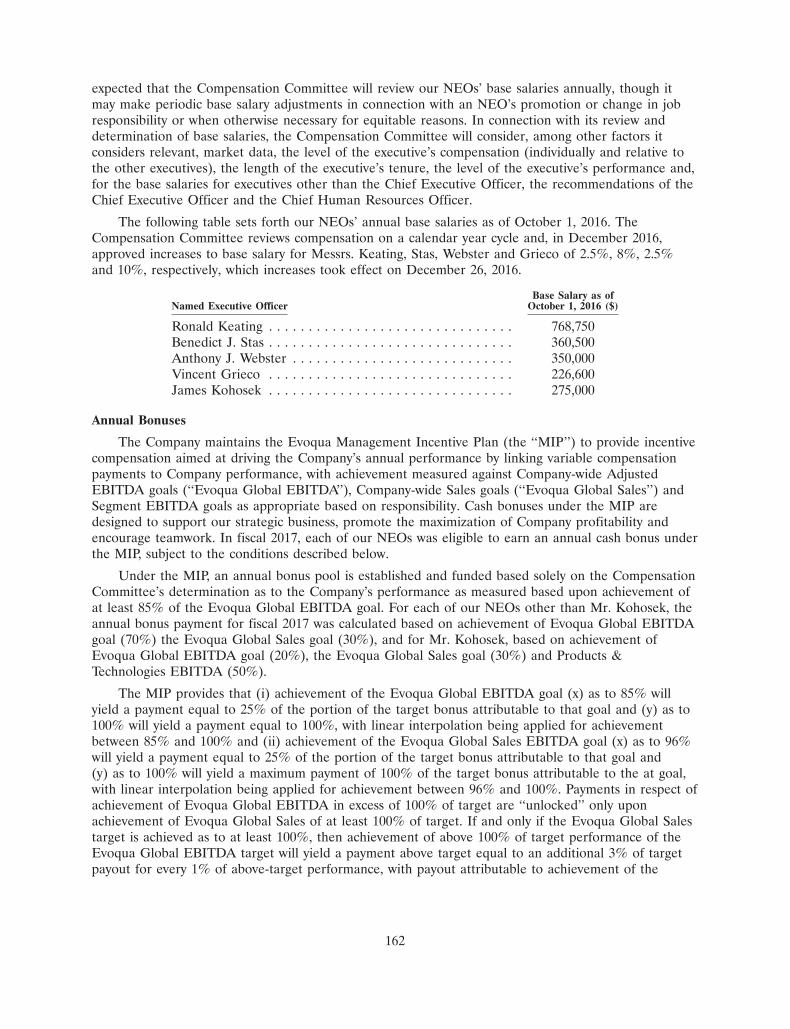
expected that the Compensation Committee will review our NEOs’ base salaries annually, though itmay make periodic base salary adjustments in connection with an NEO’s promotion or change in jobresponsibility or when otherwise necessary for equitable reasons. In connection with its review anddetermination of base salaries, the Compensation Committee will consider, among other factors itconsiders relevant, market data, the level of the executive’s compensation (individually and relative tothe other executives), the length of the executive’s tenure, the level of the executive’s performance and,for the base salaries for executives other than the Chief Executive Officer, the recommendations of theChief Executive Officer and the Chief Human Resources Officer.
The following table sets forth our NEOs’ annual base salaries as of October 1, 2016. TheCompensation Committee reviews compensation on a calendar year cycle and, in December 2016,approved increases to base salary for Messrs. Keating, Stas, Webster and Grieco of 2.5%, 8%, 2.5%and 10%, respectively, which increases took effect on December 26, 2016.
Base Salary as ofNamed Executive Officer October 1, 2016 ($)
Ronald Keating . . . . . . . . . . . . . . . . . . . . . . . . . . . . . . . 768,750Benedict J. Stas . . . . . . . . . . . . . . . . . . . . . . . . . . . . . . . 360,500Anthony J. Webster . . . . . . . . . . . . . . . . . . . . . . . . . . . . 350,000Vincent Grieco . . . . . . . . . . . . . . . . . . . . . . . . . . . . . . . 226,600James Kohosek . . . . . . . . . . . . . . . . . . . . . . . . . . . . . . . 275,000
Annual Bonuses
The Company maintains the Evoqua Management Incentive Plan (the ‘‘MIP’’) to provide incentivecompensation aimed at driving the Company’s annual performance by linking variable compensationpayments to Company performance, with achievement measured against Company-wide AdjustedEBITDA goals (‘‘Evoqua Global EBITDA’’), Company-wide Sales goals (‘‘Evoqua Global Sales’’) andSegment EBITDA goals as appropriate based on responsibility. Cash bonuses under the MIP aredesigned to support our strategic business, promote the maximization of Company profitability andencourage teamwork. In fiscal 2017, each of our NEOs was eligible to earn an annual cash bonus underthe MIP, subject to the conditions described below.
Under the MIP, an annual bonus pool is established and funded based solely on the CompensationCommittee’s determination as to the Company’s performance as measured based upon achievement ofat least 85% of the Evoqua Global EBITDA goal. For each of our NEOs other than Mr. Kohosek, theannual bonus payment for fiscal 2017 was calculated based on achievement of Evoqua Global EBITDAgoal (70%) the Evoqua Global Sales goal (30%), and for Mr. Kohosek, based on achievement ofEvoqua Global EBITDA goal (20%), the Evoqua Global Sales goal (30%) and Products &Technologies EBITDA (50%).
The MIP provides that (i) achievement of the Evoqua Global EBITDA goal (x) as to 85% willyield a payment equal to 25% of the portion of the target bonus attributable to that goal and (y) as to100% will yield a payment equal to 100%, with linear interpolation being applied for achievementbetween 85% and 100% and (ii) achievement of the Evoqua Global Sales EBITDA goal (x) as to 96%will yield a payment equal to 25% of the portion of the target bonus attributable to that goal and(y) as to 100% will yield a maximum payment of 100% of the target bonus attributable to the at goal,with linear interpolation being applied for achievement between 96% and 100%. Payments in respect ofachievement of Evoqua Global EBITDA in excess of 100% of target are ‘‘unlocked’’ only uponachievement of Evoqua Global Sales of at least 100% of target. If and only if the Evoqua Global Salestarget is achieved as to at least 100%, then achievement of above 100% of target performance of theEvoqua Global EBITDA target will yield a payment above target equal to an additional 3% of targetpayout for every 1% of above-target performance, with payout attributable to achievement of the
162

Evoqua Global EBITDA not being capped. Payouts attributable to achievement of Evoqua Global Salesand Segment EBITDA are capped at 100% and 200% of target payout, respectively.
The relevant threshold and target goals for fiscal 2017 were as follows:
Threshold Target Maximum
Evoqua Global EBITDA (1) (in millions) . . . . . . . . . . . . . . . $ 184.7 $ 217.3 —Evoqua Global Sales (1) (in millions) . . . . . . . . . . . . . . . . . . $1,234.4 $1,285.8 $1,285.8Products & Technologies EBITDA (1) (in millions) . . . . . . . . $ 27.5 $ 32.3 $ 43.1
(1) None of Evoqua Global EBITDA, Evoqua Global Sales or Products & Technologies EBITDAare a presentation made in accordance with GAAP, and none are intended to present ameasure of financial condition superior to those determined under GAAP. The Evoqua GlobalEBITDA metric and goals correlate to Adjusted EBITDA used for financial reportingpurposes, and the most directly comparable GAAP measure is Net Income, as referenced in‘‘Summary Consolidated Financial and Operating Data’’ included elsewhere in this prospectus.The Evoqua Global Sales metric and goals correlate to the Revenue from product sales andservices line item used for financial reporting purposes (after being adjusted, for purposes ofthe MIP, on a pro forma basis for revenue attributable to acquisitions). The Products &Technologies EBITDA metric and goals are an approximately 40% component of theEBITDA (Products) segment used for financial reporting purposes (after being adjusted, forpurposes of the MIP, on a pro forma basis for EBITDA attributable to acquisitions).
Each of our NEOs is entitled to a target bonus equal to a percentage of his base salary, as setforth in the table below. The annual bonuses under the MIP for fiscal 2017 for our NEOs (subject tofunding of the annual bonus pool based on achievement of at least 85% the Evoqua Global EBITDAtarget) were subject to adjustment by the Compensation Committee, at its discretion, based on theexecutive’s individual performance and contribution to the Company during the year.
The following table sets forth the fiscal 2017 annual bonus target for each of our NEOs, expressedas a percentage of base salary.
Name Target
Ronald Keating . . . . . . . . . . . . . . . . . . . . . . . . . . . . . . . . 100%Benedict J. Stas . . . . . . . . . . . . . . . . . . . . . . . . . . . . . . . . 70%Anthony J. Webster . . . . . . . . . . . . . . . . . . . . . . . . . . . . . 50%Vincent Grieco . . . . . . . . . . . . . . . . . . . . . . . . . . . . . . . . 50%James Kohosek(1) . . . . . . . . . . . . . . . . . . . . . . . . . . . . . . 60%
(1) Effective January 1, 2017, Mr. Kohosek’s annual target bonus was increasedfrom 50% to 60%.
In connection with this offering, the Company expects to adopt and submit for shareholderapproval the Evoqua Water Technologies Corp. 2017 Annual Incentive Plan (the ‘‘Bonus Plan’’), whichsets forth other performance criteria and performance goals which may be used by the CompensationCommittee in future fiscal years in determining the appropriate annual cash incentive packages for ourNEOs. The material terms of the Bonus Plan are described under the heading ‘‘—Material Terms ofthe Evoqua Water Technologies Corp. 2017 Annual Incentive Plan’’.
Long-Term Incentive Plan
As discussed above, the Company maintains the Option Plan, a long-term incentive plan underwhich we may make grants of options from time to time. The main objectives of the Option Plan are to(1) directly link our executives to increasing shareholder value, (2) incentivize our executives to work
163

towards the achievement of our long-term performance goals, (3) provide the Company a competitivemeans through which we may better attract able individuals to become executives and (4) retainexecutives for multiple-year periods by providing them with stock ownership opportunities.
For the foregoing reasons, we believe providing our NEOs long-term equity compensation in theform of options further advances and aligns the interests of the Company and its stockholders. TheCompensation Committee has the authority to make grants under the Option Plan as it deemsappropriate, and generally does so in connection with new hires or promotions within the Company.
For a description of the effect of a Change in Control (as defined in the Option Plan) on theseoptions, please see the section entitled ‘‘Payments upon Certain Events of Termination or Change inControl’’ below.
In connection with this offering, the Company expects to adopt and submit for shareholderapproval the Evoqua Water Technologies Corp. 2017 Equity Incentive Plan (the ‘‘Equity IncentivePlan’’). The material terms of the Equity Incentive Plan are described under the heading ‘‘—MaterialTerms of the Evoqua Water Technologies Corp. 2017 Equity Incentive Plan.’’
Retirement Plans
The Company provides retirement benefits to the NEOs, including matching contributions, underthe terms of its tax-qualified defined contribution plan (the ‘‘401(k) Plan’’). The NEOs participate inthe 401(k) Plan on the same terms as our other participating employees.
The Company also maintains a nonqualified deferred compensation plan (the ‘‘DeferredCompensation Plan’’) in which the NEOs participate and under which they are eligible to receivematching contributions. Under the Deferred Compensation Plan, the NEOs may elect to defer portionsof their compensation that are not otherwise available due to limitations on contributions to the 401(k)Plan under the Code. For a further description of the Deferred Compensation Plan and the paymentsthat were made in fiscal 2017, please see the section entitled ‘‘Nonqualified Deferred Compensation asof September 30, 2017’’ below.
We believe that the retirement benefits provided under the 401(k) Plan and the DeferredCompensation Plan are comparable to those provided by comparable companies. The Company doesnot maintain any defined benefit plans for any of its executive officers.
Perquisites and Other Personal Benefits
The Company provides the NEOs with perquisites and other personal benefits, or an allowance forcertain perquisites, that it believes are reasonable and consistent with its overall compensation programto better enable the Company to attract and retain superior employees for key positions. For fiscal2017, the Company paid stipends to each of the NEOs for the purpose of covering, in the NEO’s solediscretion, costs associated with services such as an executive physical examination, lease of anautomobile and/or financial planning services. In fiscal 2017, Mr. Keating was also reimbursed forcertain relocation expenses and a portion of his country club membership.
We believe that these benefits enable our executives to focus on our business and enhance theircommitment to us. In addition, each of our NEOs received Company matching contributions under the401(k) Plan and Messrs. Keating, Stas and Kohosek received Company matching contributions underthe Deferred Compensation Plan.
The Compensation Committee periodically reviews the levels of perquisites and other personalbenefits that may be made available to our NEOs through the stipend to confirm that such levels arereasonable and continue to serve their intended retentive purposes.
164

IPO Awards—Restricted Stock Units
Prior to the consummation of this offering, the Company expects to enter into restricted stock unitaward agreements (the ‘‘IPO RSU Agreements’’) with each of our NEOs and certain other keymembers of management pursuant to which recipients will be entitled to receive an award of stock-settled restricted stock units (the ‘‘IPO RSUs’’), the aggregate value of which equals $25 million. TheIPO RSU Agreements provide that each grantee will be entitled to receive a number of IPO RSUsequal to the quotient of (a) each such grantee’s ‘‘Aggregate Grant Amount’’ (set forth in each grantee’sIPO RSU Agreement), divided by (b) the closing price of one share of Company common stock asreported on the principal nationally recognized stock exchange on which such shares are traded on thefirst day of trading following the effectiveness of this registration statement. Pursuant to the IPO RSUAgreements, the IPO RSUs will vest and settle in full upon the second anniversary of the IPO Date (asdefined in the IPO RSU Agreement, the ‘‘Vesting Date’’), subject to the grantee’s continuedemployment with the Company or any of its subsidiaries through the Vesting Date; provided, however,that in the event that a Change in Control (as defined in the Option Plan) occurs prior to the VestingDate, the IPO RSUs will vest and settle in full upon the date of such Change in Control, subject to thegrantee’s continued employment with the Company or any of its subsidiaries through the Change inControl date. In the event that the grantee is terminated for any reason prior to the Vesting Date, thegrantee will forfeit each of his or her IPO RSUs for no consideration as of the date of suchtermination of employment; provided, that, if the grantee is terminated without Cause (as defined inthe IPO RSU Agreement) prior to the Vesting Date, the IPO RSUs will vest and settle in full upon theVesting Date as though the grantee had remained employed through such date.
We expect the non-cash stock-based compensation expense associated with the one-time grant ofthe IPO RSUs to each of our NEOs and other key members of management in connection with theconsummation of this offering to be approximately $25 million, which will be incremental to ourongoing stock-based compensation expense. This stock-based compensation expense will be finalizedfollowing the pricing of this offering and is expected to be expensed beginning in the fiscal quarter inwhich this offering closes and continuing over the following eight fiscal quarters.
Risk Analysis of Compensation Program
The Compensation Committee has reviewed our compensation program to determine if theelements encourage excessive or unnecessary risk-taking that is reasonably likely to have a materialadverse effect on the Company. The Compensation Committee believes that the Company’scompensation program offers an appropriate mix of fixed compensation and short- and long-termvariable compensation so as to mitigate the motivation to take high levels of business risk. As a result,the Compensation Committee believes that our compensation program does not encourageunreasonable risk-taking that is reasonably likely to have a material adverse effect on the Company.
Internal Revenue Code Section 162(m)
As a private company, in fiscal 2017 the Company was not subject to Section 162(m) of theInternal Revenue Code of 1986, as amended (‘‘Section 162(m)’’). In making future compensationdecisions, the Compensation Committee will consider the potential impact of Section 162(m), whichdisallows a tax deduction for any publicly held corporation for individual compensation exceeding$1 million in any taxable year for the Chief Executive Officer and the next three mostly highlycompensated officers (other than the Chief Financial Officer), other than compensation that isperformance-based under a plan that is approved by the stockholders of the Company and meets othertechnical requirements. However, the Compensation Committee reserves the right to provide forcompensation to executive officers that may not be deductible if it believes such compensation is in thebest interests of the Company and its stockholders. Transition provisions under Section 162(m) mayapply for a period of approximately three years following the consummation of an initial public offeringof the Company (which is not guaranteed to occur) to certain compensation arrangements that wereentered into before such initial public offering, including, without limitation, awards under the BonusPlan and the Option Plan and any future awards under the MIP and the Equity Incentive Plan.
165

COMPENSATION OF NAMED EXECUTIVE OFFICERS
SUMMARY COMPENSATION TABLE
The following table sets forth the cash and non-cash compensation paid to our NEOs for the fiscalyears ended September 30, 2017 and September 30, 2016.
Non-EquityIncentive
Option Plan All OtherFiscal Salary Bonus Awards Compensation Compensation Total
Name & Principal Position Year ($) ($) ($)(1) ($) ($)(2) ($)
Ronald Keating . . . . . . . . . . . . . . . . 2017 783,534 — 67,277 787,969 267,540 1,906,320President, Chief Executive Officer 2016 764,423 — — 526,594 156,717 1,447,734and Director(3)
Benedict J. Stas . . . . . . . . . . . . . . . . 2017 383,192 — 19,205 273,000 53,945 729,342Executive Vice President, Chief 2016 358,077 — — 148,166 55,537 561,780Financial Officer & Treasurer(4) . .
Anthony J. Webster . . . . . . . . . . . . . 2017 356,731 — — 179,375 40,391 576,497Executive Vice President, Chief 2016 196,189 — 652,120 170,625 135,082 1,154,016Human Resources Officer(5) . . . . .
Vincent Grieco . . . . . . . . . . . . . . . . . 2017 244,600 — 227,641 125,000 32,007 629,248Executive Vice President, Secretaryand General Counsel (6)
James Kohosek . . . . . . . . . . . . . . . . 2017 275,000 — 590,754 159,084 34,596 1,059,434Executive Vice President,Corporate Strategy & BusinessOperations (7)
(1) The amounts in this column were calculated based on the grant date fair value of our commonstock, in accordance with FASB ASC Topic 718. Assumptions used to determine the grant date fairvalue are set forth in Note 15 to our audited consolidated financial statements for the fiscal yearended September 30, 2016 included elsewhere in this prospectus.
(2) As described above in the section entitled ‘‘Perquisites and Other Personal Benefits, the amountsset forth under the ‘‘All Other Compensation’’ include stipends paid to each of our NEOs for thepurpose of covering the NEO’s costs associated with services such as an executive physicalexamination, lease of an automobile and / or financial planning services in the following amounts:$30,000 for Mr. Keating and $25,000 for each of Messrs. Webster, Grieco and Kohosek.
(3) The amount set forth under ‘‘All Other Compensation’’ includes: (i) matching contributions madeto the 401(k) Plan of approximately $17,948, (ii) matching contributions made to the DeferredCompensation Plan of approximately $61,913, (iii) $132,384 of costs incurred in connection withMr. Keating’s relocation to the location of the Company’s principal offices and(iv) reimbursements for expenses associated with Mr. Keating country club membership ofapproximately $25,295.
(4) The amount set forth under ‘‘All Other Compensation’’ includes: (i) matching contributions madeto the 401(k) Plan of approximately $13,536 and (ii) matching contributions made to the DeferredCompensation Plan of approximately $15,409.
(5) The amount set forth under ‘‘All Other Compensation’’ includes matching contributions made tothe 401(k) Plan of approximately $20,391.
(6) The amount set forth under ‘‘All Other Compensation’’ includes matching contributions made tothe 401(k) Plan of approximately $12,007.
(7) The amount set forth under ‘‘All Other Compensation’’ includes: (i) matching contributions madeto the 401(k) Plan of approximately $13,720 and (ii) matching contributions made to the DeferredCompensation Plan of approximately $876.
166

GRANTS OF PLAN-BASED AWARDS
The table below sets forth information regarding all grants of awards made to the NEOs duringthe fiscal year ended September 30, 2017. For further information regarding the terms of certain ofthese grants, see ‘‘Compensation Discussion and Analysis’’ above.
Estimated Future Payouts ExerciseUnder Non-Equity All Other Price of Grant Date FairIncentive Plan Awards(1) Option Option Value of OptionDate of Threshold Target Max Awards Awards Awards
Name Grant ($) ($) ($) (#) ($) ($)
Ronald Keating . . . . . . . . . . . . . . . . . . — 0 787,969 — — — —10/28/16 — — — 29,653 7.42 67,277
Benedict J. Stas . . . . . . . . . . . . . . . . . . — 0 273,000 — — — —10/28/16 — — — 8,465 7.42 19,205
Anthony J. Webster . . . . . . . . . . . . . . . — 0 179,375 — — — —Vincent Grieco . . . . . . . . . . . . . . . . . . — 0 125,000 — — — —
12/19/16 — — — 100,336 7.42 227,641James Kohosek . . . . . . . . . . . . . . . . . . — 0 165,000 — — — —
11/29/16 — — — 121,309 7.42 275,22412/19/16 — — — 148,266 7.42 315,530
(1) These columns, where applicable, show the range of possible payouts which were targeted for fiscal2017 performance under the MIP as described above under ‘‘—Annual Bonuses’’.
Employment Agreements
We currently use employment agreements to attract and/or retain our NEOs, the materials termsof which are described below.
President, Chief Executive Officer and Director (Ronald Keating)
On September 8, 2014 the Company entered into an employment agreement with Mr. Keating,which agreement was amended on September 6, 2017. Mr. Keating’s Employment Agreement providesthat his initial employment term commenced on December 1, 2014 and will expire on December 1,2017, subject thereafter to automatic one-year extensions unless either the Company or Mr. Keatingprovides at least 30 days’ written notice to the other of intent not to renew the term. The EmploymentAgreement provides that Mr. Keating would receive an initial base salary of $750,000 per year, subjectto increase at the discretion of the Board, and that he would be eligible to participate in all benefitprograms for which other senior executives of the Company are generally eligible. Mr. Keating wouldalso be eligible to earn a target annual bonus equal to 100% of his base salary, with the actual bonuspaid to be based on the Company’s actual performance relative to the performance targets establishedby the Board or a committee thereof. In addition, Mr. Keating would be entitled to reimbursement forthe following items, in each case in accordance with the expense reimbursement policy of the Companyin effect from time to time: (a) reasonable out-of-pocket business expenses incurred in performing hisduties, (b) commuting and temporary living expenses, on a grossed-up basis for taxes, related to hisprincipal place of employment at the Company’s offices in Warrendale, PA (including, withoutlimitation, weekly flights between Cincinnati and Pittsburgh, hotel expenses or rental apartmentexpenses, and a car) until Mr. Keating determines to relocate his residence to the location of theCompany’s principal offices, at which time the Company will reimburse Mr. Keating for all reasonablerelocation expenses on a grossed-up tax basis. Mr. Keating’s Employment Agreement also provides forseverance upon certain terminations of employment, as described below under ‘‘—Payments uponCertain Events of Termination or Change in Control.’’ The Employment Agreement includes restrictive
167

covenants providing for non-competition, non-solicitation of employees and non-interference withbusiness relationships, in each case during employment and for two years thereafter, mutualnon-disparagement, and perpetual nondisclosure of confidential information.
Executive Vice President, Chief Financial Officer & Treasurer (Benedict J. Stas)
On February 26, 2015 the Company entered into an employment agreement with Mr. Stas, whichagreement was amended on September 6, 2017. Mr. Stas’ Employment Agreement provides that hisinitial employment term commenced on March 30, 2015 and will expire on March 30, 2018, subjectthereafter to automatic one-year extensions unless either the Company or Mr. Stas provides at least30 days’ written notice to the other of intent not to renew the term. The Employment Agreementprovided that Mr. Stas would receive an initial annual base salary of $350,000, subject to increase at thediscretion of the Board, and shall be eligible to receive an initial target annual bonus equal to 60% ofhis base salary, with the actual bonus paid to be based on the Company’s actual performance relativeto the performance targets established by senior management of the Company. In addition, inaccordance with the Company’s expense reimbursement policy in effect from time to time, Mr. Staswould be entitled to reimbursement for reasonable out-of-pocket business expenses incurred inperforming his duties and is eligible to participate in all benefit programs for which other executives ofthe Company are generally eligible. Mr. Stas’ Employment Agreement also provides for severance uponcertain terminations of employment, as described below under ‘‘—Payments upon Certain Events ofTermination or Change in Control.’’ The Employment Agreement includes restrictive covenantsproviding for non-competition, non-solicitation of employees and non-interference with businessrelationships, in each case during employment and for one year thereafter, non-disparagement of theCompany, and perpetual nondisclosure of confidential information.
Executive Vice President, Chief Human Resources Officer (Anthony J. Webster)
On January 20, 2016 the Company entered into an employment agreement with Mr. Webster,which agreement was amended on September 6, 2017. Mr. Webster’s Employment Agreement providesthat his initial employment term commenced on February 22, 2016 and will expire on February 22,2019, subject thereafter to automatic one-year extensions unless either the Company or Mr. Websterprovides at least 30 days’ written notice to the other of intent not to renew the term. The EmploymentAgreement provides that Mr. Webster would receive an initial annual base salary of $350,000, subjectto increase at the discretion of the Board, and shall be eligible to receive a target annual bonus equalto 50% of his base salary, with the actual bonus paid to be based on the Company’s actual performancerelative to the performance targets established by senior management of the Company. In addition,Mr. Webster would be entitled to reimbursement for reasonable out-of-pocket business expensesincurred in performing his duties and is eligible to participate in all benefit programs for which otherexecutives of the Company are generally eligible. Mr. Webster’s Employment Agreement also providesfor severance upon certain terminations of employment, as described below under ‘‘—Payments uponCertain Events of Termination or Change in Control.’’ The Employment Agreement includes restrictivecovenants providing for non-competition, non-solicitation of employees and non-interference withbusiness relationships, in each case during employment and for one year thereafter, non-disparagementof the Company, and perpetual nondisclosure of confidential information.
On March 1, 2016, the Company entered into a bonus agreement with Mr. Webster (the ‘‘WebsterBonus Agreement’’) which provides that subject to his continued employment with the Companythrough the first to occur of a Change in Control (as defined in the Option Plan) or an initial publicoffering of the common stock of the Company, Mr. Webster will be entitled to a bonus payment (the‘‘Special Bonus’’) equal to the product of 342,362 multiplied by the amount by which the Fair MarketValue (as defined below) of a share of common stock of the Company exceeds $4.64, but only to theextent the Fair Market Value does not exceed $6.49. For purposes of the foregoing, ‘‘Fair Market
168

Value’’ shall mean, as calculated by the Company in its reasonable good faith discretion, (i) in the caseof a payment upon a Change in Control, the closing cash consideration per share of common stock ofthe Company or (ii) in the case of a payment upon an initial public offering of the common stock ofthe Company, the closing price of a share of common stock of the Company as of the first trading dayon which shares of common stock of the Company may be traded following any underwriter’s lockupentered into in connection with the initial public offering that is binding upon the Company’s seniormanagement (the ‘‘IPO Valuation Date’’). In the case of a Change in Control, the Special Bonus shallbe paid in cash within 30 days following a Change in Control. In the case of an initial public offering,the Special Bonus shall be paid in cash, shares or any combination thereof (as determined by theCompany in its discretion) on the first payroll date following the IPO Valuation Date. The Company’sobligations under the Webster Bonus Agreement shall terminate upon the termination of Mr. Webster’stermination of employment with the Company for any reason (regardless of whether a Change inControl or initial public offering has occurred prior to such termination).
Executive Vice President, Executive Vice President, Secretary and General Counsel (Vincent Grieco)
On September 6, 2017, the Company entered into an employment agreement with Mr. Grieco,which agreement provides that his initial employment term commenced on September 6, 2017 and willexpire on September 6, 2020, subject thereafter to automatic one-year extensions unless either theCompany or Mr. Grieco provides at least 30 days’ written notice to the other of intent not to renew theterm. The Employment Agreement provides that Mr. Grieco would receive an initial annual base salaryof $250,000, subject to increase at the discretion of the Board, and shall be eligible to receive a targetannual bonus equal to 50% of his base salary, with the actual bonus paid to be based on theCompany’s actual performance relative to the performance targets established by senior management ofthe Company. In addition, Mr. Grieco would be entitled to reimbursement for reasonable out-of-pocketbusiness expenses incurred in performing his duties and is eligible to participate in all benefit programsfor which other executives of the Company are generally eligible. Mr. Grieco’s Employment Agreementalso provides for severance upon certain terminations of employment, as described below under‘‘—Payments upon Certain Events of Termination or Change in Control.’’ The Employment Agreementincludes restrictive covenants providing for non-competition, non-solicitation of employees andnon-interference with business relationships, in each case during employment and for one yearthereafter, non-disparagement of the Company, and perpetual nondisclosure of confidentialinformation.
Executive Vice President, Corporate Strategy & Business Operations (James Kohosek)
On September 6, 2017, the Company entered into an employment agreement with Mr. Kohosek,which agreement provides that his initial employment term commenced on September 6, 2017 and willexpire on September 6, 2020, subject thereafter to automatic one-year extensions unless either theCompany or Mr. Kohosek provides at least 30 days’ written notice to the other of intent not to renewthe term. The Employment Agreement provides that Mr. Kohosek would receive an initial annual basesalary of $275,000, subject to increase at the discretion of the Board, and shall be eligible to receive atarget annual bonus equal to 60% of his base salary, with the actual bonus paid to be based on theCompany’s actual performance relative to the performance targets established by senior management ofthe Company. In addition, Mr. Kohosek would be entitled to reimbursement for reasonableout-of-pocket business expenses incurred in performing his duties and is eligible to participate in allbenefit programs for which other executives of the Company are generally eligible. Mr. Kohosek’sEmployment Agreement also provides for severance upon certain terminations of employment, asdescribed below under ‘‘—Payments upon Certain Events of Termination or Change in Control.’’ TheEmployment Agreement includes restrictive covenants providing for non-competition, non-solicitationof employees and non-interference with business relationships, in each case during employment and forone year thereafter, non-disparagement of the Company, and perpetual nondisclosure of confidentialinformation.
169
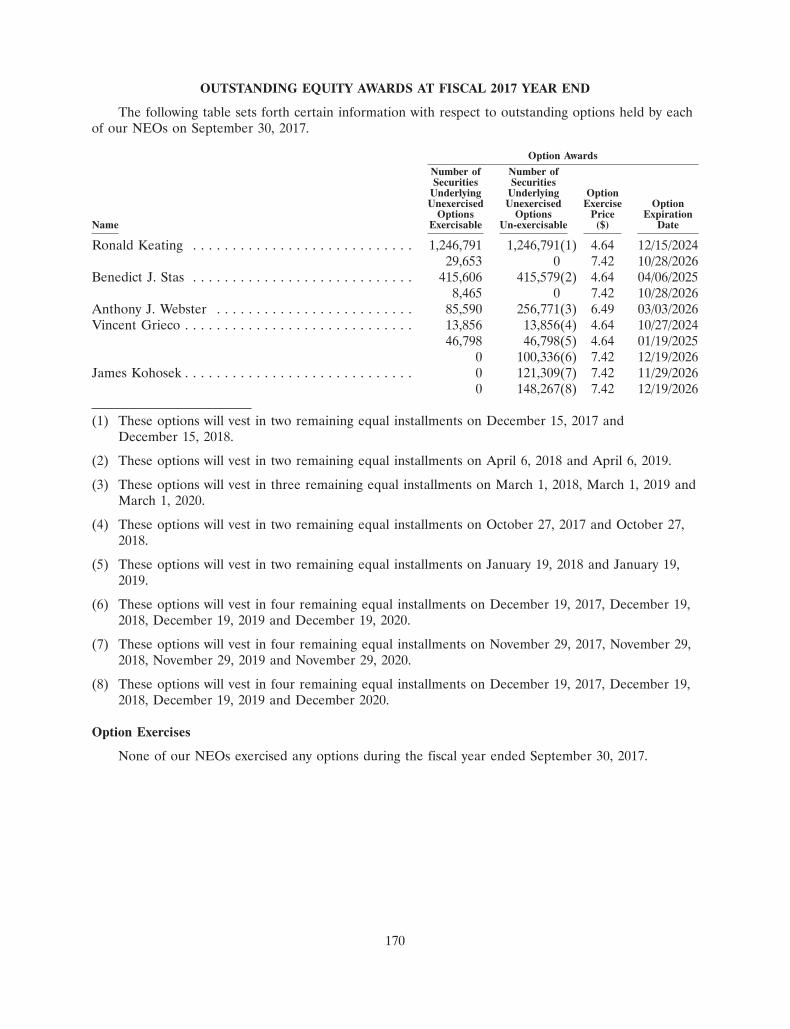
OUTSTANDING EQUITY AWARDS AT FISCAL 2017 YEAR END
The following table sets forth certain information with respect to outstanding options held by eachof our NEOs on September 30, 2017.
Option Awards
Number of Number ofSecurities Securities
Underlying Underlying OptionUnexercised Unexercised Exercise Option
Options Options Price ExpirationName Exercisable Un-exercisable ($) Date
Ronald Keating . . . . . . . . . . . . . . . . . . . . . . . . . . . . 1,246,791 1,246,791(1) 4.64 12/15/202429,653 0 7.42 10/28/2026
Benedict J. Stas . . . . . . . . . . . . . . . . . . . . . . . . . . . . 415,606 415,579(2) 4.64 04/06/20258,465 0 7.42 10/28/2026
Anthony J. Webster . . . . . . . . . . . . . . . . . . . . . . . . . 85,590 256,771(3) 6.49 03/03/2026Vincent Grieco . . . . . . . . . . . . . . . . . . . . . . . . . . . . . 13,856 13,856(4) 4.64 10/27/2024
46,798 46,798(5) 4.64 01/19/20250 100,336(6) 7.42 12/19/2026
James Kohosek . . . . . . . . . . . . . . . . . . . . . . . . . . . . . 0 121,309(7) 7.42 11/29/20260 148,267(8) 7.42 12/19/2026
(1) These options will vest in two remaining equal installments on December 15, 2017 andDecember 15, 2018.
(2) These options will vest in two remaining equal installments on April 6, 2018 and April 6, 2019.
(3) These options will vest in three remaining equal installments on March 1, 2018, March 1, 2019 andMarch 1, 2020.
(4) These options will vest in two remaining equal installments on October 27, 2017 and October 27,2018.
(5) These options will vest in two remaining equal installments on January 19, 2018 and January 19,2019.
(6) These options will vest in four remaining equal installments on December 19, 2017, December 19,2018, December 19, 2019 and December 19, 2020.
(7) These options will vest in four remaining equal installments on November 29, 2017, November 29,2018, November 29, 2019 and November 29, 2020.
(8) These options will vest in four remaining equal installments on December 19, 2017, December 19,2018, December 19, 2019 and December 2020.
Option Exercises
None of our NEOs exercised any options during the fiscal year ended September 30, 2017.
170
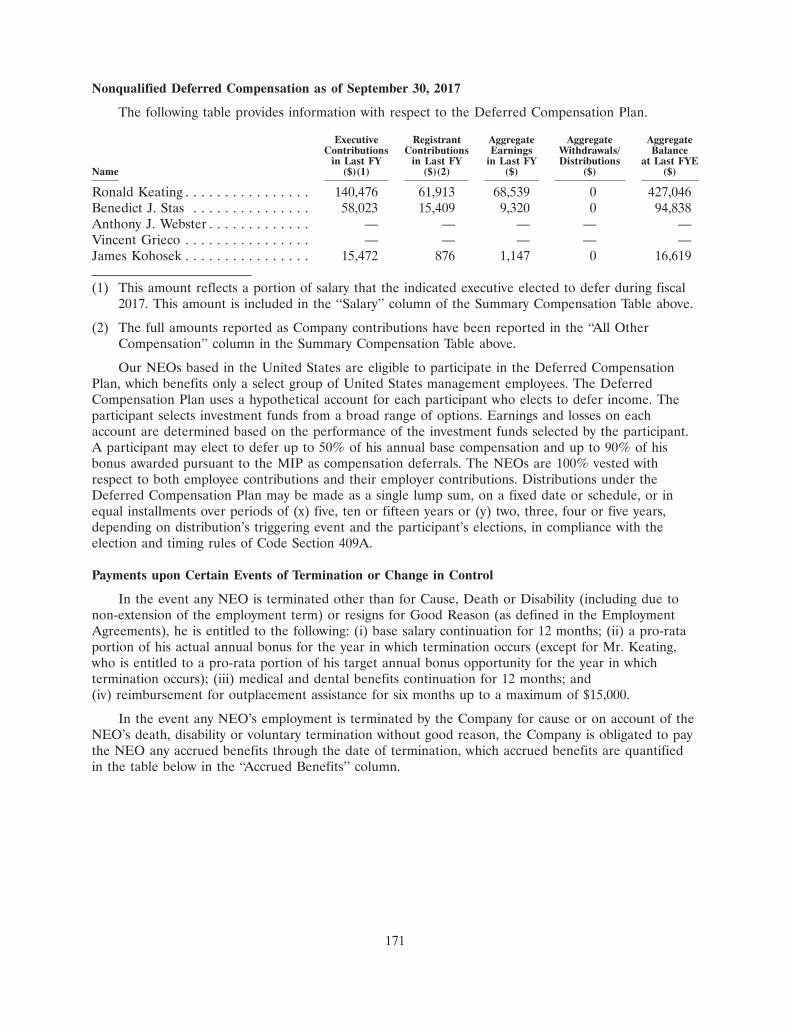
Nonqualified Deferred Compensation as of September 30, 2017
The following table provides information with respect to the Deferred Compensation Plan.
Executive Registrant Aggregate Aggregate AggregateContributions Contributions Earnings Withdrawals/ Balance
in Last FY in Last FY in Last FY Distributions at Last FYEName ($)(1) ($)(2) ($) ($) ($)
Ronald Keating . . . . . . . . . . . . . . . . 140,476 61,913 68,539 0 427,046Benedict J. Stas . . . . . . . . . . . . . . . 58,023 15,409 9,320 0 94,838Anthony J. Webster . . . . . . . . . . . . . — — — — —Vincent Grieco . . . . . . . . . . . . . . . . — — — — —James Kohosek . . . . . . . . . . . . . . . . 15,472 876 1,147 0 16,619
(1) This amount reflects a portion of salary that the indicated executive elected to defer during fiscal2017. This amount is included in the ‘‘Salary’’ column of the Summary Compensation Table above.
(2) The full amounts reported as Company contributions have been reported in the ‘‘All OtherCompensation’’ column in the Summary Compensation Table above.
Our NEOs based in the United States are eligible to participate in the Deferred CompensationPlan, which benefits only a select group of United States management employees. The DeferredCompensation Plan uses a hypothetical account for each participant who elects to defer income. Theparticipant selects investment funds from a broad range of options. Earnings and losses on eachaccount are determined based on the performance of the investment funds selected by the participant.A participant may elect to defer up to 50% of his annual base compensation and up to 90% of hisbonus awarded pursuant to the MIP as compensation deferrals. The NEOs are 100% vested withrespect to both employee contributions and their employer contributions. Distributions under theDeferred Compensation Plan may be made as a single lump sum, on a fixed date or schedule, or inequal installments over periods of (x) five, ten or fifteen years or (y) two, three, four or five years,depending on distribution’s triggering event and the participant’s elections, in compliance with theelection and timing rules of Code Section 409A.
Payments upon Certain Events of Termination or Change in Control
In the event any NEO is terminated other than for Cause, Death or Disability (including due tonon-extension of the employment term) or resigns for Good Reason (as defined in the EmploymentAgreements), he is entitled to the following: (i) base salary continuation for 12 months; (ii) a pro-rataportion of his actual annual bonus for the year in which termination occurs (except for Mr. Keating,who is entitled to a pro-rata portion of his target annual bonus opportunity for the year in whichtermination occurs); (iii) medical and dental benefits continuation for 12 months; and(iv) reimbursement for outplacement assistance for six months up to a maximum of $15,000.
In the event any NEO’s employment is terminated by the Company for cause or on account of theNEO’s death, disability or voluntary termination without good reason, the Company is obligated to paythe NEO any accrued benefits through the date of termination, which accrued benefits are quantifiedin the table below in the ‘‘Accrued Benefits’’ column.
171

The following table describes the estimated value of payments that would have been due to theNEOs in the event that their employment was terminated by the Company due to a termination otherthan for cause, death or disability of the NEO or by the NEO for good reason on September 30, 2017.
Accrued Base Pro Rata MedicalBenefits Salary Bonus Coverage Outplacement(2) Total
Name ($) ($) ($)(1) ($) ($) ($)
Ronald Keating . . . . . . . . . . . . . . . — 787,969 787,969 19,833 15,000 1,610,771Benedict J. Stas . . . . . . . . . . . . . . . — 390,000 273,000 18,994 15,000 696,994Anthony J. Webster . . . . . . . . . . . . — 358,750 179,375 19,834 15,000 572,959Vincent Grieco . . . . . . . . . . . . . . . — 250,000 125,000 21,783 15,000 411,783James Kohosek . . . . . . . . . . . . . . . — 275,000 159,084 13,556 15,000 462,640
(1) For Mr. Keating, this amount represents the pro-rata portion of his target bonus under the MIPfor fiscal 2017 and for each of Messrs. Stas, Webster, Grieco and Kohosek represents the pro-rataportion of his actual bonus payment under the MIP.
(2) This amount represents the maximum reimbursement for outplacement services the NEO isentitled to under his Employment Agreement.
Additionally, our NEOs hold options issued pursuant to the Option Plan, which options becomefully vested and exercisable upon a Change in Control (as defined below). The following table describesthe estimated present value of payments for unvested options to purchase shares that would havebecome vested upon a Change in Control, assuming that such Change in Control occurred onSeptember 30, 2017. In addition, pursuant to the terms of the Webster Bonus Agreement, upon aChange in Control subject to his continued employment through such Change in Control, Mr. Websterwould be entitled to an additional cash payment equal to $635,000.
Unvested StockOptions Total
Name (#)(1) ($)
Ronald Keating . . . . . . . . . . . . . . . . . . . . . . . . 1,246,791 10,406,250Benedict J. Stas . . . . . . . . . . . . . . . . . . . . . . . . 415,579 3,468,600Anthony J. Webster . . . . . . . . . . . . . . . . . . . . . 256,771 1,666,875Vincent Grieco . . . . . . . . . . . . . . . . . . . . . . . . 160,991 1,064,550James Kohosek . . . . . . . . . . . . . . . . . . . . . . . . 269,576 1,500,000
(1) Represents unvested options as of the fiscal year ended September 30, 2017.Calculations with regard to stock options are based upon the most recent appraisalprice of the Company’s common stock ($12.98 as of September 30, 2017), lessexercise price.
172

DIRECTOR COMPENSATION
The Company does not currently pay cash compensation to its directors who are employed byeither the Company or AEA for their services as directors. Each non-employee, non-AEA directorreceived options to purchase shares of the Company’s common stock under the Option Plan, whichgenerally vest as to 25% on the each anniversary of the date of grant such that the options will be fullyvested on the fourth anniversary of the date of grant. Pursuant to a consulting agreement with theCompany dated as of March 1, 2014, in respect of his services provided to the Company as a memberof the Board, Mr. Lamb receives an annual cash retainer equal to $100,000, payable in substantiallyequal monthly installments at the end of each calendar month.
Shown below is information regarding the fiscal 2017 compensation for each member of the Boardother than Mr. Keating, whose compensation is reported above in the Summary Compensation Table.
Fees Earned or Option All OtherPaid in Cash Awards(1) Compensation Total
Name ($) ($) ($) ($)
Nick Bhambri . . . . . . . . . . . . . . . . . . . . . . . . . . . . . — —(1) — —Gary Cappeline . . . . . . . . . . . . . . . . . . . . . . . . . . . . — — — —Judd Gregg . . . . . . . . . . . . . . . . . . . . . . . . . . . . . . . — —(1) — —Brian R. Hoesterey . . . . . . . . . . . . . . . . . . . . . . . . . — — — —Ronald C. Keating . . . . . . . . . . . . . . . . . . . . . . . . . . — — — —Vinay Kumar . . . . . . . . . . . . . . . . . . . . . . . . . . . . . . — — — —Martin Lamb . . . . . . . . . . . . . . . . . . . . . . . . . . . . . . 100,000 —(1) — 100,000
(1) Each of Messrs. Bhambri and Gregg held 179,807 options, which were vested as to 75%.Mr. Lamb was originally granted 359,614 options, of which 89,904 remaining outstanding andsubject to vesting.
Material Terms of the Evoqua Water Technologies Corp. Stock Option Plan
The Evoqua Water Technologies Corp. Stock Option Plan (the ‘‘Option Plan’’) was established toattract, retain, incentivize and motivate officers and employees of, consultants to, and non-employeedirectors providing services to the Company and its subsidiaries and affiliates and to promote thesuccess of the Company by providing such participating individuals with a proprietary interest in theperformance of the Company. On March 6, 2014, the Board adopted the Option Plan under which11,082,581 shares of common stock of the Company (‘‘Shares’’) are reserved for the issuance of optionsto purchase Shares (‘‘Options’’).
Administration. The Option Plan shall be administered by the Compensation Committee, whichshall have all of the powers necessary to enable it to carry out its duties under the Option Planproperly, including the power and duty to construe and interpret the Option Plan and to determine allquestions arising under it. The Compensation Committee may correct any defect, supply any omission,or reconcile any inconsistency in the Option Plan or in any Option in the manner and to the extent itdeems necessary to carry out the intent of the Option Plan. The Compensation Committee’sinterpretations and determinations shall be final, binding and conclusive upon all persons.
Plan Term. The Option Plan became effective on March 6, 2014 and will terminate on the tenth(10th) anniversary thereof, unless earlier terminated by the Board.
Eligibility. Under the Option Plan, ‘‘Eligible Individuals’’ includes officers, employees, consultants,advisors and non-employee directors providing services to the Company and its subsidiaries andaffiliates. The Compensation Committee will determine which Eligible Individuals will receive grants ofoptions.
173

Option Price. The manner in which the exercise price is to be determined for Shares under eachOption shall be determined by the Compensation Committee and set forth in the option agreement;provided, however, that the exercise price per Share under each Option shall not be less than thegreater of (i) the par value of a Share and (ii) 100% of the fair market value of a Share on the datethe Option is granted.
Maximum Duration. Options granted under the Option Plan shall be for such term as theCompensation Committee shall determine; provided that an Option shall not be exercisable after theexpiration of 10 years from the date it is granted; provided, further, however, that unless theCompensation Committee provides otherwise, an Option may, upon the death of the participant priorto the expiration of the Option, be exercised for up to one year following the date of the participant’sdeath, even if such period extends beyond 10 years from the date the Option is granted. TheCompensation Committee may, subsequent to the granting of any Option, extend the period withinwhich the Option may be exercised (including following a participant’s termination), but in no eventshall the period be extended to a date that is later than the earlier of the latest date on which theOption could have been exercised and the 10th anniversary of the date of grant of the Option.
Vesting. The Compensation Committee shall determine and set forth in the applicable optionagreement the time or times at which an Option shall become vested and exercisable. To the extent notexercised, vested installments shall accumulate and be exercisable, in whole or in part, at any time afterbecoming exercisable, but not later than the date the Option expires. The Compensation Committeemay accelerate the exercisability of any Option or portion thereof at any time.
Method of Exercise. The exercise of an Option shall be made only by giving notice in the formand to the person designated by the Company, specifying the number of Shares to be exercised and, tothe extent applicable, accompanied by payment therefor and otherwise in accordance with the optionagreement pursuant to which the Option was granted. The Option Price shall be paid in any or anycombination of the following forms: (a) cash or its equivalent or (b) other property as determined bythe Compensation Committee. Any Shares transferred to or withheld by the Company as payment ofthe exercise price under an Option (to the extent permitted by the Compensation Committee) shall bevalued at their fair market value on the last business day preceding the date of exercise of such Option.
Adjustments. In the event of a Change in Capitalization (as defined in the Option Plan), theCompensation Committee shall conclusively determine the appropriate adjustments, if any, to (a) themaximum number and class of Shares with respect to which Options may be granted under the OptionPlan, (b) the number and class of Shares or other stock or securities (of the Company or any othercorporation or entity), cash or other property which are subject to outstanding Options granted underthe Option Plan and the exercise price therefor, if applicable, and (c) any other adjustments theCompensation Committee determines to be equitable. If, by reason of a Change in Capitalization,pursuant to an option agreement, a participant shall be entitled to, or shall be entitled to exercise anOption with respect to, new, additional or different shares of stock or securities of the Company or anyother entity, such new, additional or different shares shall thereupon be subject to all of the conditionsand restrictions which were applicable to the Shares subject to the Option prior to such Change inCapitalization.
Effect of Change in Control or Certain Other Transactions. Unless otherwise provided in an awardagreement, in connection with a merger, consolidation, reorganization, recapitalization or other similarchange in the capital stock of the Company, or a liquidation or dissolution of the Company or aChange in Control (each, a ‘‘Corporate Transaction’’), all outstanding Options shall terminate upon theconsummation of the Corporate Transaction, unless provision is made in connection with suchtransaction, in the sole discretion of the Compensation Committee or the parties to the CorporateTransaction, for the assumption or continuation of such Options by, or the substitution for suchOptions with new awards of, the surviving, successor or resulting entity, or a parent or subsidiary
174
thereof, with such adjustments as to the number and kind of shares or other securities or propertysubject to such new awards, option and stock appreciation right exercise or base prices, and other termsof such new awards as the Compensation Committee or the parties to the Corporate Transaction shallagree. In the event that provision is made in writing as aforesaid in connection with a CorporateTransaction, the Option Plan and the unexercised Options theretofore granted or the new awardssubstituted therefor shall continue in the manner and under the terms provided in such writing.Notwithstanding the foregoing, except as otherwise provided in the applicable option agreement, vestedOptions (including those Options that would become vested upon the consummation of the CorporateTransaction) shall not be terminated upon the consummation of the Corporate Transaction unlessholders of affected Options are provided either (a) a period of at least fifteen (15) calendar days priorto the date of the consummation of the Corporate Transaction to exercise the Options or (b) paymentin respect of each Share covered by the Option being cancelled in an amount equal to the excess, ifany, of the per Share price to be paid or distributed to stockholders in the Corporate Transaction overthe option price of the Option.
Without limiting the generality of the foregoing or being construed as requiring any such action, inconnection with a Corporate Transaction the Compensation Committee may, in its sole and absolutediscretion, without the consent of any participant, cause any of the following actions to be takeneffective upon or at any time prior to such Corporate Transaction: (a) cause any or all unvestedOptions to become fully vested and immediately exercisable (as applicable) and/or provide the holdersof such Options a reasonable period of time prior to the date of the consummation of the CorporateTransaction to exercise the Options or (b) with respect to unvested Options that are terminated inconnection with the Corporation Transaction, provide the holders thereof a payment in respect of eachShare covered by the Option being terminated in an amount equal to all or a portion of the excess, ifany, of the per Share price to be paid or distributed to stockholders in the Corporate Transaction overthe option price of the Option.
For purposes of the Option Plan, ‘‘Change in Control’’ generally means (i) the approval bystockholders of the liquidation or dissolution of the Company, (ii) a transaction or series of relatedtransactions resulting in the sale or other disposition of 51% or more of the outstanding voting stock ofthe Company, (iii) the merger or consolidation of the Company with or into any entity, or (iv) a sale orother disposition of substantially all of the assets of the Company; provided, however, that the term‘‘Change in Control’’ shall exclude each transaction which is a ‘‘Non-Control Transaction.’’ Unlessotherwise provided in an option agreement, ‘‘Non-Control Transaction’’ means (i) any transactionfollowing which AEA and/or its affiliates, participants, investors and/or employees own directly orindirectly a majority of the outstanding shares of voting stock of the Company or any purchasing orsurviving entity, as applicable, (ii) a merger or consolidation following which those persons who owneddirectly or indirectly a majority of the outstanding shares of voting stock of the Company immediatelyprior to such merger or consolidation will own directly or indirectly a majority of the outstandingshares of voting stock of the surviving or resulting entity, as applicable, (iii) a sale or other dispositionof capital stock of the Company following which those persons who owned directly or indirectly amajority of the outstanding shares of voting stock immediately prior to such sale will own directly orindirectly a majority of the outstanding interests or shares of voting stock of the Company or thepurchasing entity, as applicable, (iv) a sale or other disposition of substantially all of the assets of theCompany to an affiliate of the Company, (v) an initial public offering of the Company, or (vi) anytransaction following which AEA, any person controlling or controlled by AEA, or any officers,directors, employees, participants or shareholders of AEA constitute a majority of the directors of theBoard or have a right to elect a majority of the Board.
Transferability. Notwithstanding anything contained in the Option Plan or any option agreement tothe contrary, in the event that the disposition of Shares acquired pursuant to the Option Plan is notcovered by a then current registration statement under the Securities Act and is not otherwise exemptfrom such registration, such Shares shall be restricted against transfer to the extent required by the
175

Securities Act and Rule 144 or other regulations promulgated thereunder. The CompensationCommittee may require any individual receiving Shares pursuant to an Option granted under theOption Plan, as a condition precedent to receipt of such Shares, to represent and warrant to theCompany in writing that the Shares acquired by such individual are acquired without a view to anydistribution thereof and will not be sold or transferred other than pursuant to an effective registrationthereof under the Securities Act or pursuant to an exemption applicable under the Securities Act orthe rules and regulations promulgated thereunder.
Amendment or Termination of the Option Plan. The Board may earlier terminate the Option Planand the Board may at any time and from time to time amend, modify or suspend the Option Plan;provided, however, that (a) no such amendment, modification, suspension or termination shall impairor adversely alter any Options theretofore granted under the Option Plan, except with the consent ofthe participant, nor shall any such amendment, modification, suspension or termination deprive anyparticipant of any Shares which he or she may have acquired through or as a result of the Option Planand (b) to the extent necessary under any applicable law, regulation or exchange requirement, no otheramendment shall be effective unless approved by the stockholders of the Company in accordance withapplicable law, regulation or exchange requirement.
Material Terms of the Evoqua Water Technologies Corp. 2017 Equity Incentive Plan
Prior to the consummation of this offering, the Board is expected to adopt and recommend thatour stockholders approve the Evoqua Water Technologies Corp. 2017 Equity Incentive Plan (or the‘‘Equity Incentive Plan’’), under which equity awards may be made in respect of 5,100,000 shares ofcommon stock of the Company (‘‘Shares’’), as described further below in the section titled ‘‘—SharesAvailable.’’ Under the Equity Incentive Plan, awards may be granted in the form of options, restrictedstock, restricted stock units, stock appreciation rights, dividend equivalent rights, share awards andperformance-based awards (including performance share units and performance-based restricted stock).The following is a summary of the material terms of the Equity Incentive Plan. This summary isqualified in its entirety by reference to the full text of the Equity Incentive Plan which will be filed asan exhibit to this registration statement.
Administration. The Equity Incentive Plan will be administered by a committee appointed by theboard (the ‘‘Compensation Committee’’). The Compensation Committee shall consist of at least twodirectors of the board and may consist of the entire board. The Compensation Committee willgenerally consist of directors considered to be non-employee directors for purposes of Section 16 of theExchange Act, and to the extent that an award is intended to qualify as ‘‘performance-basedcompensation’’ within the meaning of Section 162(m) of the Internal Revenue Code of 1986, asamended (the ‘‘Code’’), the Compensation Committee will consist of directors, each of whom shall bean ‘‘outside director’’ as defined within the meaning of Section 162(m) of the Code.
Plan Term. The Equity Incentive Plan will become effective as of the date it is approved by theCompany’s stockholders, and will terminate on the tenth (10th) anniversary thereof, unless earlierterminated by the board.
Eligibility. Under the Equity Incentive Plan, ‘‘Eligible Individuals’’ include officers, employees,consultants and non-employee directors providing services to the Company and its subsidiaries. TheCompensation Committee will determine which Eligible Individuals will receive grants of awards.
Incentives Available. Under the Equity Incentive Plan, the Compensation Committee may grantany of the following types of awards to an Eligible Individual: incentive stock options (‘‘ISOs’’);nonqualified stock options (‘‘Nonqualified Stock Options’’ and, together with ISOs, ‘‘Options’’); stockappreciation rights (‘‘SARs’’); restricted stock grants (‘‘Restricted Stock Grants’’); restricted stock units(‘‘RSUs’’); Performance Awards; Dividend Equivalent Rights; and Share Awards, each as defined below(each type of grant is considered an ‘‘Award’’).
176

Shares Available. Subject to any adjustment as provided in the Equity Incentive Plan, up to5,100,000 Shares may be issued pursuant to Awards granted under the Equity Incentive Plan, all ofwhich may be granted as ISOs. In the case of an Eligible Individual who is an employee or consultant,the aggregate number of Shares that may be the subject of Options or SARs granted in any calendaryear may not exceed 1,100,000 Shares, the aggregate number of Shares that may be the subject ofPerformance-Based Restricted Stock and Performance Share Units granted in any calendar year maynot exceed 1,100,000 Shares, and the maximum dollar amount of cash or the fair market value ofShares that any individual may receive in any calendar year in respect of Performance Units may notexceed $5,000,000. In the case of an Eligible Individual who is a director, the aggregate number ofShares that may be the subject of Options or SARs granted in any calendar year may not exceed thatnumber of Shares representing a fair market value equal to the positive difference, if any, between$700,000 and the aggregate value of any annual cash retainer paid to the director (excluding the valueof any chairperson retainer or fee and meeting fees received by a director in respect of such calendaryear).
If an Award or any portion thereof that is granted under the Equity Incentive Plan (i) expires orotherwise terminates without all of the Shares covered by such Award having been issued or (ii) issettled in cash (i.e., the participant receives cash rather than Shares), such expiration, termination orsettlement will not reduce (or otherwise offset) the number of Shares that may be available forissuance under the Equity Incentive Plan. If any Shares issued pursuant to an Award are forfeited andreturned back to or reacquired by the Company because of the failure to meet a contingency orcondition required to vest such Shares in the participant, then the Shares that are forfeited orreacquired will again become available for issuance under the Equity Incentive Plan. Any Sharestendered or withheld (i) to pay the exercise price of an Option or (ii) to satisfy tax withholdingobligations associated with an Award granted under the Equity Incentive Plan shall not becomeavailable again for issuance under the Equity Incentive Plan.
Stock Options. The Compensation Committee may grant Options (which may be ISOs orNonqualified Stock Options) to Eligible Individuals. An ISO is an Option intended to qualify for taxtreatment applicable to ISOs under Section 422 of the Code. An ISO may be granted only to EligibleIndividuals that are employees of the Company or any of its subsidiaries. A Nonqualified Stock Optionis an Option that is not subject to statutory requirements and limitations required for certain taxadvantages allowed under Section 422 of the Code.
Vesting and Exercise Periods for Options. Each Option granted under the Equity Incentive Planmay be subject to certain vesting requirements and will become exercisable in accordance with thespecific terms and conditions of the Option, as determined by the Compensation Committee at thetime of grant and set forth in an Award agreement. The term of an Option generally may not exceedten years from the date it is granted (five years in the case of an ISO granted to a ten-percentstockholder). Each Option, to the extent it becomes exercisable, may be exercised at any time in wholeor in part until its expiration or termination, unless otherwise provided in applicable Award agreement.
Exercise Price for Options. The purchase price per Share with respect to any Option grantedunder the Equity Incentive Plan may be not less than 100% of the fair market value of a share ofcommon stock on the date the Option is granted (110% in the case of an ISO granted to a ten-percentstockholder). Limits on Incentive Stock Options. In order to comply with the requirements for ISOs inthe Code, no person may receive a grant of an ISO for stock that would have an aggregate fair marketvalue in excess of $100,000, determined when the ISO is granted, that would be exercisable for the firsttime during any calendar year. If any grant of an ISO is made in excess of such limit, the portion thatis over the $100,000 limit would be a Nonqualified Stock Option.
Stock Appreciation Rights. The Compensation Committee may grant SARs to Eligible Individualson terms and conditions determined by the Compensation Committee at the time of grant and set forth
177
in an Award agreement. A SAR may be granted (a) at any time if unrelated to an Option or (b) ifrelated to an Option, either at the time of grant or at any time thereafter during the term of theOption.
Amount Payable. A SAR is a right granted to a participant to receive an amount equal to theexcess of the fair market value of a Share on the last business day preceding the date of exercise ofsuch SAR over the fair market value of a Share on the date the SAR was granted. A SAR may besettled or paid in cash, Shares or a combination of each, in accordance with its terms.
Duration. Each SAR will be exercisable or be forfeited or expire on such terms as theCompensation Committee determines. Except in limited circumstances, an SAR shall have a term of nogreater than ten years.
Prohibition on Repricings. The Compensation Committee will have no authority to make anyadjustment or amendment (other than in connection with certain changes in capitalization or certaincorporate transactions in accordance with the terms of the Equity Incentive Plan, as generally describedbelow) that reduces, or would have the effect of reducing, the exercise price of an Option or SARpreviously granted under the Equity Incentive Plan, unless the Company’s stockholders approve suchadjustment or amendment.
Dividend Equivalent Rights. The Compensation Committee may grant dividend equivalent rights(‘‘Dividend Equivalent Rights’’), either in tandem with an Award or as a separate Award, to EligibleIndividuals on terms and conditions determined by the Compensation Committee at the time of grantand set forth in an Award agreement. A Dividend Equivalent Right is a right to receive cash or Sharesbased on the value of dividends that are paid with respect to the Shares. Amounts payable in respect ofDividend Equivalent Rights may be payable currently or, if applicable, deferred until the lapsing ofrestrictions on such dividend equivalent rights or until the vesting, exercise, payment, settlement orother lapse of restrictions on the Award to which the Dividend Equivalent Rights relate, subject tocompliance with Section 409A of the Code. Dividend Equivalent Rights may be settled in cash orshares of common stock or a combination thereof, in a single installment or multiple installments, asdetermined by the Compensation Committee.
Restricted Stock; Restricted Stock Units. The Compensation Committee may grant either Shares(Restricted Stock) or phantom Shares (RSUs), in each case subject to certain vesting requirements, onterms and conditions determined by the Compensation Committee at the time of grant and set forth inan Award agreement.
Restricted Stock. Unless the Compensation Committee determines otherwise, upon the issuance ofshares of Restricted Stock, the participant shall have all of the rights of a shareholder with respect tosuch Shares, including the right to vote the Shares and to receive all dividends or other distributionsmade with respect to the Shares. The Compensation Committee may determine that the payment tothe participant of dividends, or a specified portion thereof, declared or paid on such Shares shall bedeferred until the lapsing of the restrictions imposed upon such Shares and held by the Company forthe account of the participant until such time. Payment of deferred dividends in respect of shares ofRestricted Stock shall be made upon the lapsing of restrictions imposed on the shares of RestrictedStock in respect of which the deferred dividends were paid, and any dividends deferred in respect ofany shares of Restricted Stock shall be forfeited upon the forfeiture of such shares of Restricted Stock.
Period for Lapsing of Restrictions on Restricted Stock. During such period as may be set by theCompensation Committee in the Award agreement (the ‘‘Vesting Period’’), the Participant shall not bepermitted to sell, transfer, pledge, hypothecate or assign shares of Restricted Stock awarded under theEquity Incentive Plan except by will or the laws of descent and distribution. The CompensationCommittee may also impose such other restrictions and conditions, including the attainment of
178

pre-established Performance Objectives (as defined below) or other corporate or individualperformance goals, on Restricted Stock as it determines in its sole discretion.
Restricted Stock Units. Each RSU shall represent the right of the participant to receive a paymentupon vesting of the RSU, or on any later date specified by the Compensation Committee, of anamount equal to the fair market value of a Share as of the date the RSU becomes vested (togetherwith such dividends as may have accrued with respect to such Share from the time of the grant of theAward until the time of vesting), or such later date as determined by the Compensation Committee atthe time the RSU is granted (and which will be set forth in the applicable grant agreement). An RSUmay be settled or paid in cash, Shares or a combination of each, as determined by the CompensationCommittee.
Performance Awards. Performance awards ((‘‘Performance Awards’’) (including performance units(‘‘Performance Units’’) and performance share units (‘‘Performance Share Units’’)) and performance-based restricted stock (‘‘Performance-Based Restricted Stock’’) may be granted to Eligible Individualson terms and conditions determined by the Compensation Committee and set forth in an Awardagreement.
Performance Units. Performance Units shall be denominated in a specified dollar amount and,contingent upon the attainment of specified performance objectives within a performance cycle andsuch other vesting conditions as may be determined by the Compensation Committee (includingwithout limitation, a continued employment requirement following the end of the applicableperformance period), represent the right to receive payment of the specified dollar amount or apercentage of the specified dollar amount depending on the level of performance objective attained;provided, however, that the Compensation Committee may at the time a Performance Unit is grantedspecify a maximum amount payable in respect of a vested Performance Unit. The award agreement foreach Performance Unit shall specify the number of Performance Units to which it relates, thePerformance Objectives and other conditions which must be satisfied in order for the Performance Unitto vest and the performance cycle within which such Performance Objectives must be satisfied and thecircumstances under which the award will be forfeited.
Performance Share Units. Performance Share Units shall be denominated in Shares and,contingent upon the attainment of specified Performance Objectives within a performance cycle andsuch other vesting conditions as may be determined by the Compensation Committee (including,without limitation, a continued employment requirement following the end of the applicableperformance period), represent the right to receive an amount of the fair market value of a Share onthe date the Performance Share Unit becomes vested or any other date specified by the CompensationCommittee or a percentage of such amount depending on the level of Performance Objective attained;provided, however, that the Compensation Committee may at the time a Performance Share Unit isgranted specify a maximum amount payable in respect of a vested Performance Share Unit. APerformance Share Unit may be settled in cash, shares, or a combination of each. The Awardagreement for each Performance Share Unit shall specify the number of Performance Share Units towhich it relates, the Performance Objectives and other conditions which must be satisfied in order forthe Performance Share Unit to vest and the performance cycle within which such PerformanceObjectives must be satisfied and the circumstances under which the Award will be forfeited.
Performance-Based Restricted Stock. Performance-Based Restricted Stock shall consist of an Awardof shares of Restricted Stock, issued in the participant’s name and subject to appropriate restrictionsand transfer limitations. Unless the Compensation Committee determines otherwise and as set forth inthe applicable Award agreement, upon issuance of Shares of Performance-Based Restricted Stock, theparticipant shall have all of the rights of a stockholder with respect to such Shares, including the rightto vote the Shares and to receive all dividends or other distributions paid or made with respect toShares. The Award agreement for each Award of Performance-Based Restricted Stock will specify the
179
number of shares of Performance-Based Restricted Stock to which it relates, the PerformanceObjectives and other conditions that must be satisfied in order for the Performance-Based RestrictedStock to vest, the performance cycle within which the Performance Objectives must be satisfied (whichwill not be less than one (1) year) and the circumstances under which the Award will be forfeited. Atthe time the Award of Performance-Based Restricted Stock is granted, the Compensation Committeemay determine that the payment to the participant of dividends, or a specified portion thereof,declared or paid on Shares represented by such Award which have been issued by the Company to theparticipant shall be deferred until the lapsing of the restrictions imposed upon such Performance-BasedRestricted Stock and held by the Company for the account of the participant until such time. Paymentof deferred dividends in respect of Shares of Performance-Based Restricted Stock shall be made uponthe lapsing of restrictions imposed on the Performance-Based Restricted Stock in respect of which thedeferred dividends were paid, and any dividends deferred in respect of any Performance-BasedRestricted Stock shall be forfeited upon the forfeiture of such Performance-Based Restricted Stock.
Performance Objectives. With respect to any Performance Awards intended to constitute‘‘performance-based compensation’’ under Section 162(m) of the Code, performance objectives(‘‘Performance Objectives’’) may be expressed in terms of (i) net earnings; (ii) earnings per share;(iii) net debt; (iv) revenue or sales growth; (v) net or operating income; (vi) net operating profit;(vii) return measures (including, but not limited to, return on assets, capital, equity or sales); (viii) cashflow (including, but not limited to, operating cash flow, distributable cash flow and free cash flow);(ix) earnings before or after taxes, interest, depreciation, amortization and/or rent; (x) share price(including, but not limited to growth measures and total stockholder return); (xi) expense control orloss management; (xii) customer satisfaction; (xiii) market share; (xiv) economic value added;(xv) working capital; (xvi) the formation of joint ventures or the completion of other corporatetransactions; (xvii) gross or net profit margins; (xviii) revenue mix; (xix) operating efficiency;(xx) product diversification; (xxi) market penetration; (xxii) measurable achievement in quality,operation or compliance initiatives; (xxiii) quarterly dividends or distributions; (xxiv) employee retentionor turnover; (xxv) sales or (xxvi) any combination of or a specified increase in any of the foregoing.Performance Objectives may be in respect of the performance of the Company, any of its Subsidiariesor Divisions (as defined in the Equity Incentive Plan) or any combination thereof. PerformanceObjectives may be absolute or relative (to prior performance of the Company or to the performance ofone or more other entities or external indices) and may be expressed in terms of a progression within aspecified range. The Compensation Committee may, at the time the Performance Objectives in respectof a Performance Award are established, provide for the manner in which performance will bemeasured against the Performance Objectives to reflect the impact of specified events, including anyone or more of the following with respect to the applicable performance period: (i) the gain, loss,income or expense resulting from changes in accounting principles or tax laws that become effectiveduring the performance period; (ii) the gain, loss, income or expense reported publicly by the Companywith respect to the performance period that are extraordinary or unusual in nature or infrequent inoccurrence; (iii) the gains or losses resulting from, and the direct expenses incurred in connection with,the disposition of a business or the sale of investments or non-core assets; (iv) the gain or loss from allor certain claims and/or litigation and all or certain insurance recoveries relating to claims or litigation;or (v) the impact of investments or acquisitions made during the year or, to the extent provided by theCompensation Committee, any prior year. The events may relate to the Company as a whole or to anypart of the Company’s business or operations, as determined by the Compensation Committee at thetime the Performance Objectives are established. Any adjustments based on the effect of certain eventsare to be determined in accordance with generally accepted accounting principles and standards, unlessanother objective method of measurement is designated by the Compensation Committee.
Prior to the vesting, payment, settlement or lapsing of any restrictions with respect to anyPerformance Award intended to qualify as ‘‘performance-based compensation’’ under Section 162(m) ofthe Code, the Compensation Committee shall certify in writing that the applicable Performance
180
Objectives have been satisfied. In respect of a Performance Award, the Compensation Committee may,in its sole discretion, (i) reduce the amount of cash paid or number of Shares to be issued or that havebeen issued and that become vested or on which restrictions lapse, and/or (ii) establish rules andprocedures that have the effect of limiting the amount payable to any Participant to an amount that isless than the amount that otherwise would be payable under such Award. The CompensationCommittee may exercise such discretion in a non-uniform manner among Participants.
Share Awards. The Compensation Committee may grant an Award of Shares (‘‘Share Awards’’) toan Eligible Individual on such terms and conditions as the Compensation Committee may determine atthe time of grant. A Share Award may be made as additional compensation for services rendered bythe Eligible Individual or may be in lieu of cash or other compensation to which the Eligible Individualis entitled from the Company.
Adjustments upon Changes in Capitalization. In the event that the outstanding Shares are changedinto or exchanged for a different number or kind of Shares or other stock or securities or other equityinterests of the Company or another corporation or entity, whether through merger, consolidation,reorganizations, recapitalization, reclassification, stock dividend, stock split, reverse stock split,substitution or other similar corporate event or transaction, or an extraordinary dividend or distributionby the Company in respect of its Shares or other capital stock or securities convertible into capitalstock in cash, securities or other property, the Compensation Committee shall determine theappropriate adjustments, if any, to (a) the maximum number and kind of shares of stock or othersecurities or other equity interests as to which Awards may be granted under the Equity Incentive Plan,(b) the maximum number and class of Shares or other stock or securities that may be issued uponexercise of ISOs, (c) the number and kind of Shares or other securities covered by any or alloutstanding Awards that have been granted under the Equity Incentive Plan, (d) the option price ofoutstanding Options and the base price of outstanding SARs, and (e) the Performance Objectivesapplicable to outstanding Performance Awards.
Effect of Change in Control or Certain Other Transactions. Generally, the Award agreementevidencing each Award will provide any specific terms applicable to that Award in the event of aChange in Control of the Company (as defined below). Unless otherwise provided in an Awardagreement, in connection with a merger, consolidation, reorganization, recapitalization or other similarchange in the capital stock of the Company, or a liquidation or dissolution of the Company or aChange in Control (each a ‘‘Corporate Transaction’’), Awards shall either: (a) continue following suchCorporate Transaction, which may include, in the discretion of the Compensation Committee or theparties to the Corporate Transaction, the assumption, continuation or substitution of the Awards, ineach case with appropriate adjustments to the number, kind of shares, and exercise prices of theAwards; or (b) terminate.
For purposes of the Equity Incentive Plan, ‘‘Change in Control’’ generally means the occurrence ofany of the following events with respect to the Company: (a) any person (other than directly from theCompany) first acquires securities of the Company representing fifty percent or more of the combinedvoting power of the Company’s then outstanding voting securities, other than an acquisition by certainemployee benefit plans, the Company or a related entity, or any person in connection with anon-control transaction; (b) a majority of the members of the board of directors is replaced bydirectors whose appointment or election is not endorsed by a majority of the members of the board ofdirectors serving immediately prior to such appointment or election; (c) any merger, consolidation orreorganization, other than in a non-control transaction; (d) a complete liquidation or dissolution or(e) sale or disposition of all or substantially all of the assets. A ‘‘non-control transaction’’ generallyincludes any transaction in which (i) stockholders immediately before such transaction continue to ownat least a majority of the combined voting power of such resulting entity following the transaction; (ii) amajority of the members of the board of directors immediately before such transaction continue toconstitute at least a majority of the board of the surviving entity following such transaction or (iii) with
181
certain exceptions, no person other than any person who had beneficial ownership of more than fiftypercent of the combined voting power of the Company’s then outstanding voting securities immediatelyprior to such transaction has beneficial ownership of more than fifty percent of the combined votingpower of the surviving entity’s outstanding voting securities immediately after such transaction.
Options and SARs Terminated in Corporate Transaction. If Options or SARs are to terminate inthe event of a corporate transaction, the holders of vested Options or SARs must be provided either(a) fifteen days to exercise their Options or SARs or (b) payment (in cash or other consideration) inrespect of each Share covered by the Option of SAR being cancelled in an amount equal to the excess,if any, of the per Share consideration to be paid to stockholders in the Corporate Transaction over theprice of the Option or the SAR. If the per Share consideration to be paid to stockholders in theCorporate Transaction is less than the exercise price of the Option or SAR, the Option or SAR may beterminated without payment of any kind. The holders of unvested Options or SARs may also receivepayment, at the discretion of the Compensation Committee, in the same manner as described above forvested Options and SARs. The Compensation Committee may also accelerate the vesting on anyunvested Option or SAR and provide holders of such Options or SARS a reasonable opportunity toexercise the Award.
Other Awards Terminated in Corporate Transaction. If Awards other than Options and SARs are toterminate in connection with a corporate transaction, the holders of vested Awards will be provided,and holders of unvested Awards may be provided, at the discretion of the Compensation Committee,payment (in cash or other consideration upon or immediately following the Corporate Transaction, or,to the extent permitted by Section 409A of the Code, on a deferred basis) in respect of each Sharecovered by the Award being cancelled in an amount equal to the per Share price to be paid tostockholders in the Corporate Transaction, where the value of any non-cash consideration will bedetermined by the Compensation Committee in good faith.
The Compensation Committee may, in its sole discretion, provide for different treatment fordifferent Awards or Awards held by different parties, and where alternative treatment is available for aparticipant’s Awards, may allow the participant to choose which treatment will apply to his or herAwards.
Transferability. The Equity Incentive Plan generally restricts the transfer of any Awards, except(a) transfers by will or the laws of descent and distribution or (b) to a beneficiary designated by theparticipant, to whom any benefit under the Equity Incentive Plan is to be paid or who may exercise anyrights of the participant in the event of the participant’s death before he or she receives any or all ofsuch benefit or exercises an Award.
Amendment or Termination of the Equity Incentive Plan. The Equity Incentive Plan may beamended or terminated by the board of directors without shareholder approval unless shareholderapproval of the amendment or termination is required under applicable law, regulation or New YorkStock Exchange requirement. No amendment may materially and adversely alter or impair any Awardsthat had been granted under the Equity Incentive Plan prior to the amendment without the impactedparticipant’s consent. The Equity Incentive Plan will terminate on the tenth anniversary of its effectivedate; however, when the Equity Incentive Plan terminates, any applicable terms will remain in effectfor administration of any Awards outstanding at the time of the Equity Incentive Plan’s termination.
Forfeiture Events; Clawback. The Compensation Committee may specify in an Award agreementthat the participant’s rights, payments and benefits with respect to an Award shall be subject toreduction, cancellation, forfeiture, clawback or recoupment upon the occurrence of certain specifiedevents or as required by law, in addition to any otherwise applicable forfeiture provisions that apply tothe Award. Without limiting the generality of the foregoing, any Award under the Equity IncentivePlan shall be subject to the terms of any clawback policy maintained by the Company, as it may beamended from time to time.
182

Material Terms of the Evoqua Water Technologies Corp. 2017 Annual Incentive Plan
In connection with this offering, the Board is expected to adopt the Evoqua Water TechnologiesCorp. 2017 Annual Incentive Plan, or the ‘‘Bonus Plan’’, which sets forth performance criteria andperformance goals which may be used by the Compensation Committee for the grant of annual bonusawards to our executive officers and key employees. The following is a summary of the material termsof the Bonus Plan. This summary is qualified in its entirety by reference to the full text of the BonusPlan which will be filed as an exhibit to this registration statement.
The Bonus Plan will be administered by the Compensation Committee. Subject to the limitationsset forth in the Bonus Plan, the Compensation Committee shall have the authority to determine, foreach plan year, the time or times at which awards may be granted, the recipients of awards, theperformance criteria, the performance goals and all other terms of an award, to interpret the BonusPlan, to make all determinations under the Bonus Plan and necessary or advisable for theadministration of the Bonus Plan, and to prescribe, amend and rescind rules and regulations relating tothe Bonus Plan. The Compensation Committee may delegate responsibility for performing certainministerial functions under the Bonus Plan to any officer or employee of the Company.
The performance criteria for us or any identified subsidiary or business unit, as selected by theCompensation Committee in its sole discretion at the time of the award, will be one or anycombination of the following: (i) net earnings; (ii) earnings per share; (iii) net debt; (iv) revenue orsales growth; (v) net or operating income; (vi) net operating profit; (vii) return measures (including, butnot limited to, return on assets, capital, equity or sales); (viii) cash flow (including, but not limited to,operating cash flow, distributable cash flow and free cash flow); (ix) earnings before or after taxes,interest, depreciation, amortization and/or rent; (x) share price (including, but not limited to growthmeasures and total stockholder return); (xi) expense control or loss management; (xii) customersatisfaction; (xiii) market share; (xiv) economic value added; (xv) working capital; (xvi) the formation ofjoint ventures or the completion of other corporate transactions; (xvii) gross or net profit margins;(xviii) revenue mix; (xix) operating efficiency; (xx) product diversification; (xxi) market penetration;(xxii) measurable achievement in quality, operation or compliance initiatives; (xxiii) quarterly dividendsor distributions; (xxiv) employee retention or turnover; (xxv) sales or (xxvi) any combination of or aspecified increase in any of the foregoing, or such other performance criteria determined to beappropriate by the Compensation Committee in its sole discretion.
The performance goals shall be the levels of achievement relating to the performance criteria asselected by the Compensation Committee for an award. The Compensation Committee shall be able toestablish such performance goals relative to the applicable performance criteria in its sole discretion atthe time of an award. The performance goals may be applied on an absolute basis or relative to anidentified index or peer group, as specified by the Compensation Committee. The performance goalsmay be applied by the Compensation Committee after excluding charges for restructurings,discontinued operations, extraordinary items and other unusual or nonrecurring items and thecumulative effects of accounting changes, and without regard to realized capital gains.
Because the Bonus Plan will be adopted prior to our becoming a publicly held company, it isintended to satisfy the requirements for transition relief under Section 162(m) of the Code, such thatthe $1,000,000 annual deduction limit under Section 162(m) of the Code does not apply to anyremuneration paid pursuant to this Bonus Plan until the first meeting of our stockholders at which ourdirectors are to be elected that occurs after the close of the third calendar year following the calendaryear in which the initial public offering of our common stock occurs.
The Bonus Plan shall be effective as of the date of its approval by the Board.
183
PRINCIPAL AND SELLING STOCKHOLDERS
The following table sets forth information regarding the beneficial ownership of our common stockas of October 16, 2017, and as adjusted to reflect the sale of the shares of common stock offered inthis offering for:
• each person or entity who is known by us to beneficially own more than 5% of our commonstock;
• each of our directors and named executive officers;
• all of our directors and executive officers as a group; and
• each selling stockholder.
Each stockholder’s percentage ownership before and after the completion of this offering is basedon 104,948,924 shares of common stock outstanding as of October 16, 2017, and each stockholder’spercentage ownership after the offering is based on 113,282,257 shares of common stock outstandingimmediately after the completion of this offering plus, in each case, the number of shares of commonstock such stockholder has the right to acquire, including through the exercise of options, within60 days of October 16, 2017. For a discussion of our stock split, see ‘‘Prospectus Summary—TheOffering’’ and ‘‘Description of Capital Stock.’’
Information with respect to beneficial ownership has been furnished to us by each director,executive officer or stockholder listed in the table below, as the case may be. The amounts andpercentages of our common stock beneficially owned are reported on the basis of rules of the SECgoverning the determination of beneficial ownership of securities. Under these rules, a person isdeemed to be a ‘‘beneficial owner’’ of a security if that person has or shares ‘‘voting power,’’ whichincludes the power to vote or direct the voting of such security, or ‘‘investment power,’’ which includesthe power to dispose of or to direct the disposition of such security. A person is also deemed to be abeneficial owner of any securities of which that person has a right to acquire beneficial ownershipwithin 60 days after October 16, 2017, including any shares of our common stock subject to an optionthat has vested or will vest within 60 days after October 16, 2017. More than one person may bedeemed to be a beneficial owner of the same securities.
Unless otherwise indicated below, to our knowledge, all persons listed below have sole voting andinvestment power with respect to their shares of common stock, except to the extent authority is sharedby spouses under applicable law. Unless otherwise indicated below, the address for each person orentity listed below is c/o Evoqua Water Technologies Corp., 210 Sixth Avenue, Pittsburgh, Pennsylvania15222.
184

Shares to be Sold in thisPrior to this Offering Offering After this OfferingCommon Stock
Assuming Common Stock BeneficiallyAssuming Underwriters’ Beneficially Owned Assuming
Underwriters’ Option to Owned Assuming Underwriters’ OptionOption to Purchase Underwriters’ Option to PurchasePurchase Additional to Purchase Additional
Additional Shares is Additional Shares isCommon Stock Shares is not Exercised Shares is not Exercised
Beneficially Owned Exercised in Full Exercised in Full
Name of Beneficial Owner Number Percentage Number Number Number Percentage Number Percentage
5% StockholdersAEA(1) . . . . . . . . . . . . 61,357,648 58.5% 12,670,039 15,385,048 48,687,608 43.0% 45,972,599 40.6%bcIMC Private Placement
(2013) InvestmentCorporation(2) . . . . . . 11,780,668 11.2% 2,432,648 2,953,929 9,348,021 8.3% 8,826,739 7.8%
Havelock FundInvestments Pte Ltd(3) . 8,087,290 7.7% — — 8,087,290 7.1% 8,087,290 7.1%
Pictet Private EquityInvestors SA(4) . . . . . . 9,817,223 9.4% 2,027,206 2,461,608 7,790,017 6.9% 7,355,615 6.5%
Directors and NamedExecutive Officers
Ronald C. Keating . . . . . 1,414,470 1.3% — — 1,414,470 1.2% 1,414,470 1.2%Benedict J. Stas . . . . . . . 437,536 * — — 437,536 * 437,536 *Anthony J. Webster . . . . 88,960 * — — 88,960 * 88,960 *Vincent Grieco . . . . . . . 90,561 * — — 90,561 * 90,561 *James Kohosek . . . . . . . 64,024 * — — 64,024 * 64,024 *Martin Lamb . . . . . . . . . 444,969 * — — 444,969 * 444,969 *Nick Bhambri . . . . . . . . 134,856 * — — 134,856 * 134,856 *Gary Cappeline(5) . . . . . — — — — — — — —Judd Gregg . . . . . . . . . . 134,856 * — — 134,856 * 134,856 *Brian R. Hoesterey(5) . . . — — — — — — — —Vinay Kumar(5) . . . . . . . — — — — — — — —All executive officers and
directors as a group(16 persons) . . . . . . . . 4,138,815 3.8% 22,266 27,038 4,116,549 3.6% 4,111,777 3.6%
Other SellingStockholders
bcIMC (WCBAF) PrivatePlacement (2013)InvestmentCorporation(6) . . . . . . 1,854,364 1.8% 382,917 464,970 1,471,447 1.3% 1,389,394 1.2%
FW RMB NansemondInvestors, LLC(7) . . . . 1,227,153 1.2% 253,401 307,701 973,752 * 919,452 0.8%
Jungfrau SICAV-SIF(8) . . 2,045,255 1.9% 422,334 512,835 1,622,921 1.4% 1,532,420 1.4%LCY Investments Corp. . . 272,701 * 56,311 68,378 216,390 * 204,323 *Monte Rosa Opportunities
SICAV-SIF(9) . . . . . . . 1,636,204 1.6% 337,868 410,267 1,298,335 1.4% 1,225,937 1.1%NB PEP Holdings
Limited(10) . . . . . . . . 818,102 * 168,934 205,134 649,168 * 612,968 *Neuman, Charles M.(11) . 308,087 * 63,618 77,251 244,469 * 230,836 *Neuman, Randal S.(12) . . 539,152 * 111,332 135,189 427,820 * 403,963 *Partners Group U.S.
Private Equity2011, L.P. Inc.(13) . . . . 1,363,503 1.3% 281,556 341,890 1,081,947 1.0% 1,021,613 *
Xyris Inc. . . . . . . . . . . 272,701 * 56,311 68,378 216,390 * 204,323 *All other selling
stockholders as a groupholding less than 1% ofoutstanding shares inaggregate(14) . . . . . . . 763,713 * 157,703 191,496 606,217 * 572,216 *
* Represents beneficial ownership of less than 1% of our outstanding common stock.
(1) Represents shares of our common stock held of record by AEA EWT Holdings LP (‘‘AEA EWT Holdings’’), whose generalpartner is AEA EWT Holdings GP LLC (‘‘AEA EWT Holdings GP’’). The members of AEA EWT Holdings GP are(i) AEA Investors Participant Fund V LP, (ii) AEA Investors QP Participant Fund V LP, (iii) AEA Investors Fund V LP,(iv) AEA Investors Fund V-A LP and (v) AEA Investors Fund V-B LP (the entities named in clauses (i) through (v),collectively, the ‘‘AEA Funds’’). The AEA Funds are also limited partners of AEA EWT Holdings. The general partner of
185
each of AEA Investors Participant Fund V LP and AEA Investors QP Participant Fund V LP is AEA Investors PF V LLC,whose sole member is AEA Investors LP. The general partner of each of AEA Investors Fund V LP, AEA Investors FundV-A LP and AEA Investors Fund V-B LP is AEA Investors Partners V LP, whose general partner is AEA Management(Cayman) Ltd. Each of AEA EWT Holdings GP, the AEA Funds, AEA Investors PF V LLC, AEA Investors PartnersV LP, AEA Investors LP and AEA Management (Cayman) Ltd. may be deemed to share beneficial ownership of the sharesof our common stock held of record by AEA EWT Holdings, but each disclaims beneficial ownership of such shares. JohnL. Garcia, the Chairman and Chief Executive Officer of AEA Investors LP and the sole stockholder and director of AEAManagement (Cayman) Ltd., may also be deemed to share beneficial ownership of the shares of our common stock held ofrecord by AEA EWT Holdings, but Mr. Garcia disclaims beneficial ownership of such shares. The shares of our commonstock held of record by AEA EWT Holdings reflected in the table above do not include 43,586,681 shares of our commonstock owned by certain of our stockholders prior to this offering that have agreed to vote all of their shares to elect oneindividual to our board of directors that has been nominated by AEA (so long as AEA holds an aggregate of at least 10%of our outstanding common stock) pursuant to the Stockholders’ Agreement or irrevocable voting proxies. AEA EWTHoldings may be deemed to have or share voting control with respect to the shares of our common stock owned by thesestockholders, but AEA EWT Holdings disclaims beneficial ownership of such shares. For a description of our relationshipwith AEA, please see ‘‘Certain Relationships and Related Party Transactions—Stockholders’ Agreement.’’
The address for each of AEA EWT Holdings, AEA EWT Holdings GP, AEA Investors Participant Fund V LP, AEAInvestors QP Participant Fund V LP, AEA Investors PF V LLC, AEA Investors LP and Mr. Garcia is c/o AEAInvestors LP, 666 Fifth Avenue, 36th Floor, New York, New York 10103. The address for each of AEA Investors FundV LP, AEA Investors Fund V-A LP, AEA Investors Fund V-B LP, AEA Investors Partners V LP and AEA Management(Cayman) Ltd. is P.O. Box 309, Ugland House, Grand Cayman KY1-1104, Cayman Islands.
(2) Jim Pittman is Director, President and chair of bcIMC Private Placement (2013) Investment Corporation. David Woodwardand Julian Remedios are Vice Presidents of bcIMC Private Placement (2013) Investment Corporation. Patricia Bood isSecretary of bcIMC Private Placement (2013) Investment Corporation. Britta Wagner is Assistant Secretary of bcIMCPrivate Placement (2013) Investment Corporation. In such capacities, Messrs. Pittman, Woodward and Remedios andMss. Bood and Wagner may be deemed to have voting and dispositive power over the shares of our common stock held bybcIMC Private Placement (2013) Investment Corporation. Each of Messrs. Pittman, Woodward and Remedios andMss. Bood and Wagner disclaim beneficial ownership of these shares. The address for bcIMC Private Placement (2013)Investment Corporation and Messrs. Pittman, Woodward and Remedios and Mss. Bood and Wagner is 300-2950 JutlandRd. Victoria, British Columbia V8T5K2.
(3) Havelock Fund Investments Pte Ltd. is wholly owned by its ultimate parent, Temasek Holdings (Private) Limited, whichpossesses voting and investment control over the shares held by Havelock Fund Investments Pte Ltd. The address of theseentities is 60B Orchard Road, #06-18 Tower 2, The Atrium@Orchard, Singapore 238891.
(4) Mr. Carsten Beyer has voting and investment control over the shares of our common stock held by Pictet Private EquityInvestors SA, but disclaims beneficial ownership of such shares, except to the extent of any pecuniary interest therein.
(5) Does not include 61,357,647 shares of our common stock held of record by AEA EWT Holdings. Mr. Cappeline is anoperating partner of AEA, and Messrs. Hoesterey and Kumar are partners of AEA. Each of Messrs. Cappeline, Hoestereyand Kumar serves on our board of directors as a representative of AEA, but each disclaims beneficial ownership of theshares of our common stock held of record by AEA EWT Holdings.
(6) Jim Pittman is Director, President and chair of bcIMC (WCBAF) Private Placement (2013) Investment Corporation. DavidWoodward and Julian Remedios are Vice Presidents of bcIMC (WCBAF) Private Placement (2013) InvestmentCorporation. Patricia Bood is Secretary of bcIMC (WCBAF) Private Placement (2013) Investment Corporation. BrittaWagner is Assistant Secretary of bcIMC (WCBAF) Private Placement (2013) Investment Corporation. In such capacities,Messrs. Pittman, Woodward and Remedios and Mss. Bood and Wagner may be deemed to have voting and dispositivepower over the shares of our common stock held by bcIMC (WCBAF) Private Placement (2013) Investment Corporation.Each of Messrs. Pittman, Woodward and Remedios and Mss. Bood and Wagner disclaim beneficial ownership of theseshares. The address for bcIMC (WCBAF) Private Placement (2013) Investment Corporation and Messrs. Pittman,Woodward and Remedios and Mss. Bood and Wagner is 300-2950 Jutland Rd. Victoria, British Columbia V8T5K2.
(7) J. Taylor Crandall is Manager of FW RMB Nansemond Investors, LLC. In such capacity, Mr. Crandall may be deemed tohave voting and dispositive power over the shares of our common stock held by FW RMB Nansemond Investors, LLC.Mr. Crandall disclaims beneficial ownership of these shares. The address for FW RMB Nansemond Investors, LLC andMr. Crandall is 201 Main Street, Suite 3100, Fort Worth, Texas 76102.
(8) Mike Kara, Pierre-Alain Wavre and Marc Wenda may be deemed to have voting and dispositive power over the shares heldby Jungfrau SICAV-SIF. The address for each of Messrs. Kara, Wavre and Wenda is 15 Avenue J.F. Kennedy, L-1855Luxembourg.
(9) Jens Hoellermann, Francesco Ilardi, Mike Kara, Remy Obermann and Marc Wenda may be deemed to have voting anddispositive power over the shares held by Monte Rosa Opportunities SICAV-SIF. The address for each ofMessrs. Hoellermannm Ilardi, Kara, Obermann and Wenda is 15 Avenue J.F. Kennedy, L-1855 Luxembourg.
(10) Josh Miller, Langston Theis and Blake Rice may be deemed to have voting and dispositive power over the shares held byNB PEP Holdings Limited. Each of Messrs. Miller, Theis and Rice disclaim beneficial ownership of these shares. Theaddress for each of Messrs. Miller, Theis and Rice is 325 N. Saint Paul St., Suite 4900, Dallas, Texas 75201.
186

(11) Charles M. Neuman is currently a consultant to the Company. He also previously acted as a consultant to Neptune-Benson.His address is c/o Source Consulting, LLC N10467 Chief Kuno Trail, Fox Lake, Wisconsin 53933.
(12) The address of Randal S. Neuman is W9684 Beaverland Parkway, Beaver Dam, Wisconsin 53916.
(13) Partners Group Management X Limited is the General Partner of Partners Group U. S. Private Equity 2011, L.P., Inc.Susan Catherine Peer, Mark David Rowe, Daniel Francis Stopher and Dr. Michael Studer are the directors of PartnersGroup Management X Limited. In such capacities, Partners Group Management X Limited and each of Ms. Peer,Messrs. Rowe and Stopher and Dr. Studer may be deemed to have voting and dispositive power over the shares of ourcommon stock held by Partners Group U. S. Private Equity 2011, L.P., Inc. The address for each of Partners GroupManagement X Limited, Ms. Peer, Messrs. Rowe and Stopher and Dr. Studer is Tudor House Le Bordage, St. PeterPort GY1 6BD, Guernsey.
(14) Represents shares held by all other selling stockholders not listed above who, in the aggregate, beneficially own less than1% of our common stock outstanding prior to this offering, and includes 81,250 shares of common stock issuable uponexercise of options held by certain of our employees that have vested or will vest within 60 days after October 16, 2017.
187
CERTAIN RELATIONSHIPS AND RELATED PARTY TRANSACTIONS
The following is a description of transactions since October 1, 2013 to which we were a party inwhich the amount involved exceeded or will exceed $120,000, and in which any of our executiveofficers, directors or holders of more than 5% of any class of our voting securities, or an affiliate orimmediate family member thereof, had or will have a direct or indirect material interest. We believethe terms obtained or consideration that we paid or received, as applicable, in connection with thetransactions described below were comparable to terms available or amounts that would be paid orreceived, as applicable, in arms’-length transactions with unrelated third parties.
Management Agreement
We have entered into a management agreement with our Sponsor relating to the provision of itsadvisory and consulting services. The agreement requires us to pay our Sponsor an annual managementfee of approximately $4.0 million per year following the AEA Acquisition and continuing for as long asour Sponsor, either directly or indirectly, owns any of our or our subsidiaries’ equity. The annualmanagement fee is payable in quarterly installments of approximately $1.0 million, in advance, on thefirst day of each calendar quarter. The agreement also requires us to reimburse our Sponsor for itsreasonable out-of-pocket costs and expenses incurred in connection with the AEA Acquisition, itsprovision of ongoing advisory and consulting services, monitoring its investment in us and developing,negotiating, performing or enforcing any agreements or documents relating to its investment in us. Weincurred expenses, excluding advisory fees, of $0.4 million and $2.0 million for the years endingSeptember 30, 2016 and 2015 and $1.4 million for the period January 16, 2014 through September 30,2014, respectively. We believe that the agreement and the services mentioned above are or were onterms at least as favorable to us as we would expect to negotiate with unrelated third parties.Immediately following this offering, the agreement will be terminated. While the agreement does notrequire us to pay our Sponsor a termination fee, we will be required to reimburse our Sponsor for itsreasonable out-of-pocket costs and expenses incurred in connection with this offering.
Pursuant to the agreement, we agreed to indemnify our Sponsor against any claims or liabilitiesrelating to or arising out of actions taken by our Sponsor relating to the provision of its advisory andconsulting services (under the terms of the agreement) or the operation of our business, except forclaims or liabilities that are shown to have resulted from actions taken by our Sponsor in bad faith, ordue to our Sponsor’s gross negligence or willful misconduct. If for any reason (other than the bad faith,gross negligence or willful misconduct of our Sponsor as provided above) the foregoing indemnity isunavailable to or insufficient to hold our Sponsor harmless, then we will be required to contribute toany amount paid or payable by our Sponsor as a result of such claims or liabilities in such proportionas is appropriate to reflect (i) the relative benefits received by us, on the one hand, and our Sponsor,on the other hand, (ii) the relative fault of us and our Sponsor and (iii) any relevant equitableconsiderations, subject to the limitation that in any event our Sponsor’s aggregate contribution to allclaims and liabilities shall not exceed the amount of fees actually received by our Sponsor under theagreement (notwithstanding a finding of bad faith, gross negligence or willful misconduct of ourSponsor). Under the agreement, our Sponsor will not have any liability to us in connection with theservices it renders pursuant to the agreement (notwithstanding a finding of bad faith, gross negligenceor willful misconduct of our Sponsor). Those indemnification provisions will survive termination of theagreement.
As compensation for services provided by our Sponsor in connection with the AEA Acquisition, wepaid our Sponsor a one-time transaction success fee of $10.8 million.
188

Management Equity Participation
Following the completion of this offering, members of our current management team will holdapproximately 0.7% of our common stock. See ‘‘Principal Stockholders.’’
Voting Trust Agreement
Certain current and former employees, as well as certain other equity holders have contributedtheir shares of our common stock to a voting trust (the ‘‘Voting Trust’’) pursuant to an amended andrestated voting trust agreement, dated as of December 22, 2014 (the ‘‘Voting Trust Agreement’’), inexchange for units in the Voting Trust. Units in the voting trust track the value of the shares of ourcommon stock. Pursuant to the Voting Trust Agreement, the trustee agreed to vote the shares ofcommon stock held in trust by it in accordance with how the majority of the other shares of commonstock are voted on the same manner. We currently anticipate that the Voting Trust will be dissolvedimmediately prior to the consummation of our initial public offering and shares held by the trustee willbe returned to the holders that contributed them. Such shares will be subject to the provisions of theStockholders’ Agreement and the Registration Rights Agreement described below.
Transactions with Employees
From time to time, we have previously facilitated the transfer of funds between employees and usin connection with employee stock purchases. As a result, we were due $250,000 from one of ourexecutive officers as of September 30, 2016. This amount was repaid in full on January 31, 2017.
Board of Directors
Our board of directors currently consists of seven members, which includes five members whowere appointed by AEA.
Stockholders’ Agreement
We, AEA, certain members of management and certain of our stockholders entered into theStockholders’ Agreement in connection with the AEA Acquisition. The Stockholders’ Agreementcontains, among other things, certain restrictions on the ability of the parties thereto to freely transfershares of our stock. In addition, pursuant to the Stockholders’ Agreement, the parties thereto agree tovote their shares of our common stock on certain matters presented to the stockholders in the samemanner that the board of directors and a majority of our stockholders vote on such matters. Inparticular, following the consummation of this offering, and for so long as AEA holds an aggregate ofat least 10% of our outstanding common stock, AEA will be entitled to nominate at least oneindividual for election to our board of directors, and our board of directors and nominating committeethereof will nominate and recommend to our stockholders that such individual be elected to our boardof directors, and certain of our stockholders prior to this offering have agreed to vote all of their sharesto elect such individual to our board of directors pursuant to the Stockholders’ Agreement or votingproxies.
Debt
AEA, through two of its affiliated funds, is one of the lenders in the Incremental First LienFacility, and held loans thereunder of approximately $14.9 million at September 30, 2016 and$16.3 million at June 30, 2017.
189

Registration Rights Agreement
The parties to the Stockholders’ Agreement described above also entered into a registration rightsagreement in connection with the AEA Acquisition, which will be amended and restated prior to thecompletion of this offering (as amended and restated, the ‘‘Registration Rights Agreement’’). Pursuantto the Registration Rights Agreement, upon the closing of this offering and subject to the terms of thelock-up agreement they have entered into with the representatives of the underwriters, holders of atotal of 85,504,480 shares of our common stock as of October 16, 2017, will have the right to require usto register these shares under the Securities Act under specified circumstances or will have incidentalregistration rights as described below. After registration pursuant to these rights, these shares willbecome freely tradable without restriction under the Securities Act.
Demand Registration Rights
Subject to certain restrictions, at any time after 180 days following the effective date of theregistration statement of which this prospectus forms a part, or 120 days following the effective date ofany subsequent registration statement that we file (other than registration statements on Forms S-4 orS-8), AEA may request that we register all or a portion of their common stock for sale under theSecurities Act. We will effect the registration as requested in writing by AEA, unless in the good faithjudgment of our board of directors, such registration would materially and adversely interfere withcertain existing or potential material transactions or events involving the company and should bedelayed. We are not obligated to file a registration statement pursuant to these demand provisions onmore than five occasions on Form S-1; however, AEA is entitled to make an unlimited number ofdemands for registration on Form S-3 if and when we become eligible to use such form.
Piggyback Registration Rights
In addition, if at any time we register any shares of our common stock (other than pursuant toregistrations on Form S-4 or Form S-8), the holders of all shares having registration rights are entitled,subject to certain exceptions, to receive notice at least five business days prior to the filing of theregistration statement, or, in the case of holders who are individuals, no more than five business daysafter such filing, and to include all or a portion of their common stock in the registration.
In the event that any registration in which the holders of registrable shares participate pursuant tothe registration rights agreement is an underwritten public offering, the number of registrable shares tobe included may, in specified circumstances, be limited.
Other Provisions
We will pay all registration and offering expenses, including, among other things, reasonable feesand disbursements of a single special counsel for AEA and of a single special counsel for all otherselling stockholders, related to any demand or piggyback registration. The Registration RightsAgreement contains customary cross-indemnification provisions, pursuant to which we are obligated toindemnify any selling stockholders in the event of material misstatements or omissions in theregistration statement attributable to us, and they are obligated to indemnify us for materialmisstatements or omissions in the registration statement attributable to them. A particular stockholder’sshares shall no longer be considered registrable shares, to which demand and piggyback registrationrights apply, (i) when such shares have been disposed of under an effective registration statement or(ii) when such stockholder can sell, or with respect to AEA, has sold, such shares under Rule 144 ofthe Securities Act. In addition, the parties to the Registration Rights Agreement have agreed to not sellany shares pursuant to Rule 144 of the Securities Act or in another private placement for a period oftwo years following the closing of this offering, unless consented to by our board of directors or sold to
190

certain permitted transferees. The Registration Rights Agreement does not provide for any cashpenalties or other penalties associated with any delays in registering any shares.
Other Transactions with AEA
In April 2016, we received a $6.9 million capital contribution from AEA that we used to fund theNeptune-Benson Acquisition. This contribution, in addition to the net proceeds from the NBIncremental Loans, was used to finance the Neptune-Benson Acquisition, the refinancing of certainthen-existing indebtedness of Neptune-Benson and the payment of fees and expenses in connectionwith such transactions.
Corporate Charges from Siemens and Affiliates
The Predecessor received services and support from various functions performed by Siemens andthe Predecessor’s operations were dependent upon Siemens’ ability to provide these services andsupport functions. The total amount charged to the Predecessor for corporate services for the periodended January 15, 2014 was $3.0 million.
From time to time, the Predecessor also had sales to, and purchases from, other entities ofSiemens. Total sales for the period ending January 15, 2014 to other entities of Siemens were$4.5 million. The amount of purchases from other Siemens entities were not material for the periodended January 15, 2014.
Policies and Procedures for Related Party Transactions
Prior to the completion of this offering, we expect that our board of directors will adopt a policyproviding that the audit committee will review and approve or ratify transactions in excess of $120,000of value in which we participate and in which a director, executive officer or beneficial holder of morethan 5% of any class of our voting securities has or will have a direct or indirect material interest.Under this policy, the board of directors is to obtain all information it believes to be relevant to areview and approval or ratification of these transactions. After consideration of the relevantinformation, the audit committee is to approve only those related party transactions that the auditcommittee believes are on their terms, taken as a whole, no less favorable to us than could be obtainedin an arms’-length transaction with an unrelated third party and that the audit committee determinesare not inconsistent with the best interests of the Company. In particular, our policy with respect torelated party transactions will require our audit committee to consider the benefits to the Company,the impact on a director’s independence in the event the related person is a director, an immediatefamily member of a director or an entity in which a director has a position or relationship, theavailability of other sources for comparable products or services, the terms of the transaction and theterms available to unrelated third-parties or to employees generally. A ‘‘related party’’ is any personwho is or was one of our executive officers, directors or director nominees or is a holder of more than5% of our common stock, or their immediate family members or any entity owned or controlled by anyof the foregoing persons. All of the transactions described above were entered into prior to theadoption of this policy.
191

DESCRIPTION OF CAPITAL STOCK
General
Upon the completion of this offering, our authorized capital stock will consist of 1,000,000,000shares of common stock, par value $0.01 per share, and 100,000,000 shares of preferred stock, par value$0.01 per share, the rights and preferences of which the board of directors may establish from time totime. Upon the completion of this offering, there will be 113,282,257 outstanding shares of commonstock (excluding 9,168,049 shares of our common stock issuable upon exercise of outstanding stockoptions) and no outstanding shares of preferred stock. As of September 25, 2017, we had 329stockholders of record.
In connection with this offering, we amended and restated our certificate of incorporation andbylaws. The following descriptions of our capital stock, amended and restated certificate ofincorporation and amended and restated bylaws are intended as summaries only and are qualified intheir entirety by reference to our amended and restated certificate of incorporation and amended andrestated bylaws, which are filed as exhibits to the registration statement, of which this prospectusforms a part, and to the applicable provisions of the DGCL.
Common Stock
Following the consummation of this offering, we expect that certain affiliates of AEA, togetherwith certain of our other stockholders, will continue to control a majority of the voting power of ouroutstanding common stock. Holders of our common stock are entitled to one vote for each share heldon all matters submitted to a vote of stockholders and do not have cumulative voting rights. Anelection of directors by our stockholders shall be determined by a plurality of the votes cast by thestockholders present in person or represented by proxy at the meeting and entitled to vote on theelection. There will be no cumulative voting in the election of directors, which means that holders of amajority of the outstanding shares of common stock will be able to elect all of the directors, andholders of less than a majority of such shares will be unable to elect any director. Holders of commonstock are entitled to be paid ratably any dividends as may be declared by our board of directors (in itssole discretion), subject to any preferential dividend rights of outstanding preferred stock (if any).
In the event of our liquidation or dissolution, the holders of our common stock are entitled toreceive ratably, in proportion to the number of shares held by them, the assets available for distributionto stockholders after the payment of all debts and other liabilities and subject to the prior rights (ifany) of any outstanding preferred stock. Holders of our common stock have no preemptive or otherrights to subscribe for additional shares. The shares of our outstanding common stock are not subjectto further calls or assessments by us. There are no conversion or redemption rights or sinking fundprovisions applicable to the shares of our common stock. The rights, preferences and privileges ofholders of our common stock are subject to, and may be adversely affected by, the rights of the holdersof shares of any series of preferred stock that we may designate and issue in the future.
Preferred Stock
Our preferred stock, if issued, would have priority over our common stock with respect todividends and other distributions, including the distribution of our assets upon liquidation. To theextent permitted by law or by any stock exchange on which our common stock may be listed, our boardof directors will have the authority, without further stockholder authorization, to issue from time totime shares of authorized preferred stock in one or more series and to fix the terms, powers (includingvoting powers), rights, preferences and variations and the restrictions and limitations thereof of eachseries. Although we have no present plans to issue any shares of preferred stock, the issuance of sharesof preferred stock, or the issuance of rights to purchase such shares, could adversely affect the rights
192

and powers, including voting rights, of the common stock, and could have the effect of delaying,deterring or preventing a change in control of us or an unsolicited acquisition proposal.
Limitations on Directors’ Liability
Our amended and restated certificate of incorporation and amended and restated bylaws containprovisions indemnifying our directors and officers to the fullest extent permitted by law. Prior to thecompletion of this offering, we intend to enter into indemnification agreements with each of ourdirectors which may, in certain cases, be broader than the specific indemnification provisions containedunder Delaware law.
In addition, to the fullest extent permitted by Delaware law, our amended and restated certificateof incorporation provides that no director will be personally liable to us or our stockholders formonetary damages for breach of fiduciary duty as a director. The effect of this provision is to restrictour rights and the rights of our stockholders in derivative suits to recover monetary damages against adirector for breach of fiduciary duty as a director, except that a director will be personally liable for:
• any breach of his or her duty of loyalty to us or our stockholders;
• acts or omissions not in good faith which involve intentional misconduct or a knowing violationof law;
• the payment of dividends or the redemption or purchase of stock in violation of Delaware law;or
• any transaction from which the director derived an improper personal benefit.
This provision does not affect a director’s liability under the federal securities laws.
To the extent that our directors, officers and controlling persons are indemnified under theprovisions contained in our amended and restated certificate of incorporation, Delaware law orcontractual arrangements against liabilities arising under the Securities Act, we have been advised thatin the opinion of the SEC, such indemnification is against public policy as expressed in the SecuritiesAct and is therefore unenforceable.
Provisions of Our Amended and Restated Certificate of Incorporation, Amended and Restated Bylawsand Delaware Law that May Have an Anti-Takeover Effect
Delaware law, our amended and restated certificate of incorporation and our amended andrestated bylaws contain provisions that could have the effect of delaying, deferring or discouraginganother party from acquiring control of us. These provisions, which are summarized below, areexpected to discourage coercive takeover practices and inadequate takeover bids. These provisions arealso designed to encourage persons seeking to acquire control of us to first negotiate with our board ofdirectors.
Staggered Board; Removal of Directors
Our amended and restated certificate of incorporation and our amended and restated bylawsdivide our board of directors into three classes with staggered three-year terms. In addition, a directorwill be subject to removal by our stockholders only for cause and only by the affirmative vote of theholders of at least two-thirds in voting power of all of our then outstanding common stock if AEA,together with certain of our other stockholders, ceases to own 50% or more of the voting power of ourcommon stock. Any vacancy on our board of directors, including a vacancy resulting from an increasein the number of directors, will be filled by vote of a majority of our directors then in office (subject tothe rights of holders of any series of preferred stock or rights granted pursuant to the stockholders’agreement). Furthermore, our amended and restated certificate of incorporation provides that the total
193

number of directors may be changed only by the resolution of our board of directors (subject to therights of holders of any series of preferred stock to elect additional directors). The classification of ourboard of directors and the limitations on the removal of directors, changes to the total number ofdirectors and filling of vacancies could make it more difficult for a third party to acquire, or discouragea third party from seeking to acquire, control of our Company.
Stockholder Action by Written Consent; Special Meetings
Our amended and restated certificate of incorporation provides that any action required orpermitted to be taken by our stockholders must be effected at a duly called annual or special meetingof such holders and may not be effected by written consent if AEA, together with certain of our otherstockholders, ceases to own 50% or more of the voting power of our common stock. Our amended andrestated certificate of incorporation and our amended and restated bylaws also provide that, except asotherwise required by law, special meetings of our stockholders can only be called by our chairman ofthe board or our board of directors if AEA, together with certain of our other stockholders, ceases toown 50% or more of the voting power of our common stock.
Advance Notice Requirements for Stockholder Proposals
Our amended and restated bylaws establishes an advance notice procedure for stockholderproposals to be brought before an annual meeting of stockholders, including proposed nominations ofpersons for election to our board of directors. Stockholders at an annual meeting will only be able toconsider proposals or nominations specified in the notice of meeting or brought before the meeting byor at the direction of our board of directors or by a stockholder of record on the record date for themeeting who is entitled to vote at the meeting and who has delivered timely written notice in properform to our secretary of the stockholder’s intention to bring such business before the meeting. Theseprovisions could have the effect of delaying stockholder actions that are favored by the holders of amajority of our outstanding voting securities until the next stockholder meeting.
Section 203 of the Delaware General Corporation Law
While we expect to opt out of Section 203 of the DGCL, our amended and restated certificate ofincorporation will contain similar provisions providing that we may not engage in certain ‘‘businesscombinations’’ with any ‘‘interested stockholder’’ for a three-year period following the time that thestockholder became an interested stockholder, unless:
• prior to such time, our board of directors approved either the business combination or thetransaction that resulted in the stockholder becoming an interested stockholder;
• upon consummation of the transaction that resulted in the stockholder becoming an interestedstockholder, the interested stockholder owned at least 85% of our voting stock outstanding atthe time the transaction commenced, excluding for purposes of determining the voting stockoutstanding (but not the outstanding voting stock owned by the interested stockholder) thoseshares owned (a) by persons who are directors and also officers and (b) pursuant to employeestock plans in which employee participants do not have the right to determine confidentiallywhether shares held subject to the plan will be tendered in a tender or exchange offer; or
• at or subsequent to that time, the business combination is approved by our board of directorsand authorized at an annual of special meeting of our stockholders, and not by written consent,by the affirmative vote of holders of at least two-thirds of our outstanding voting stock that isnot owned by the interested stockholder.
Generally, a ‘‘business combination’’ includes a merger, asset or stock sale or other transactionprovided for or through our Company resulting in a financial benefit to the interested stockholder.
194

Subject to certain exceptions, an ‘‘interested stockholder’’ is a person who owns 15% or more of ouroutstanding voting stock and the affiliates and associates of such person. For purposes of this provision,‘‘voting stock’’ means any class or series of stock entitled to vote generally in the election of directors.
Under certain circumstances, this provision will make it more difficult for a person who qualifies asan ‘‘interested stockholder’’ to effect certain business combinations with our Company for a three-yearperiod. This provision may encourage companies interested in acquiring us to negotiate in advance withour board of directors in order to avoid the stockholder approval requirement if our board of directorsapproves either the business combination or the transaction that results in the stockholder becoming aninterested stockholder. These provisions also may have the effect of preventing changes in our board ofdirectors and may make it more difficult to accomplish transactions that our stockholders mayotherwise deem to be in their best interests.
Our amended and restated certificate of incorporation provides that certain affiliates of AEA, theirrespective affiliates and any of their direct or indirect designated transferees (other than in certainmarket transfers and gifts) and any group of which such persons are a party do not constitute‘‘interested stockholders’’ for purposes of this provision.
Amendments to Our Bylaws
The DGCL provides generally that the affirmative vote of a majority of the shares present at anymeeting and entitled to vote on a matter is required to amend a corporation’s bylaws, unless acorporation’s bylaws requires a greater percentage. Effective upon the completion of this offering, ouramended and restated bylaws may be amended or repealed by the affirmative vote of the holders of atleast two-thirds of the voting power of all outstanding stock entitled to vote thereon, voting together asa single class, if AEA, together with certain of our other stockholders, ceases to own 50% or more ofthe voting power of our common stock.
Exclusive Forum
Our amended and restated certificate of incorporation provides that the Court of Chancery of theState of Delaware will be the sole and exclusive forum for (i) any derivative action or proceedingbrought on our behalf, (ii) any action asserting a claim of breach of a fiduciary duty owed to us or ourstockholders by any of our directors, officers or employees, (iii) any action asserting a claim against usarising under the DGCL, our amended and restated certificate of incorporation or our amended andrestated bylaws or (iv) any action asserting a claim against us that is governed by the internal affairsdoctrine. Although we believe this provision benefits us by providing increased consistency in theapplication of Delaware law in the types of claims to which it applies, the provision may have the effectof discouraging lawsuits against our directors and officers and may limit our stockholders’ ability toobtain a favorable judicial forum for disputes with us.
Corporate Opportunity
Delaware law permits corporations to adopt provisions renouncing any expectancy in or right to beoffered an opportunity to participate in certain transactions or matters that may be investment,corporate or business opportunities and that are presented to a corporation or its officers, directors orstockholders. Our amended and restated certificate of incorporation provides that, to the fullest extentpermitted by Delaware law, neither (1) AEA, any of its directors, principals, officers, employees orother representatives that may serve as our directors, officers or agents, and each of their affiliates(each, an ‘‘Excluded AEA Party’’) nor (2) any of our directors (other than any Excluded AEA Party)who are not Evoqua officers or employees, and each of their affiliates (each, an ‘‘Excluded Director’’),shall have any duty refrain from (a) directly or indirectly engaging in any opportunity in which we,directly or indirectly, could have an interest or expectancy or (b) otherwise competing with us. Our
195

amended and restated certificate of incorporation also renounces, to the fullest extent permitted byDelaware law, any interest or expectancy that we have in any opportunity in which any Excluded AEAParty engages, even if the opportunity is one in which we, directly or indirectly, could have had aninterest or expectancy. To the fullest extent permitted by Delaware law, in the event that any ExcludedAEA Party acquires knowledge of an opportunity that may be an opportunity for itself, himself orherself and for us, such party shall have no duty to communicate or present such opportunity to us andshall not be liable to us or any of our stockholders for breach of any fiduciary duty as our stockholder,director or officer solely for having pursued or acquired such opportunity or for offering or directingsuch opportunity to another person. Notwithstanding the foregoing, our amended and restatedcertificate of incorporation does not renounce any interest in any opportunity that is expressly offeredto any Excluded Director solely in his or her capacity as one of our directors. To the fullest extentpermitted by Delaware law, no business opportunity will be deemed to be a potential corporateopportunity for us unless we would be permitted to undertake the opportunity under our amended andrestated certificate of incorporation, we have sufficient financial resources to undertake the opportunityand the opportunity would be in line with our business.
Stock Exchange Listing
We have applied to list our common stock on the NYSE under the symbol ‘‘AQUA.’’
Transfer Agent and Registrar
The transfer agent and registrar for our common stock is American Stock Transfer & TrustCompany, LLC.
196

DESCRIPTION OF CERTAIN INDEBTEDNESS
On January 15, 2014, we entered into (i) senior secured first lien credit facilities consisting of asenior secured first lien term loan facility (the ‘‘Term Loan Facility’’) and a senior secured revolvingcredit facility (the ‘‘Revolving Credit Facility’’ and, together with the Term Loan Facility, the ‘‘First LienFacilities’’) and (ii) a senior secured second lien term loan facility (the ‘‘Second Lien Facility’’).
Senior Secured Credit Facilities
General
Our subsidiary EWT Holdings III Corp. (formerly known as WTG Holdings III Corp.)(‘‘EWT III’’), as the borrower, entered into (i) the First Lien Facilities, pursuant to a First Lien CreditAgreement, with EWT Holdings II Corp. (formerly known as WTG Holdings II Corp.) (‘‘EWT II’’), asa parent guarantor, the lenders party thereto, and Credit Suisse AG, as administrative agent andcollateral agent (in such capacities, the ‘‘Agent’’), dated January 15, 2014, and (ii) the Second LienFacility, pursuant to a Second Lien Credit Agreement, with EWT II, the lenders party thereto, andCredit Suisse AG, as administrative agent and collateral agent, dated January 15, 2014. As discussedbelow, the Second Lien Facility was no longer outstanding as of October 28, 2016.
The Senior Secured Credit Facilities originally consisted of (i) a term loan facility in an initialaggregate principal amount of $505.0 million (the ‘‘Initial First Lien Term Loans’’) under the First LienCredit Agreement, (ii) a revolving credit facility in an aggregate principal amount of $75.0 millionunder the First Lien Credit Agreement and (iii) a term loan facility in an aggregate principal amountof $75.0 million under the Second Lien Facility. The net proceeds of such facilities were used inconnection with the AEA Acquisition, to refinance existing indebtedness, to cash collateralize and/or toprovide cash collateral in exchange for the cancellation of certain existing and future letters of creditand similar instruments, and related transactions.
On April 15, 2016, we borrowed $185.0 million of incremental term loans (the ‘‘NB IncrementalLoans’’) under the Term Loan Facility pursuant to an incremental amendment to the First Lien CreditAgreement. The net proceeds of the NB Incremental Loans were used to finance the Neptune-BensonAcquisition, the refinancing of certain then-existing indebtedness of Neptune-Benson and the paymentof fees and expenses in connection with such transactions.
On October 28, 2016, we entered into the October 2016 Refinancing, in which we increased theamount of our existing Term Loan Facility by borrowing $150.0 million of incremental term loans underthe Term Loan Facility pursuant to an incremental amendment to the First Lien Credit Agreement.The net proceeds of the October 2016 Incremental Term Loans were used, among other things, torepay all amounts then-outstanding under the Second Lien Credit Agreement (the ‘‘Second LienRepayment’’) and all revolving credit loans then outstanding under the Revolving Credit Facility(without permanent reduction of commitments thereunder), to pay fees and expenses in connectionwith the transactions thereunder, and for working capital, capital expenditures and other generalcorporate purposes. We refer to the First Lien Facilities and, until the Second Lien Repayment, theSecond Lien Facility, collectively as the ‘‘Senior Secured Credit Facilities.’’ We also upsizedcommitments under our existing Revolving Credit Facility by $20.0 million to a total of $95.0 million.
On March 6, 2017, we further amended the First Lien Facilities to provide for certain additionalbasket flexibilities under the covenants.
On August 8, 2017, we entered into the August 2017 Refinancing pursuant to which we(i) borrowed approximately $262.7 million in refinancing term loans, the net proceeds of which wereused to refinance in their entirety the NB Incremental Term Loans and (ii) increased the amount ofour existing Term Loan Facility by borrowing $80.0 million of incremental term loans under the TermLoan Facility, the net proceeds of which were used to repay $60 million of the revolving credit loans
197
then outstanding under the Revolving Credit Facility (without permanent reduction of commitmentsthereunder), to pay related fees and expenses, and for other general corporate purposes (includingpermitted acquisitions and permitted investments pursuant to the First Lien Credit Agreement).Pursuant to the August 2017 Refinancing, a single tranche of term loans is outstanding under the FirstLien Credit Agreement, with the same terms, including pricing terms, as the First Lien Term Facilityimmediately prior to the August 2017 Refinancing. The terms governing the NB Incremental Loanswere superseded in their entirety by the terms set forth in the August 2017 Refinancing.
The term loans under the Term Loan Facility amortize in quarterly installments of approximately$2.3 million through December 31, 2020, with the remainder due at term loan maturity on January 15,2021. The Senior Secured Credit Facilities also permit us to add one or more incremental term loans(excluding revolving commitment increases in an aggregate amount not exceeding $30.0 million) up to$100.0 million plus an unlimited amount, subject to our pro forma compliance with a first lien netleverage ratio (calculated as the ratio of consolidated funded first lien debt for borrowed money (net ofunrestricted cash and cash equivalents) to trailing four-quarter Consolidated EBITDA) of 4.50 to 1.00.
As of June 30, 2017, we had $878.7 million outstanding under the Senior Secured Credit Facilities.
Interest
The Term Loans and the Revolving Credit Facility bear interest at a rate per annum equal to, atour option, either (a) adjusted LIBOR (subject to 1% floor in the case of the Term Loans and the NBIncremental Loans) plus the applicable rate or (b) base rate (determined by reference to the greatestof the prime rate published by Credit Suisse AG, the federal funds effective rate plus 0.5% andone-month LIBOR plus 1%) plus the applicable rate. The applicable rates under the Term Loans(excluding the NB Incremental Loans) are 3.75% for LIBOR loans and 2.75% for base rate loans.
The applicable rates under the Revolving Credit Facility are subject to step-ups and step-downsbased on first lien net leverage ratio levels in accordance with the following schedule:
First Lien EurocurrencyPricing Level Leverage Ratio Rate Base Rate
1 . . . . . . . . . . . . . . . . . . . . . . . . . . . . . . . . . > 2.50:1.00 3.25% 2.25%2 . . . . . . . . . . . . . . . . . . . . . . . . . . . . . . . . . � 2.50:1.00 3.00% 2.00%
Optional and Mandatory Prepayments
At our option, the Term Loans may be prepaid at any time, in whole or in part, with notice to theAgent, without any premium or penalty but subject to customary LIBOR breakage costs; provided thatthe Term Loan Facility is subject to a 1% prepayment penalty for refinancings in connection withcertain repricing transactions through February 8, 2018.
In addition, subject to the satisfaction of certain conditions, we are permitted to offer our lendersto repurchase term loans held by them under the Senior Secured Credit Facilities at a discount.
Under certain circumstances and subject to certain exceptions, the Senior Secured Credit Facilitieswill be subject to mandatory prepayments in the amount equal to: (x) 100% of the net proceeds ofcertain assets sales and issuances or incurrence of non-permitted indebtedness and (y) 50% of annualexcess cash flow for any fiscal year, such percentage to decrease to 25% and to 0% depending on theattainment of certain total leverage ratio targets.
Guarantee and Collateral
Our obligations in respect of the Senior Secured Credit Facilities are guaranteed by EWT II andeach of our material existing and newly acquired or created wholly-owned domestic restricted
198
subsidiaries and are secured by substantially all assets of EWT III and the guarantors, in each casesubject to customary exceptions.
Covenants and Other Matters
The Senior Secured Credit Facilities require that we comply with a number of covenants, as well ascertain financial tests. The covenants limit, in certain circumstances, our ability to take a variety ofactions, including:
• incur indebtedness;
• create or maintain liens on property or assets;
• make investments, loans and advances;
• engage in acquisitions, mergers, consolidations and asset sales;
• redeem debt;
• pay dividends and distributions; and
• enter into transactions with affiliates.
In addition, our Revolving Credit Facility, but not the Term Loans, contains a financial covenantwhich requires us to comply with the maximum first lien net leverage ratio of 5.55 to 1.00 as of the lastday of any quarter on which the aggregate amount of revolving loans and letters of credit outstandingunder the Revolving Credit Facility (net of cash collateralized letters of credit and undrawn outstandingletters of credit in an amount of up to 50% of the Revolving Credit Facility) exceeds 25% of the totalcommitments thereunder.
The Senior Secured Credit Facilities also have various non-financial covenants, both requiring theborrower and guarantors to refrain from taking certain future actions (as described above) andrequiring each of the borrower and guarantors to take certain actions, such as keeping in good standingits corporate existence, maintaining insurance, and providing the bank lending group with financialinformation on a timely basis. The Senior Secured Credit Facilities also contain certain customaryrepresentations and warranties and events of default, including among other things payment defaults,breach of representations and warranties, covenant defaults, cross-defaults to certain indebtedness,certain events of bankruptcy, certain events under the Employee Retirement Income Security Act of1974, as amended (‘‘ERISA’’), material judgments, actual or asserted failure of any material guaranty orsecurity document supporting the Senior Secured Credit Facilities to be in force and effect, and achange of control. If such an event of default occurs, the administrative agent under the Senior SecuredCredit Facilities would be entitled to take various actions, including the acceleration of amounts dueunder the Senior Secured Credit Facilities and all actions permitted to be taken by a secured creditor.
This summary describes the material provisions of the Senior Secured Credit Facilities, but maynot contain all information that is important to you. We urge you to read the provisions of the FirstLien Credit Agreement and the amendments thereto, each of which has been filed as an exhibit to theregistration statement of which this prospectus forms a part. See ‘‘Where You Can Find MoreInformation.’’
199
SHARES ELIGIBLE FOR FUTURE SALE
The sale of a substantial amount of our common stock in the public market after this offeringcould adversely affect the prevailing market price of our common stock. Furthermore, because %of our common stock outstanding prior to the consummation of this offering will be subject to thecontractual and legal restrictions on resale described below, the sale of a substantial amount ofcommon stock in the public market after these restrictions lapse could materially adversely affect theprevailing market price of our common stock and our ability to raise equity capital in the future.
Upon completion of this offering, we expect to have outstanding an aggregate of 113,282,257shares of our common stock, assuming no exercise of outstanding options. All of the shares of commonstock sold in this offering will be freely transferable without restriction or further registration under theSecurities Act (other than restrictions pursuant to lock-up agreements entered into by any directors orofficers purchasing shares in the directed share program) by persons other than ‘‘affiliates,’’ as thatterm is defined in Rule 144 under the Securities Act. Generally, the balance of our outstandingcommon stock are ‘‘restricted securities’’ within the meaning of Rule 144 under the Securities Act,subject to the limitations and restrictions that are described below. Common stock purchased by ouraffiliates will be ‘‘restricted securities’’ under Rule 144. Restricted securities may be sold in the publicmarket only if registered or if they qualify for an exemption from registration under Rule 144 orRule 701 under the Securities Act. These rules are summarized below.
Upon the expiration of the lock-up agreements described below 180 days after the date of thisprospectus, and subject to the provisions of Rule 144, an additional 83,544,087 shares will be availablefor sale in the public market. The sale of these restricted securities is subject, in the case of shares heldby affiliates, to the volume restrictions contained in those rules.
Lock-up Agreements
In connection with this offering, we, our directors and executive officers and stockholders currentlyrepresenting approximately 98% of the shares of our common stock outstanding prior to this offeringwill agree with the underwriters to enter into lock-up agreements described in ‘‘Underwriting,’’pursuant to which shares of our common stock outstanding after this offering will be restricted fromimmediate resale in accordance with the terms of such lock-up agreements without the prior writtenconsent of Credit Suisse Securities (USA) LLC and J.P. Morgan Securities LLC. Under theseagreements, subject to limited exceptions, neither we nor any of our directors or executive officers orthese stockholders may dispose of, hedge or otherwise transfer the economic consequences ofownership of any shares of common stock or securities convertible into or exchangeable or exercisablefor shares of common stock. These restrictions will be in effect for a period of 180 days after the dateof this prospectus. Certain transfers or dispositions can be made sooner, provided the transfereebecomes bound to the terms of the lock-up.
Rule 144
In general, under Rule 144 as in effect on the date of this prospectus, beginning 90 days after theconsummation of this offering, a person (or persons whose common stock is required to beaggregated), who is an affiliate, and who has beneficially owned our common stock for at least sixmonths is entitled to sell in any three-month period a number of shares that does not exceed thegreater of:
• 1% of the number of shares then outstanding, which will equal approximately 1.13 million sharesimmediately after consummation of this offering; or
• the average weekly trading volume in our shares on the NYSE during the four calendar weekspreceding the filing of a notice on Form 144 with respect to such a sale.
200

Sales by our affiliates under Rule 144 are also subject to manner of sale provisions and noticerequirements and to the availability of current public information about us. An ‘‘affiliate’’ is a personthat directly, or indirectly through one or more intermediaries, controls or is controlled by, or is undercommon control with an issuer.
Under Rule 144, a person (or persons whose shares are aggregated) who is not deemed to havebeen an affiliate of ours at any time during the 90 days preceding a sale, and who has beneficiallyowned the shares proposed to be sold for at least six months (including the holding period of any priorowner other than an affiliate), would be entitled to sell those shares subject only to availability ofcurrent public information about us, and after beneficially owning such shares for at least twelvemonths, would be entitled to sell an unlimited number of shares without restriction. To the extent thatour affiliates sell their common stock, other than pursuant to Rule 144 or a registration statement, thepurchaser’s holding period for the purpose of effecting a sale under Rule 144 commences on the dateof transfer from the affiliate.
Rule 701
In general, under Rule 701 as in effect on the date of this prospectus, any of our employees,directors, officers, consultants or advisors who purchased shares from us in reliance on Rule 701 inconnection with a compensatory stock or option plan or other written agreement before the effectivedate of this offering, or who purchased shares from us after that date upon the exercise of optionsgranted before that date, are eligible to resell such shares 90 days after the effective date of thisoffering in reliance upon Rule 144. If such person is not an affiliate, such sale may be made subjectonly to the manner of sale provisions of Rule 144. If such a person is an affiliate, such sale may bemade under Rule 144 without compliance with the holding period requirement, but subject to the otherRule 144 restrictions described above.
Stock Plans
We intend to file a registration statement or statements on Form S-8 under the Securities Actcovering shares of common stock reserved for issuance pursuant to all option grants made prior to thisoffering under the Stock Option Plan. Subject to lock-up arrangements, these registration statementsmay be filed any time after the closing date of this offering. Shares issued upon the exercise of stockoptions after the effective date of the applicable Form S-8 registration statement will be eligible forresale in the public market without restriction, subject to Rule 144 limitations applicable to affiliatesand the lock-up agreements described above.
Registration Rights
Following this offering, some of our stockholders will, under some circumstances, have the right torequire us to register their shares for future sale. See ‘‘Certain Relationships and Related PartyTransactions—Registration Rights Agreement.’’
201
MATERIAL U.S. FEDERAL TAX CONSIDERATIONS FORNON-U.S. HOLDERS OF OUR COMMON STOCK
The following is a summary of the material U.S. federal income and estate tax consequences of theownership and disposition of our common stock that is being issued pursuant to this offering. Thissummary is limited to Non-U.S. Holders (as defined below) that hold our common stock as a capitalasset (generally, property held for investment) for U.S. federal income tax purposes. This summarydoes not discuss all of the aspects of U.S. federal income and estate taxation that may be relevant to aNon-U.S. Holder in light of the Non-U.S. Holder’s particular investment or other circumstances.Accordingly, all prospective Non-U.S. Holders should consult their own tax advisors with respect to theU.S. federal, state, local and non-U.S. tax consequences of the ownership and disposition of ourcommon stock.
This summary is based on provisions of the U.S. Internal Revenue Code of 1986, as amended(which we refer to as the ‘‘Code’’), applicable U.S. Treasury regulations and administrative and judicialinterpretations, all as in effect or in existence on the date of this prospectus. Subsequent developmentsin U.S. federal income or estate tax law, including changes in law or differing interpretations, whichmay be applied retroactively, could alter the U.S. federal income and estate tax consequences ofowning and disposing of our common stock as described in this summary. There can be no assurancethat the Internal Revenue Service (the ‘‘IRS’’) will not take a contrary position with respect to one ormore of the tax consequences described herein and we have not obtained, nor do we intend to obtain,a ruling from the IRS with respect to the U.S. federal income or estate tax consequences of theownership or disposition of our common stock.
As used in this summary, the term ‘‘Non-U.S. Holder’’ means a beneficial owner of our commonstock that is not, for U.S. federal income tax purposes:
• an individual who is a citizen or resident of the United States;
• a corporation (or other entity treated as a corporation for U.S. federal income tax purposes)created or organized in or under the laws of the United States, any state thereof, or the Districtof Columbia;
• an entity or arrangement treated as a partnership;
• an estate whose income is includible in gross income for U.S. federal income tax purposesregardless of its source; or
• a trust, if (1) a U.S. court is able to exercise primary supervision over the trust’s administrationand one or more ‘‘United States persons’’ (within the meaning of the Code) has the authority tocontrol all of the trust’s substantial decisions, or (2) the trust has a valid election in effect underapplicable U.S. Treasury regulations to be treated as a United States person.
If an entity or arrangement treated as a partnership for U.S. federal income tax purposes holdsour common stock, the tax treatment of a partner in such a partnership generally will depend upon thestatus of the partner, the activities of the partnership and certain determinations made at the partnerlevel. Partnerships, and partners in partnerships, that hold our common stock should consult their owntax advisors as to the particular U.S. federal income and estate tax consequences of owning anddisposing of our common stock that are applicable to them.
This summary does not address all U.S. federal income or estate tax consequences relevant to aNon-U.S. Holder’s particular circumstances, including the impact of the Medicare contribution tax onnet investment income. In addition, this summary does not consider any specific facts or circumstances
202

that may apply to a Non-U.S. Holder and does not address any special tax rules that may apply toparticular Non-U.S. Holders, such as:
• a Non-U.S. Holder that is a financial institution, insurance company, tax-exempt organization,pension plan, broker, dealer or trader in stocks, securities or currencies, U.S. expatriate,controlled foreign corporation or passive foreign investment company;
• a Non-U.S. Holder holding our common stock as part of a conversion, constructive sale, washsale or other integrated transaction or a hedge, straddle or synthetic security;
• a Non-U.S. Holder that holds or receives our common stock pursuant to the exercise of anyemployee stock option or otherwise as compensation; or
• a Non-U.S. Holder that at any time owns, directly, indirectly or constructively, more than 5% ofour outstanding common stock.
In addition, this summary does not address any U.S. state or local, or non-U.S. tax consequences,or any U.S. federal income or estate tax consequences for beneficial owners of a Non-U.S. Holder,including stockholders of a controlled foreign corporation or passive foreign investment company thathold our common stock.
Each Non-U.S. Holder should consult its own tax advisor regarding the U.S. federal, state, localand non-U.S. tax consequences of owning and disposing of our common stock.
Distributions on Our Common Stock
As discussed under ‘‘Dividend Policy’’ above, we do not intend to pay cash dividends on ourcommon stock for the foreseeable future. If we make distributions of cash or property (other thancertain pro rata distributions of our common stock) with respect to our common stock, any suchdistributions generally will constitute dividends for U.S. federal income tax purposes to the extent paidfrom our current or accumulated earnings and profits, as determined under U.S. federal income taxprinciples. If a distribution exceeds our current and accumulated earnings and profits, the excess will betreated as a nontaxable return of capital to the extent of the Non-U.S. Holder’s adjusted tax basis in itscommon stock and will reduce (but not below zero) such Non-U.S. Holder’s adjusted tax basis in itscommon stock. Any remaining excess will be treated as gain from a disposition of our common stocksubject to the tax treatment described below in ‘‘Sales or Other Dispositions of Our Common Stock.’’Distributions on our common stock that are treated as dividends, and that are not effectively connectedwith a Non-U.S. Holder’s conduct of a trade or business in the United States, generally will be subjectto withholding of U.S. federal income tax at a rate of 30%. A Non-U.S. Holder may be eligible for alower rate under an applicable income tax treaty between the United States and such non-U.S.Holder’s jurisdiction of tax residence. In order to claim the benefit of an applicable income tax treaty, aNon-U.S. Holder will be required to provide to the applicable withholding agent a properly executedIRS Form W-8BEN or W-8BEN-E (or other applicable form) in accordance with the applicablecertification and disclosure requirements. Special rules apply to partnerships and other pass-throughentities and these certification and disclosure requirements also may apply to beneficial owners ofpartnerships and other pass-through entities that hold our common stock.
Dividends that are effectively connected with a Non-U.S. Holder’s conduct of a trade or businessin the United States (and, if required by an applicable income tax treaty, are attributable to apermanent establishment or fixed base maintained by the Non-U.S. Holder in the United States) willnot be subject to the withholding of U.S. federal income tax discussed above if the Non-U.S. Holderprovides to the applicable withholding agent a properly executed IRS Form W-8ECI (or otherapplicable form) in accordance with the applicable certification and disclosure requirements. Instead,any such effectively connected dividends will be subject to U.S. federal income tax on a net incomebasis at the regular graduated rates and in the manner applicable to United States persons (unless an
203

applicable income tax treaty provides otherwise). A Non-U.S. Holder that is treated as a corporationfor U.S. federal income tax purposes may also be subject to a ‘‘branch profits’’ tax at a 30% rate (or alower rate if the Non-U.S. Holder is eligible for a lower rate under an applicable income tax treaty) onthe Non-U.S. Holder’s earnings and profits (attributable to dividends on our common stock orotherwise) that are effectively connected with the Non-U.S. Holder’s conduct of a trade or businesswithin the United States, subject to certain adjustments.
The certifications described above must be provided to the applicable withholding agent prior tothe payment of dividends and must be updated periodically. A Non-U.S. Holder may obtain a refundor credit of any excess amounts withheld by timely filing an appropriate claim for a refund with theIRS. Non-U.S. Holders should consult their own tax advisors regarding their eligibility for benefitsunder a relevant income tax treaty and the manner of claiming such benefits.
The foregoing discussion is subject to the discussion below under ‘‘Backup Withholding andInformation Reporting’’ and ‘‘FATCA Withholding.’’
Sales or Other Dispositions of Our Common Stock
A Non-U.S. Holder generally will not be subject to U.S. federal income tax (including withholdingthereof) on any gain recognized on sales or other dispositions of our common stock unless:
• the gain is effectively connected with the Non-U.S. Holder’s conduct of a trade or business inthe United States (and, if required by an applicable income tax treaty, is attributable to apermanent establishment or fixed base maintained by the Non-U.S. Holder in the UnitedStates); in this case, the gain will be subject to U.S. federal income tax on a net income basis atthe regular graduated rates and in the manner applicable to United States persons (unless anapplicable income tax treaty provides otherwise) and, if the Non-U.S. Holder is treated as acorporation for U.S. federal income tax purposes, the ‘‘branch profits tax’’ described above mayalso apply;
• the Non-U.S. Holder is an individual who is present in the United States for more than 182 daysin the taxable year of the disposition and meets certain other requirements; in this case, exceptas otherwise provided by an applicable income tax treaty, the gain, which may be offset bycertain U.S. source capital losses, generally will be subject to a flat 30% U.S. federal income tax,even though the Non-U.S. Holder is not considered a resident of the United States under theCode; or
• we are or have been a ‘‘United States real property holding corporation’’ for U.S. federalincome tax purposes at any time during the shorter of (i) the five-year period ending on the dateof disposition and (ii) the period that the Non-U.S. Holder held our common stock.
Generally, a corporation is a ‘‘United States real property holding corporation’’ if the fair marketvalue of its ‘‘United States real property interests’’ equals or exceeds 50% of the sum of the fair marketvalue of its worldwide real property interests plus its other assets used or held for use in a trade orbusiness. We believe that we are not currently, and we do not anticipate becoming in the future, aUnited States real property holding corporation. However, because the determination of whether weare a United States real property holding corporation is made from time to time and depends on therelative fair market values of our assets, there can be no assurance in this regard. If we were a UnitedStates real property holding corporation, the tax relating to disposition of stock in a United States realproperty holding corporation generally will not apply to a Non-U.S. Holder whose holdings, direct,indirect and constructive, constituted 5% or less of our common stock at all times during the applicableperiod, provided that our common stock is ‘‘regularly traded on an established securities market’’ (asprovided in applicable U.S. Treasury regulations) at any time during the calendar year in which thedisposition occurs. However, no assurance can be provided that our common stock will be regularly
204

traded on an established securities market for purposes of the rules described above. Non-U.S. Holdersshould consult their own tax advisors regarding the possible adverse U.S. federal income taxconsequences to them if we are, or were to become, a United States real property holding corporation.
The foregoing discussion is subject to the discussion below under ‘‘Backup Withholding andInformation Reporting’’ and ‘‘FATCA Withholding.’’
Federal Estate Tax
Our common stock that is owned (or treated as owned) by an individual who is not a U.S. citizenor resident of the United States (as specially defined for U.S. federal estate tax purposes) at the timeof death will be included in the individual’s gross estate for U.S. federal estate tax purposes, unless anapplicable estate tax or other treaty provides otherwise and, therefore, may be subject to U.S. federalestate tax.
Backup Withholding and Information Reporting
Backup withholding (currently at a rate of 28%) will not apply to payments of dividends on ourcommon stock to a Non-U.S. Holder, provided the applicable withholding agent does not have actualknowledge or reason to know the holder is a United States person and the Non-U.S. Holder eitherprovides to the applicable withholding agent a properly executed IRS Form W-8BEN or W-8BEN-E (orother applicable form) certifying under penalties of perjury that the Non-U.S. Holder is not a UnitedStates person, or otherwise qualifies for an exemption. However, the applicable withholding agentgenerally will be required to report to the IRS and to such Non-U.S. Holder payments of dividends onour common stock and the amount of U.S. federal income tax, if any, withheld with respect to thosepayments. Copies of the information returns reporting such dividends and any withholding may also bemade available to the tax authorities in the country in which the Non-U.S. Holder resides under theprovisions of a treaty or agreement.
The gross proceeds from sales or other dispositions of our common stock may be subject, incertain circumstances discussed below, to U.S. backup withholding and information reporting. If aNon-U.S. Holder sells or otherwise disposes of our common stock outside the United States through anon-U.S. office of a non-U.S. broker and the sale or disposition proceeds are paid to the Non-U.S.Holder outside the United States, then the U.S. backup withholding and information reportingrequirements generally will not apply to that payment. However, U.S. information reporting, but notU.S. backup withholding, will apply to a payment of sale or disposition proceeds, even if that paymentis made outside the United States, if a Non-U.S. Holder sells our common stock through a non-U.S.office of a broker that is a United States person or has certain enumerated connections with theUnited States, unless the broker has documentary evidence in its files that the Non-U.S. Holder is nota United States person and certain other conditions are met or the Non-U.S. Holder otherwisequalifies for an exemption.
If a Non-U.S. Holder receives payments of the proceeds of sales or other dispositions of ourcommon stock to or through a U.S. office of a broker, the payment will be subject to both U.S. backupwithholding and information reporting unless the Non-U.S. Holder provides to the applicablewithholding agent a properly executed IRS Form W-8BEN or W-8BEN-E (or other applicable form)certifying under penalties of perjury that the Non-U.S. Holder is not a United States person and theapplicable withholding agent does not have actual knowledge or reason to know that such holder is aUnited States person, or otherwise qualifies for an exemption. Backup withholding is not an additionaltax. Any amounts withheld under the backup withholding rules may be credited against the Non-U.S.Holder’s U.S. federal income tax liability (which may result in the Non-U.S. Holder being entitled to arefund), provided that the required information is timely furnished to the IRS.
205

FATCA Withholding
The Foreign Account Tax Compliance Act and related Treasury guidance (commonly referred to as‘‘FATCA’’) impose U.S. federal withholding tax at a rate of 30% on payments to certain foreign entitiesof (i) U.S.-source dividends (including dividends paid on our common stock) and (ii) the grossproceeds from the sale or other disposition after December 31, 2018 of property that produces U.S.-source dividends (including sales or other dispositions of our common stock). This withholding taxapplies to a ‘‘foreign financial institution’’ or a ‘‘non-financial foreign entity’’ (each as defined in theCode), whether acting as a beneficial owner or an intermediary, unless such foreign entity complieswith (i) certain information reporting requirements regarding its U.S. account holders and its U.S.owners and (ii) certain withholding obligations regarding certain payments to its account holders andcertain other persons. Foreign financial institutions located in jurisdictions that have anintergovernmental agreement with the United States governing FATCA may be subject to differentrules. Accordingly, the entity through which a Non-U.S. Holder holds its common stock will affect thedetermination of whether such withholding is required. Non-U.S. Holders are encouraged to consulttheir tax advisors regarding FATCA.
206
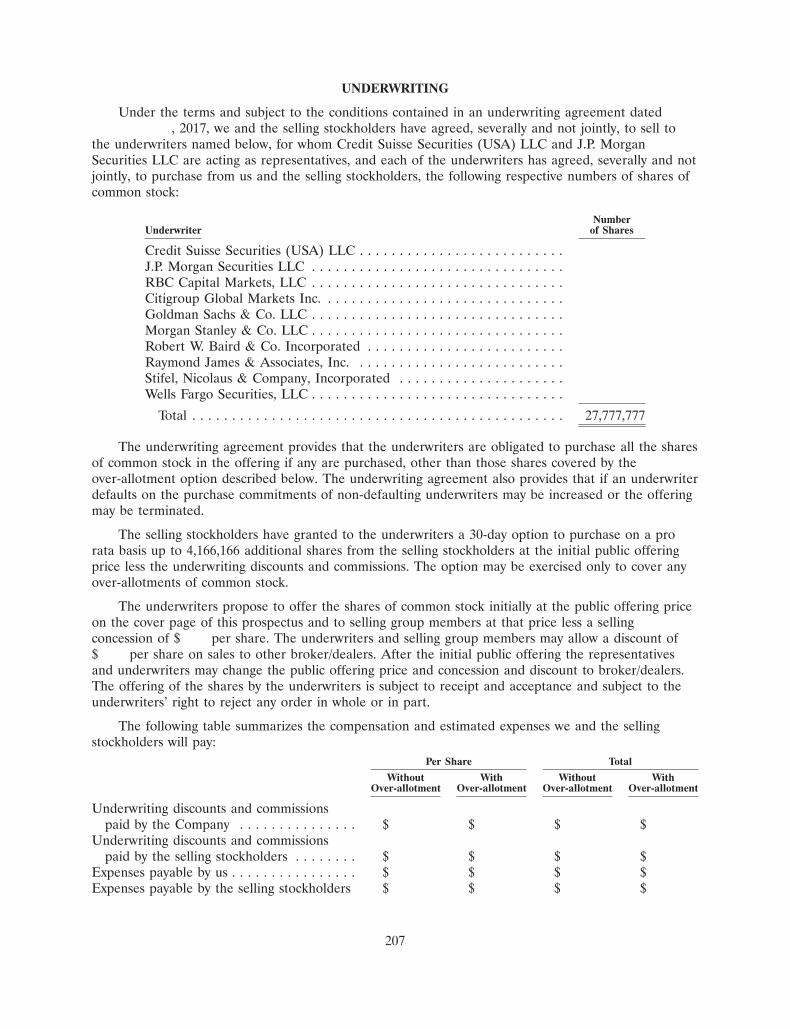
UNDERWRITING
Under the terms and subject to the conditions contained in an underwriting agreement dated, 2017, we and the selling stockholders have agreed, severally and not jointly, to sell to
the underwriters named below, for whom Credit Suisse Securities (USA) LLC and J.P. MorganSecurities LLC are acting as representatives, and each of the underwriters has agreed, severally and notjointly, to purchase from us and the selling stockholders, the following respective numbers of shares ofcommon stock:
NumberUnderwriter of Shares
Credit Suisse Securities (USA) LLC . . . . . . . . . . . . . . . . . . . . . . . . . .J.P. Morgan Securities LLC . . . . . . . . . . . . . . . . . . . . . . . . . . . . . . . .RBC Capital Markets, LLC . . . . . . . . . . . . . . . . . . . . . . . . . . . . . . . .Citigroup Global Markets Inc. . . . . . . . . . . . . . . . . . . . . . . . . . . . . . .Goldman Sachs & Co. LLC . . . . . . . . . . . . . . . . . . . . . . . . . . . . . . . .Morgan Stanley & Co. LLC . . . . . . . . . . . . . . . . . . . . . . . . . . . . . . . .Robert W. Baird & Co. Incorporated . . . . . . . . . . . . . . . . . . . . . . . . .Raymond James & Associates, Inc. . . . . . . . . . . . . . . . . . . . . . . . . . .Stifel, Nicolaus & Company, Incorporated . . . . . . . . . . . . . . . . . . . . .Wells Fargo Securities, LLC . . . . . . . . . . . . . . . . . . . . . . . . . . . . . . . .
Total . . . . . . . . . . . . . . . . . . . . . . . . . . . . . . . . . . . . . . . . . . . . . . . 27,777,777
The underwriting agreement provides that the underwriters are obligated to purchase all the sharesof common stock in the offering if any are purchased, other than those shares covered by theover-allotment option described below. The underwriting agreement also provides that if an underwriterdefaults on the purchase commitments of non-defaulting underwriters may be increased or the offeringmay be terminated.
The selling stockholders have granted to the underwriters a 30-day option to purchase on a prorata basis up to 4,166,166 additional shares from the selling stockholders at the initial public offeringprice less the underwriting discounts and commissions. The option may be exercised only to cover anyover-allotments of common stock.
The underwriters propose to offer the shares of common stock initially at the public offering priceon the cover page of this prospectus and to selling group members at that price less a sellingconcession of $ per share. The underwriters and selling group members may allow a discount of$ per share on sales to other broker/dealers. After the initial public offering the representativesand underwriters may change the public offering price and concession and discount to broker/dealers.The offering of the shares by the underwriters is subject to receipt and acceptance and subject to theunderwriters’ right to reject any order in whole or in part.
The following table summarizes the compensation and estimated expenses we and the sellingstockholders will pay:
Per Share Total
Without With Without WithOver-allotment Over-allotment Over-allotment Over-allotment
Underwriting discounts and commissionspaid by the Company . . . . . . . . . . . . . . . $ $ $ $
Underwriting discounts and commissionspaid by the selling stockholders . . . . . . . . $ $ $ $
Expenses payable by us . . . . . . . . . . . . . . . . $ $ $ $Expenses payable by the selling stockholders $ $ $ $
207

The expenses of this offering that have been paid or are payable by us are estimated to beapproximately $5.6 million (excluding underwriting discounts and commissions). We have agreed to payexpenses incurred by the selling stockholders in connection with this offering, other than theunderwriting discounts and commissions. We have also agreed to reimburse the underwriters for certainof their expenses in an amount up to $50,000. In addition, the underwriters have agreed to reimburseus for certain expenses related to the offering.
In connection with this offering, we, our directors and executive officers and stockholders currentlyrepresenting approximately 98%% of the shares of our common stock outstanding prior to this offeringwill agree with the underwriters to enter into lock-up agreements, pursuant to which shares of ourcommon stock outstanding after this offering will be restricted from immediate resale in accordancewith the terms of such lock-up agreements without the prior written consent of Credit Suisse Securities(USA) LLC and J.P. Morgan Securities LLC. Under these agreements, subject to limited exceptions,neither we nor any of our directors or executive officers or these stockholders may dispose of, hedge orotherwise transfer the economic consequences of ownership of any shares of common stock orsecurities convertible into or exchangeable or exercisable for shares of common stock. Theserestrictions will be in effect for a period of 180 days after the date of this prospectus. Certain transfersor dispositions can be made sooner, provided the transferee becomes bound to the terms of thelock-up.
The underwriters have reserved for sale at the initial public offering price up to 694,444 shares ofthe common stock for directors, officers and certain employees who have expressed an interest inpurchasing common stock in the offering. We will offer these shares to the extent permitted underapplicable regulations in the United States and in various countries. Pursuant to the underwritingagreement, the sales will be made by Credit Suisse Securities (USA) LLC through a directed shareprogram. The number of shares available for sale to the general public in the offering will be reducedto the extent these persons purchase the reserved shares. Any reserved shares not so purchased will beoffered by the underwriters to the general public on the same terms as the other shares. We haveagreed to indemnify Credit Suisse Securities (USA) LLC in connection with the directed shareprogram, including for the failure of any participant to pay for its shares. Other than the underwritingdiscount described on the front cover of this prospectus, the underwriters will not be entitled to anycommission with respect to shares of common stock sold pursuant to the directed share program.
We and the selling stockholders have agreed, severally and not jointly, to indemnify theunderwriters against liabilities under the Securities Act, or contribute to payments that the underwritersmay be required to make in that respect.
We have applied to list the shares of common stock on NYSE, under the symbol ‘‘AQUA.’’
Prior to this offering, there has been no public market for our common stock. The initial publicoffering price will be determined by negotiations among us and the representatives and will notnecessarily reflect the market price of the common stock following this offering. The principal factorsthat will be considered in determining the initial public offering price include:
• the information presented in this prospectus and otherwise available to the underwriters;
• the history of, and prospects for, the industry in which we compete;
• the ability of our management;
• the prospects for our future earnings;
• the present state of our results of operations and our current financial condition;
• the general condition of the securities markets at the time of this offering; and
208

• the recent market prices of, and the demand for, publicly traded common stock of generallycomparable companies.
We cannot assure you that the initial public offering price will correspond to the price at which thecommon stock will trade in the public market subsequent to this offering or that an active tradingmarket for the common stock will develop and continue after this offering.
In connection with the offering the underwriters may engage in stabilizing transactions,over-allotment transactions, syndicate covering transactions, penalty bids and passive market making inaccordance with Regulation M under the Exchange Act.
• Stabilizing transactions permit bids to purchase the underlying security so long as the stabilizingbids do not exceed a specified maximum.
• Over-allotment involves sales by the underwriters of shares in excess of the number of shares theunderwriters are obligated to purchase, which creates a syndicate short position. The shortposition may be either a covered short position or a naked short position. In a covered shortposition, the number of shares over-allotted by the underwriters is not greater than the numberof shares that they may purchase in the over-allotment option. In a naked short position, thenumber of shares involved is greater than the number of shares in the over-allotment option.The underwriters may close out any covered short position by either exercising theirover-allotment option and/or purchasing shares in the open market.
• Syndicate covering transactions involve purchases of the common stock in the open market afterthe distribution has been completed in order to cover syndicate short positions. In determiningthe source of shares to close out the short position, the underwriters will consider, among otherthings, the price of shares available for purchase in the open market as compared to the price atwhich they may purchase shares through the over-allotment option. If the underwriters sell moreshares than could be covered by the over-allotment option, a naked short position, the positioncan only be closed out by buying shares in the open market. A naked short position is morelikely to be created if the underwriters are concerned that there could be downward pressure onthe price of the shares in the open market after pricing that could adversely affect investors whopurchase in the offering.
• Penalty bids permit the representatives to reclaim a selling concession from a syndicate memberwhen the common stock originally sold by the syndicate member is purchased in a stabilizing orsyndicate covering transaction to cover syndicate short positions.
• In passive market making, market makers in the common stock who are underwriters orprospective underwriters may, subject to limitations, make bids for or purchases of our commonstock until the time, if any, at which a stabilizing bid is made.
These stabilizing transactions, syndicate covering transactions and penalty bids may have the effectof raising or maintaining the market price of our common stock or preventing or retarding a decline inthe market price of the common stock. As a result the price of our common stock may be higher thanthe price that might otherwise exist in the open market. These transactions may be effected on theNYSE or otherwise and, if commenced, may be discontinued at any time.
A prospectus in electronic format will be made available on the web sites maintained by one ormore of the underwriters, or selling group members, if any, participating in this offering and one ormore of the underwriters participating in this offering may distribute prospectuses electronically. Therepresentatives may agree to allocate a number of shares to underwriters and selling group membersfor sale to their online brokerage account holders. Internet distributions will be allocated by theunderwriters and selling group members that will make internet distributions on the same basis as otherallocations.
209

Other Relationships
The underwriters and their respective affiliates are full service financial institutions engaged invarious activities, which may include securities trading, commercial and investment banking, financialadvisory, investment management, investment research, principal investment, hedging, financing andbrokerage activities. Certain of the underwriters and their respective affiliates have, from time to time,performed, and may in the future perform, various financial advisory and investment banking servicesfor us, for which they received or will receive customary fees and expenses. In addition, in the ordinarycourse of their business activities, the underwriters and their respective affiliates may make or hold abroad array of investments and actively trade debt and equity securities (or related derivative securities)and financial instruments (including bank loans) for their own account and for the accounts of theircustomers. These investments and securities activities may involve securities and/or instruments of oursor our affiliates. The underwriters and their affiliates may also make investment recommendationsand/or publish or express independent research views in respect of such securities or financialinstruments and may hold, or recommend to clients that they acquire, long and/or short positions insuch securities and instruments. These investment recommendations/and or research and securitiesactivities may involve securities and/or instruments of ours or our affiliates. In addition, under ourSenior Secured Credit Facilities, Credit Suisse Securities (USA) LLC, Goldman Sachs & Co. LLC,RBC Capital Markets, LLC and/or certain of their respective affiliates act as agents, lenders and jointlead arrangers and joint bookrunners. Furthermore, Credit Suisse Securities (USA) LLC, and/or certainof its affiliates may receive a portion of the net proceeds received by us in this offering due to the useof proceeds from this offering being used to repay borrowings under the Term Loan Facility.
Notice to Canadian Residents
Resale Restrictions
The distribution of our common stock in Canada is being made only in the provinces of Ontario,Quebec, Alberta and British Columbia on a private placement basis exempt from the requirement thatwe prepare and file a prospectus with the securities regulatory authorities in each province wheretrades of these securities are made. Any resale of our common stock in Canada must be made underapplicable securities laws which may vary depending on the relevant jurisdiction, and which may requireresales to be made under available statutory exemptions or under a discretionary exemption granted bythe applicable Canadian securities regulatory authority. Purchasers are advised to seek legal adviceprior to any resale of the securities.
Representations of Canadian Purchasers
By purchasing our common stock in Canada and accepting delivery of a purchase confirmation, apurchaser is representing to us and the dealer from whom the purchase confirmation is received that:
• the purchaser is entitled under applicable provincial securities laws to purchase our commonstock without the benefit of a prospectus qualified under those securities laws as it is an‘‘accredited investor’’ as defined under National Instrument 45-106—Prospectus Exemptions,
• the purchaser is a ‘‘permitted client’’ as defined in National Instrument 31-103—RegistrationRequirements, Exemptions and Ongoing Registrant Obligations,
• where required by law, the purchaser is purchasing as principal and not as agent, and
• the purchaser has reviewed the text above under Resale Restrictions.
210

Conflicts of Interest
Canadian purchasers are hereby notified that the underwriters are relying on the exemption set outin section 3A.3 or 3A.4, if applicable, of National Instrument 33-105—Underwriting Conflicts fromhaving to provide certain conflict of interest disclosure in this document.
Statutory Rights of Action
Securities legislation in certain provinces or territories of Canada may provide a purchaser withremedies for rescission or damages if the offering memorandum (including any amendment thereto)such as this document contains a misrepresentation, provided that the remedies for rescission ordamages are exercised by the purchaser within the time limit prescribed by the securities legislation ofthe purchaser’s province or territory. The purchaser of these securities in Canada should refer to anyapplicable provisions of the securities legislation of the purchaser’s province or territory for particularsof these rights or consult with a legal advisor.
Enforcement of Legal Rights
All of our directors and officers as well as the experts named herein may be located outside ofCanada and, as a result, it may not be possible for Canadian purchasers to effect service of processwithin Canada upon us or those persons. All or a substantial portion of our assets and the assets ofthose persons may be located outside of Canada and, as a result, it may not be possible to satisfy ajudgment against us or those persons in Canada or to enforce a judgment obtained in Canadian courtsagainst us or those persons outside of Canada.
Taxation and Eligibility for Investment
Canadian purchasers of our common stock should consult their own legal and tax advisors withrespect to the tax consequences of an investment in our common stock in their particular circumstancesand about the eligibility of our common stock for investment by the purchaser under relevant Canadianlegislation.
Notice to Prospective Investors in the United Kingdom
This document is only being distributed to and is only directed at (i) persons who are outside theUnited Kingdom or (ii) investment professionals falling within Article 19(5) of the Financial Servicesand Markets Act 2000 (Financial Promotion) Order 2005 (the ‘‘Order’’) or (iii) high net worth entities,and other persons to whom it may lawfully be communicated, falling with Article 49(2)(a) to (d) of theOrder (all such persons together being referred to as ‘‘relevant persons’’). The securities are onlyavailable to, and any invitation, offer or agreement to subscribe, purchase or otherwise acquire suchsecurities will be engaged in only with, relevant persons. Any person who is not a relevant personshould not act or rely on this document or any of its contents.
Notice to Prospective Investors in the European Economic Area
In relation to each Member State of the European Economic Area which has implemented theProspectus Directive (each, a ‘‘Relevant Member State’’), each underwriter has represented and agreedthat with effect from and including the date on which the Prospectus Directive is implemented in thatRelevant Member State it has not made and will not make an offer of common stock which are thesubject of the offering contemplated by this prospectus to the public in that Relevant Member Stateother than:
• to any legal entity which is a ‘‘qualified investor’’ as defined in the Prospectus Directive;
211
• to fewer than 150 natural or legal persons (other than ‘‘qualified investors’’ as defined in theProspectus Directive), per Relevant Member State, subject to obtaining the prior consent of theunderwriters; or
• in any other circumstances falling within Article 3(2) of the Prospectus Directive,
provided that no such offer of common stock shall result in a requirement for us or any underwriter topublish a prospectus pursuant to Article 3 of the Prospectus Directive or a supplemental prospectuspursuant to Article 16 of the Prospectus Directive.
For the purposes of this provision, the expression an ‘‘offer of common stock to the public’’ inrelation to any common stock in any Relevant Member State means the communication in any formand by any means of sufficient information on the terms of the offer and the common stock to beoffered so as to enable an investor to decide to purchase or subscribe for the common stock, as thesame may be varied in that Relevant Member State by any measure implementing the ProspectusDirective in that Relevant Member State. The expression ‘‘Prospectus Directive’’ meansDirective 2003/71/EC (as amended, including by Directive 2010/73/EU), and includes any relevantimplementing measure in the Relevant Member State.
Notice to Prospective Investors in Hong Kong
The shares have not been offered or sold and will not be offered or sold in Hong Kong, by meansof any document, other than (a) to ‘‘professional investors’’ as defined in the Securities and FuturesOrdinance (Cap. 571) of Hong Kong and any rules made under that Ordinance; or (b) in othercircumstances which do not result in the document being a ‘‘prospectus’’ as defined in the CompaniesOrdinance (Cap. 32) of Hong Kong or which do not constitute an offer to the public within themeaning of that Ordinance. No advertisement, invitation or document relating to the shares has beenor may be issued or has been or may be in the possession of any person for the purposes of issue,whether in Hong Kong or elsewhere, which is directed at, or the contents of which are likely to beaccessed or read by, the public of Hong Kong (except if permitted to do so under the securities laws ofHong Kong) other than with respect to shares which are or are intended to be disposed of only topersons outside Hong Kong or only to ‘‘professional investors’’ as defined in the Securities and FuturesOrdinance (Cap. 571) of Hong Kong and any rules made under that Ordinance.
Notice to Prospective Investors in Japan
The shares have not been and will not be registered under the Financial Instruments andExchange Law of Japan (Law No. 25 of 1948, as amended) and, accordingly, will not be offered orsold, directly or indirectly, in Japan, or for the benefit of any Japanese Person or to others forre-offering or resale, directly or indirectly, in Japan or to any Japanese Person, except in compliancewith all applicable laws, regulations and ministerial guidelines promulgated by relevant Japanesegovernmental or regulatory authorities in effect at the relevant time. For the purposes of thisparagraph, ‘‘Japanese Person’’ shall mean any person resident in Japan, including any corporation orother entity organized under the laws of Japan.
Notice to Prospective Investors in Singapore
This prospectus has not been registered as a prospectus with the Monetary Authority of Singapore.Accordingly, this prospectus and any other document or material in connection with the offer or sale,or invitation for subscription or purchase, of the shares may not be circulated or distributed, nor maythe shares be offered or sold, or be made the subject of an invitation for subscription or purchase,whether directly or indirectly, to persons in Singapore other than (i) to an institutional investor underSection 274 of the Securities and Futures Act, Chapter 289 of Singapore (the ‘‘SFA’’), (ii) to a relevantperson pursuant to Section 275(1), or any person pursuant to Section 275(1A), and in accordance with
212

the conditions specified in Section 275, of the SFA, or (iii) otherwise pursuant to, and in accordancewith the conditions of, any other applicable provision of the SFA.
Where the shares are subscribed or purchased under Section 275 of the SFA by a relevant personwhich is:
(a) a corporation (which is not an accredited investor (as defined in Section 4A of the SFA)) thesole business of which is to hold investments and the entire share capital of which is owned byone or more individuals, each of whom is an accredited investor; or
(b) a trust (where the trustee is not an accredited investor) whose sole purpose is to holdinvestments and each beneficiary of the trust is an individual who is an accredited investor,
securities (as defined in Section 239(1) of the SFA) of that corporation or the beneficiaries’ rights andinterest (howsoever described) in that trust shall not be transferred within six months after thatcorporation or that trust has acquired the shares pursuant to an offer made under Section 275 of theSFA except:
(a) to an institutional investor or to a relevant person defined in Section 275(2) of the SFA, or toany person arising from an offer referred to in Section 275(1A) or Section 276(4)(i)(B) of theSFA;
(b) where no consideration is or will be given for the transfer;
(c) where the transfer is by operation of law;
(d) as specified in Section 276(7) of the SFA; or
(e) as specified in Regulation 32 of the Securities and Futures (Offers of Investments) (Sharesand Debentures) Regulations 2005 of Singapore.
Notice to Prospective Investors in Switzerland
This document is not intended to constitute an offer or solicitation to purchase or invest in thesecurities described herein. The securities may not be publicly offered, sold or advertised, directly orindirectly, in, into or from Switzerland and will not be listed on the SIX Swiss Exchange or on anyother exchange or regulated trading facility in Switzerland. Neither this document nor any otheroffering or marketing material relating to the securities constitutes a prospectus as such term isunderstood pursuant to article 652a or article 1156 of the Swiss Code of Obligations or a listingprospectus within the meaning of the listing rules of the SIX Swiss Exchange or any other regulatedtrading facility in Switzerland, and neither this document nor any other offering or marketing materialrelating to the securities may be publicly distributed or otherwise made publicly available inSwitzerland.
Neither this document nor any other offering or marketing material relating to the offering, northe Company nor the securities have been or will be filed with or approved by any Swiss regulatoryauthority. The securities are not subject to the supervision by any Swiss regulatory authority, e.g., theSwiss Financial Markets Supervisory Authority FINMA (FINMA), and investors in the securities willnot benefit from protection or supervision by such authority.
213
LEGAL MATTERS
The validity of the shares of common stock offered hereby will be passed upon for us and theselling stockholders by Fried, Frank, Harris, Shriver & Jacobson LLP, New York, New York. Fried,Frank, Harris, Shriver & Jacobson LLP owns an indirect interest in less than 1% of our common stockthrough limited partnership interests in funds associated with AEA. Legal matters in connection withthis offering will be passed upon for the underwriters by Latham & Watkins LLP, New York, New York.
EXPERTS
The consolidated financial statements of Evoqua Water Technologies Corp. at September 30, 2015and 2016, and for the period from January 15, 2014 through September 30, 2014 and the years endedSeptember 30, 2015 and 2016 and the consolidated financial statements of Siemens Water Technologiesfor the period October 1, 2013 through January 15, 2014, appearing in this prospectus and registrationstatement have been audited by Ernst & Young LLP, independent registered public accounting firm, asset forth in their report thereon appearing elsewhere herein, and are included in reliance upon suchreport given on the authority of such firm as experts in accounting and auditing.
The consolidated financial statements of NB Intermediate Holdings, LLC and Subsidiaries as ofDecember 31, 2015 and for the year ended December 31, 2015 have been audited by RSM US LLP,independent auditor, as stated in their report thereon, and have been included in this prospectus andregistration statement in reliance upon such report and upon the authority of such firm as experts inaccounting and auditing.
WHERE YOU CAN FIND MORE INFORMATION
We have filed with the SEC a registration statement on Form S-1, including exhibits and schedules,under the Securities Act with respect to the common stock to be sold in this offering. As allowed bySEC rules, this prospectus, which constitutes a part of the registration statement, does not contain allof the information set forth in the registration statement or the exhibits and schedules that are part ofthe registration statement. For further information about us and our common stock, you should refer tothe registration statement, including all amendments, supplements, schedules and exhibits thereto.
Statements contained in this prospectus regarding the contents of any contract or any otherdocument that is filed as an exhibit to the registration statement are not necessarily complete, and eachsuch statement is qualified in all respects by reference to the full text of such contract or otherdocument filed as an exhibit to the registration statement.
You may read, without charge, and copy, at prescribed rates, all or any portion of the registrationstatement or any reports, statements or other information we file with or furnish to the SEC at theSEC’s Public Reference Room at 100 F Street, N.E., Washington, DC 20549. You may also obtaincopies of the documents at prescribed rates by writing to the Public Reference Section of the SEC.Please call the SEC at 1-800-SEC-0330 to obtain information on the operation of the Public ReferenceRoom. In addition, the SEC maintains an internet site that contains reports, proxy and informationstatements and other information regarding issuers that file electronically with the SEC. You can reviewthe registration statement, as well as our future SEC filings, by accessing the SEC’s website atwww.sec.gov. You may also request copies of those documents, at no cost to you, by contacting us atthe following address:
Evoqua Water Technologies Corp.210 Sixth Avenue
Pittsburgh, Pennsylvania 15222(724) 772-0044
As a result of this offering, we will become subject to the information and reporting requirementsof the Exchange Act and will file annual, quarterly and current reports, proxy statements and otherinformation with the SEC. You can request copies of these documents, for a copying fee, by writing tothe SEC. We intend to furnish our stockholders with annual reports containing financial statementsaudited by our independent registered public accounting firm.
214

INDEX TO CONSOLIDATED FINANCIAL STATEMENTS
EWT Holdings I Corp.
Consolidated Financial Statements
Report of Independent Registered Public Accounting Firm . . . . . . . . . . . . . . . . . . . . . . . . . . . F-3
Consolidated Balance Sheets as of September 30, 2015 and September 30, 2016 . . . . . . . . . . . . F-4
Consolidated Statements of Operations for the Years Ended September 30, 2014,September 30, 2015 and September 30, 2016 . . . . . . . . . . . . . . . . . . . . . . . . . . . . . . . . . . . . F-5
Consolidated Statements of Comprehensive Income (Loss) for the Years Ended September 30,2014, September 30, 2015 and September 30, 2016 . . . . . . . . . . . . . . . . . . . . . . . . . . . . . . . F-6
Consolidated Statements of Changes in Equity for the Years Ended September 30, 2014,September 30, 2015 and September 30, 2016 . . . . . . . . . . . . . . . . . . . . . . . . . . . . . . . . . . . . F-7
Consolidated Statements of Changes in Cash Flow for the Years Ended September 30, 2014,September 30, 2015 and September 30, 2016 . . . . . . . . . . . . . . . . . . . . . . . . . . . . . . . . . . . . F-8
Supplemental Disclosure of Cash Flow Information for the Years Ended September 30, 2014,September 30, 2015 and September 30, 2016 . . . . . . . . . . . . . . . . . . . . . . . . . . . . . . . . . . . . F-9
Notes to Audited Consolidated Financial Statements . . . . . . . . . . . . . . . . . . . . . . . . . . . . . . . F-10
Schedule I Parent Company Financial Information . . . . . . . . . . . . . . . . . . . . . . . . . . . . . . . . . F-52
Interim Consolidated Financial Statements (Unaudited)
Condensed Consolidated Balance Sheets as of September 30, 2016 and June 30, 2017(unaudited) . . . . . . . . . . . . . . . . . . . . . . . . . . . . . . . . . . . . . . . . . . . . . . . . . . . . . . . . . . . . F-56
Condensed Consolidated Statements of Operations for the Nine Months Ended June 30, 2016and 2017 (unaudited) . . . . . . . . . . . . . . . . . . . . . . . . . . . . . . . . . . . . . . . . . . . . . . . . . . . . F-57
Condensed Consolidated Statements of Comprehensive Income (Loss) for the Nine MonthsEnded June 30, 2016 and 2017 (unaudited) . . . . . . . . . . . . . . . . . . . . . . . . . . . . . . . . . . . . . F-58
Condensed Consolidated Statements of Changes in Equity for the Nine Months EndedJune 30, 2016 and 2017 (unaudited) . . . . . . . . . . . . . . . . . . . . . . . . . . . . . . . . . . . . . . . . . . F-59
Condensed Consolidated Statements of Cash Flows for the Nine Months Ended June 30, 2016and 2017 (unaudited) . . . . . . . . . . . . . . . . . . . . . . . . . . . . . . . . . . . . . . . . . . . . . . . . . . . . F-60
Supplemental Disclosure of Cash Flow Information for the Nine Months Ended June 30, 2016and 2017 (unaudited) . . . . . . . . . . . . . . . . . . . . . . . . . . . . . . . . . . . . . . . . . . . . . . . . . . . . F-61
Notes to Unaudited Condensed Consolidated Financial Statements . . . . . . . . . . . . . . . . . . . . . F-62
NB Intermediate Holdings, LLC and Subsidiaries
Consolidated Financial Statements
Report of Independent Auditor . . . . . . . . . . . . . . . . . . . . . . . . . . . . . . . . . . . . . . . . . . . . . . . F-87
Consolidated Balance Sheet as of December 31, 2015 . . . . . . . . . . . . . . . . . . . . . . . . . . . . . . . F-88
Consolidated Statement of Income for the Year Ended December 31, 2015 . . . . . . . . . . . . . . . F-89
Consolidated Statement of Member’s Equity for the Year Ended December 31, 2015 . . . . . . . . F-90
F-1

Consolidated Statement of Cash Flows for the Year Ended December 31, 2015 . . . . . . . . . . . . F-91
Notes to Consolidated Financial Statements . . . . . . . . . . . . . . . . . . . . . . . . . . . . . . . . . . . . . . F-92
Interim Consolidated Financial Statements (Unaudited)
Consolidated Balance Sheets as of March 31, 2016 (unaudited) and December 31, 2015 . . . . . . F-109
Consolidated Statements of Net Loss for the Three Months Ended March 31, 2015 and 2016(unaudited) . . . . . . . . . . . . . . . . . . . . . . . . . . . . . . . . . . . . . . . . . . . . . . . . . . . . . . . . . . . . F-110
Consolidated Statements of Member’s Equity for the Three Months Ended March 31, 2016(unaudited) . . . . . . . . . . . . . . . . . . . . . . . . . . . . . . . . . . . . . . . . . . . . . . . . . . . . . . . . . . . . F-111
Consolidated Statements of Cash Flows for the Three Months Ended March 31, 2015 and 2016(unaudited) . . . . . . . . . . . . . . . . . . . . . . . . . . . . . . . . . . . . . . . . . . . . . . . . . . . . . . . . . . . . F-112
Notes to Unaudited Consolidated Financial Statements . . . . . . . . . . . . . . . . . . . . . . . . . . . . . F-114
F-2
Report of Independent Registered Public Accounting Firm
The Board of Directors and Shareholders ofEWT Holdings I Corp.
We have audited the accompanying consolidated balance sheets of EWT Holdings I Corp. as ofSeptember 30, 2015 and 2016, and the related combined statements of operations, comprehensiveincome (loss), changes in equity and changes in cash flows of Siemens Water Technologies for theperiod from October 1, 2013 to January 15, 2014 (Predecessor Company) and the consolidatedstatement of operations, comprehensive income (loss), changes in equity and changes in cash flows forthe period from January 16, 2014 to September 30, 2014 (Successor Company) and the years endedSeptember 30, 2015 and 2016. Our audits also included the financial statement schedule listed in theIndex to the consolidated financial statements. These financial statements and schedule are theresponsibility of the Company’s management. Our responsibility is to express an opinion on thesefinancial statements and schedule based on our audits.
We conducted our audits in accordance with the standards of the Public Company AccountingOversight Board (United States). Those standards require that we plan and perform the audit to obtainreasonable assurance about whether the financial statements are free of material misstatement. Wewere not engaged to perform an audit of the Company’s internal control over financial reporting. Ouraudits included consideration of internal control over financial reporting as a basis for designing auditprocedures that are appropriate in the circumstances, but not for the purpose of expressing an opinionon the effectiveness of the Company’s internal control over financial reporting. Accordingly, we expressno such opinion. An audit also includes examining, on a test basis, evidence supporting the amountsand disclosures in the consolidated financial statements, assessing the accounting principles used andsignificant estimates made by management, and evaluating the overall financial statement presentation.We believe that our audits provide a reasonable basis for our opinion.
In our opinion, the financial statements referred to above present fairly, in all material respects,the consolidated financial position of EWT Holdings I Corp. at September 30, 2015 and 2016, and thecombined results of Siemens Water Technologies operations and cash flows for the period fromOctober 1, 2013 to January 15, 2014 (Predecessor Company) and the consolidated results of itsoperations and cash flows for the period from January 16, 2014 to September 30, 2014 (SuccessorCompany) and the years ended September 30, 2015 and 2016 in conformity with U.S. generallyaccepted accounting principles. Also, in our opinion, the related financial statement schedule, whenconsidered in relation to the basic financial statements taken as a whole, presents fairly in all materialrespects the information set forth therein.
/s/ Ernst & Young LLP
Pittsburgh, Pennsylvania
August 28, 2017, except for note 23as to which the date isOctober 16, 2017
F-3

EWT Holdings I Corp.
Consolidated Balance Sheets
(in thousands)
September 30, 2015 September 30, 2016
ASSETSCurrent assets . . . . . . . . . . . . . . . . . . . . . . . . . . . . . . . . . . . . . . . . . $ 481,473 $ 418,336
Cash and cash equivalents . . . . . . . . . . . . . . . . . . . . . . . . . . . . . . . . 169,027 50,362Receivables, net . . . . . . . . . . . . . . . . . . . . . . . . . . . . . . . . . . . . . . . 160,491 184,789Inventories, net . . . . . . . . . . . . . . . . . . . . . . . . . . . . . . . . . . . . . . . 92,611 112,392Cost and earnings in excess of billings on uncompleted contracts . . . . . 34,823 50,081Prepaid and other current assets . . . . . . . . . . . . . . . . . . . . . . . . . . . 13,797 16,255Deferred income taxes . . . . . . . . . . . . . . . . . . . . . . . . . . . . . . . . . . 1,887 —Income tax receivable . . . . . . . . . . . . . . . . . . . . . . . . . . . . . . . . . . . 8,837 4,457
Property, plant, and equipment, net . . . . . . . . . . . . . . . . . . . . . . . . . . . 235,828 256,765
Investment in affiliate . . . . . . . . . . . . . . . . . . . . . . . . . . . . . . . . . . . . 6,873 —
Goodwill . . . . . . . . . . . . . . . . . . . . . . . . . . . . . . . . . . . . . . . . . . . . . 113,583 267,643
Intangible assets, net . . . . . . . . . . . . . . . . . . . . . . . . . . . . . . . . . . . . . 180,137 323,478
Deferred income taxes . . . . . . . . . . . . . . . . . . . . . . . . . . . . . . . . . . . . 7 —
Other non-current assets . . . . . . . . . . . . . . . . . . . . . . . . . . . . . . . . . . 21,970 30,009
Total assets . . . . . . . . . . . . . . . . . . . . . . . . . . . . . . . . . . . . . . . . . . . $1,039,871 $1,296,231
LIABILITIES AND EQUITYCurrent liabilities . . . . . . . . . . . . . . . . . . . . . . . . . . . . . . . . . . . . . . . $ 249,359 $ 284,862
Accounts payable . . . . . . . . . . . . . . . . . . . . . . . . . . . . . . . . . . . . . . 78,305 102,379Current portion of debt . . . . . . . . . . . . . . . . . . . . . . . . . . . . . . . . . 5,050 30,024Billings in excess of costs incurred . . . . . . . . . . . . . . . . . . . . . . . . . . 35,616 22,175Product warranties . . . . . . . . . . . . . . . . . . . . . . . . . . . . . . . . . . . . . 23,005 16,860Accrued expenses and other liabilities . . . . . . . . . . . . . . . . . . . . . . . . 100,815 111,307Income tax payable . . . . . . . . . . . . . . . . . . . . . . . . . . . . . . . . . . . . 4,833 2,117Deferred income taxes . . . . . . . . . . . . . . . . . . . . . . . . . . . . . . . . . . 1,735 —
Non-current liabilities . . . . . . . . . . . . . . . . . . . . . . . . . . . . . . . . . . . . 616,152 807,434
Long-term debt . . . . . . . . . . . . . . . . . . . . . . . . . . . . . . . . . . . . . . . 547,032 728,132Product warranties . . . . . . . . . . . . . . . . . . . . . . . . . . . . . . . . . . . . . 8,753 6,449Other non-current liabilities . . . . . . . . . . . . . . . . . . . . . . . . . . . . . . 56,640 64,290Deferred income taxes . . . . . . . . . . . . . . . . . . . . . . . . . . . . . . . . . . 3,727 8,563
Total liabilities . . . . . . . . . . . . . . . . . . . . . . . . . . . . . . . . . . . . . . . . . 865,511 1,092,296
Commitments and Contingent Liabilities (Note 19) . . . . . . . . . . . . . . . . — —
Shareholders’ equityCommon stock, par value $0.01: authorized 1,000,000 shares; issued
101,849 shares, outstanding 101,742 at September 30, 2015; issued104,495 shares, outstanding 104,250 shares at September 30, 2016 . . . 1,018 1,045
Treasury stock: 107 shares at September 30, 2015 and 245 shares atSeptember 30, 2016 . . . . . . . . . . . . . . . . . . . . . . . . . . . . . . . . . . . (410) (1,133)
Additional paid-in capital . . . . . . . . . . . . . . . . . . . . . . . . . . . . . . . . 362,073 381,223Retained deficit . . . . . . . . . . . . . . . . . . . . . . . . . . . . . . . . . . . . . . . (183,808) (172,169)Accumulated other comprehensive loss, net of tax . . . . . . . . . . . . . . . (4,513) (10,671)
Total EWT Holdings I Corp. equity . . . . . . . . . . . . . . . . . . . . . . . . . . . 174,360 198,295Non-controlling interest . . . . . . . . . . . . . . . . . . . . . . . . . . . . . . . . . — 5,640
Total shareholders’ equity . . . . . . . . . . . . . . . . . . . . . . . . . . . . . . . . . 174,360 203,935
Total liabilities and shareholders’ equity . . . . . . . . . . . . . . . . . . . . . . . $1,039,871 $1,296,231
See accompanying notes to these Consolidated Financial Statements
F-4

EWT Holdings I Corp.
Consolidated Statements of Operations
(in thousands except per share data)
Predecessor Successor
October 1, 2013 January 16, 2014through through Year ended Year ended
January 15, 2014 September 30, 2014 September 30, 2015 September 30, 2016
Revenue from product sales . . . . . . . . . $ 169,100 $ 414,884 $ 533,649 $ 587,087Revenue from services . . . . . . . . . . . . . 137,214 376,270 527,317 550,109
306,314 791,154 1,060,966 1,137,196
Cost of product sales . . . . . . . . . . . . . (124,848) (366,107) (385,243) (407,354)Cost of services . . . . . . . . . . . . . . . . . (103,379) (334,138) (383,306) (396,777)
(228,227) (700,245) (768,549) (804,131)
Gross Profit . . . . . . . . . . . . . . . . . . . 78,087 90,909 292,417 333,065
Research and development expense . . . . (6,728) (18,829) (25,909) (22,897)Sales and marketing expense . . . . . . . . . (38,479) (90,947) (124,429) (135,208)General and administrative expense . . . . (35,652) (104,122) (147,663) (144,771)Other operating income . . . . . . . . . . . . 124 307 1,237 10,079Other operating expense . . . . . . . . . . . (1,322) (829) (1,163) (3,113)Interest expense . . . . . . . . . . . . . . . . . (23) (23,994) (34,060) (42,518)Equity in income of non-consolidated
affiliate . . . . . . . . . . . . . . . . . . . . . 518 1,283 1,424 —
Loss before income taxes . . . . . . . . . . . (3,475) (146,222) (38,146) (5,363)
Income tax benefit (expense) . . . . . . . . 1,173 48,465 (47,905) 18,394
Net (loss) income . . . . . . . . . . . . . . . . (2,302) (97,757) (86,051) 13,031
Net income attributable to non-controlling interest . . . . . . . . . . . . . — — — 1,392
Net (loss) income attributable to EWTHoldings I Corp. . . . . . . . . . . . . . . . $ (2,302) $ (97,757) $ (86,051) $ 11,639
Basic (loss) earnings per common share . . $ (0.97) $ (0.85) $ 0.11Diluted (loss) earnings per common share $ (0.97) $ (0.85) $ 0.11
See accompanying notes to these Consolidated Financial Statements
F-5

EWT Holdings I Corp.
Consolidated Statements of Comprehensive Income (Loss)
(in thousands)
Predecessor Successor
October 1, 2013 January 16, 2014through through Year ended Year ended
January 15, 2014 September 30, 2014 September 30, 2015 September 30, 2016
Net (loss) income . . . . . . . . . . . . . . . . $(2,302) $(97,757) $(86,051) $13,031Other comprehensive income
Foreign currency translationadjustments . . . . . . . . . . . . . . . . (315) 2,038 (4,276) 1,493
Change in pension liability, net of taxof ($0), ($1,012), ($72) and ($0),respectively . . . . . . . . . . . . . . . . . — (2,560) 285 (7,651)
Total other comprehensive loss . . . . . . . (315) (522) (3,991) (6,158)Less: Comprehensive income attributable
to non-controlling interest . . . . . . . . . — — — (1,392)
Comprehensive (loss) income attributableto EWT Holdings I Corp. . . . . . . . . . $(2,617) $(98,279) $(90,042) $ 5,481
See accompanying notes to these Consolidated Financial Statements
F-6

EWT Holdings I Corp.
Consolidated Statements of Changes in Equity
(in thousands)
AccumulatedCommon Treasury Additional Other
Stock Common Stock Treasury Paid-in Retained Comprehensive Non-controlling Net ParentShares Stock Shares Stock Capital Deficit Loss Interest Investment Total
PredecessorBalance at October 1, 2013 . . — $ — — $ — $ — $ — $ — $ — $712,210 $712,210
Net loss . . . . . . . . . . . . — — — — — — — — (2,302) (2,302)Other comprehensive loss . — — — — — — — — (315) (315)Distribution from parent . . — — — — — — — — 89,901 89,901
Balance at January 15, 2014 . — $ — — $ — $ $ $ — $ — $799,494 $799,494SuccessorBalance at January 16, 2014 . — $ — — $ — $ — $ — $ — $ — $ — $ —
Issuance of common stock,net of $16,650 in fees . . 99,743 997 — — 352,390 — — — — 353,387
Equity based compensationexpense . . . . . . . . . . — — — — 342 — — — — 342
Issuance of common stock . 1,878 19 — — 6,909 — — — — 6,928Net loss . . . . . . . . . . . . — — — — — (97,757) — — — (97,757)Other comprehensive loss . — — — — — — (522) — — (522)
Balance at September 30,2014 . . . . . . . . . . . . . . 101,621 $1,016 — $ — $359,641 $ (97,757) $ (522) $ — $ — $262,378Equity based compensation
expense . . . . . . . . . . — — — — 1,587 — — — — 1,587Issuance of common stock . 228 2 — — 845 — — — — 847Stock repurchases . . . . . . — — 107 (410) — — — — — (410)Net loss . . . . . . . . . . . . — — — — — (86,051) — — — (86,051)Other comprehensive loss . — — — — — — (3,991) — — (3,991)
Balance at September 30,2015 . . . . . . . . . . . . . . 101,849 1,018 107 (410) 362,073 (183,808) (4,513) — — 174,360Equity based compensation
expense . . . . . . . . . . — — — — 1,999 — — — — 1,999Capital contribution . . . . . — — — — 6,895 — — — — 6,895Issuance of common stock . 2,646 27 — — 10,256 — — — — 10,283Stock repurchases . . . . . . — — 138 (723) — — — — — (723)Establishment of non-
controlling interest . . . . — 0 — — — — — 6,873 — 6,873Dividends paid to non-
controlling interest . . . . — — — — — — (2,625) — (2,625)Net income . . . . . . . . . — — — — — 11,639 — 1,392 — 13,031Other comprehensive loss . — — — — (6,158) — — (6,158)
Balance at September 30,2016 . . . . . . . . . . . . . . 104,495 $1,045 245 $(1,133) $381,223 $(172,169) $(10,671) $ 5,640 $ $203,935
See accompanying notes to these Consolidated Financial Statements
F-7

EWT Holdings I Corp.
Consolidated Statements of Changes in Cash Flows
(in thousands)
Predecessor Successor
October 1, January 16,2013 2014
Through Through Year Ended Year EndedJanuary 15, September 30, September 30, September 30,
2014 2014 2015 2016
Operating activitiesNet (loss) income . . . . . . . . . . . . . . . . . . . . . . . . . . . . . . . . $ (2,302) $ (97,757) $(86,051) $ 13,031Reconciliation of net loss to cash flows from operating activities:
Depreciation and amortization . . . . . . . . . . . . . . . . . . . . . . 14,934 139,933 58,139 69,289Amortization of deferred financing costs . . . . . . . . . . . . . . . . — 2,489 3,514 4,121Deferred income taxes . . . . . . . . . . . . . . . . . . . . . . . . . . . (2,610) (52,416) 45,254 (21,215)Share based compensation . . . . . . . . . . . . . . . . . . . . . . . . . 2,500 342 1,587 1,999Equity in net income (loss) of affiliate, net of cash received . . . . . (268) (158) 76 —Gain on sale of property, plant and equipment . . . . . . . . . . . . . (291) (309) (20) (11,120)Foreign currency losses on intracompany loans . . . . . . . . . . . . . — 6,794 19,288 51Changes in assets and liabilities
Accounts receivable . . . . . . . . . . . . . . . . . . . . . . . . . . . . 22,350 (1,465) 9,496 (3,973)Inventories . . . . . . . . . . . . . . . . . . . . . . . . . . . . . . . . . 3,185 11,986 (44) 2,484Cost and earnings in excess of billings on uncompleted contracts (6,689) 30,188 17,848 (15,258)Due to affiliates . . . . . . . . . . . . . . . . . . . . . . . . . . . . . . 36,293 — — —Prepaids and other current assets . . . . . . . . . . . . . . . . . . . 18,009 (761) 4,287 1,326Accounts payable . . . . . . . . . . . . . . . . . . . . . . . . . . . . . (12,272) 13,781 (14,941) 15,682Accrued expenses and other liabilities . . . . . . . . . . . . . . . . . (6,526) (7,305) (14,568) (31,446)Billings in excess of costs incurred . . . . . . . . . . . . . . . . . . . 5,728 (10,978) 7,497 (13,389)Income taxes . . . . . . . . . . . . . . . . . . . . . . . . . . . . . . . . (23,500) 3,755 (6,224) 4,329Other non-current assets and liabilities . . . . . . . . . . . . . . . . (2,964) (641) (3,194) 16,008
Net cash provided by operating activities . . . . . . . . . . . . . . . . . . 45,577 37,478 41,944 31,919
Investing activitiesPurchase of property, plant and equipment . . . . . . . . . . . . . . . . (7,965) (28,625) (44,079) (47,728)Purchase of intangibles . . . . . . . . . . . . . . . . . . . . . . . . . . . . — (4,477) (4,705) (248)Proceeds from sale of property, plant and equipment . . . . . . . . . . 441 1,592 1,918 5,191Proceeds from sale of business . . . . . . . . . . . . . . . . . . . . . . . . — — — 4,547Acquisitions, net of cash acquired of $0, $167,565, $0 and $11,486,
respectively . . . . . . . . . . . . . . . . . . . . . . . . . . . . . . . . . . — (730,577) — (306,372)
Net cash used in investing activities . . . . . . . . . . . . . . . . . . . . . (7,524) (762,087) (46,866) (344,610)
Financing activitiesNet transfers from parent . . . . . . . . . . . . . . . . . . . . . . . . . . . 89,901 — — —Issuance of debt related to acquisitions, net of deferred issuance
costs . . . . . . . . . . . . . . . . . . . . . . . . . . . . . . . . . . . . . . — 580,000 — 178,704Borrowings under credit facility . . . . . . . . . . . . . . . . . . . . . . . — (25,083) — 81,000Repayment of debt . . . . . . . . . . . . . . . . . . . . . . . . . . . . . . . — (3,788) (5,050) (74,461)Repayment of capital lease obligation . . . . . . . . . . . . . . . . . . . . — — (1,650) (7,683)Proceeds from capital contribution . . . . . . . . . . . . . . . . . . . . . — — — 6,895Proceeds from issuance of common stock . . . . . . . . . . . . . . . . . — 376,965 847 10,282Stock repurchases . . . . . . . . . . . . . . . . . . . . . . . . . . . . . . . . — — (410) (723)Investor transaction fees . . . . . . . . . . . . . . . . . . . . . . . . . . . . — (16,650) — —Distribution to non-controlling interest . . . . . . . . . . . . . . . . . . . — — — (2,625)
Net cash provided by (used in) financing activities . . . . . . . . . . . . 89,901 911,444 (6,263) 191,389
Effect of exchange rate changes on cash . . . . . . . . . . . . . . . . . . (243) (1,399) (5,225) 2,637
Change in cash and cash equivalents . . . . . . . . . . . . . . . . . . . . 127,711 185,436 (16,410) (118,665)Cash and cash equivalents
Beginning of period . . . . . . . . . . . . . . . . . . . . . . . . . . . . . 39,857 — 185,437 169,027
End of period . . . . . . . . . . . . . . . . . . . . . . . . . . . . . . . . . $167,568 $ 185,436 $169,027 $ 50,362
See accompanying notes to these Consolidated Financial Statements
F-8

EWT Holdings I Corp.
Supplemental Disclosure of Cash Flow Information
(in thousands)
Predecessor Successor
October 1, 2013 January 16, Year Ended Year EndedThrough 2014 Through September 30, September 30,
January 15, 2014 September 30, 2014 2015 2016
Supplemental disclosure of cashflow information
Cash paid for taxes . . . . . . . . . . $— $ 918 $ 8,685 $ 3,964Cash paid for interest . . . . . . . . $— $21,714 $30,511 $36,750
Non-cash investing andfinancing activities
Accrued earnout related toacquisition . . . . . . . . . . . . . . $— $ — $ — $ 650
Capital lease transactions . . . . . $— $ — $22,504 $ 8,378
See accompanying notes to these Consolidated Financial Statements
F-9
EWT Holdings I Corp.
Notes to Audited Consolidated Financial Statements
September 30, 2015 and September 30, 2016
(in thousands)
1. Description of the Company and Basis of Presentation
Background
EWT Holdings I Corp. was incorporated on October 7, 2013. On January 15, 2014, EWTHoldings I Corp., acquired through its wholly owned entities, EWT Holdings II Corp. and EWTHoldings III Corp. (a/k/a Evoqua Water Technologies), all of the outstanding shares of Siemens WaterTechnologies, a group of legal entity businesses formerly owned by Siemens AG (Siemens). The stockpurchase closed on January 15, 2014 and was effective January 16, 2014 (the Acquisition). The stockpurchase price, net of cash received, was approximately $730,577. From October 7, 2013 to January 15,2014, the Successor had no activities other than the incurrence of transaction costs related to theAEA Acquisition.
Evoqua Water Technologies and subsidiaries will be referred to herein as ‘‘the Successor’’, ‘‘theCompany’’ or ‘‘EWT’’. Siemens Water Technologies will be referred to herein as ‘‘Water TechnologiesGroup’’ or ‘‘the Predecessor.’’
The Business
EWT provides a wide range of product brands and advanced water and wastewater treatmentsystems and technologies, as well as mobile and emergency water supply solutions and service contractoptions through its segment’s branch network. Headquartered in Warrendale, Pennsylvania, EWT is amulti-national corporation with operations in the United States, Canada, the United Kingdom,the Netherlands, Italy, Germany, Australia, China, and Singapore.
The Company is organizationally structured into three reportable segments for the purpose ofmaking operational decisions and assessing financial performance: (i) Industrial, (ii) Municipal and(iii) Products.
Basis of Presentation
The accompanying consolidated financial statements of the Successor and Predecessor have beenprepared in accordance with accounting principles generally accepted in the United States(U.S. GAAP) from the accounting records of the Company, and reflect the consolidated financialposition and results of operations for the period from January 16, 2014 to September 30, 2014 and theyears ended September 30, 2015 and 2016. The assets and liabilities of the Company reflect theapplication of purchase accounting at the date of acquisition. All intracompany transactions have beeneliminated.
The financial statements of the Predecessor have been prepared on a combined basis from theaccounting records of Siemens AG and reflect the historical results of operations and cost basis ofassets and liabilities that comprise the Predecessor. As the Predecessor represents a portion of theSiemens’ business, the historical statement of operations, balance sheet, and cash flows of thePredecessor may not be indicative of what they would have been had the Predecessor been a separatestand-alone entity.
F-10

EWT Holdings I Corp.
Notes to Audited Consolidated Financial Statements (Continued)
September 30, 2015 and September 30, 2016
(in thousands)
2. Summary of Significant Accounting Policies
Fiscal Year
The Company’s fiscal year ends on September 30.
Use of Estimates
The consolidated financial statements have been prepared in conformity with U.S. GAAP andrequire management to make estimates and assumptions. These assumptions affect the reportedamounts of assets and liabilities and disclosure of contingent assets and liabilities at the date of theconsolidated financial statements and the reported amounts of revenue and expenses during thereporting period. Estimates and assumptions are used for, but not limited to: (i) revenue recognition;(ii) allowance for doubtful accounts; (iii) inventory valuation, asset valuations, impairment, andrecoverability assessments; (iv) depreciable lives of assets; (v) useful lives of intangible assets;(vi) income tax reserves and valuation allowances; and (vii) product warranty and litigation reserves.Estimates are revised as additional information becomes available. Actual results could differ fromthese estimates.
Cash and Cash Equivalents
Cash and cash equivalents are liquid investments with an original maturity of three or fewermonths when purchased.
Accounts Receivable
Receivables are primarily comprised of uncollected amounts owed to us from transactions withcustomers and are presented net of allowances for doubtful accounts. Allowances are estimated basedon historical write-offs and the economic status of customers. The Company considers a receivabledelinquent if it is unpaid after the term of the related invoice has expired. Write-offs are recorded atthe time all collection efforts have been exhausted.
Inventories
Inventories are stated at the lower of cost or market, where cost is generally determined on thebasis of an average or first-in, first-out (FIFO) method. Production costs comprise direct material andlabor and applicable manufacturing overheads, including depreciation charges. The Company regularlyreviews inventory quantities on hand and writes off excess or obsolete inventory based on estimatedforecasts of product demand and production requirements. Manufacturing operations recognize cost ofproduct sales using standard costing rates with overhead absorption which generally approximatesactual cost.
Property, Plant, and Equipment
Property, plant, and equipment is valued at cost less accumulated depreciation and impairmentlosses. If the costs of certain components of an item of property, plant, and equipment are significantin relation to the total cost of the item, they are accounted for and depreciated separately.
F-11

EWT Holdings I Corp.
Notes to Audited Consolidated Financial Statements (Continued)
September 30, 2015 and September 30, 2016
(in thousands)
2. Summary of Significant Accounting Policies (Continued)
Depreciation expense is recognized using the straight-line method. Useful lives are reviewed annuallyand, if expectations differ from previous estimates, adjusted accordingly. Estimated useful lives formajor classes of depreciable assets are as follows:
Asset Class Estimated Useful Life
Machinery and equipment . . . . . . . . . . . . . . . . . . . . . . . . . . . . . 3 to 20 yearsBuildings and improvements . . . . . . . . . . . . . . . . . . . . . . . . . . . 10 to 40 years
Leasehold improvements are depreciated over the shorter of their estimated useful life or the termof the lease. Costs related to maintenance and repairs that do not extend the assets’ useful life areexpensed as incurred.
Goodwill and Other Intangible Assets
Goodwill represents purchase consideration paid in a business combination that exceeds the valueassigned to the net assets of acquired businesses. Other intangible assets consist of customer-relatedintangibles, proprietary technology, software, trademarks and other intangible assets. The Companyamortizes intangible assets with definite useful lives on a straight-line basis over their respectiveestimated economic lives which range from 1 to 26 years.
The Company reviews goodwill to determine potential impairment annually during the fourthquarter of our fiscal year, or more frequently if events and circumstances indicate that the asset mightbe impaired. Impairment testing for goodwill is performed at a reporting unit level. We havedetermined that we have four reporting units. Our quantitative impairment testing utilizes both amarket (guideline public company) and income (discounted cash flows) method for determining fairvalue. In estimating the fair value of the reporting unit utilizing a discounted cash flow (‘‘DCF’’)valuation technique, we incorporate our judgment and estimates of future cash flows, future revenueand gross profit growth rates, terminal value amount, capital expenditures and applicableweighted-average cost of capital used to discount these estimated cash flows. The estimates andprojections used in the estimate of fair value are consistent with our current budget and long-rangeplans, including anticipated change in market conditions, industry trend, growth rates and plannedcapital expenditures, among other considerations. If the carrying value of the reporting unit is greaterthan the fair value, the second step is performed, where the implied fair value of goodwill is comparedto its carrying value.
Impairment of Long-Lived Assets
Long-lived assets, such as property, plant, and equipment, and purchased intangibles subject toamortization, are reviewed for impairment whenever events or changes in circumstances indicate thatthe carrying amount of an asset or asset group may not be recoverable. Recoverability of the asset orasset group is measured by comparison of its carrying amount to undiscounted future net cash flowsthe asset or asset group is expected to generate. If the carrying amount of an asset or asset group isnot recoverable, the Company recognizes an impairment loss based on the excess of the carrying
F-12

EWT Holdings I Corp.
Notes to Audited Consolidated Financial Statements (Continued)
September 30, 2015 and September 30, 2016
(in thousands)
2. Summary of Significant Accounting Policies (Continued)
amount of the asset or asset group over its respective fair value which is generally determined as thepresent value of estimated future cash flows or as the appraised value.
Debt Issuance Costs and Debt Discounts
Debt issuance costs are capitalized and amortized over the contractual term of the underlying debtusing the straight line method which approximates the effective interest method. Debt discounts andlender arrangement fees deducted from the proceeds have been included as a component of thecarrying value of debt and are being amortized to interest expense using the effective interest method.
Amortization of debt issuance costs and debt discounts/premiums included in interest expense were$2,489, $3,514 and $4,121 for the year ending September 30, 2014 (Successor Period), 2015 and 2016,respectively.
Revenue Recognition
Sales of goods and services are recognized when persuasive evidence of an arrangement exists, theprice is fixed or determinable, collectability is reasonably assured and delivery has occurred or serviceshave been rendered.
For sales of aftermarket parts or products with a low level of customization and engineering time,the Company recognizes revenues at the time title and risks and rewards of ownership pass, which isgenerally when products are shipped or delivered to the customer as the Company has no obligationfor installation. Sales of short-term service arrangements are recognized as the services are performed,and sales of long-term service arrangements are typically recognized on a straight-line basis over thelife of the agreement.
For certain arrangements where there is significant customization to the product, the Companyrecognizes revenue under the provisions of Accounting Standards Codification (ASC) 605-35, RevenueRecognition—Construction-Type and Production-Type Contracts. These products include large capitalwater treatment projects, systems and solutions for municipal and industrial applications. Revenuesfrom construction-type contracts are generally recognized under the percentage-of-completion method,based on the input of costs incurred to date as a percentage of total estimated contract costs. Thenature of the contracts are generally fixed price with milestone billings. Approximately $175,317,$203,083 and $218,605 of revenues from construction-type contracts were recognized on thepercentage-of-completion method during the periods ending September 30, 2014 (Successor Period)2015 and 2016 respectively. Contract revenues and cost estimates are reviewed and revised quarterly ata minimum and the cumulative effect of such adjustments are recognized in current operations. Theamount of such adjustments have not been material. Cost and earnings in excess of billings underconstruction-type arrangements are recorded when contracts have net asset balances where contractcosts plus recognized profits less recognized losses exceed progress billings. Billings in excess of costsincurred are recorded when contract progress billings exceed costs and recognized profit less recognizedlosses.
F-13

EWT Holdings I Corp.
Notes to Audited Consolidated Financial Statements (Continued)
September 30, 2015 and September 30, 2016
(in thousands)
2. Summary of Significant Accounting Policies (Continued)
Approximately $21,638, $29,667 and $33,457 of revenues from construction-type contracts wererecognized on a completed contract method, which is typically when the product is delivered andaccepted by the customer, during the periods ending September 30, 2014 (Successor Period), 2015and 2016. The completed contract method is principally used when the contract is short in duration(generally less than twelve months) and where results of operations would not vary materially fromthose resulting from the use of the percentage-of-completion method.
Product Warranties
Accruals for estimated expenses related to warranties are made at the time products are sold andare recorded as a component of Cost of product sales in the Consolidated Statements of Operationsand Comprehensive Loss. The estimated warranty obligation is based on product warranty termsoffered to customers, ongoing product failure rates, material usage and service delivery costs expectedto be incurred in correcting a product failure, as well as specific obligations for known failures andother currently available evidence. The Company assesses the adequacy of the recorded warrantyliabilities on a regular basis and adjusts amounts as necessary.
Shipping and Handling Cost
Shipping and handling costs are included as a component of cost of sales.
Income Taxes
The Company recognizes deferred tax assets and liabilities for the future tax consequencesattributable to differences between the financial statement carrying amounts of existing assets andliabilities and their respective tax bases. Deferred tax assets and liabilities are measured using enactedtax rates expected to apply to taxable income in the years in which those temporary differences areexpected to be recovered or settled. The effect on deferred tax assets and liabilities of a change in taxrates is recognized in income in the period that included the enactment date. Valuation allowances areprovided against deferred tax assets when it is deemed more likely than not that some portion or all ofthe deferred tax asset will not be realized within a reasonable time period. We assess tax positionsusing a two-step process. A tax position is recognized if it meets a more-likely-than-not threshold, andis measured at the largest amount of benefit that is greater than 50.0% percent of being realized.Uncertain tax positions are reviewed each balance sheet date.
In November 2015, the Financial Accounting Standards Board (‘‘FASB’’) issued an AccountingStandard Update (‘‘ASU’’) 2015-17, Balance Sheet Classification of Deferred Taxes. This update simplifiesthe presentation of deferred income taxes. The amendments in this update require that deferred taxliabilities and assets be classified as noncurrent for all entities that present a classified statement offinancial position. The current requirement that deferred tax liabilities and assets of a tax-payingcomponent of an entity be offset and presented as a single amount is not affected by the amendmentsin this update. The amendments in this update are effective for non-public entity financial statementsissued for annual periods beginning after December 15, 2017, and interim periods with annual periodsbeginning after December 15, 2018. Earlier application is permitted for all entities as of the beginning
F-14

EWT Holdings I Corp.
Notes to Audited Consolidated Financial Statements (Continued)
September 30, 2015 and September 30, 2016
(in thousands)
2. Summary of Significant Accounting Policies (Continued)
of an interim or annual reporting period. The amendments in this update may be applied eitherprospectively to all deferred tax liabilities and assets or retrospectively to all periods presented.Management has elected to prospectively adopt this update early as of October 1, 2015. By adoptingthis update prospectively, prior periods were not retrospectively adjusted.
Sales Taxes
Upon collection of sales tax from revenue, the amount of sales tax is placed into an accruedliability account. This liability is then relieved when the payment is sent to the proper governmentjurisdiction.
Foreign Currency Translation and Transactions
The functional currency for the international subsidiaries is the local currency. Assets and liabilitiesare translated into U.S. Dollars using current rates of exchange, while revenues and expenses aretranslated at the weighted-average exchange rate for the period. The resulting translation adjustmentsare recorded in other comprehensive income/loss within shareholders equity.
The Predecessor recognized foreign currency transaction losses of $321 for the period fromOctober 1, 2013 to January 15, 2014. Foreign currency transaction losses aggregated $8,363, $19,957and $666 for the period from January 16, 2014 to September 30, 2014 and for the fiscal years endingSeptember 30, 2015 and 2016, respectively, and are primarily included in General and administrativeexpenses in the Consolidated Statements of Operations and Comprehensive Loss.
Research and Development Costs
Research and development costs are expensed as incurred. The Predecessor recorded $6,728 ofcosts for the period from October 1, 2013 to January 15, 2014. The Company recorded $18,829,$25,909, and $22,897 of costs, respectively, for the period from January 16, 2014 to September 30, 2014and for the fiscal years ending September 30, 2015 and 2016.
Equity-based Compensation
The Company measures the cost of awards of equity instruments to employees based on thegrant-date fair value of the award. Given the absence of a public trading market for our common stock,the fair value of the common stock underlying our share-based awards was determined by our board,with input from management, in each case using the income and market valuation approach. Stockoptions are granted with exercise prices equal to or greater than the estimated fair market value on thedate of grant as authorized by our compensation committee. The grant-date fair value is determinedusing the Black-Scholes model. The fair value, net of estimated forfeitures, is amortized ascompensation cost on a straight-line basis over the vesting period primarily as a component of Generaland administrative expenses.
F-15
EWT Holdings I Corp.
Notes to Audited Consolidated Financial Statements (Continued)
September 30, 2015 and September 30, 2016
(in thousands)
2. Summary of Significant Accounting Policies (Continued)
Earnings per Share
Basic earnings per common share is computed based on the weighted average number of shares ofcommon stock outstanding during the period. Diluted earnings per common share is computed basedon the weighted average number of shares of common stock, plus the effect of diluted potentialcommon shares outstanding during the period using the treasury stock method. Diluted potentialcommon shares include outstanding stock options.
Retirement Benefits
The Company applies, ASC Topic 715, Compensation—Retirement Benefits, which requires therecognition in pension obligations and accumulated other comprehensive income of actuarial gains orlosses, prior service costs or credits and transition assets or obligations that have previously beendeferred. The determination of retirement benefit pension obligations and associated costs requires theuse of actuarial computations to estimate participant plan benefits to which the employees will beentitled. The significant assumptions primarily relate to discount rates, expected long-term rates ofreturn on plan assets, rate of future compensation increases, mortality, years of service, and otherfactors. The Company develops each assumption using relevant experience in conjunction with market-related data for each individual country in which such plans exist. All actuarial assumptions arereviewed annually with third-party consultants and adjusted as necessary. For the recognition of netperiodic postretirement cost, the calculation of the expected return on plan assets is generally derivedby applying the expected long-term rate of return on the market-related value of plan assets. The fairvalue of plan assets is determined based on actual market prices or estimated fair value at themeasurement date.
Treated Water Outsourcing
Treated Water Outsourcing (TWO) is a joint venture between the Company and the Ondeo NalcoCompany (Nalco) to sell water management equipment and services to industrial customers locatedthroughout the United States.
The Company holds a 50% partnership interest and for the years ended September 30, 2014 and2015, accounted for TWO under the equity method and did not consolidate the joint venture as theCompany did not have a controlling financial interest based on the shared powers of both joint venturepartners to direct the activities that most significantly impact TWO’s financial performance. During theperiod October 1, 2013 through January 15, 2014 (Predecessor), dividends received were $250.Dividends received during the fiscal year ended 2014 and 2015, respectively, were $1,125 and $1,500. AtSeptember 30, 2015, the Company had an investment of $6,873 classified in Investment in affiliate onthe Consolidated Balance Sheets. This Investment in affiliate was included within the Industrialsegment.
On October 1, 2015, a change occurred in the partnership structure of TWO such that theCompany is now obligated to absorb all risk of loss up to 100% of the joint venture partner’s equity.As such, the accounting for the Company’s 50% interest changed from equity method investment tofull consolidation as a variable interest entity (VIE) under ASC 810, Consolidation.
F-16
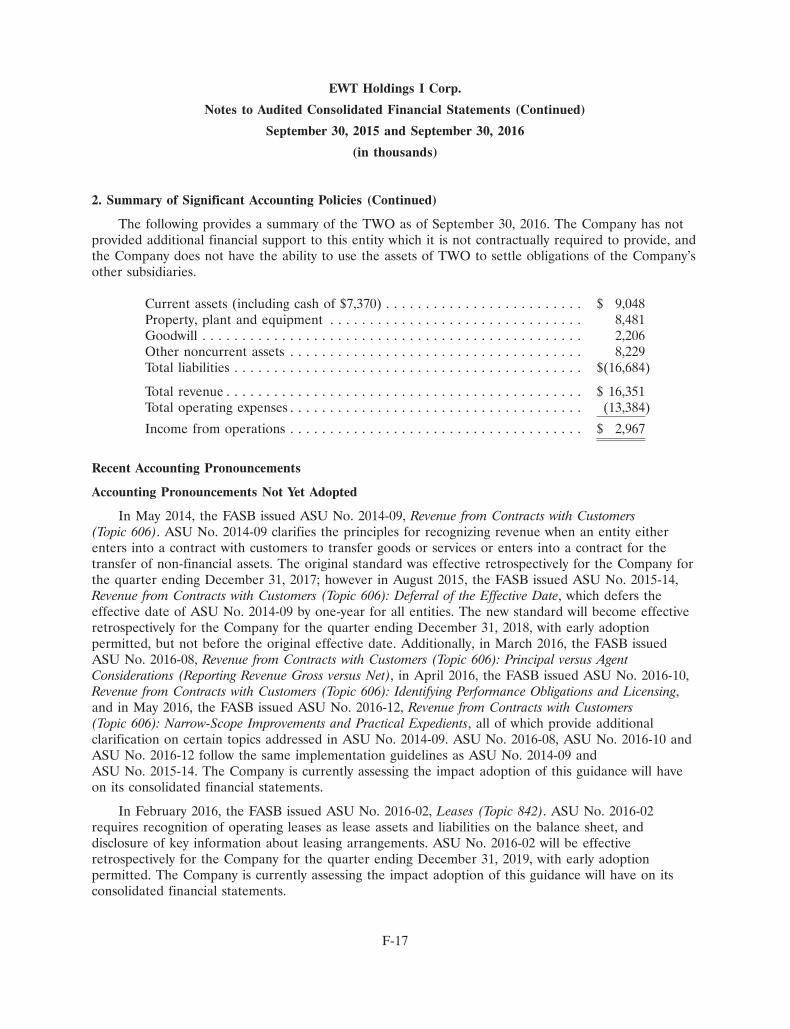
EWT Holdings I Corp.
Notes to Audited Consolidated Financial Statements (Continued)
September 30, 2015 and September 30, 2016
(in thousands)
2. Summary of Significant Accounting Policies (Continued)
The following provides a summary of the TWO as of September 30, 2016. The Company has notprovided additional financial support to this entity which it is not contractually required to provide, andthe Company does not have the ability to use the assets of TWO to settle obligations of the Company’sother subsidiaries.
Current assets (including cash of $7,370) . . . . . . . . . . . . . . . . . . . . . . . . . $ 9,048Property, plant and equipment . . . . . . . . . . . . . . . . . . . . . . . . . . . . . . . . 8,481Goodwill . . . . . . . . . . . . . . . . . . . . . . . . . . . . . . . . . . . . . . . . . . . . . . . . 2,206Other noncurrent assets . . . . . . . . . . . . . . . . . . . . . . . . . . . . . . . . . . . . . 8,229Total liabilities . . . . . . . . . . . . . . . . . . . . . . . . . . . . . . . . . . . . . . . . . . . . $(16,684)
Total revenue . . . . . . . . . . . . . . . . . . . . . . . . . . . . . . . . . . . . . . . . . . . . . $ 16,351Total operating expenses . . . . . . . . . . . . . . . . . . . . . . . . . . . . . . . . . . . . . (13,384)
Income from operations . . . . . . . . . . . . . . . . . . . . . . . . . . . . . . . . . . . . . $ 2,967
Recent Accounting Pronouncements
Accounting Pronouncements Not Yet Adopted
In May 2014, the FASB issued ASU No. 2014-09, Revenue from Contracts with Customers(Topic 606). ASU No. 2014-09 clarifies the principles for recognizing revenue when an entity eitherenters into a contract with customers to transfer goods or services or enters into a contract for thetransfer of non-financial assets. The original standard was effective retrospectively for the Company forthe quarter ending December 31, 2017; however in August 2015, the FASB issued ASU No. 2015-14,Revenue from Contracts with Customers (Topic 606): Deferral of the Effective Date, which defers theeffective date of ASU No. 2014-09 by one-year for all entities. The new standard will become effectiveretrospectively for the Company for the quarter ending December 31, 2018, with early adoptionpermitted, but not before the original effective date. Additionally, in March 2016, the FASB issuedASU No. 2016-08, Revenue from Contracts with Customers (Topic 606): Principal versus AgentConsiderations (Reporting Revenue Gross versus Net), in April 2016, the FASB issued ASU No. 2016-10,Revenue from Contracts with Customers (Topic 606): Identifying Performance Obligations and Licensing,and in May 2016, the FASB issued ASU No. 2016-12, Revenue from Contracts with Customers(Topic 606): Narrow-Scope Improvements and Practical Expedients, all of which provide additionalclarification on certain topics addressed in ASU No. 2014-09. ASU No. 2016-08, ASU No. 2016-10 andASU No. 2016-12 follow the same implementation guidelines as ASU No. 2014-09 andASU No. 2015-14. The Company is currently assessing the impact adoption of this guidance will haveon its consolidated financial statements.
In February 2016, the FASB issued ASU No. 2016-02, Leases (Topic 842). ASU No. 2016-02requires recognition of operating leases as lease assets and liabilities on the balance sheet, anddisclosure of key information about leasing arrangements. ASU No. 2016-02 will be effectiveretrospectively for the Company for the quarter ending December 31, 2019, with early adoptionpermitted. The Company is currently assessing the impact adoption of this guidance will have on itsconsolidated financial statements.
F-17
EWT Holdings I Corp.
Notes to Audited Consolidated Financial Statements (Continued)
September 30, 2015 and September 30, 2016
(in thousands)
2. Summary of Significant Accounting Policies (Continued)
In March 2016, the FASB issued (ASU) 2016-09, Improvements to Employee Share-Based PaymentAccounting, which amends ASC Topic 718, Compensation—Stock Compensation. The ASU includesprovisions intended to simplify various aspects related to how share-based payments are accounted forand presented in the financial statements. ASU No. 2016-09 will be effective for the Company for thequarter ending December 31, 2017. This update is not expected to have an impact on the Company’sconsolidated financial statements. The Company is currently assessing the impact adoption of thisguidance will have on its consolidated financial statements.
In August 2016, the FASB issued ASU 2016-15, Statement of Cash Flows (Topic 230): Classificationof Certain Cash Receipts and Cash Payments (a consensus of the Emerging Issues Task Force). This newguidance is intended to reduce diversity in practice in how certain transactions are classified in thestatement of cash flows. ASU No. 2016-15 will be effective for the Company for the quarter endingDecember 31, 2018, with early adoption permitted. The guidance should be applied retrospectively toall periods presented, unless deem impracticable, in which case prospective application is permitted.The Company is currently evaluating the potential impact of adoption on the Company’s ConsolidatedFinancial Statements.
In January 2017, the FASB issued ASU 2017-04, Simplifying the Test for Goodwill Impairment. ThisASU simplifies how an entity is required to test goodwill for impairment by eliminating Step 2 from thegoodwill impairment test. Step 2 measures goodwill impairment loss by comparing the implied value ofa reporting unit’s goodwill with the carrying amount of that goodwill. The amendments in this ASU areeffective for us for the quarter ending December 31, 2020. We do not expect the adoption of this ASUto have a material impact on our consolidated financial statements.
In May 2017, the FASB issued ASU 2017-09, Scope of Modification Accounting, which amendedAccounting Standards Code Topic 718. FASB issued ASU 2017-09 to reduce the cost and complexitywhen applying Topic 718 and standardize the practice of applying Topic 718 to financial reporting. TheASU was not developed to fundamentally change the definition of a modification, but instead toprovide guidance for what changes would qualify as a modification. ASU No. 2017-09 will be effectivefor us for the quarter ending December 31, 2018. We are currently evaluating the potential impact ofadoption on the Company’s Consolidated Financial Statements.
3. Acquisitions and Divestitures
As discussed above, EWT acquired the Predecessor on January 15, 2014. The Acquisition wastreated as a purchase transaction and the purchase price was allocated to the underlying assets acquiredand liabilities assumed based upon their estimated fair values at the date of acquisition. The purchaseprice totaled $730,577, net of cash received and was funded using the proceeds from a $560,400 debtplacement (net of original issue discount and lender arrangement fees) as well as an equity investment.The equity was raised through the sale of 99,743 million shares of stock in the parent holding company,EWT Holdings I Corp, priced at $3.71 per share. The shares were sold at a 4.5% discount for total netproceeds of $353,350.
The excess of the purchase price over the fair value of the identifiable tangible and intangibleassets acquired and liabilities assumed was recorded as goodwill. The goodwill is attributable to theassembled workforce and expected synergies among the acquired businesses.
F-18
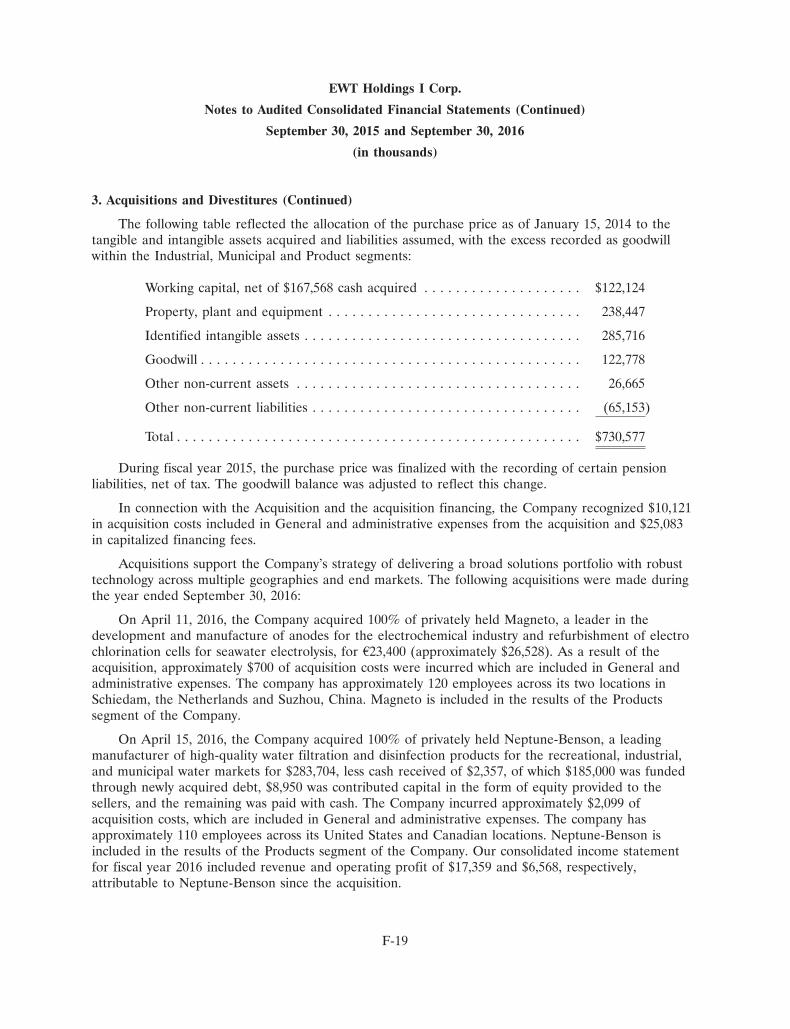
EWT Holdings I Corp.
Notes to Audited Consolidated Financial Statements (Continued)
September 30, 2015 and September 30, 2016
(in thousands)
3. Acquisitions and Divestitures (Continued)
The following table reflected the allocation of the purchase price as of January 15, 2014 to thetangible and intangible assets acquired and liabilities assumed, with the excess recorded as goodwillwithin the Industrial, Municipal and Product segments:
Working capital, net of $167,568 cash acquired . . . . . . . . . . . . . . . . . . . . $122,124
Property, plant and equipment . . . . . . . . . . . . . . . . . . . . . . . . . . . . . . . . 238,447
Identified intangible assets . . . . . . . . . . . . . . . . . . . . . . . . . . . . . . . . . . . 285,716
Goodwill . . . . . . . . . . . . . . . . . . . . . . . . . . . . . . . . . . . . . . . . . . . . . . . . 122,778
Other non-current assets . . . . . . . . . . . . . . . . . . . . . . . . . . . . . . . . . . . . 26,665
Other non-current liabilities . . . . . . . . . . . . . . . . . . . . . . . . . . . . . . . . . . (65,153)
Total . . . . . . . . . . . . . . . . . . . . . . . . . . . . . . . . . . . . . . . . . . . . . . . . . . . $730,577
During fiscal year 2015, the purchase price was finalized with the recording of certain pensionliabilities, net of tax. The goodwill balance was adjusted to reflect this change.
In connection with the Acquisition and the acquisition financing, the Company recognized $10,121in acquisition costs included in General and administrative expenses from the acquisition and $25,083in capitalized financing fees.
Acquisitions support the Company’s strategy of delivering a broad solutions portfolio with robusttechnology across multiple geographies and end markets. The following acquisitions were made duringthe year ended September 30, 2016:
On April 11, 2016, the Company acquired 100% of privately held Magneto, a leader in thedevelopment and manufacture of anodes for the electrochemical industry and refurbishment of electrochlorination cells for seawater electrolysis, for A23,400 (approximately $26,528). As a result of theacquisition, approximately $700 of acquisition costs were incurred which are included in General andadministrative expenses. The company has approximately 120 employees across its two locations inSchiedam, the Netherlands and Suzhou, China. Magneto is included in the results of the Productssegment of the Company.
On April 15, 2016, the Company acquired 100% of privately held Neptune-Benson, a leadingmanufacturer of high-quality water filtration and disinfection products for the recreational, industrial,and municipal water markets for $283,704, less cash received of $2,357, of which $185,000 was fundedthrough newly acquired debt, $8,950 was contributed capital in the form of equity provided to thesellers, and the remaining was paid with cash. The Company incurred approximately $2,099 ofacquisition costs, which are included in General and administrative expenses. The company hasapproximately 110 employees across its United States and Canadian locations. Neptune-Benson isincluded in the results of the Products segment of the Company. Our consolidated income statementfor fiscal year 2016 included revenue and operating profit of $17,359 and $6,568, respectively,attributable to Neptune-Benson since the acquisition.
F-19

EWT Holdings I Corp.
Notes to Audited Consolidated Financial Statements (Continued)
September 30, 2015 and September 30, 2016
(in thousands)
3. Acquisitions and Divestitures (Continued)
The following table presents the unaudited pro forma results for fiscal years 2015 and 2016. Theunaudited pro forma financial information combines the results of operations of EWT andNeptune-Benson as though the Company had been combined as of the beginning of fiscal years 2015and 2016, and the pro forma information is presented for informational purposes only and is notindicative of the results of operations that would have been achieved if the acquisition had taken placeat such time. The unaudited pro forma results presented below include adjustments for increased fairvalue of acquired intangible assets and related amortization charges, acquisition costs and interest.
Pro forma combined
September 30, 2015 September 30, 2016
Total Revenues . . . . . . . . . . . . . . . . . . . . . . . . . $1,116,701 $1,171,389
Net income (loss) attributable to EWTHoldings I Corp. . . . . . . . . . . . . . . . . . . . . . (102,365) 16,568
On July 1, 2016, the Company acquired essentially all of the assets of Valve and FiltrationSystems, Ltd (VAF) through its recently acquired Neptune-Benson business for approximately $3,317;$2,667 cash at closing, in addition to earn out payments over the next five years. Included inconsideration is $650, which represents the fair value of the earn outs at the date of the acquisition,with a maximum earnout payment of $1.0 million. VAF is a leading screen filtration manufacturerbased in Arvada, Colorado, and has 12 employees. VAF’s results are included within the Productssegment.
On August 3, 2016, the Company acquired 100% of Delta Ultraviolet Corporation (Delta UV), aleading manufacturer and marketer of UV-C technology in North America, through the recentlyacquired Neptune-Benson business for $4,813. The Company incurred approximately $100 ofacquisition costs, included in General and administrative expenses. Delta UV is based in Gardena,California and had 17 employees. Delta UV’s results are included within the Products segment.
The above acquisitions were done to support the Company’s growth plan. The opening balancesheets for the above acquisitions are as follows:
Magneto Neptune-Benson VAF Delta Total
Current Assets . . . . . . . . . . . . . . . . . . . . . . . . . . . 12,240 29,521 2,287 2,268 46,316Property, plant and equipment . . . . . . . . . . . . . . . 2,323 2,480 37 518 5,358Goodwill . . . . . . . . . . . . . . . . . . . . . . . . . . . . . . . 8,143 143,680 400 1,667 153,890Other intangible assets . . . . . . . . . . . . . . . . . . . . . 9,401 149,127 1,190 1,970 161,688Other noncurrent assets . . . . . . . . . . . . . . . . . . . . — 3,576 — — 3,576
Total asset acquired . . . . . . . . . . . . . . . . . . . . . . 32,107 328,384 3,914 6,423 370,828Total liabilities assumed . . . . . . . . . . . . . . . . . . . (5,579) (44,680) (597) (1,610) (52,466)Net assets acquired . . . . . . . . . . . . . . . . . . . . . . 26,528 283,704 3,317 4,813 318,362
On September 30, 2016, the Company sold the assets of an Industrial location in Vernon,California. The Company received $4,547 for this sale, and recognized a gain of $3,700 which is
F-20
EWT Holdings I Corp.
Notes to Audited Consolidated Financial Statements (Continued)
September 30, 2015 and September 30, 2016
(in thousands)
3. Acquisitions and Divestitures (Continued)
included as a gain on sale of assets within the Other operating income section of the ConsolidatedStatements of Operations and Comprehensive Loss. The major classes of assets and liabilities that wereincluded in this sale were Receivables of $989, Property, plant and equipment of $717, Accruedexpenses of $496 and Accounts Payable of $386.
4. Fair Value Measurements
As of September 30, 2015 and 2016, the fair values of cash and cash equivalents, accountsreceivable and accounts payable approximate carrying values due to the short maturity of these items.
The Company measures the fair value of pension plan assets and liabilities, deferred compensationand plan assets and liabilities on a recurring basis pursuant to ASC Topic 820. ASC Topic 820establishes a three-tier fair value hierarchy, which prioritizes the inputs used in measuring fair value.These tiers include:
Level 1: Quoted prices for identical instruments in active markets.
Level 2: Quoted prices for similar instruments in active markets; quoted prices for identical orsimilar instruments in markets that are not active; and model-derived valuations whose inputs areobservable or whose significant value driver is observable.
Level 3: Unobservable inputs in which little or no market data is available, therefore requiring anentity to develop its own assumptions.
The following table presents the Company’s financial assets and liabilities at fair value. The fairvalues related to the pension assets are determined using net asset value (NAV) as a practicalexpedient, or by information categorized in the fair value hierarchy level based on the inputs used todetermine fair value.
F-21

EWT Holdings I Corp.
Notes to Audited Consolidated Financial Statements (Continued)
September 30, 2015 and September 30, 2016
(in thousands)
4. Fair Value Measurements (Continued)
Quoted Market Significant Other SignificantPrices in Active Observable Inputs Unobservable Inputs
Net Asset Value Markets (Level 1) (Level 2) (Level 3)
As of September 30, 2015Assets:
Pension planCash . . . . . . . . . . . . . . . . . . $ — $12,640 $ — $—Global securities . . . . . . . . . . 8,003 — — —Global equity fund . . . . . . . . 2,401 — — —
Deferred compensation planassetsTrust Assets . . . . . . . . . . . . . — 7,529 — —Insurance . . . . . . . . . . . . . . . — — 9,924 —
Liabilities:Pension plan . . . . . . . . . . . . . . — — (27,044) —Deferred compensation plan
liabilities . . . . . . . . . . . . . . . — — (19,461) —Long-term debt . . . . . . . . . . . . — — (567,240) —
As of September 30, 2016Assets:
Pension planCash . . . . . . . . . . . . . . . . . . $ — $15,048 $ — $—Government Securities . . . . . 3,240 — — —Liability Driven Investment . . 3,051 — — —Guernsey Unit Trust . . . . . . . 819 — — —Global Absolute Return . . . . 2,028 — — —
Deferred compensation planassetsTrust Assets . . . . . . . . . . . . . 2,145 — —Insurance . . . . . . . . . . . . . . . — 15,918 —
Liabilities:Pension plan . . . . . . . . . . . . . . — — (36,944) —Deferred compensation plan
liabilities . . . . . . . . . . . . . . . — — (20,080) —Long-term debt . . . . . . . . . . . . — — (771,560) —
Long-term debt is accounted for at book value.
The pension plan assets and liabilities and deferred compensation assets and liabilities are includedin Other non-current assets and Other non-current liabilities at September 30, 2015 and 2016.
F-22

EWT Holdings I Corp.
Notes to Audited Consolidated Financial Statements (Continued)
September 30, 2015 and September 30, 2016
(in thousands)
5. Accounts Receivable
Accounts receivable are summarized as follows:
September 30, 2015 September 30, 2016
Accounts Receivable . . . . . . . . . . . . . . . . . . . . . $162,063 $189,573Allowance for Doubtful Accounts . . . . . . . . . . . (1,572) (4,784)
$160,491 $184,789
The movement in the allowance for doubtful accounts was as follows:
Predecessor Successor
October 1, 2013 January 16, 2014through through September 30, September 30,
January 15, 2014 September 30, 2014 2015 2016
Balance at beginning of period . . . . $(6,882) $ — $ (869) $(1,572)Charged to costs and expenses . . . (485) (573) (779) (3,219)Write-offs . . . . . . . . . . . . . . . . . . 850 — 228 74Foreign currenty and other . . . . . 121 (296) (152) (67)
Balance at end of period . . . . . . . . . $(6,396) $ (869) $(1,572) $(4,784)
6. Inventories
The major classes of inventory, net are as follows:
September 30, 2015 September 30, 2016
Raw materials and supplies . . . . . . . . . . . . . . . . $ 47,100 $ 60,363Work in progress . . . . . . . . . . . . . . . . . . . . . . . 12,838 17,039Finished goods and products held for resale . . . . 33,834 39,961Costs of unbilled projects . . . . . . . . . . . . . . . . . 5,861 5,825Advance payment from customers . . . . . . . . . . . (1,919) (655)Reserves for excess and obsolete . . . . . . . . . . . . (5,103) (10,141)
$ 92,611 $112,392
F-23
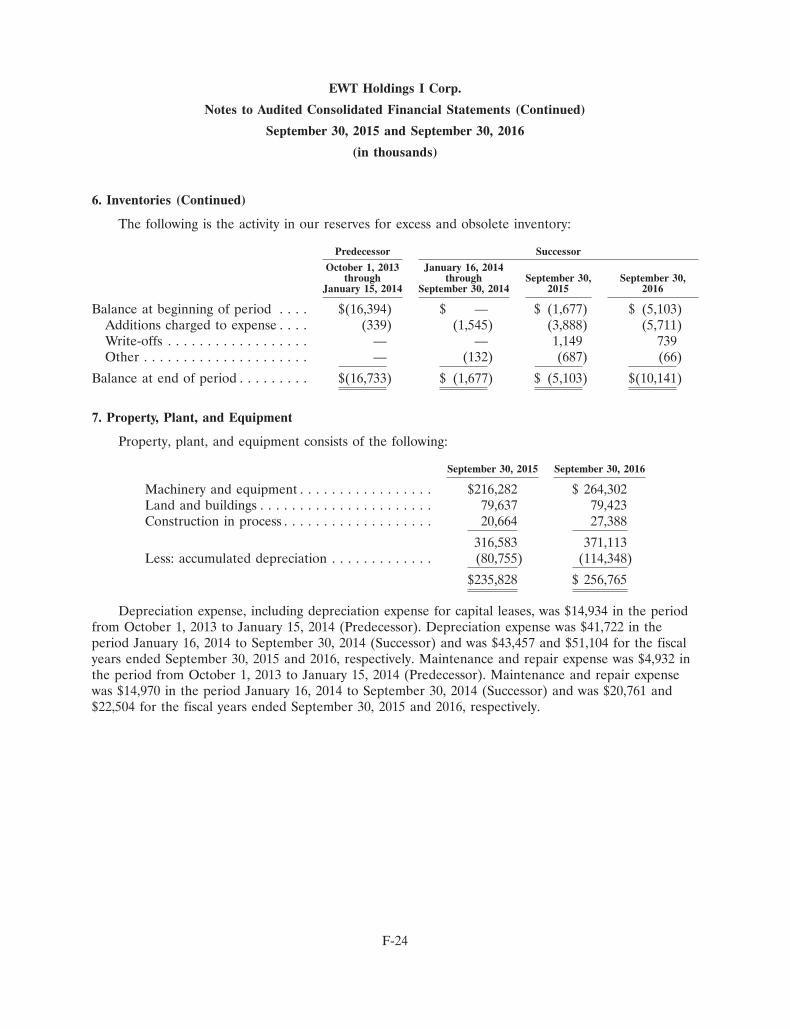
EWT Holdings I Corp.
Notes to Audited Consolidated Financial Statements (Continued)
September 30, 2015 and September 30, 2016
(in thousands)
6. Inventories (Continued)
The following is the activity in our reserves for excess and obsolete inventory:
Predecessor Successor
October 1, 2013 January 16, 2014through through September 30, September 30,
January 15, 2014 September 30, 2014 2015 2016
Balance at beginning of period . . . . $(16,394) $ — $ (1,677) $ (5,103)Additions charged to expense . . . . (339) (1,545) (3,888) (5,711)Write-offs . . . . . . . . . . . . . . . . . . — — 1,149 739Other . . . . . . . . . . . . . . . . . . . . . — (132) (687) (66)
Balance at end of period . . . . . . . . . $(16,733) $ (1,677) $ (5,103) $(10,141)
7. Property, Plant, and Equipment
Property, plant, and equipment consists of the following:
September 30, 2015 September 30, 2016
Machinery and equipment . . . . . . . . . . . . . . . . . $216,282 $ 264,302Land and buildings . . . . . . . . . . . . . . . . . . . . . . 79,637 79,423Construction in process . . . . . . . . . . . . . . . . . . . 20,664 27,388
316,583 371,113Less: accumulated depreciation . . . . . . . . . . . . . (80,755) (114,348)
$235,828 $ 256,765
Depreciation expense, including depreciation expense for capital leases, was $14,934 in the periodfrom October 1, 2013 to January 15, 2014 (Predecessor). Depreciation expense was $41,722 in theperiod January 16, 2014 to September 30, 2014 (Successor) and was $43,457 and $51,104 for the fiscalyears ended September 30, 2015 and 2016, respectively. Maintenance and repair expense was $4,932 inthe period from October 1, 2013 to January 15, 2014 (Predecessor). Maintenance and repair expensewas $14,970 in the period January 16, 2014 to September 30, 2014 (Successor) and was $20,761 and$22,504 for the fiscal years ended September 30, 2015 and 2016, respectively.
F-24

EWT Holdings I Corp.
Notes to Audited Consolidated Financial Statements (Continued)
September 30, 2015 and September 30, 2016
(in thousands)
8. Goodwill
Changes in the carrying amount of goodwill are as follows:
Predecessor Successor
October 1, 2013 January 16, 2014through through Year ended Year ended
January 15, 2014 September 30, 2014 September 30, 2015 September 30, 2016
Goodwill . . . . . . . . . . . . . . . . . $321,203 $ — $121,417 $113,583Accumulated Impairment Loss . (50,021) — — —Balance at beginning of period . 271,182 — 121,417 113,583Business combinations . . . . . . . — 122,778 — 153,890Measurement period adjustment — — (2,114) (247)Foreign currency translation . . . (69) (1,361) (5,720) 417Balance at end of period . . . . . $271,113 $121,417 $113,583 $267,643
The adjustment for the year ended September 30, 2015 is related to the finalization of thevaluation of the United Kingdom (UK) pension plan assets and liabilities, including consideration ofdeferred taxes in connection with the AEA acquisition.
As of September 30, 2015 and 2016, $36,350 and $129,083, respectively, of goodwill is deductiblefor tax purposes.
The Company reviewed the recoverability of the carrying value of goodwill at its reporting units.As the fair value of the Company’s reporting units was determined to be in excess of the carryingvalues at July 1, 2015 and 2016 no further analysis was performed.
9. Other Intangible Assets
Intangible assets consist of the following:September 30, 2015
Estimated Life Carrying Accumulated(years) Amount Amortization Net
Amortizing intangible assetsCustomer related . . . . . . . . . . . . . . . . . . . . . . . . . 5 - 16 $126,670 $ (13,937) $112,733Proprietary technology . . . . . . . . . . . . . . . . . . . . . 10 25,813 (4,410) 21,403Trademark . . . . . . . . . . . . . . . . . . . . . . . . . . . . . . 10 7,940 (1,357) 6,583Backlog . . . . . . . . . . . . . . . . . . . . . . . . . . . . . . . . 1 80,863 (80,863) —Licenses . . . . . . . . . . . . . . . . . . . . . . . . . . . . . . . 3 9,524 (5,081) 4,443Other . . . . . . . . . . . . . . . . . . . . . . . . . . . . . . . . . 4 1,366 (598) 768
Total amortizing intangible assets . . . . . . . . . . . . . . . 252,176 (106,246) 145,930Indefinite-lived intangible assets . . . . . . . . . . . . . . . . 34,207 — 34,207Total intangible assets . . . . . . . . . . . . . . . . . . . . . . . $286,383 $(106,246) $180,137
F-25
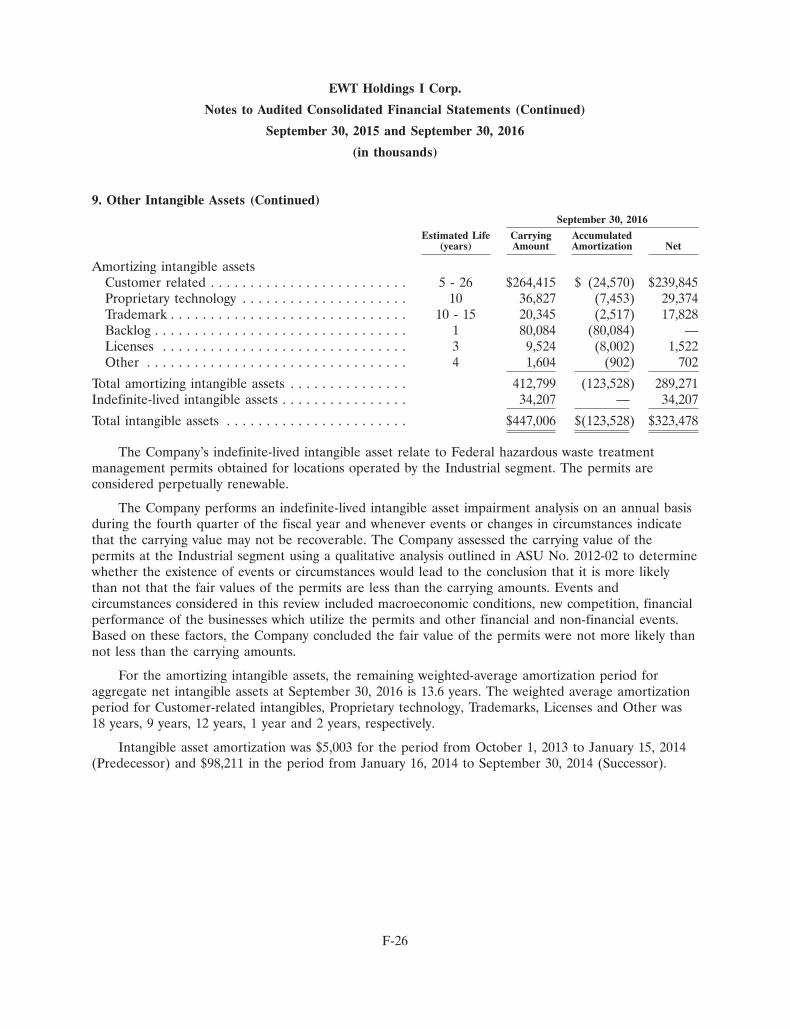
EWT Holdings I Corp.
Notes to Audited Consolidated Financial Statements (Continued)
September 30, 2015 and September 30, 2016
(in thousands)
9. Other Intangible Assets (Continued)September 30, 2016
Estimated Life Carrying Accumulated(years) Amount Amortization Net
Amortizing intangible assetsCustomer related . . . . . . . . . . . . . . . . . . . . . . . . . 5 - 26 $264,415 $ (24,570) $239,845Proprietary technology . . . . . . . . . . . . . . . . . . . . . 10 36,827 (7,453) 29,374Trademark . . . . . . . . . . . . . . . . . . . . . . . . . . . . . . 10 - 15 20,345 (2,517) 17,828Backlog . . . . . . . . . . . . . . . . . . . . . . . . . . . . . . . . 1 80,084 (80,084) —Licenses . . . . . . . . . . . . . . . . . . . . . . . . . . . . . . . 3 9,524 (8,002) 1,522Other . . . . . . . . . . . . . . . . . . . . . . . . . . . . . . . . . 4 1,604 (902) 702
Total amortizing intangible assets . . . . . . . . . . . . . . . 412,799 (123,528) 289,271Indefinite-lived intangible assets . . . . . . . . . . . . . . . . 34,207 — 34,207
Total intangible assets . . . . . . . . . . . . . . . . . . . . . . . $447,006 $(123,528) $323,478
The Company’s indefinite-lived intangible asset relate to Federal hazardous waste treatmentmanagement permits obtained for locations operated by the Industrial segment. The permits areconsidered perpetually renewable.
The Company performs an indefinite-lived intangible asset impairment analysis on an annual basisduring the fourth quarter of the fiscal year and whenever events or changes in circumstances indicatethat the carrying value may not be recoverable. The Company assessed the carrying value of thepermits at the Industrial segment using a qualitative analysis outlined in ASU No. 2012-02 to determinewhether the existence of events or circumstances would lead to the conclusion that it is more likelythan not that the fair values of the permits are less than the carrying amounts. Events andcircumstances considered in this review included macroeconomic conditions, new competition, financialperformance of the businesses which utilize the permits and other financial and non-financial events.Based on these factors, the Company concluded the fair value of the permits were not more likely thannot less than the carrying amounts.
For the amortizing intangible assets, the remaining weighted-average amortization period foraggregate net intangible assets at September 30, 2016 is 13.6 years. The weighted average amortizationperiod for Customer-related intangibles, Proprietary technology, Trademarks, Licenses and Other was18 years, 9 years, 12 years, 1 year and 2 years, respectively.
Intangible asset amortization was $5,003 for the period from October 1, 2013 to January 15, 2014(Predecessor) and $98,211 in the period from January 16, 2014 to September 30, 2014 (Successor).
F-26

EWT Holdings I Corp.
Notes to Audited Consolidated Financial Statements (Continued)
September 30, 2015 and September 30, 2016
(in thousands)
9. Other Intangible Assets (Continued)
Intangible asset amortization was $14,682 and $18,185 for the Company for the fiscal years endedSeptember 30, 2015 and 2016, respectively. The estimated future amortization expense is as follows:
Amount
Fiscal Year2017 . . . . . . . . . . . . . . . . . . . . . . . . . . . . . . . . . . . . . . . . . . . . . . . . . $ 20,2612018 . . . . . . . . . . . . . . . . . . . . . . . . . . . . . . . . . . . . . . . . . . . . . . . . . 19,1062019 . . . . . . . . . . . . . . . . . . . . . . . . . . . . . . . . . . . . . . . . . . . . . . . . . 18,8592020 . . . . . . . . . . . . . . . . . . . . . . . . . . . . . . . . . . . . . . . . . . . . . . . . . 18,5342021 . . . . . . . . . . . . . . . . . . . . . . . . . . . . . . . . . . . . . . . . . . . . . . . . . 18,413Thereafter . . . . . . . . . . . . . . . . . . . . . . . . . . . . . . . . . . . . . . . . . . . . . 228,305
Total . . . . . . . . . . . . . . . . . . . . . . . . . . . . . . . . . . . . . . . . . . . . . . . . . . . $323,478
10. Debt
Long-term debt consists of the following:
September 30, September 30,2015 2016
First Lien Term Facility, due January 15, 2021 . . . . . . . . $496,163 $491,113Second Lien Term Facility, due January 15, 2022 . . . . . . 75,000 75,000Incremental First Lien Facility, due January 15, 2021 . . . 184,075Revolving Credit Facility, due January 15, 2019 . . . . . . . . 18,000Notes Payable, due June 30, 2018 to July 31, 2023 . . . . . 11,223Total debt . . . . . . . . . . . . . . . . . . . . . . . . . . . . . . . . . . . 571,163 779,411
Less unamortized discount and lender fees . . . . . . . . . . . (19,081) (21,255)Total net debt . . . . . . . . . . . . . . . . . . . . . . . . . . . . . . . . 552,082 758,156
Less current portion . . . . . . . . . . . . . . . . . . . . . . . . . . . (5,050) (30,024)Total long-term debt . . . . . . . . . . . . . . . . . . . . . . . . . . . $547,032 $728,132
Term Facilities and Revolving Credit Facility
On January 15, 2014, EWT Holdings III Corp. entered into First and Second Lien Term LoanAgreements (the ‘‘Term Loan Agreements’’) among the Company, the lenders party thereto and CreditSuisse AG as Administrative Agent and Collateral Agent. The Term Loan Agreements providedseven-year term loan facilities, consisting of the First Lien Term Loan and Second Lien Term Loan inaggregate principal amounts of $505,000 and $75,000, respectively. The First Lien Term LoanAgreement also made available to the Company a $75,000 revolving credit facility (‘‘The Revolver’’),which contains a Letter of Credit sub-facility up to $35,000. The First and Second Lien borrowingswere issued at a discount to face value of .5% aggregating $2,900 and net of lender arrangement feesaggregating $16,700. Additional capitalized financing fees, including lender fees paid for the Revolving
F-27

EWT Holdings I Corp.
Notes to Audited Consolidated Financial Statements (Continued)
September 30, 2015 and September 30, 2016
(in thousands)
10. Debt (Continued)
Credit Facility placement, aggregated $5,483. Both of these amounts are included as a contra liability todebt of $19,081 and $15,556, net of amortization, at September 30, 2015 and 2016, respectively.
The First Lien Term Loan bears interest based on a variable rate subject to a 1% floor + 3.75%spread. As of September 30, 2016, the applicable First Lien Term Loan interest rate was 4.75%. FirstLien principal and interest is payable in quarterly installments, with quarterly principal reductions of$1,263, and the balance due at maturity. The Second Lien Term Loan bears interest at 8.5% payablequarterly with the principal balance due at maturity.
In April, 2016 the Company issued an Incremental First Lien Term Loan (the ‘‘Incremental FirstLien’’), in an aggregate principal amount of $185,000, with a 1% discount. The Company also incurred$6,296 of financing fees related to this debt, $1,850 related to the 1% discount and $4,446 related toadditional capitalized financing fees. Both of these amounts are included as a contra liability to debtand total $5,689 net of amortization at September 30, 2016.
The proceeds of the Incremental First Lien facility were used to finance the acquisition ofNeptune-Benson. The Incremental First Lien bears interest based on a variable rate subject to a 1%floor + 4.5% spread, with quarterly interest payments and principal reductions of $462.5 throughmaturity. As of September 30, 2016, the applicable Incremental First Lien interest rate was 5.5%. Theincremental Term Loan is coterminous with the existing First and Second Lien Term Loan facilities.
As of September 30, 2015 and 2016, the Company had outstanding revolver borrowings of $0 and$18,000, respectively with an unused portion of $75,000 and $57,000, respectively. Borrowings under thefacility at September 30, 2015, would have incurred interest at a rate of 3.58% (LIBOR plus 325 basispoints). The weighted average interest rate on the outstanding borrowing as of September 30, 2016 was4.66%. Borrowings under the Revolving Credit Facility bear interest at variable rates plus a marginranging from 225 to 325 basis points, dependent on the Company’s leverage ratio and Variable Rateselected.
The Company has borrowing availability under the Revolving Credit Facility of $75,000, reducedfor outstanding letter of credit guarantees. Such letter of credit guarantees are subject to a $35,000sublimit within the Revolving Credit Facility. The Company’s outstanding letter of credit guaranteesunder this agreement aggregated approximately $20,238 and $9,742 at September 30, 2015 and 2016,respectively. The Company has issued additional letters of credit of $8,386 under a separatearrangement.
The Term Loan Agreements contain limitations on incremental borrowings, are subject to leverageratios and allow for prepayment. Under certain circumstances beginning with fiscal 2015 results ofoperations, the Company may be required to remit excess cash flows as defined based upon exceedingcertain leverage ratios. The Company did not exceed such ratios during fiscal 2016, does not anticipateexceeding such ratios during 2017, and therefore does not anticipate any additional repayments during2017.
F-28

EWT Holdings I Corp.
Notes to Audited Consolidated Financial Statements (Continued)
September 30, 2015 and September 30, 2016
(in thousands)
10. Debt (Continued)
Notes Payable
As of September 30, 2016, the Company had notes payable in an aggregate outstanding amount of$11,223, with interest rates ranging from 6.26% to 7.39%, and due dates ranging from June 30, 2018 toJuly 31, 2023. These notes are related to certain equipment related contracts and are secured by theunderlying equipment and assignment of the related contracts.
Repayment Schedule
Aggregate maturities of all long-term debt, including current portion of long-term debt andexcluding capital lease obligations as of September 30, 2016, are presented below:
Fiscal Year2017 . . . . . . . . . . . . . . . . . . . . . . . . . . . . . . . . . . . . . . . . . . . . . . . . . . 30,0242018 . . . . . . . . . . . . . . . . . . . . . . . . . . . . . . . . . . . . . . . . . . . . . . . . . . 10,8932019 . . . . . . . . . . . . . . . . . . . . . . . . . . . . . . . . . . . . . . . . . . . . . . . . . . 7,4212020 . . . . . . . . . . . . . . . . . . . . . . . . . . . . . . . . . . . . . . . . . . . . . . . . . . 7,3202021 . . . . . . . . . . . . . . . . . . . . . . . . . . . . . . . . . . . . . . . . . . . . . . . . . . 723,035Thereafter . . . . . . . . . . . . . . . . . . . . . . . . . . . . . . . . . . . . . . . . . . . . . . 718
Total . . . . . . . . . . . . . . . . . . . . . . . . . . . . . . . . . . . . . . . . . . . . . . . . . . . 779,411
11. Product Warranties
The Company accrues warranty obligations associated with certain products as revenue isrecognized. Provisions for the warranty obligations are based upon historical experience of costsincurred for such obligations, adjusted for site-specific risk factors and as necessary, for currentconditions and factors. There are significant uncertainties and judgments involved in estimatingwarranty obligations, including changing product designs, differences in customer installation processesand future claims experience which may vary from historical claims experience.
A reconciliation of the activity related to the accrued warranty, including both the current andlong-term portions, is as follows:
Predecessor Successor
October 1, 2013 October 16, 2014 Year ended Year endedthrough through September 30, September 30,
January 15, 2014 September 30, 2014 2015 2016
Balance at beginning of the period . . . . . $44,861 $ — $ 38,947 $ 31,758Business combination recognition . . . . — 45,187 — —Warranty provision for sales . . . . . . . . 5,354 6,376 6,646 8,994Settlement of warranty claims . . . . . . . (4,764) (13,119) (12,199) (15,785)Foreign currency and other . . . . . . . . (264) 503 (1,636) (1,658)
Balance at end of the period . . . . . . . . . $45,187 $ 38,947 $ 31,758 $ 23,309
F-29
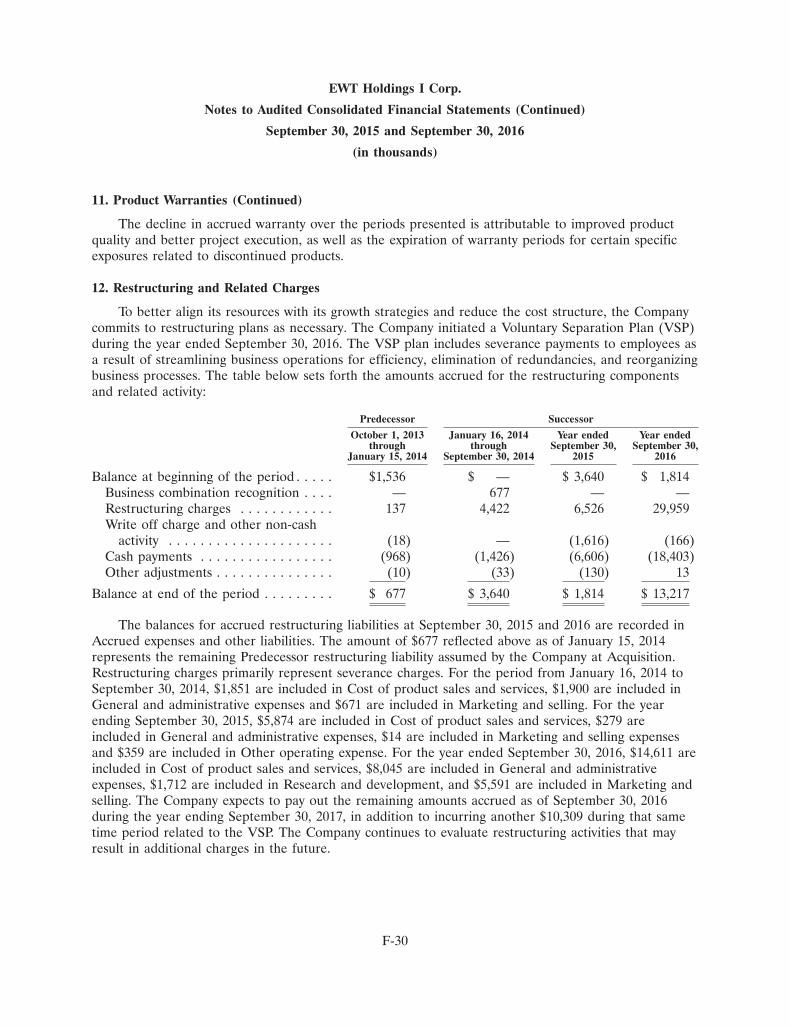
EWT Holdings I Corp.
Notes to Audited Consolidated Financial Statements (Continued)
September 30, 2015 and September 30, 2016
(in thousands)
11. Product Warranties (Continued)
The decline in accrued warranty over the periods presented is attributable to improved productquality and better project execution, as well as the expiration of warranty periods for certain specificexposures related to discontinued products.
12. Restructuring and Related Charges
To better align its resources with its growth strategies and reduce the cost structure, the Companycommits to restructuring plans as necessary. The Company initiated a Voluntary Separation Plan (VSP)during the year ended September 30, 2016. The VSP plan includes severance payments to employees asa result of streamlining business operations for efficiency, elimination of redundancies, and reorganizingbusiness processes. The table below sets forth the amounts accrued for the restructuring componentsand related activity:
Predecessor Successor
October 1, 2013 January 16, 2014 Year ended Year endedthrough through September 30, September 30,
January 15, 2014 September 30, 2014 2015 2016
Balance at beginning of the period . . . . . $1,536 $ — $ 3,640 $ 1,814Business combination recognition . . . . — 677 — —Restructuring charges . . . . . . . . . . . . 137 4,422 6,526 29,959Write off charge and other non-cash
activity . . . . . . . . . . . . . . . . . . . . . (18) — (1,616) (166)Cash payments . . . . . . . . . . . . . . . . . (968) (1,426) (6,606) (18,403)Other adjustments . . . . . . . . . . . . . . . (10) (33) (130) 13
Balance at end of the period . . . . . . . . . $ 677 $ 3,640 $ 1,814 $ 13,217
The balances for accrued restructuring liabilities at September 30, 2015 and 2016 are recorded inAccrued expenses and other liabilities. The amount of $677 reflected above as of January 15, 2014represents the remaining Predecessor restructuring liability assumed by the Company at Acquisition.Restructuring charges primarily represent severance charges. For the period from January 16, 2014 toSeptember 30, 2014, $1,851 are included in Cost of product sales and services, $1,900 are included inGeneral and administrative expenses and $671 are included in Marketing and selling. For the yearending September 30, 2015, $5,874 are included in Cost of product sales and services, $279 areincluded in General and administrative expenses, $14 are included in Marketing and selling expensesand $359 are included in Other operating expense. For the year ended September 30, 2016, $14,611 areincluded in Cost of product sales and services, $8,045 are included in General and administrativeexpenses, $1,712 are included in Research and development, and $5,591 are included in Marketing andselling. The Company expects to pay out the remaining amounts accrued as of September 30, 2016during the year ending September 30, 2017, in addition to incurring another $10,309 during that sametime period related to the VSP. The Company continues to evaluate restructuring activities that mayresult in additional charges in the future.
F-30

EWT Holdings I Corp.
Notes to Audited Consolidated Financial Statements (Continued)
September 30, 2015 and September 30, 2016
(in thousands)
13. Employee Benefit Plans
The Company maintains multiple employee benefit plans.
The Predecessor’s eligible U.S and non-U.S. employees participated in Siemens’ defined pensionplans and the plan’s aggregate assets and liabilities were combined with those related to other Siemens’businesses. Pension expenses were determined on a multiemployer plan basis and were included inOther operating expense in the Consolidated Statements of Operations and Comprehensive Loss.Retirement plan expenses allocated to the Predecessor amounted to $1,123 for the period fromOctober 1, 2013 to January 15, 2014.
Certain of the Company’s employees in the UK were participants in a Siemen’s defined benefitplan established for employees of a UK-based operation acquired by Siemens in 2004. The plan wasfrozen with respect to future service credits for active employees, however the benefit formularecognized future compensation increases. The Company agreed to establish a replacement definedbenefit plan, with the assets of the Siemens scheme transferring to the new scheme on April 1, 2015.Assets transferred amounted to $10,692 offset by $8,723 of plan liabilities. Siemens has also agreed toretain the pension obligation for inactive vested participants.
The Company’s employees in Germany also participate in a defined benefit plan. Assets equalingthe plan’s accumulated benefit obligation were transferred to a German defined benefit plan sponsoredby the Company upon the acquisition of EWT from Siemens. The German entity also sponsors adefined benefit plan for a small group of employees located in France.
F-31

EWT Holdings I Corp.
Notes to Audited Consolidated Financial Statements (Continued)
September 30, 2015 and September 30, 2016
(in thousands)
13. Employee Benefit Plans (Continued)
The changes in projected benefit obligations, plan assets and the funded status of the defined benefitplans as of and for the fiscal year ending September 30, 2015 and 2016, respectively, are as follows:
UK & German UK & GermanPlans Plans
2015 2016
Change in projected benefit obligationProjected benefit obligation at prior year measurement
date . . . . . . . . . . . . . . . . . . . . . . . . . . . . . . . . . . . . $19,930 $ 27,044Service cost . . . . . . . . . . . . . . . . . . . . . . . . . . . . . . . . . 837 829Interest cost . . . . . . . . . . . . . . . . . . . . . . . . . . . . . . . . 589 728Transfer of benefit obligations from predecessor . . . . . . 8,723 —Actuarial (gains) losses . . . . . . . . . . . . . . . . . . . . . . . . (1,118) 9,723Benefits paid from company assets . . . . . . . . . . . . . . . . (54) (16)Foreign currency exchange impact . . . . . . . . . . . . . . . . (1,863) (1,364)
Projected benefit obligation at measurement date . . . . . 27,044 36,944
Change in plan assetsFair value of assets at prior year measurement date . . . . 13,837 23,044Actual return on plan assets . . . . . . . . . . . . . . . . . . . . . (485) 2,437Transfer of assets by predecessor . . . . . . . . . . . . . . . . . 10,692 —Benefits paid . . . . . . . . . . . . . . . . . . . . . . . . . . . . . . . . — (13)Employer contribution . . . . . . . . . . . . . . . . . . . . . . . . . 250 205Foreign currency exchange impact . . . . . . . . . . . . . . . . (1,250) (1,487)
Fair value of assets at measurement date . . . . . . . . . . . 23,044 24,186
Funded status and amount recognized in assets andliabilities . . . . . . . . . . . . . . . . . . . . . . . . . . . . . . . . . $ (4,000) $(12,758)
Amount recognized in assets and liabilitiesOther non-current assets . . . . . . . . . . . . . . . . . . . . . . . $ 2,414 $ 1,794Other non-current liabilities . . . . . . . . . . . . . . . . . . . . . $ (6,414) $(14,552)
Amount recognized in accumulated othercomprehensive loss, before taxes
Actuarial loss . . . . . . . . . . . . . . . . . . . . . . . . . . . . . . . $ 2,275 $ 9,926
F-32

EWT Holdings I Corp.
Notes to Audited Consolidated Financial Statements (Continued)
September 30, 2015 and September 30, 2016
(in thousands)
13. Employee Benefit Plans (Continued)
The following table provides summary information for the German plan where the projectedbenefit obligation and accumulated benefit obligation are in excess of plan assets:
2015 2016
Projected benefit obligation . . . . . . . . . . . . . . . . . . . . . . . . . . . . $18,975 $27,361Accumulated benefit obligation . . . . . . . . . . . . . . . . . . . . . . . . . 16,625 24,117Fair value of plan assets . . . . . . . . . . . . . . . . . . . . . . . . . . . . . . 12,561 12,809
The weighted average assumptions in the following table represent the rates used to develop theactuarial present value of the projected benefit obligation for the year indicated as well as net periodicpension cost for the following year. The discount rate is based on settling the obligation with highgrade, high yield corporate bonds, and the rate of compensation increase is based upon actualexperience. The expected return on assets is based on historical performance as well as expected futurerates of return on plan assets considering the current investment portfolio mix and the long-terminvestment strategy.
2015 2016
Discount rate . . . . . . . . . . . . . . . . . . . . . . . . . . . 2.50% - 4.15% 1.20% - 2.60%Expected long-term rate of return on plan assets . . 1.25% - 3.57% 1.25% - 2.63%Salary scale . . . . . . . . . . . . . . . . . . . . . . . . . . . . . 2.25% - 4.80% 2.25% - 4.75%Pension increases . . . . . . . . . . . . . . . . . . . . . . . . 1.00% - 3.20% 1.00% - 3.15%
The Plan trustees for the UK and German pension plans have established investment policies andstrategies. In 2016 the UK Pension Committee established and implemented a liability driveninvestment approach to take advantage of, and seeking to protect, its well-funded status. The Germanpension fund committee has determined a direction on an investment manager who will provide adviceon pension asset allocation as well as implement investment solutions.
The company elected to early adopt ASU 2015-07, Disclosures for investments in certain entities thatcalculate net asset value per share (or its equivalent), during the year ended September 30, 2016 andapplied this retrospectively. ASU 2015-07 permits a reporting entity to measure the fair value of certaininvestments it owns using the net asset value (NAV) per share of the investment, or the ‘practicalexpedient’. The purpose of this update is to develop a reporting methodology that is consistent acrossall reporting entities. See footnote four, Fair Value, for disclosure of the plan assets underASU 2015-07.
Through a trust arrangement, the German plan assets are held in cash at a German bank.The actual overall asset allocation for the UK pension plan as compared to the investment policy
goals as of September 30, 2016 was as follows:
2016 Target 2016 Actual
Asset CategoryEquity . . . . . . . . . . . . . . . . . . . . . . . . . . . . . . . . . . . . . . 23.5% 25%Index-linked gilts . . . . . . . . . . . . . . . . . . . . . . . . . . . . . . . 76.5% 55%Cash . . . . . . . . . . . . . . . . . . . . . . . . . . . . . . . . . . . . . . . . 0% 20%
F-33
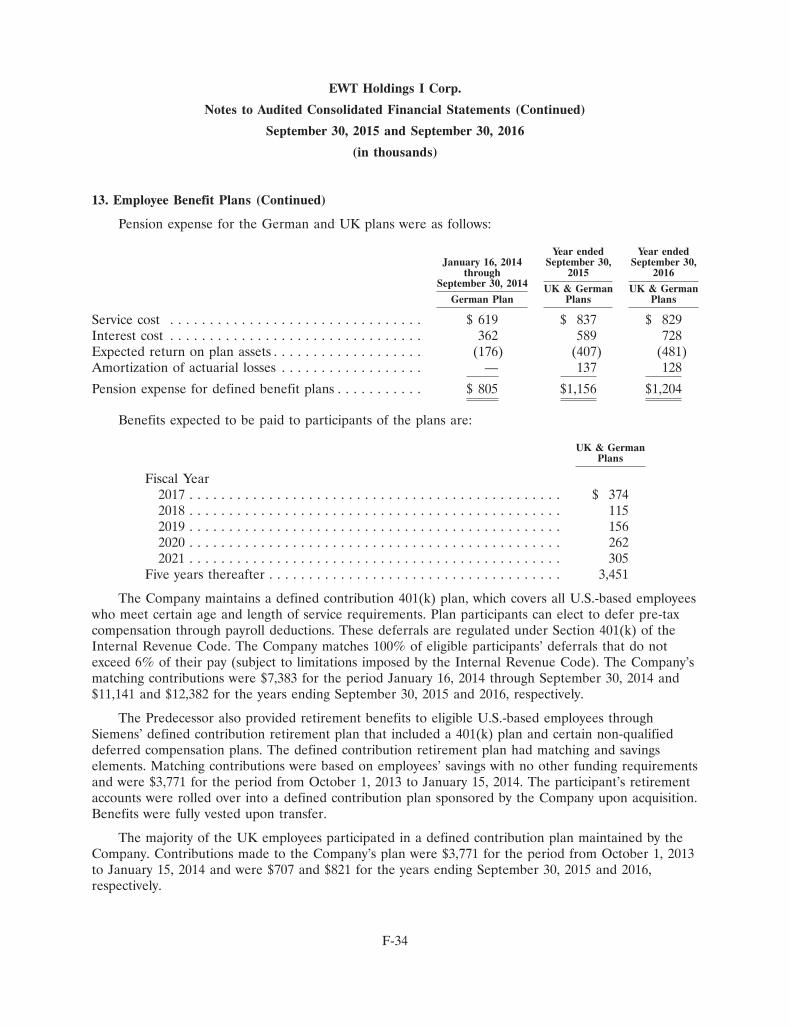
EWT Holdings I Corp.
Notes to Audited Consolidated Financial Statements (Continued)
September 30, 2015 and September 30, 2016
(in thousands)
13. Employee Benefit Plans (Continued)
Pension expense for the German and UK plans were as follows:
Year ended Year endedJanuary 16, 2014 September 30, September 30,
through 2015 2016September 30, 2014 UK & German UK & German
German Plan Plans Plans
Service cost . . . . . . . . . . . . . . . . . . . . . . . . . . . . . . . . $ 619 $ 837 $ 829Interest cost . . . . . . . . . . . . . . . . . . . . . . . . . . . . . . . . 362 589 728Expected return on plan assets . . . . . . . . . . . . . . . . . . . (176) (407) (481)Amortization of actuarial losses . . . . . . . . . . . . . . . . . . — 137 128
Pension expense for defined benefit plans . . . . . . . . . . . $ 805 $1,156 $1,204
Benefits expected to be paid to participants of the plans are:
UK & GermanPlans
Fiscal Year2017 . . . . . . . . . . . . . . . . . . . . . . . . . . . . . . . . . . . . . . . . . . . . . . . $ 3742018 . . . . . . . . . . . . . . . . . . . . . . . . . . . . . . . . . . . . . . . . . . . . . . . 1152019 . . . . . . . . . . . . . . . . . . . . . . . . . . . . . . . . . . . . . . . . . . . . . . . 1562020 . . . . . . . . . . . . . . . . . . . . . . . . . . . . . . . . . . . . . . . . . . . . . . . 2622021 . . . . . . . . . . . . . . . . . . . . . . . . . . . . . . . . . . . . . . . . . . . . . . . 305
Five years thereafter . . . . . . . . . . . . . . . . . . . . . . . . . . . . . . . . . . . . . 3,451
The Company maintains a defined contribution 401(k) plan, which covers all U.S.-based employeeswho meet certain age and length of service requirements. Plan participants can elect to defer pre-taxcompensation through payroll deductions. These deferrals are regulated under Section 401(k) of theInternal Revenue Code. The Company matches 100% of eligible participants’ deferrals that do notexceed 6% of their pay (subject to limitations imposed by the Internal Revenue Code). The Company’smatching contributions were $7,383 for the period January 16, 2014 through September 30, 2014 and$11,141 and $12,382 for the years ending September 30, 2015 and 2016, respectively.
The Predecessor also provided retirement benefits to eligible U.S.-based employees throughSiemens’ defined contribution retirement plan that included a 401(k) plan and certain non-qualifieddeferred compensation plans. The defined contribution retirement plan had matching and savingselements. Matching contributions were based on employees’ savings with no other funding requirementsand were $3,771 for the period from October 1, 2013 to January 15, 2014. The participant’s retirementaccounts were rolled over into a defined contribution plan sponsored by the Company upon acquisition.Benefits were fully vested upon transfer.
The majority of the UK employees participated in a defined contribution plan maintained by theCompany. Contributions made to the Company’s plan were $3,771 for the period from October 1, 2013to January 15, 2014 and were $707 and $821 for the years ending September 30, 2015 and 2016,respectively.
F-34

EWT Holdings I Corp.
Notes to Audited Consolidated Financial Statements (Continued)
September 30, 2015 and September 30, 2016
(in thousands)
13. Employee Benefit Plans (Continued)
Deferred Compensation
On April 1, 2014, the Company adopted a non-qualified deferred compensation plan for certainhighly compensated employees. The Plan matches on a dollar-for-dollar basis, up to the first 6% of aparticipants’ pay. The Company’s obligation under the plan represents an unsecured promise to paybenefits in the future. In the event of bankruptcy or insolvency of the Company, assets of the planwould be available to satisfy the claims of general creditors. To increase the security of the participants’deferred compensation plan benefits, the Company has established and funded a grantor trust (knownas a rabbi trust). The rabbi trust is specifically designed so that assets are available to pay plan benefitsto participants in the event the Company is unwilling or unable to pay the plan benefits for any reasonother than bankruptcy or insolvency. As a result, the Company is prevented from withdrawing oraccessing assets for corporate needs. Plan participants choose to receive a return on their accountbalances equal to the return on the various investment options. The rabbi trust assets are primarilyinvested in mutual funds and insurance contracts of which the rabbi trust is the owner and beneficiary.
Health Benefit Plan
The Company maintains a qualified employee health benefit plan in the U.S. and is self-funded bythe Company with respect to claims up to a certain amount. The plan requires contributions fromeligible employees and their dependents.
14. Income Taxes
The Predecessor U.S. and non-U.S. operations were part of Siemens and were included in certainof Siemens’ consolidated income tax returns. The tax provisions of the Predecessor were prepared on astand-alone basis, as if the Predecessor was a separate group of companies under common ownership.The Predecessor assumes that, in the event a tax attribute was utilized by Siemens on a consolidated orcombined return, the Predecessor has realized the benefits of the tax attribute and records theutilization as a current benefit and a transfer to Siemens. The operations were combined as if thePredecessor was filing on a consolidated basis for federal and state income tax purposes. The non-U.S.tax provision was determined on a stand-alone basis for each non-U.S. affiliate.
As of September 30, 2014, 2015, and 2016, undistributed earnings of non-U.S. affiliates wereapproximately $0, $0 and $2,170, respectively, which are considered permanently invested with nodeferred taxes provided. Because the Company does not have any plans to repatriate the funds, theCompany cannot determine the impact of local taxes, withholding taxes and foreign tax creditsassociated with the future repatriation of such earnings and, therefore, cannot reasonably estimate theassociated tax liability.
F-35

EWT Holdings I Corp.
Notes to Audited Consolidated Financial Statements (Continued)
September 30, 2015 and September 30, 2016
(in thousands)
14. Income Taxes (Continued)
For financial reporting purposes, loss before income taxes includes the following components:
Predecessor Successor
October 1, 2013 January 16, 2014through through Year ended Year ended
January 15, 2014 September 30, 2014 September 30, 2015 September 30, 2016
United States . . . . . . . . . . . . . $(2,157) $ (99,882) $(33,360) $(1,941)Rest of World . . . . . . . . . . . . (1,318) (46,340) (4,786) (3,422)
Total . . . . . . . . . . . . . . . . . . . $(3,475) $(146,222) $(38,146) $(5,363)
The components of income tax expense (benefit) were as follows:
Predecessor Successor
October 1, 2013 January 16, 2014through through Year ended Year ended
January 15, 2014 September 30, 2014 September 30, 2015 September 30, 2016
Current:Federal . . . . . . . . . . . . . . $ 967 $ — $ — $ —State . . . . . . . . . . . . . . . . 177 — (131) 678Rest of World . . . . . . . . . 293 3,951 2,782 2,143
1,437 3,951 2,651 2,821
Deferred:Federal . . . . . . . . . . . . . . (1,029) (31,744) 34,789 (18,638)State . . . . . . . . . . . . . . . . (188) (5,789) 6,243 (1,402)Rest of World . . . . . . . . . (1,393) (14,883) 4,222 (1,175)
(2,610) (52,416) 45,254 (21,215)Total tax (benefit) expense . . . $(1,173) $(48,465) $47,905 $(18,394)
F-36

EWT Holdings I Corp.
Notes to Audited Consolidated Financial Statements (Continued)
September 30, 2015 and September 30, 2016
(in thousands)
14. Income Taxes (Continued)
A reconciliation of income tax expense and the amount computed by applying the statutory federalincome tax rate of 35% to income from operations before income taxes was as follows:
Predecessor Successor
October 1, 2013 January 16, 2014 Year ended Year endedthrough through September 30, September 30,
January 15, 2014 September 30, 2014 2015 2016
Income tax benefit at thefederal statutory rate . . . . . . $(1,213) $(51,280) $(13,058) $ (1,877)
State and local income taxes,net of federal tax benefit . . . 24 (3,763) (112) 791
Foreign tax rate differential(based on local statutoryrates ranging from 17% to30%) . . . . . . . . . . . . . . . . . 337 5,316 399 (272)
Contingent liabilities—warranty . . . . . . . . . . . . . . . — — (1,651) (236)
Contingent liabilities—long-term disability . . . . . . . — — (670) (189)
Transaction expense . . . . . . . . — 834 — —Interest expense . . . . . . . . . . . — — — 1,141Meals and entertainment
expense . . . . . . . . . . . . . . . 140 419 518 601Other permanent differences . . — — — (872)Provision to return
adjustments . . . . . . . . . . . . — — (1,112) (168)Valuation allowances . . . . . . . — — 63,470 (17,714)Other . . . . . . . . . . . . . . . . . . (461) 9 121 401Total . . . . . . . . . . . . . . . . . . . $(1,173) $(48,465) $ 47,905 $(18,394)
F-37
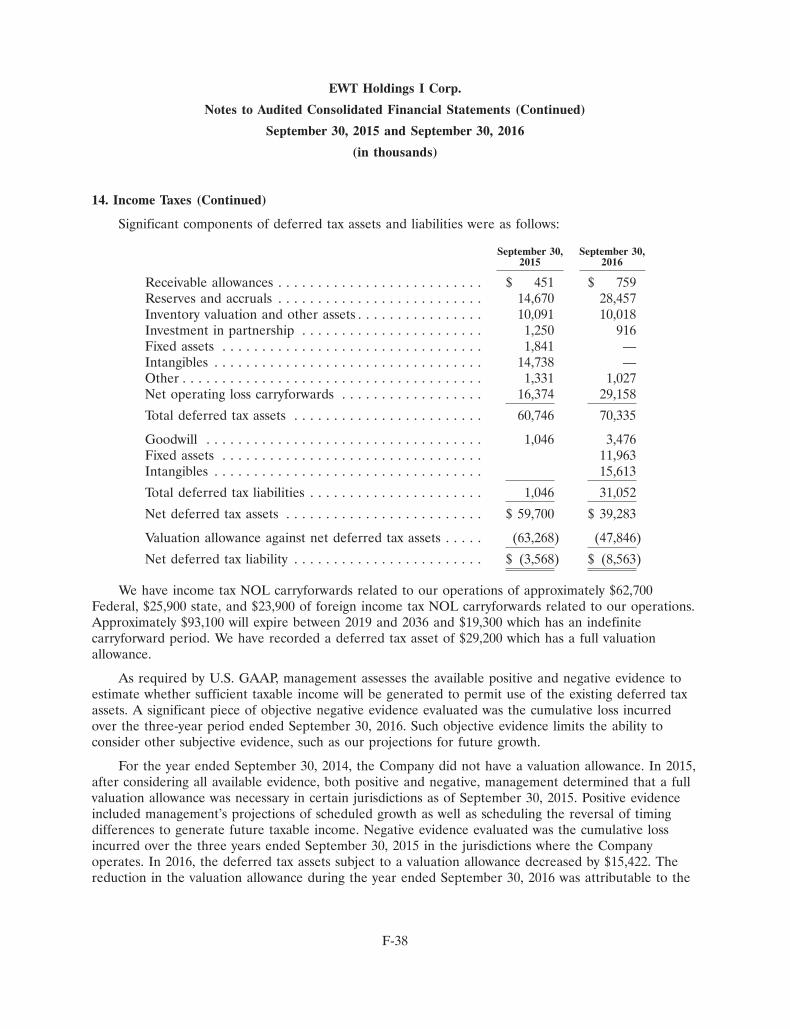
EWT Holdings I Corp.
Notes to Audited Consolidated Financial Statements (Continued)
September 30, 2015 and September 30, 2016
(in thousands)
14. Income Taxes (Continued)
Significant components of deferred tax assets and liabilities were as follows:
September 30, September 30,2015 2016
Receivable allowances . . . . . . . . . . . . . . . . . . . . . . . . . . $ 451 $ 759Reserves and accruals . . . . . . . . . . . . . . . . . . . . . . . . . . 14,670 28,457Inventory valuation and other assets . . . . . . . . . . . . . . . . 10,091 10,018Investment in partnership . . . . . . . . . . . . . . . . . . . . . . . 1,250 916Fixed assets . . . . . . . . . . . . . . . . . . . . . . . . . . . . . . . . . 1,841 —Intangibles . . . . . . . . . . . . . . . . . . . . . . . . . . . . . . . . . . 14,738 —Other . . . . . . . . . . . . . . . . . . . . . . . . . . . . . . . . . . . . . . 1,331 1,027Net operating loss carryforwards . . . . . . . . . . . . . . . . . . 16,374 29,158
Total deferred tax assets . . . . . . . . . . . . . . . . . . . . . . . . 60,746 70,335
Goodwill . . . . . . . . . . . . . . . . . . . . . . . . . . . . . . . . . . . 1,046 3,476Fixed assets . . . . . . . . . . . . . . . . . . . . . . . . . . . . . . . . . 11,963Intangibles . . . . . . . . . . . . . . . . . . . . . . . . . . . . . . . . . . 15,613
Total deferred tax liabilities . . . . . . . . . . . . . . . . . . . . . . 1,046 31,052
Net deferred tax assets . . . . . . . . . . . . . . . . . . . . . . . . . $ 59,700 $ 39,283
Valuation allowance against net deferred tax assets . . . . . (63,268) (47,846)
Net deferred tax liability . . . . . . . . . . . . . . . . . . . . . . . . $ (3,568) $ (8,563)
We have income tax NOL carryforwards related to our operations of approximately $62,700Federal, $25,900 state, and $23,900 of foreign income tax NOL carryforwards related to our operations.Approximately $93,100 will expire between 2019 and 2036 and $19,300 which has an indefinitecarryforward period. We have recorded a deferred tax asset of $29,200 which has a full valuationallowance.
As required by U.S. GAAP, management assesses the available positive and negative evidence toestimate whether sufficient taxable income will be generated to permit use of the existing deferred taxassets. A significant piece of objective negative evidence evaluated was the cumulative loss incurredover the three-year period ended September 30, 2016. Such objective evidence limits the ability toconsider other subjective evidence, such as our projections for future growth.
For the year ended September 30, 2014, the Company did not have a valuation allowance. In 2015,after considering all available evidence, both positive and negative, management determined that a fullvaluation allowance was necessary in certain jurisdictions as of September 30, 2015. Positive evidenceincluded management’s projections of scheduled growth as well as scheduling the reversal of timingdifferences to generate future taxable income. Negative evidence evaluated was the cumulative lossincurred over the three years ended September 30, 2015 in the jurisdictions where the Companyoperates. In 2016, the deferred tax assets subject to a valuation allowance decreased by $15,422. Thereduction in the valuation allowance during the year ended September 30, 2016 was attributable to the
F-38
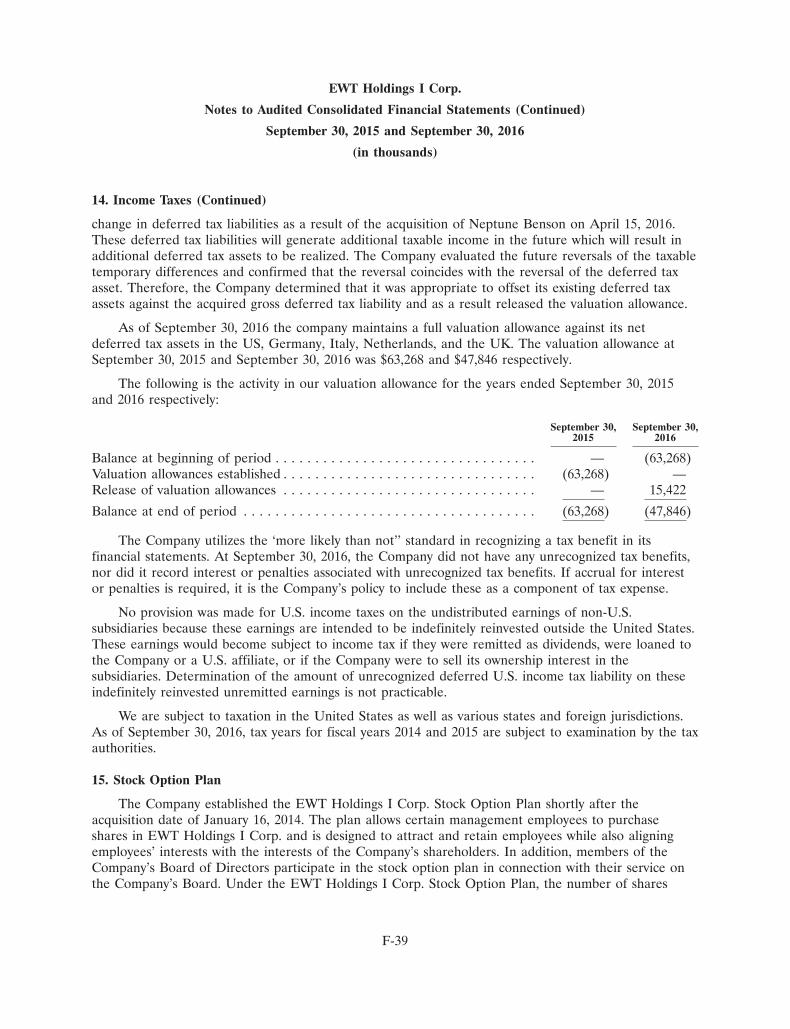
EWT Holdings I Corp.
Notes to Audited Consolidated Financial Statements (Continued)
September 30, 2015 and September 30, 2016
(in thousands)
14. Income Taxes (Continued)
change in deferred tax liabilities as a result of the acquisition of Neptune Benson on April 15, 2016.These deferred tax liabilities will generate additional taxable income in the future which will result inadditional deferred tax assets to be realized. The Company evaluated the future reversals of the taxabletemporary differences and confirmed that the reversal coincides with the reversal of the deferred taxasset. Therefore, the Company determined that it was appropriate to offset its existing deferred taxassets against the acquired gross deferred tax liability and as a result released the valuation allowance.
As of September 30, 2016 the company maintains a full valuation allowance against its netdeferred tax assets in the US, Germany, Italy, Netherlands, and the UK. The valuation allowance atSeptember 30, 2015 and September 30, 2016 was $63,268 and $47,846 respectively.
The following is the activity in our valuation allowance for the years ended September 30, 2015and 2016 respectively:
September 30, September 30,2015 2016
Balance at beginning of period . . . . . . . . . . . . . . . . . . . . . . . . . . . . . . . . . — (63,268)Valuation allowances established . . . . . . . . . . . . . . . . . . . . . . . . . . . . . . . . (63,268) —Release of valuation allowances . . . . . . . . . . . . . . . . . . . . . . . . . . . . . . . . — 15,422
Balance at end of period . . . . . . . . . . . . . . . . . . . . . . . . . . . . . . . . . . . . . (63,268) (47,846)
The Company utilizes the ‘more likely than not’’ standard in recognizing a tax benefit in itsfinancial statements. At September 30, 2016, the Company did not have any unrecognized tax benefits,nor did it record interest or penalties associated with unrecognized tax benefits. If accrual for interestor penalties is required, it is the Company’s policy to include these as a component of tax expense.
No provision was made for U.S. income taxes on the undistributed earnings of non-U.S.subsidiaries because these earnings are intended to be indefinitely reinvested outside the United States.These earnings would become subject to income tax if they were remitted as dividends, were loaned tothe Company or a U.S. affiliate, or if the Company were to sell its ownership interest in thesubsidiaries. Determination of the amount of unrecognized deferred U.S. income tax liability on theseindefinitely reinvested unremitted earnings is not practicable.
We are subject to taxation in the United States as well as various states and foreign jurisdictions.As of September 30, 2016, tax years for fiscal years 2014 and 2015 are subject to examination by the taxauthorities.
15. Stock Option Plan
The Company established the EWT Holdings I Corp. Stock Option Plan shortly after theacquisition date of January 16, 2014. The plan allows certain management employees to purchaseshares in EWT Holdings I Corp. and is designed to attract and retain employees while also aligningemployees’ interests with the interests of the Company’s shareholders. In addition, members of theCompany’s Board of Directors participate in the stock option plan in connection with their service onthe Company’s Board. Under the EWT Holdings I Corp. Stock Option Plan, the number of shares
F-39
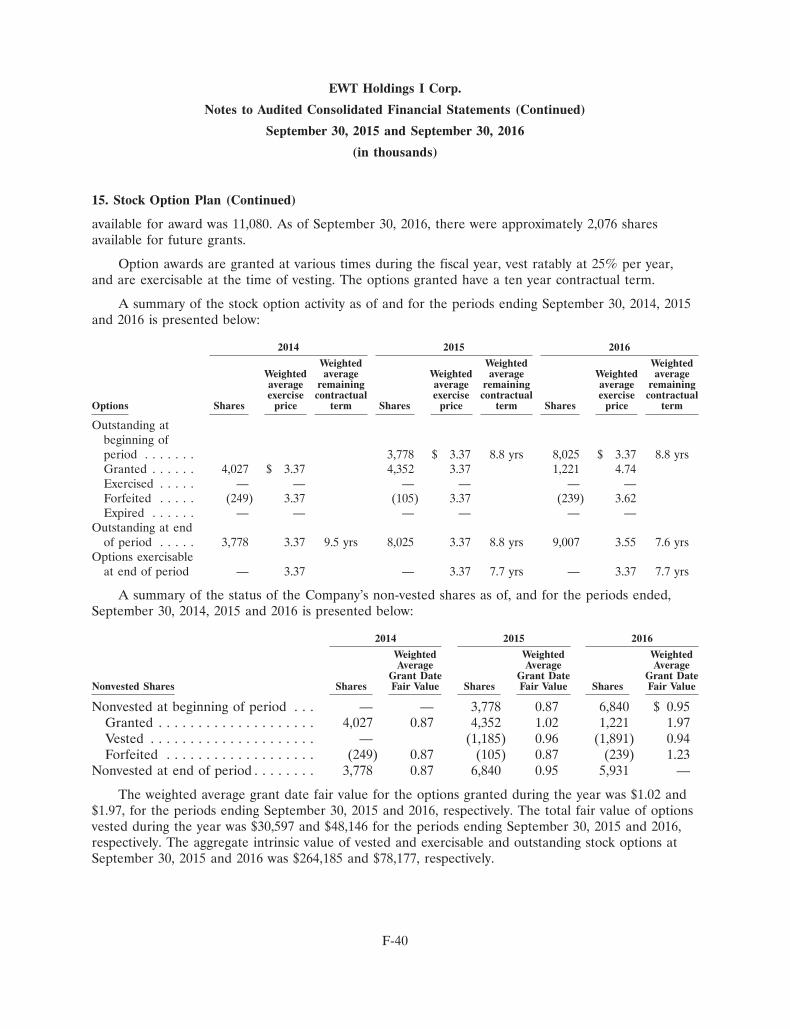
EWT Holdings I Corp.
Notes to Audited Consolidated Financial Statements (Continued)
September 30, 2015 and September 30, 2016
(in thousands)
15. Stock Option Plan (Continued)
available for award was 11,080. As of September 30, 2016, there were approximately 2,076 sharesavailable for future grants.
Option awards are granted at various times during the fiscal year, vest ratably at 25% per year,and are exercisable at the time of vesting. The options granted have a ten year contractual term.
A summary of the stock option activity as of and for the periods ending September 30, 2014, 2015and 2016 is presented below:
2014 2015 2016
Weighted Weighted WeightedWeighted average Weighted average Weighted averageaverage remaining average remaining average remainingexercise contractual exercise contractual exercise contractual
Options Shares price term Shares price term Shares price term
Outstanding atbeginning ofperiod . . . . . . . 3,778 $ 3.37 8.8 yrs 8,025 $ 3.37 8.8 yrsGranted . . . . . . 4,027 $ 3.37 4,352 3.37 1,221 4.74Exercised . . . . . — — — — — —Forfeited . . . . . (249) 3.37 (105) 3.37 (239) 3.62Expired . . . . . . — — — — — —
Outstanding at endof period . . . . . 3,778 3.37 9.5 yrs 8,025 3.37 8.8 yrs 9,007 3.55 7.6 yrs
Options exercisableat end of period — 3.37 — 3.37 7.7 yrs — 3.37 7.7 yrs
A summary of the status of the Company’s non-vested shares as of, and for the periods ended,September 30, 2014, 2015 and 2016 is presented below:
2014 2015 2016
Weighted Weighted WeightedAverage Average Average
Grant Date Grant Date Grant DateNonvested Shares Shares Fair Value Shares Fair Value Shares Fair Value
Nonvested at beginning of period . . . — — 3,778 0.87 6,840 $ 0.95Granted . . . . . . . . . . . . . . . . . . . . 4,027 0.87 4,352 1.02 1,221 1.97Vested . . . . . . . . . . . . . . . . . . . . . — (1,185) 0.96 (1,891) 0.94Forfeited . . . . . . . . . . . . . . . . . . . (249) 0.87 (105) 0.87 (239) 1.23
Nonvested at end of period . . . . . . . . 3,778 0.87 6,840 0.95 5,931 —
The weighted average grant date fair value for the options granted during the year was $1.02 and$1.97, for the periods ending September 30, 2015 and 2016, respectively. The total fair value of optionsvested during the year was $30,597 and $48,146 for the periods ending September 30, 2015 and 2016,respectively. The aggregate intrinsic value of vested and exercisable and outstanding stock options atSeptember 30, 2015 and 2016 was $264,185 and $78,177, respectively.
F-40

EWT Holdings I Corp.
Notes to Audited Consolidated Financial Statements (Continued)
September 30, 2015 and September 30, 2016
(in thousands)
15. Stock Option Plan (Continued)
Expense Measurement and Recognition
The Company recognizes share-based compensation for all current award grants and, in futureperiods, will recognize compensation costs for the unvested portion of previous award grants based ongrant date fair values. Unrecognized costs related to share-based awards outstanding at September 30,2016 totaled approximately $4,900 and are expected to be recognized over a period of 3.9 years.
The Company has little historic data with respect to estimates of expected employee behaviorsrelated to option exercises and forfeitures. As a result, the Company has used historic data from publicdisclosures of comparable companies which the Company believes to be representative of its ownexpected employee behaviors.
The Company estimates the fair value of each stock option award on the grant date using the Black-Scholes valuation model incorporating the assumptions noted in the following table. Option valuationmodels require the input of highly subjective assumptions, and changes in assumptions used can materiallyaffect the fair value estimate. Option valuation assumptions for options granted are as follows:
Year Ended Year EndedSeptember 30, 2015 September 30, 2016
Expected volatility . . . . . . . . . . . . . . . . . . . . 27.00% - 30.00% 27.50% - 29.50%Expected dividends . . . . . . . . . . . . . . . . . . . . — —Expected term (in years) . . . . . . . . . . . . . . . . 5.7 - 5.8 6.1Risk free rate . . . . . . . . . . . . . . . . . . . . . . . . 1.31% - 1.58% 1.01% - 1.42%Grant date fair value per share of options
granted . . . . . . . . . . . . . . . . . . . . . . . . . . . $23.58 - $36.44 $36.44 - $61.77
The risk-free interest rate is based on the U.S. treasury security rate in effect as of the date of grant.As the Company has no history with respect to volatility of share prices the expected volatility is not basedon realized volatility. The Company, as permitted under ASC 718, has identified guideline public companieswho are participants in the Company’s markets. The Company obtained historic share price trading datafrom the guideline companies and based their estimate of expected volatility on the historic volatility of theguideline companies. As the guideline companies are comparable in most significant respects, the Companybelieves they represent an appropriate basis for estimating expected volatility.
Reported non cash stock based compensation expense was classified as shown in the followingtable:
January 16, 2014through Year ended Year ended
September 30, 2014 September 30, 2015 September 30, 2016
Cost of services . . . . . . . . . . . $ 37 $ 38 $ 35General and administrative . . 305 1,549 1,964
$342 $1,587 $1,999
F-41
EWT Holdings I Corp.
Notes to Audited Consolidated Financial Statements (Continued)
September 30, 2015 and September 30, 2016
(in thousands)
16. Other comprehensive loss
The components of accumulated other comprehensive loss were:
September 30, September 30,2015 2016
Foreign currency translation loss . . . . . . . . . . . . . . . . . . $(2,238) $ (745)Pension benefit plans, net of tax of ($72) and ($0) . . . . . (2,275) (9,926)
Total accumulated other comprehensive loss . . . . . . . . . . $(4,513) $(10,671)
The changes in accumulated other comprehensive loss by component, net of tax, for the yearending September 30, 2014 , 2015 and 2016 are as follows:
Foreign currency Pensiontranslation loss plans
Balance at January 16, 2014 . . . . . . . . . . . . . . . . . . . . . . . . . . . . . . . . . . . . $ — $ —Other comprehensive income before reclassifications . . . . . . . . . . . . . . . . . . 2,038 (2,560)Amounts reclassified from accumulated other comprehensive loss related to
amortization of actuarial losses . . . . . . . . . . . . . . . . . . . . . . . . . . . . . . . . — —
Balance at September 30, 2014 . . . . . . . . . . . . . . . . . . . . . . . . . . . . . . . . . . $ 2,038 $(2,560)
Other comprehensive income before reclassifications . . . . . . . . . . . . . . . . . . (4,276) 148Amounts reclassified from accumulated other comprehensive loss related to
amortization of actuarial losses . . . . . . . . . . . . . . . . . . . . . . . . . . . . . . . . — 137
Balance at September 30, 2015 . . . . . . . . . . . . . . . . . . . . . . . . . . . . . . . . . . $(2,238) $(2,275)
Other comprehensive income before reclassifications . . . . . . . . . . . . . . . . . . 1,493 (7,779)Amounts reclassified from accumulated other comprehensive loss related to
amortization of actuarial losses . . . . . . . . . . . . . . . . . . . . . . . . . . . . . . . . — 128
Balance at September 30, 2016 . . . . . . . . . . . . . . . . . . . . . . . . . . . . . . . . . . $ (745) $(9,926)
Amounts reclassified out of other comprehensive loss related to the amortization of actuariallosses are included in pension expense.
17. Concentration of Credit Risk
The Company’s cash and cash equivalents and accounts receivable are potentially subject toconcentration of credit risk. Cash and cash equivalents are placed with financial institutions thatmanagement believes are of high credit quality. Accounts receivable are derived from revenue earnedfrom customers located in the U.S. and internationally and generally do not require collateral. TheCompany’s trade receivables do not represent a significant concentration of credit risk at fiscal 2015and 2016 due to the wide variety of customers and markets into which products are sold and theirdispersion across geographic areas. The Company does perform ongoing credit evaluations of itscustomers and maintains an allowance for potential credit losses on trade receivables. For the periodOctober 1, 2013 to January 15, 2014 (predecessor) and the period January 16, 2014 to September 30,
F-42
EWT Holdings I Corp.
Notes to Audited Consolidated Financial Statements (Continued)
September 30, 2015 and September 30, 2016
(in thousands)
17. Concentration of Credit Risk (Continued)
2014 (successor), and as of and for the fiscal years ended September 30, 2015 and 2016, no customeraccounted for more than 10% of net sales or net accounts receivable.
The Company operates predominantly in seven countries worldwide and provides a wide range ofproven product brands and advanced water and wastewater treatment technologies, mobile andemergency water supply solutions and service contract options through its Industrial, Municipal, andProducts segments. The Company is a multi-national business but its sales and operations are primarilyin the U.S.
Sales to unaffiliated customers are based on the Company locations that maintain the customerrelationship and transacts the external sale. The following tables set forth external net revenue, net ofintercompany eliminations, and net asset information by region:
Predecessor Successor
October 1, January 16,2013 through 2014 through Year ended Year endedJanuary 15, September 30, September 30, September 30,
2014 2014 2015 2016
Sales to external customersUnited States . . . . . . . . . . $249,422 $637,841 $ 880,787 $ 950,229Rest of World . . . . . . . . . . 56,892 153,313 180,179 186,967
Total . . . . . . . . . . . . . . . . 306,314 791,154 1,060,966 1,137,196
September 30, September 30,2015 2016
Net AssetsUnited States . . . . . . . . . . . . . . . . . . . . . . . . . . . . . . $165,309 $200,511Rest of World . . . . . . . . . . . . . . . . . . . . . . . . . . . . . . 9,051 3,424
$174,360 203,935
September 30, September 30,2015 2016
Long Lived AssetsUnited States . . . . . . . . . . . . . . . . . . . . . . . . . . . . . . $198,119 $212,457Rest of World . . . . . . . . . . . . . . . . . . . . . . . . . . . . . . 37,709 44,308
$235,828 256,765
18. Related-Party Transactions
Transactions with Investors
The Company pays an advisory fee of $1,000 per quarter to AEA Investors LP (‘‘AEA’’), theprivate equity firm and ultimate majority shareholder. In addition, the Company reimburses AEA for
F-43

EWT Holdings I Corp.
Notes to Audited Consolidated Financial Statements (Continued)
September 30, 2015 and September 30, 2016
(in thousands)
18. Related-Party Transactions (Continued)
normal and customary expenses incurred by AEA on behalf of the Company. The Company incurredexpenses, excluding advisory fees, of $1,382 for the period January 16, 2014 through September 30,2014 and $1,963 and $377 for the years ending September 30, 2015 and 2016, respectively. The amountsowed to AEA were $758 and $100 at September 30, 2015 and 2016, respectively, and were included inAccrued expenses and other liabilities.
From time to time, the Company may facilitate the transfer of funds between employees and theCompany, in connection with an employee stock purchase. As a result, the Company was due $250from an officer of the Company as of September 30, 2016. This amount was repaid in full onJanuary 31, 2017.
Additionally, in order to facilitate that acquisition of Neptune-Benson in April, 2016, the Companyreceived an additional $6,895 of capital contribution from AEA that was used to fund the acquisition.
AEA, through two of its affiliated funds, is one of the lenders in the Incremental First LienFacility and had a commitment of $14,925 at September 30, 2016.
Corporate Charges from Siemens and Affiliates
The Predecessor received services and support from various functions performed by Siemens andthe Predecessor operations had been dependent upon Siemens’ ability to provide these services andsupport functions. The total amount charged to the Predecessor for corporate services for the periodending January 15, 2014 was $3,048 and reflected in the Cost of product sales and services, Generaland administrative expenses, Marketing and selling and Research and development captions in theCombined Statements of Operations and Comprehensive Loss. The total amount charged was anallocation from Siemens based primarily on headcount of the Company. Management believes thisallocation to be reasonable. It is not practicable to provide an estimate of such expenses for corporateservices on a stand-alone basis.
The Predecessor had sales to and purchases from other entities of Siemens from time to time.Total sales for the period ending January 15, 2014 to other entities of Siemens were $4,498. Theamount of purchases from other Siemens entities were not material for the period ending January 15,2014.
19. Commitments and Contingencies
Operating Leases
The Company occupies certain facilities and operates certain equipment and vehicles undernon-cancelable lease arrangements. Lease agreements may contain lease escalation clauses andpurchase and renewal options. The Company recognizes scheduled lease escalation clauses over thecourse of the applicable lease term on a straight-line basis in the Consolidated Statement ofOperations.
Total rent expense was $4,394 in the period from October 1, 2013 to January 15, 2014 (Predecessor).Total rent expense was $10,889 in the period from January 16, 2014 to September 30, 2014 (Successor), andwas $14,592 and $11,760 for the fiscal years ended September 30, 2015 and 2016, respectively.
F-44
EWT Holdings I Corp.
Notes to Audited Consolidated Financial Statements (Continued)
September 30, 2015 and September 30, 2016
(in thousands)
19. Commitments and Contingencies (Continued)
Future minimum aggregate rental payments under non-cancelable operating leases are as follows:
OperatingLeases
Fiscal Year2017 . . . . . . . . . . . . . . . . . . . . . . . . . . . . . . . . . . . . . . . . . . . . . . . . . . $13,2322018 . . . . . . . . . . . . . . . . . . . . . . . . . . . . . . . . . . . . . . . . . . . . . . . . . . 9,9822019 . . . . . . . . . . . . . . . . . . . . . . . . . . . . . . . . . . . . . . . . . . . . . . . . . . 7,6832020 . . . . . . . . . . . . . . . . . . . . . . . . . . . . . . . . . . . . . . . . . . . . . . . . . . 6,1672021 . . . . . . . . . . . . . . . . . . . . . . . . . . . . . . . . . . . . . . . . . . . . . . . . . . 4,521Thereafter . . . . . . . . . . . . . . . . . . . . . . . . . . . . . . . . . . . . . . . . . . . . . 5,784
Total . . . . . . . . . . . . . . . . . . . . . . . . . . . . . . . . . . . . . . . . . . . . . . . . . . . $47,369
Capital Leases
The Company leases certain equipment under leases classified as capital leases. The leasedequipment is depreciated on a straight line basis over the life of the lease and is included indepreciation expense. The gross and net carrying values of the equipment under capital leases were$22,448 and $20,812, respectively, as of September 30, 2015 and was $29,261 and $22,788, respectively,as of September 30, 2016 and are recorded in Property, plant and equipment, net.
The following is a schedule showing the future minimum lease payments under capital leases byyears and the present value of the minimum lease payments as of September 30, 2016.
CapitalLeases
Fiscal Year2017 . . . . . . . . . . . . . . . . . . . . . . . . . . . . . . . . . . . . . . . . . . . . . . . . . . $ 7,5302018 . . . . . . . . . . . . . . . . . . . . . . . . . . . . . . . . . . . . . . . . . . . . . . . . . . 6,9412019 . . . . . . . . . . . . . . . . . . . . . . . . . . . . . . . . . . . . . . . . . . . . . . . . . . 6,0722020 . . . . . . . . . . . . . . . . . . . . . . . . . . . . . . . . . . . . . . . . . . . . . . . . . . 4,7972021 . . . . . . . . . . . . . . . . . . . . . . . . . . . . . . . . . . . . . . . . . . . . . . . . . . 2,175Thereafter . . . . . . . . . . . . . . . . . . . . . . . . . . . . . . . . . . . . . . . . . . . . . . 839
Total . . . . . . . . . . . . . . . . . . . . . . . . . . . . . . . . . . . . . . . . . . . . . . . . . . . 28,354Less amount representing interest (at rates ranging from 2.0% to 2.8%) . . . 5,291
Present value of net minimum capital lease payments . . . . . . . . . . . . . . . . 23,063Less current installments of obligations under capital leases . . . . . . . . . . . . 6,231
Obligations under capital leases, excluding current installments . . . . . . . . . $16,832
The current installments of obligations under capital leases are included in Accrued expenses andother liabilities. Obligations under capital leases, excluding current installments, are included in Othernon-current liabilities.
F-45

EWT Holdings I Corp.
Notes to Audited Consolidated Financial Statements (Continued)
September 30, 2015 and September 30, 2016
(in thousands)
19. Commitments and Contingencies (Continued)
The Company is a lessor to multiple parties. The Company purchases equipment through internalfunding or bank debt equal to the fair market value of the equipment. The equipment is then leased tocustomers for periods ranging from five to twenty years. The Company also leases equipment to onecustomer under a direct financing lease. The primary difference between this lease and the other operatingleases is that this transaction resulted from a sales-leaseback transaction and does not have the same levelof performance guarantees that the other agreements have. As of September 30, 2016, future minimumlease payments receivable under the direct financing lease and the operating lease are as follows:
DirectFinancing Operating
Lease Lease
Fiscal year2017 . . . . . . . . . . . . . . . . . . . . . . . . . . . . . . . . . . . . . . . . . . $ 4,841 $11,5232018 . . . . . . . . . . . . . . . . . . . . . . . . . . . . . . . . . . . . . . . . . . 4,034 7,3272019 . . . . . . . . . . . . . . . . . . . . . . . . . . . . . . . . . . . . . . . . . . — 4,9612020 . . . . . . . . . . . . . . . . . . . . . . . . . . . . . . . . . . . . . . . . . . — 4,1512021 . . . . . . . . . . . . . . . . . . . . . . . . . . . . . . . . . . . . . . . . . . — 2,144
Thereafter . . . . . . . . . . . . . . . . . . . . . . . . . . . . . . . . . . . . . . . — 5,718
Future minimum lease payments . . . . . . . . . . . . . . . . . . . . . . . 8,875 $35,824
Less unearned income . . . . . . . . . . . . . . . . . . . . . . . . . . . . . . (346)
Net investment in direct financing lease . . . . . . . . . . . . . . . . . . 8,529Less current portion . . . . . . . . . . . . . . . . . . . . . . . . . . . . . . . . (4,605)
Noncurrent portion . . . . . . . . . . . . . . . . . . . . . . . . . . . . . . . . . $ 3,924
The current receivables under the direct financing lease are included in Prepaids and other currentassets. The non-current portion of the direct financing lease is included in Other non-current assets.
Guarantees
From time to time, the Company is required to provide letters of credit, bank guarantees, or suretybonds in support of its commitments and as part of the terms and conditions on water treatmentprojects. In addition, the Company is required to provide letters of credit or surety bonds to thedepartment of environmental protection or equivalent in some states in order to maintain its licenses tohandle toxic substances at certain of its water treatment facilities.
These financial instruments typically expire after all Company commitments have been met, aperiod typically ranging from twelve months to ten years, or more in some circumstances. The letters ofcredit, bank guarantees, or surety bonds are arranged through major banks or insurance companies. Inthe case of surety bonds, the Company generally indemnifies the issuer for all costs incurred if a claimis made against the bond.
F-46

EWT Holdings I Corp.
Notes to Audited Consolidated Financial Statements (Continued)
September 30, 2015 and September 30, 2016
(in thousands)
19. Commitments and Contingencies (Continued)
As of September 30, 2015 and 2016, the Company had letters of credit totaling $20,238 and$18,129, respectively, and Surety Bonds totaling $65,038 and $102,228 respectively, outstanding underthe Company’s credit arrangement. The longest maturity date of the letters of credit and surety bondsrelated to commercial contracts in effect as of September 30, 2016 was March 31, 2024. Additionally, asof September 30, 2015 and 2016, the Company had letters of credit totaling $3,670 and $1,529,respectively, and Surety Bonds totaling $135,595 and $43,663, respectively, outstanding under theCompany’s prior arrangement with Siemens.
Litigation
From time to time, as a normal incident of the nature and kind of business in which the Companyis engaged, various claims or charges are asserted and litigation commenced against it arising from orrelated to: product liability; personal injury; trademarks, trade secrets or other intellectual property;labor and employee disputes; commercial or contractual disputes; breach of warranty; or environmentalmatters. Claimed amounts may be substantial but may not bear any reasonable relationship to themerits of the claim or the extent of any real risk of court or arbitral awards. While it is not feasible topredict the outcome of these matters with certainty, and some lawsuits, claims or proceedings may bedisposed or decided unfavorably, the Company does not expect that any asserted or unasserted legalclaims or proceedings, individually or in the aggregate, will have a material adverse effect on the resultsof operations, or financial condition.
20. Accrued Expenses and Other Liabilities
Accrued expenses and other liabilities consisted of the following:
September 30, 2015 September 30, 2016
Salaries, wages and other benefits . . . . . . . . . . . $ 50,472 $ 44,776Severance payments . . . . . . . . . . . . . . . . . . . . . 1,814 13,217Taxes, other than income . . . . . . . . . . . . . . . . . 10,199 10,643Obligation under capital leases . . . . . . . . . . . . . 6,601 6,231Insurance liabilities . . . . . . . . . . . . . . . . . . . . . . 5,620 5,484Provisions for litigation . . . . . . . . . . . . . . . . . . . 3,571 3,894Pension payable . . . . . . . . . . . . . . . . . . . . . . . . 1,232 1,255Third party commissions . . . . . . . . . . . . . . . . . . 8,771 9,155Other . . . . . . . . . . . . . . . . . . . . . . . . . . . . . . . 12,535 16,652
$100,815 $111,307
21. Business Segments
The Company has three reportable segments—Industrial, Municipal and Products. The key factorsused to identify these reportable segments are the organization and alignment of the Company’s
F-47

EWT Holdings I Corp.
Notes to Audited Consolidated Financial Statements (Continued)
September 30, 2015 and September 30, 2016
(in thousands)
21. Business Segments (Continued)
internal operations, the nature of the products and services, and customer type. The business segmentsare described as follows:
Industrial combines equipment and services to improve operational reliability and environmentalcompliance for heavy and light industry, commercial and institutional markets. Their customers includehydrocarbon refineries, chemical processing, power, food and beverage, life sciences, health services andmicroelectronics.
Municipal helps engineers and municipalities meet new demands for plant performance throughleading equipment, solutions and services backed by trusted brands and over 100 plus years ofapplications experience. Their customers include wastewater and drinking water collection anddistribution systems, utility operators and odor control services.
Products has distinct business operating units. Each has a unique standard product built onwell-known brands and technologies that are sold globally through multiple sales and aftermarketchannels. Additionally, Products also offers industrial, municipal and water recreational users withwell-known brands that improve operational reliability and environmental compliance Their customersinclude original equipment manufacturers, regional and global distributors, engineering, procurementand contracting customers, end users in the municipal, industrial and commercial industries hotels,resorts, colleges, universities, waterparks, aquariums and zoos in addition to customers in the industrialand municipal industries.
The Company evaluates its business segments’ operating results based on earnings before interest,taxes, depreciation and amortization. Corporate activities include general corporate expenses,elimination of intersegment transactions, interest income and expense and other unallocated charges.Since certain administrative and other operating expenses and other items have not been allocated to
F-48

EWT Holdings I Corp.
Notes to Audited Consolidated Financial Statements (Continued)
September 30, 2015 and September 30, 2016
(in thousands)
21. Business Segments (Continued)
business segments, the results in the below table are not necessarily a measure computed in accordancewith generally accepted accounting principles and may not be comparable to other companies.
Predecessor Successor
October 1, 2013 January 16, 2014 Year ended Year endedthrough through September 30, September 30,
January 15, 2014 September 30, 2014 2015 2016
Total salesIndustrial . . . . . . . . . . . . . . . . . . . . . . . . . . . . . . . . . . . . . $170,557 $ 436,467 $ 574,338 $ 610,824Municipal . . . . . . . . . . . . . . . . . . . . . . . . . . . . . . . . . . . . . 81,502 212,178 311,064 307,647Products . . . . . . . . . . . . . . . . . . . . . . . . . . . . . . . . . . . . . 68,818 185,372 241,182 285,258Other . . . . . . . . . . . . . . . . . . . . . . . . . . . . . . . . . . . . . . . 7,797 5,550 50 —
Total sales . . . . . . . . . . . . . . . . . . . . . . . . . . . . . . . . . . . . 328,674 839,567 1,126,634 1,203,729
Intersegment salesIndustrial . . . . . . . . . . . . . . . . . . . . . . . . . . . . . . . . . . . . . 3,352 5,953 5,331 6,632Municipal . . . . . . . . . . . . . . . . . . . . . . . . . . . . . . . . . . . . . 10,520 24,926 37,490 29,647Products . . . . . . . . . . . . . . . . . . . . . . . . . . . . . . . . . . . . . 8,488 17,534 22,847 30,254
Total intersegment sales . . . . . . . . . . . . . . . . . . . . . . . . . . . . . 22,360 48,413 65,668 66,533
Sales to external customersIndustrial . . . . . . . . . . . . . . . . . . . . . . . . . . . . . . . . . . . . . 167,205 430,514 569,007 604,192Municipal . . . . . . . . . . . . . . . . . . . . . . . . . . . . . . . . . . . . . 70,982 187,252 273,574 278,000Products . . . . . . . . . . . . . . . . . . . . . . . . . . . . . . . . . . . . . 60,330 167,838 218,335 255,004Other . . . . . . . . . . . . . . . . . . . . . . . . . . . . . . . . . . . . . . . 7,797 5,550 50 —
Total sales . . . . . . . . . . . . . . . . . . . . . . . . . . . . . . . . . . . . 306,314 791,154 1,060,966 1,137,196
Earnings before interest, taxes, depreciation and amortization (EBITDA)Industrial . . . . . . . . . . . . . . . . . . . . . . . . . . . . . . . . . . . . . 56,112 73,316 116,883 129,662Municipal . . . . . . . . . . . . . . . . . . . . . . . . . . . . . . . . . . . . . (2,247) 21,347 29,797 39,434Products . . . . . . . . . . . . . . . . . . . . . . . . . . . . . . . . . . . . . 15,600 26,500 39,223 55,099Corporate . . . . . . . . . . . . . . . . . . . . . . . . . . . . . . . . . . . . (57,983) (103,458) (131,850) (117,751)
Total EBITDA . . . . . . . . . . . . . . . . . . . . . . . . . . . . . . . . . . 11,482 17,705 54,053 106,444Depreciation and amortization
Industrial . . . . . . . . . . . . . . . . . . . . . . . . . . . . . . . . . . . . . (5,981) (24,518) (30,567) (38,266)Municipal . . . . . . . . . . . . . . . . . . . . . . . . . . . . . . . . . . . . . (2,433) (16,906) (7,656) (8,147)Products . . . . . . . . . . . . . . . . . . . . . . . . . . . . . . . . . . . . . (352) (1,580) (1,695) (6,387)Corporate . . . . . . . . . . . . . . . . . . . . . . . . . . . . . . . . . . . . (6,168) (96,930) (18,221) (16,489)
Total depreciation and amortization . . . . . . . . . . . . . . . . . . . . . . (14,934) (139,934) (58,139) (69,289)(Loss) income from operations
Industrial . . . . . . . . . . . . . . . . . . . . . . . . . . . . . . . . . . . . . 50,131 48,798 86,316 91,396Municipal . . . . . . . . . . . . . . . . . . . . . . . . . . . . . . . . . . . . . (4,680) 4,441 22,141 31,287Products . . . . . . . . . . . . . . . . . . . . . . . . . . . . . . . . . . . . . 15,248 24,920 37,528 48,712Corporate . . . . . . . . . . . . . . . . . . . . . . . . . . . . . . . . . . . . (64,151) (200,387) (150,071) (134,240)
Total (loss) income from operations . . . . . . . . . . . . . . . . . . . . . . (3,452) (122,228) (4,086) 37,155Interest expense . . . . . . . . . . . . . . . . . . . . . . . . . . . . . . . . . . (23) (23,994) (34,060) (42,518)
Loss before income taxes . . . . . . . . . . . . . . . . . . . . . . . . . . . . . (3,475) (146,222) (38,146) (5,363)Income tax benefit (expense) . . . . . . . . . . . . . . . . . . . . . . . . . . . 1,173 48,465 (47,905) 18,394
Net (loss) income . . . . . . . . . . . . . . . . . . . . . . . . . . . . . . . . . . $ (2,302) $ (97,757) $ (86,051) $ 13,031
Capital expendituresIndustrial . . . . . . . . . . . . . . . . . . . . . . . . . . . . . . . . . . . . . $ 6,316 $ 22,152 $ 31,967 $ 34,007Municipal . . . . . . . . . . . . . . . . . . . . . . . . . . . . . . . . . . . . . 657 4,152 4,523 6,113Products . . . . . . . . . . . . . . . . . . . . . . . . . . . . . . . . . . . . . 104 1,272 3,358 3,852Corporate . . . . . . . . . . . . . . . . . . . . . . . . . . . . . . . . . . . . 888 1,049 4,231 3,756
Total Capital expenditures . . . . . . . . . . . . . . . . . . . . . . . . . . . . $ 7,965 $ 28,625 $ 44,079 $ 47,728
AssetsIndustrial . . . . . . . . . . . . . . . . . . . . . . . . . . . . . . . . . . . . . 381,947 370,970Municipal . . . . . . . . . . . . . . . . . . . . . . . . . . . . . . . . . . . . . 132,348 123,041Products . . . . . . . . . . . . . . . . . . . . . . . . . . . . . . . . . . . . . 130,110 477,804Corporate . . . . . . . . . . . . . . . . . . . . . . . . . . . . . . . . . . . . 395,466 324,416
Total assets . . . . . . . . . . . . . . . . . . . . . . . . . . . . . . . . . . . . $1,039,871 $1,296,231
GoodwillIndustrial . . . . . . . . . . . . . . . . . . . . . . . . . . . . . . . . . . . . . $ 78,953 $ 80,157Municipal . . . . . . . . . . . . . . . . . . . . . . . . . . . . . . . . . . . . . 9,546 9,691Products . . . . . . . . . . . . . . . . . . . . . . . . . . . . . . . . . . . . . 25,084 177,795
Total goodwill . . . . . . . . . . . . . . . . . . . . . . . . . . . . . . . . . . $ 113,583 $ 267,643
F-49

EWT Holdings I Corp.
Notes to Audited Consolidated Financial Statements (Continued)
September 30, 2015 and September 30, 2016
(in thousands)
22. Earnings per share
The following table sets forth the computation of basic and diluted loss from continuing operationsper common share (in thousands, except per share amounts):
September 30, September 30, September 30,2014 2015 2016
Numerator:Numerator for basic and diluted loss from continuing operations
per common share—Net (loss) income from continuingoperations attributable to Evoqua Water Technologies . . . . . . . $ (97,757) $(86,051) $ 11,639
Denominator:Denominator for basic net (loss) income per common
share—weighted average shares . . . . . . . . . . . . . . . . . . . . . . . 100,964 101,763 104,254Effect of dilutive securities:Share-based compensation . . . . . . . . . . . . . . . . . . . . . . . . . . . . . — — 1,907Denominator for diluted net loss per common share—adjusted
weighted average shares . . . . . . . . . . . . . . . . . . . . . . . . . . . . . 100,964 101,763 106,161Basic (loss) income from continuing operations attributable to
Evoqua Water Technologies per common share . . . . . . . . . . . . $ (0.97) $ (0.85) $ 0.11
Diluted (loss) income from continuing operations attributable toEvoqua Water Technologies per common share . . . . . . . . . . . . $ (0.97) $ (0.85) $ 0.11
Since the Company was in a net loss position for the years ended September 30, 2014 and 2015,there was no difference between the number of shares used to calculate basic and diluted loss pershare. Because of their anti-dilutive effect, 3,774 and 8,033 common share equivalents comprised ofemployee stock options, have been excluded from the diluted EPS calculation for the years endedSeptember 30, 2014 and 2015, respectively.
23. Subsequent Events
The Company performed an evaluation of subsequent events through October 16, 2017, the datethe consolidated financial statements were available to be issued.
Acquisitions
On November 1, 2016, the Company acquired Environmental Treatment Services, Inc (ETS), aleading provider of engineered solutions to the industrial wastewater market based in Acworth, GA for$10,730. ETS had ten employees as of the date of acquisition, or November 1, 2016. ETS was acquiredto support the Company’s growth plan.
On May 9, 2017, the Company acquired the assets of Noble Water Technologies, a leader in highpurity water systems and service, located in Dallas, TX for $8,281; $5,915 cash at closing in addition toearn out payments over the next twelve months. The Company is still working through the purchaseprice valuation.
On June 30, 2017, the Company acquired ADI Systems North America Inc., Lange ContainmentSystems, Inc. and Geomembrane Technologies Inc. (collectively, ‘‘ADI’’) from ADI Group Inc. for atotal of CAD 74,800 ($57,545); CAD 67,320 ($51,785) cash at closing in addition to CAD 7,480($5,760) earn out payments over the next two years. The three are world leaders in wastewater
F-50

EWT Holdings I Corp.
Notes to Audited Consolidated Financial Statements (Continued)
September 30, 2015 and September 30, 2016
(in thousands)
23. Subsequent Events (Continued)
solutions for industrial and manufacturing applications, primarily based in Fredericton, New Brunswick.ADI offers a wide range of technologies tailored to its customer base around the world in anaerobicdigestion, aerobic treatment, and biogas treatment. They also provide green energy recovery and waterreuse technologies as well as industrial wastewater cover liners and containment systems. Combined,ADI has more than 260 customers in 35 countries.
On June 30, 2017, the Company acquired Olson Irrigation Systems, a leading designer andproducer of filters and irrigation components for the agriculture and industrial markets, based inSantee, California for $9,000. Olson will become part of Evoqua’s Products division and will help thebusiness build upon its leadership position in filtration serving a broad range of industrial applications.
DebtThe Company completed a tack-on financing to the First Lien term loan on October 28, 2016 (the
‘‘Tack-On Facility’’) for $150,000, issued at a .25% discount, aggregating $375. The Company incurred$4,000 of additional financing fees related to this transaction, which have been capitalized and areincluded in other non-current assets on the balance sheet.
Proceeds from this transaction were used to repay $33,000 outstanding on the Revolving CreditFacility, as well as to extinguish the $75,000 Second Lien Term Loan facility, which had $2,525 ofunamortized fees that were written off as a result. Through this transaction, The Company also upsizedthe Revolving Credit Facility capacity by $20,000, to an aggregate $95,000.
Issuance of the Tack-On Facility increased our First Lien Term Loan quarterly principal obligationsto $1,648, subject to the same interest rate terms as the original First Lien Team Loan.
The Company completed a financing on June 30, 2017 (a Build Own Operate or ‘‘BOO’’financing) for $7,100. The Company incurred $50 of additional financing fees related to thistransaction, which have been capitalized and are included as a contra liability on the balance sheet.This BOO financing fully amortizes over the seven years tenor and at an interest rate of one monthlibor plus 300 bps. At the time of entering into the loan, the company entered into a swap transactionfor the duration of the loan fixing the obligation at a rate of 5.08% per annum. Principal obligationsare $254 per quarter.
On August 8, 2017 the Company amended the First Lien Term Facility to 1) Increase the facilityterm loan balance by $80,000, 2) Reprice the Incremental First Lien Term Facility and 3) Combine alltranches into a single tranche. The First Lien Term Facility now carries a rate of LIBOR + 375 basispoints. Proceeds from the additional borrowing were used to reduce the revolving credit facility and toincrease cash on hand for general corporate operating purposes.
Stock SplitOn October 16, 2017, the Company’s Board of Directors effected a 26.9576-for-one stock split of
its common stock and increased its authorized shares to 1,000,000. All share and per share informationhas been retroactively adjusted to reflect the stock split. The incremental par value of the newly issuedshares was recorded with the offset to additional-paid-in capital.
Name ChangeOn October 16, 2017, the Company’s Board of Directors changed the name of the Company from
EWT Holdings I Corp to Evoqua Water Technologies Corp.
F-51
SCHEDULE I—EWT HOLDINGS I CORP.
(Parent company only)
Condensed Consolidated Balance Sheets
(in thousands)
September 30, 2015 September 30, 2016
ASSETSCurrent assets . . . . . . . . . . . . . . . . . . . . . . . . . . . . . . . . . . . . . . . $ 9,123 $ 1,734
Cash and cash equivalents . . . . . . . . . . . . . . . . . . . . . . . . . . . . 8,816 1,427Prepaid and other current assets . . . . . . . . . . . . . . . . . . . . . . . . 307 307
Investment in affiliate . . . . . . . . . . . . . . . . . . . . . . . . . . . . . . . . . 171,471 207,232
Total assets . . . . . . . . . . . . . . . . . . . . . . . . . . . . . . . . . . . . . . . . $180,594 $208,966
LIABILITIES AND EQUITYCurrent liabilities . . . . . . . . . . . . . . . . . . . . . . . . . . . . . . . . . . . . $ 1,721 —
Due to affiliates . . . . . . . . . . . . . . . . . . . . . . . . . . . . . . . . . . . 1,721
Total liabilities . . . . . . . . . . . . . . . . . . . . . . . . . . . . . . . . . . . . . . 1,721 —
Commitments and Contingent Liabilities (Note 19)Common stock, par value $.01: authorized 1,000,000 shares;
issued 101,849 shares, outstanding 101,742 at September 30,2015; issued 104,495 shares, outstanding 104,250 shares atSeptember 30, 2016 . . . . . . . . . . . . . . . . . . . . . . . . . . . . . . . 1,018 1,045
Treasury stock: 107 shares at September 30, 2015 and 245 sharesat September 30, 2016 . . . . . . . . . . . . . . . . . . . . . . . . . . . . . (410) (1,133)
Additional paid-in capital . . . . . . . . . . . . . . . . . . . . . . . . . . . . . 362,073 381,223Retained deficit . . . . . . . . . . . . . . . . . . . . . . . . . . . . . . . . . . . . (183,808) (172,169)
Total shareholders’ equity . . . . . . . . . . . . . . . . . . . . . . . . . . . . . . 178,873 208,966
Total liabilities and shareholder’s equity . . . . . . . . . . . . . . . . . . . $180,594 $208,966
F-52

SCHEDULE 1—EWT HOLDINGS I CORP.
(Parent company only)
Condensed Statements of Operations
(in thousands)
January 16, 2014through Year Ended Year ended
September 30, 2014 September 30, 2015 September 30, 2016
Net (loss) income of subsidiaries . . . . . . . . . . . $(97,757) $(86,051) $11,639
(Loss) Income before taxes . . . . . . . . . . . . . . . . (97,757) (86,051) 11,639Benefit for income taxes . . . . . . . . . . . . . . . . . . — — —
Net (loss) income . . . . . . . . . . . . . . . . . . . . . . . $(97,757) $(86,051) $11,639
F-53

SCHEDULE 1—EWT HOLDINGS I CORP.
Condensed Statements of Changes in Cash Flows
(Parent company only)
(in thousands)
January 16, 2014Through Year Ended Year Ended
September 30, 2014 September 30, 2015 September 30, 2016
Operating activitiesNet (loss) income . . . . . . . . . . . . . . . . . . . . . . . $(97,757) $(86,051) $ 11,639Adjustments to reconcile net income to net cash
used in operating activitiesNet income of subsidiaries . . . . . . . . . . . . . . . $ 97,757 $ 86,051 (11,639)Changes in assets and liabilities
Due to affiliates . . . . . . . . . . . . . . . . . . . . 1,633 88 (1,721)Prepaids and other current assets . . . . . . . . (1,139) 832 —
New cash provided by (used in) operatingactivities . . . . . . . . . . . . . . . . . . . . . . . . . . . . 494 920 (1,721)
Investing activitiesInvestment in subsidiaries . . . . . . . . . . . . . . . . . — — (22,122)
Net cash used in investing activities . . . . . . . . . . — — (22,122)
Financing activitiesProceeds from issuance of common stock . . . . . 6,965 847 10,282Proceeds from capital contribution . . . . . . . . . . — — 6,895Stock repurchases . . . . . . . . . . . . . . . . . . . . . . . — (410) (723)
Net cash provided by financing activities . . . . . . 6,965 437 16,454
Change in cash and cash equivalents . . . . . . . . . 7,459 1,357 (7,389)Cash and cash equivalents
Beginning of period . . . . . . . . . . . . . . . . . . . — 7,459 8,816
End of period . . . . . . . . . . . . . . . . . . . . . . . . $ 7,459 $ 8,816 $ 1,427
F-54

SCHEDULE I—EWT HOLDINGS I CORP.
(Parent company only)
Notes to Financial Statements
(in thousands)
September 30, 2015 and 2016
1. Basis of Presentation
Basis of Presentation
In the parent-company-only financial statements, the Company’s investment in subsidiaries is statedat cost plus equity in undistributed earnings of subsidiaries. The Company’s share of net income (loss)of its consolidated subsidiaries is included in consolidated income (loss) using the equity method. Theparent-company-only financial statements should be read in conjunction with the Company’sconsolidated financial statements.
2. Guarantees and Restrictions
As of September 30, 2016, EWT Holdings III, Corp., a subsidiary of the Company, had $675,188collectively of debt outstanding under the First Lien Term Loan Facility and $75,000 outstanding underthe Second Lien Term Loan Facility. Under the terms of the credit agreements governing our CreditFacilities, EWT Holdings II, Corp. has guaranteed the payment of all principal and interest. In theevent of a default under our Credit Facilities, certain of the Company’s subsidiaries will be directlyliable to the debt holders. As of September 30, 2016, the Term Loan Facility had a maturity date ofJanuary 15, 2021. The credit agreements governing our Credit Facilities also include restrictions on theability of the Company and its subsidiaries to (i) incur additional indebtedness and liens in connectiontherewith; (ii) pay dividends and make certain other restricted payments; (iii) effect mergers orconsolidations; (iv) enter into transactions with affiliates; (v) sell or dispose of property or assets; and(vi) engage in unrelated lines of business.
3. Dividends from Subsidiaries
There were no cash dividends paid to EWT Holdings I Corp. from the Company’s consolidatedsubsidiaries of each of the periods ended September 30, 2014, 2015 and 2016.
F-55
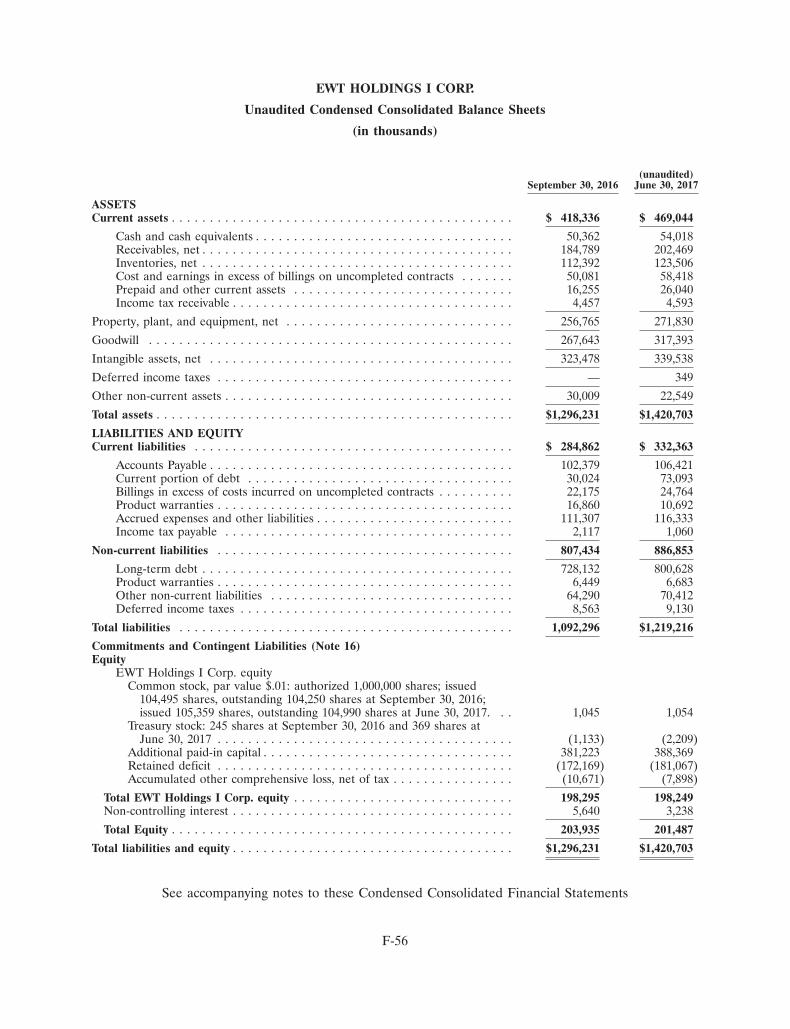
EWT HOLDINGS I CORP.
Unaudited Condensed Consolidated Balance Sheets
(in thousands)
(unaudited)September 30, 2016 June 30, 2017
ASSETSCurrent assets . . . . . . . . . . . . . . . . . . . . . . . . . . . . . . . . . . . . . . . . . . . . . $ 418,336 $ 469,044
Cash and cash equivalents . . . . . . . . . . . . . . . . . . . . . . . . . . . . . . . . . . 50,362 54,018Receivables, net . . . . . . . . . . . . . . . . . . . . . . . . . . . . . . . . . . . . . . . . . 184,789 202,469Inventories, net . . . . . . . . . . . . . . . . . . . . . . . . . . . . . . . . . . . . . . . . . 112,392 123,506Cost and earnings in excess of billings on uncompleted contracts . . . . . . . 50,081 58,418Prepaid and other current assets . . . . . . . . . . . . . . . . . . . . . . . . . . . . . 16,255 26,040Income tax receivable . . . . . . . . . . . . . . . . . . . . . . . . . . . . . . . . . . . . . 4,457 4,593
Property, plant, and equipment, net . . . . . . . . . . . . . . . . . . . . . . . . . . . . . . 256,765 271,830
Goodwill . . . . . . . . . . . . . . . . . . . . . . . . . . . . . . . . . . . . . . . . . . . . . . . . 267,643 317,393
Intangible assets, net . . . . . . . . . . . . . . . . . . . . . . . . . . . . . . . . . . . . . . . . 323,478 339,538
Deferred income taxes . . . . . . . . . . . . . . . . . . . . . . . . . . . . . . . . . . . . . . . — 349
Other non-current assets . . . . . . . . . . . . . . . . . . . . . . . . . . . . . . . . . . . . . . 30,009 22,549
Total assets . . . . . . . . . . . . . . . . . . . . . . . . . . . . . . . . . . . . . . . . . . . . . . . $1,296,231 $1,420,703
LIABILITIES AND EQUITYCurrent liabilities . . . . . . . . . . . . . . . . . . . . . . . . . . . . . . . . . . . . . . . . . . $ 284,862 $ 332,363
Accounts Payable . . . . . . . . . . . . . . . . . . . . . . . . . . . . . . . . . . . . . . . . 102,379 106,421Current portion of debt . . . . . . . . . . . . . . . . . . . . . . . . . . . . . . . . . . . 30,024 73,093Billings in excess of costs incurred on uncompleted contracts . . . . . . . . . . 22,175 24,764Product warranties . . . . . . . . . . . . . . . . . . . . . . . . . . . . . . . . . . . . . . . 16,860 10,692Accrued expenses and other liabilities . . . . . . . . . . . . . . . . . . . . . . . . . . 111,307 116,333Income tax payable . . . . . . . . . . . . . . . . . . . . . . . . . . . . . . . . . . . . . . 2,117 1,060
Non-current liabilities . . . . . . . . . . . . . . . . . . . . . . . . . . . . . . . . . . . . . . . 807,434 886,853
Long-term debt . . . . . . . . . . . . . . . . . . . . . . . . . . . . . . . . . . . . . . . . . 728,132 800,628Product warranties . . . . . . . . . . . . . . . . . . . . . . . . . . . . . . . . . . . . . . . 6,449 6,683Other non-current liabilities . . . . . . . . . . . . . . . . . . . . . . . . . . . . . . . . 64,290 70,412Deferred income taxes . . . . . . . . . . . . . . . . . . . . . . . . . . . . . . . . . . . . 8,563 9,130
Total liabilities . . . . . . . . . . . . . . . . . . . . . . . . . . . . . . . . . . . . . . . . . . . . 1,092,296 $1,219,216
Commitments and Contingent Liabilities (Note 16)Equity
EWT Holdings I Corp. equityCommon stock, par value $.01: authorized 1,000,000 shares; issued
104,495 shares, outstanding 104,250 shares at September 30, 2016;issued 105,359 shares, outstanding 104,990 shares at June 30, 2017. . . 1,045 1,054
Treasury stock: 245 shares at September 30, 2016 and 369 shares atJune 30, 2017 . . . . . . . . . . . . . . . . . . . . . . . . . . . . . . . . . . . . . . . (1,133) (2,209)
Additional paid-in capital . . . . . . . . . . . . . . . . . . . . . . . . . . . . . . . . . 381,223 388,369Retained deficit . . . . . . . . . . . . . . . . . . . . . . . . . . . . . . . . . . . . . . . (172,169) (181,067)Accumulated other comprehensive loss, net of tax . . . . . . . . . . . . . . . . (10,671) (7,898)
Total EWT Holdings I Corp. equity . . . . . . . . . . . . . . . . . . . . . . . . . . . . . 198,295 198,249Non-controlling interest . . . . . . . . . . . . . . . . . . . . . . . . . . . . . . . . . . . . . 5,640 3,238
Total Equity . . . . . . . . . . . . . . . . . . . . . . . . . . . . . . . . . . . . . . . . . . . . . 203,935 201,487
Total liabilities and equity . . . . . . . . . . . . . . . . . . . . . . . . . . . . . . . . . . . . . $1,296,231 $1,420,703
See accompanying notes to these Condensed Consolidated Financial Statements
F-56

EWT HOLDINGS I CORP.
Unaudited Condensed Consolidated Statements of Operations
(in thousands except per share data)
Nine months ended
June 30, 2016 June 30, 2017
Revenue from product sales and services . . . . . . . . . . . . . . . . . . . . . . . . . . $817,788 $890,916Cost of product sales and services . . . . . . . . . . . . . . . . . . . . . . . . . . . . . . . 575,234 614,088
Gross profit . . . . . . . . . . . . . . . . . . . . . . . . . . . . . . . . . . . . . . . . . . . . . . . 242,554 276,828
Research and development expense . . . . . . . . . . . . . . . . . . . . . . . . . . . . . . 17,469 15,684Sales and marketing expense . . . . . . . . . . . . . . . . . . . . . . . . . . . . . . . . . . . 97,078 108,729General and administrative expense . . . . . . . . . . . . . . . . . . . . . . . . . . . . . . 108,496 120,534Other operating income . . . . . . . . . . . . . . . . . . . . . . . . . . . . . . . . . . . . . . (2,404) (981)Interest expense . . . . . . . . . . . . . . . . . . . . . . . . . . . . . . . . . . . . . . . . . . . . 29,467 39,117
Loss before income taxes . . . . . . . . . . . . . . . . . . . . . . . . . . . . . . . . . . . . . (7,552) (6,255)
Income tax benefit (expense) . . . . . . . . . . . . . . . . . . . . . . . . . . . . . . . . . . . 20,419 (295)
Net income (loss) . . . . . . . . . . . . . . . . . . . . . . . . . . . . . . . . . . . . . . . . . . . 12,867 (6,550)
Net income attributable to non controlling interest . . . . . . . . . . . . . . . . . . . 1,055 2,348
Net income (loss) attributable to EWT Holdings I Corp. . . . . . . . . . . . . . . $ 11,812 $ (8,898)
Basic earnings (loss) per common share . . . . . . . . . . . . . . . . . . . . . . . . . . . $ 0.11 $ (0.08)Diluted earnings (loss) per common share . . . . . . . . . . . . . . . . . . . . . . . . . $ 0.11 $ (0.08)
See accompanying notes to these Condensed Consolidated Financial Statements
F-57

EWT HOLDINGS I CORP.
Unaudited Condensed Consolidated Statements of Comprehensive Income (Loss)
(in thousands)
Nine months ended
June 30, 2016 June 30, 2017
Net income (loss) . . . . . . . . . . . . . . . . . . . . . . . . . . . . . . . . . . . . . . . . . . . $12,867 $(6,550)Other comprehensive income
Foreign currency translation adjustments . . . . . . . . . . . . . . . . . . . . . . . . 781 2,773
Total other comprehensive income . . . . . . . . . . . . . . . . . . . . . . . . . . . . . . . $ 781 $ 2,773Less: Comprehensive income attributable to non controlling interest . . . . . . 1,055 2,348
Comprehensive income (loss) attributable to EWT Holdings I Corp. . . . . . . $12,593 $(6,125)
See accompanying notes to these Condensed Consolidated Financial Statements
F-58

EWT HOLDINGS I CORP.
Unaudited Condensed Consolidated Statements of Changes in Equity
(in thousands)
AccumulatedCommon Treasury Additional Other
Stock Common Stock Treasury Paid-in Retained Comprehensive NoncontrollingShares Stock Shares Stock Capital Deficit Loss Interest Total
Balance at September 30, 2015 . . . . 101,849 $1,018 107 $ (410) $362,073 $(183,808) $ (4,513) $ — $174,360Equity based compensation
expense . . . . . . . . . . . . . . . — — — — 1,447 — — — 1,447Capital Contribution . . . . . . . . — — — — 6,895 — — — 6,895Issuance of common stock . . . . . 2,646 27 — — 10,256 — — — 10,283Stock repurchases . . . . . . . . . . — — 138 (723) — — — — (723)Establishment of noncontrolling
interest . . . . . . . . . . . . . . . — — — — — — — 6,873 6,873Dividends paid to noncontrolling
interest . . . . . . . . . . . . . . . — — — — — — — (1,875) (1,875)Net income . . . . . . . . . . . . . . — — — — — 11,812 — 1,055 12,867Other comprehensive income . . . — — — — — — 781 — 781
Balance at June 30, 2016 . . . . . . . 104,495 $1,045 245 $(1,133) $380,671 $(171,996) $ (3,732) $ 6,053 $210,908
Balance at September 30, 2016 . . . . 104,495 $1,045 245 $(1,133) $381,223 $(172,169) $(10,671) $ 5,640 $203,935
Equity based compensationexpense . . . . . . . . . . . . . . . — — — — 1,634 — — — 1,634
Issuance of common stock . . . . . 864 9 — — 5,512 — — — 5,521Stock repurchases . . . . . . . . . . — — 124 (1,076) — — — — (1,076)Dividends paid to noncontrolling
interest . . . . . . . . . . . . . . . — — — — — — — (4,750) (4,750)Net loss . . . . . . . . . . . . . . . . — — — — — (8,898) — 2,348 (6,550)Other comprehensive income . . . — — — — — — 2,773 — 2,773
Balance at June 30, 2017 . . . . . . . 105,359 $1,054 369 $(2,209) $388,369 $(181,067) $ (7,898) $ 3,238 $201,487
See accompanying notes to these Consolidated Financial Statements
F-59

EWT HOLDINGS I CORP.
Unaudited Condensed Consolidated Statements of Changes in Cash Flows
(in thousands)
Nine Months Ended Nine Months EndedJune 30, 2016 June 30, 2017
Operating activitiesNet income (loss) . . . . . . . . . . . . . . . . . . . . . . . . . . . . . . . . . . . $ 12,867 $ (6,550)Reconciliation of net loss to cash flows from operating activities:
Depreciation and amortization . . . . . . . . . . . . . . . . . . . . . . . . 50,986 55,813Amortization of deferred financing costs . . . . . . . . . . . . . . . . . 2,911 5,970Deferred income taxes . . . . . . . . . . . . . . . . . . . . . . . . . . . . . . (22,296) (107)Share based compensation . . . . . . . . . . . . . . . . . . . . . . . . . . . 1,447 1,634(Gain) loss on sale of property, plant and equipment . . . . . . . . (93) 349Foreign currency losses (gains) on intracompany loans . . . . . . . 724 (1,489)Changes in assets and liabilities
Accounts receivable . . . . . . . . . . . . . . . . . . . . . . . . . . . . . . 8,563 (6,454)Inventories . . . . . . . . . . . . . . . . . . . . . . . . . . . . . . . . . . . . . (2,659) (7,964)Cost and earnings in excess of billings on uncompleted
contracts . . . . . . . . . . . . . . . . . . . . . . . . . . . . . . . . . . . . . (6,577) (8,900)Prepaids and other current assets . . . . . . . . . . . . . . . . . . . . . (320) (9,139)Accounts payable . . . . . . . . . . . . . . . . . . . . . . . . . . . . . . . . 1,895 (1,009)Accrued expenses and other liabilities . . . . . . . . . . . . . . . . . (32,796) (10,678)Billings in excess of costs incurred . . . . . . . . . . . . . . . . . . . . (12,656) 249Income taxes . . . . . . . . . . . . . . . . . . . . . . . . . . . . . . . . . . . 455 (1,181)Other non-current assets and liabilities . . . . . . . . . . . . . . . . . 8,204 5,248
Net cash provided by operating activities . . . . . . . . . . . . . . . . . . 10,655 15,793Investing activitiesPurchases of property, plant and equipment . . . . . . . . . . . . . . . . (34,717) (40,475)Purchases of intangibles . . . . . . . . . . . . . . . . . . . . . . . . . . . . . . . (246) (4,175)Proceeds from sale of property, plant and equipment . . . . . . . . . 3,369 5,221Acquisitions, net of cash received of $11,486 and $3,335 . . . . . . . (299,633) (77,837)Net cash used in investing activities . . . . . . . . . . . . . . . . . . . . . . (331,227) (117,266)Financing activitiesIssuance of debt, net of deferred issuance costs . . . . . . . . . . . . . . 176,854 152,902Borrowings under credit facility . . . . . . . . . . . . . . . . . . . . . . . . . 26,850 113,000Repayment of debt . . . . . . . . . . . . . . . . . . . . . . . . . . . . . . . . . . (12,971) (156,306)Repayment of capital lease obligation . . . . . . . . . . . . . . . . . . . . . (6,246) (4,842)Proceeds from capital contribution . . . . . . . . . . . . . . . . . . . . . . . 6,895 —Proceeds from issuance of common stock . . . . . . . . . . . . . . . . . . 10,283 5,521Stock repurchases . . . . . . . . . . . . . . . . . . . . . . . . . . . . . . . . . . . (723) (1,076)Distribution to noncontrolling interest . . . . . . . . . . . . . . . . . . . . (1,875) (4,750)Net cash provided by financing activities . . . . . . . . . . . . . . . . . . . 199,067 104,449Effect of exchange rate changes on cash . . . . . . . . . . . . . . . . . . . 369 680Change in cash and cash equivalents . . . . . . . . . . . . . . . . . . . . . (121,136) 3,656Cash and cash equivalents
Beginning of period . . . . . . . . . . . . . . . . . . . . . . . . . . . . . . . . 169,027 50,362End of period . . . . . . . . . . . . . . . . . . . . . . . . . . . . . . . . . . . . $ 47,891 $ 54,018
See accompanying notes to these Condensed Consolidated Financial Statements
F-60

EWT HOLDINGS I CORP.
Unaudited Supplemental Disclosure of Cash Flow Information
(in thousands)
Nine Months Ended Nine Months EndedJune 30, 2016 June 30, 2017
Supplemental disclosure of cash flow informationCash paid for taxes . . . . . . . . . . . . . . . . . . . . . . . . . . . . . . . . . . $ 3,727 $ 2,335Cash paid for interest . . . . . . . . . . . . . . . . . . . . . . . . . . . . . . . . $25,434 $31,546Non-cash investing and financing activitiesAccrued earnout related to acquisitions . . . . . . . . . . . . . . . . . . . — $ 4,871Capital lease transactions . . . . . . . . . . . . . . . . . . . . . . . . . . . . . . $ 4,709 $12,686Cloud computing related intangible transaction . . . . . . . . . . . . . . $ — $ 5,544
See accompanying notes to these Condensed Consolidated Financial Statements
F-61
Notes to Unaudited Condensed Consolidated Financial Statements
(in thousands)
September 30, 2016 and June 30, 2017
1. Description of the Company and Basis of Presentation
The Business
EWT Holdings I Corp. (herein referred to as ‘‘EWT’’ or the ‘‘Company’’) provides a wide range ofproduct brands and advanced water and wastewater treatment systems and technologies, as well asmobile and emergency water supply solutions and service contract options through its segment’s branchnetwork. Headquartered in Pittsburgh, Pennsylvania, EWT is a multi-national corporation withoperations in the United States, Canada, the United Kingdom, the Netherlands, Italy, Germany,Australia, China, and Singapore.
The Company is organizationally structured into three reportable segments for the purpose ofmaking operational decisions and assessing financial performance: (i) Industrial, (ii) Products and(iii) Municipal.
Basis of Presentation
These unaudited condensed consolidated financial statements have been prepared in accordancewith U.S generally accepted accounting principles (U.S. GAAP) for interim financial reporting.Accordingly, they do not include all of the information and note disclosures required by U.S generallyaccepted accounting principles for the complete financial statements. In management’s opinion, alladjustments (which include only normal recurring adjustments) considered necessary for a fairpresentation have been included. These unaudited consolidated financial statements should be read inconjunction with the consolidated financial statements and notes thereto included in the Company’sSeptember 30, 2016 Annual Consolidated Financial Statements.
2. Summary of Significant Accounting Policies
Fiscal Year
The Company’s fiscal year ends on September 30.
Use of Estimates
The consolidated financial statements have been prepared in conformity with U.S. GAAP andrequire management to make estimates and assumptions. These assumptions affect the reportedamounts of assets and liabilities and disclosure of contingent assets and liabilities at the date of theconsolidated financial statements and the reported amounts of revenue and expenses during thereporting period. Estimates and assumptions are used for, but not limited to: (i) revenue recognition;(ii) allowance for doubtful accounts; (iii) inventory valuation, asset valuations, impairment, andrecoverability assessments; (iv) depreciable lives of assets; (v) useful lives of intangible assets;(vi) income tax reserves and valuation allowances; and (vii) product warranty and litigation reserves.Estimates are revised as additional information becomes available. Actual results could differ fromthese estimates.
Cash and Cash Equivalents
Cash and cash equivalents are liquid investments with an original maturity of three or fewermonths when purchased.
F-62

Notes to Unaudited Condensed Consolidated Financial Statements (Continued)
(in thousands)
September 30, 2016 and June 30, 2017
2. Summary of Significant Accounting Policies (Continued)
Accounts Receivable
Receivables are primarily comprised of uncollected amounts owed to us from transactions withcustomers and are presented net of allowances for doubtful accounts. Allowances are estimated basedon historical write-offs and the economic status of customers. The Company considers a receivabledelinquent if it is unpaid after the term of the related invoice has expired. Write-offs are recorded atthe time all collection efforts have been exhausted.
Inventories
Inventories are stated at the lower of cost or market, where cost is generally determined on thebasis of an average or first-in, first-out (FIFO) method. Production costs comprise direct material andlabor and applicable manufacturing overheads, including depreciation charges. The Company regularlyreviews inventory quantities on hand and writes off excess or obsolete inventory based on estimatedforecasts of product demand and production requirements. Manufacturing operations recognize cost ofproduct sales using standard costing rates with overhead absorption which generally approximatesactual cost.
Property, Plant, and Equipment
Property, plant, and equipment is valued at cost less accumulated depreciation and impairmentlosses. If the costs of certain components of an item of property, plant, and equipment are significantin relation to the total cost of the item, they are accounted for and depreciated separately.Depreciation expense is recognized using the straight-line method. Useful lives are reviewed annuallyand, if expectations differ from previous estimates, adjusted accordingly. Estimated useful lives formajor classes of depreciable assets are as follows:
Asset Class Estimated Useful Life
Machinery and equipment . . . . . . . . . . . . . . . . . . . . . . . . . . . . . 3 to 20 yearsBuildings and improvements . . . . . . . . . . . . . . . . . . . . . . . . . . . 10 to 40 years
Leasehold improvements are depreciated over the shorter of their estimated useful life or the termof the lease. Costs related to maintenance and repairs that do not extend the assets’ useful life areexpensed as incurred.
Goodwill and Other Intangible Assets
Goodwill represents purchase consideration paid in a business combination that exceeds the valueassigned to the net assets of acquired businesses. Other intangible assets consist of customer-relatedintangibles, proprietary technology, software, trademarks and other intangible assets. The Companyamortizes intangible assets with definite useful lives on a straight-line basis over their respectiveestimated economic lives which range from 1 to 26 years.
The Company reviews goodwill to determine potential impairment annually during the fourthquarter of the fiscal year, or more frequently if events and circumstances indicate that the asset mightbe impaired. Impairment testing for goodwill is performed at a reporting unit level. We havedetermined that we have four reporting units. Our quantitative impairment testing utilizes both a
F-63
Notes to Unaudited Condensed Consolidated Financial Statements (Continued)
(in thousands)
September 30, 2016 and June 30, 2017
2. Summary of Significant Accounting Policies (Continued)
market (guideline public company) and income (discounted cash flows) method for determining fairvalue. In estimating the fair value of the reporting unit utilizing a discounted cash flow (‘‘DCF’’)valuation technique, we incorporate our judgment and estimates of future cash flows, future revenueand gross profit growth rates, terminal value amount, capital expenditures and applicable weighted-average cost of capital used to discount these estimated cash flows. The estimates and projections usedin the estimate of fair value are consistent with our current budget and long-range plans, includinganticipated change in market conditions, industry trend, growth rates and planned capital expenditures,among other considerations. If the carrying value of the reporting unit is greater than the fair value,the second step is performed, where the implied fair value of goodwill is compared to its carryingvalue.
Impairment of Long-Lived Assets
Long-lived assets, such as property, plant, and equipment, and purchased intangibles subject toamortization, are reviewed for impairment whenever events or changes in circumstances indicate thatthe carrying amount of an asset or asset group may not be recoverable. Recoverability of the asset orasset group is measured by comparison of its carrying amount to undiscounted future net cash flowsthe asset or asset group is expected to generate. If the carrying amount of an asset or asset group isnot recoverable, the Company recognizes an impairment loss based on the excess of the carryingamount of the asset or asset group over its respective fair value which is generally determined as thepresent value of estimated future cash flows or as the appraised value.
Debt Issuance Costs and Debt Discounts
Debt issuance costs are capitalized and amortized over the contractual term of the underlying debtusing the effective interest method. Debt discounts and lender arrangement fees deducted from theproceeds have been included as a component of the carrying value of debt and are being amortized tointerest expense using the effective interest method.
Amortization of debt issuance costs and debt discounts/premiums included in interest expense were$2,911 and $4,376 for the nine months ended June 30, 2016 and 2017, respectively. Additionally, inOctober of 2016, the Company wrote off $2,075 of deferred financing fees related to theextinguishment of debt and incurred another $481 of fees related to a tack-on financing the Companycompleted on October 28, 2016. These amounts are included in interest expense during the ninemonths ended June 30, 2017.
Revenue Recognition
Sales of goods and services are recognized when persuasive evidence of an arrangement exists, theprice is fixed or determinable, collectability is reasonably assured and delivery has occurred or serviceshave been rendered.
For sales of aftermarket parts or products with a low level of customization and engineering time,the Company recognizes revenues at the time title and risks and rewards of ownership pass, which isgenerally when products are shipped or delivered to the customer as the Company has no obligationfor installation. Sales of short-term service arrangements are recognized as the services are performed,
F-64
Notes to Unaudited Condensed Consolidated Financial Statements (Continued)
(in thousands)
September 30, 2016 and June 30, 2017
2. Summary of Significant Accounting Policies (Continued)
and sales of long-term service arrangements are typically recognized on a straight-line basis over thelife of the agreement.
For certain arrangements where there is significant customization to the product, the Companyrecognizes revenue under the provisions of Accounting Standards Codification (ASC) 605-35, RevenueRecognition—Construction-Type and Production-Type Contracts. These products include large capitalwater treatment projects, systems and solutions for municipal and industrial applications. Revenuesfrom construction-type contracts are generally recognized under the percentage-of-completion method,based on the input of costs incurred to date as a percentage of total estimated contract costs. Thenature of the contracts are generally fixed price with milestone billings. Contract revenues and costestimates are reviewed and revised quarterly at a minimum and the cumulative effect of suchadjustments are recognized in current operations. The amount of such adjustments have not beenmaterial.
During the nine months ended June 30, 2016 and 2017, respectively, approximately $154,896 and$168,030 of revenues from construction-type contracts were recognized on the percentage-of-completionmethod. Cost and earnings in excess of billings under construction-type arrangements are recordedwhen contracts have net asset balances where contract costs plus recognized profits less recognizedlosses exceed progress billings. Billings in excess of costs incurred are recorded when contract progressbillings exceed costs and recognized profit less recognized losses.
During the nine months ended June 30, 2016 and 2017, respectively, approximately $25,183 and$21,353 of revenues from construction-type contracts were recognized on a completed contract method,which is typically when the product is delivered and accepted by the customer. The completed contractmethod is principally used when the contract is short in duration (generally less than twelve months)and where results of operations would not vary materially from those resulting from the use of thepercentage-of-completion method.
Product Warranties
Accruals for estimated expenses related to warranties are made at the time products are sold andare recorded as a component of Cost of product sales in the Consolidated Statements of Operations.The estimated warranty obligation is based on product warranty terms offered to customers, ongoingproduct failure rates, material usage and service delivery costs expected to be incurred in correcting aproduct failure, as well as specific obligations for known failures and other currently available evidence.The Company assesses the adequacy of the recorded warranty liabilities on a regular basis and adjustsamounts as necessary.
Shipping and Handling Cost
Shipping and handling costs are included as a component of cost of sales.
Income Taxes
The Company recognizes deferred tax assets and liabilities for the future tax consequencesattributable to differences between the financial statement carrying amounts of existing assets andliabilities and their respective tax bases. Deferred tax assets and liabilities are measured using enacted
F-65
Notes to Unaudited Condensed Consolidated Financial Statements (Continued)
(in thousands)
September 30, 2016 and June 30, 2017
2. Summary of Significant Accounting Policies (Continued)
tax rates expected to apply to taxable income in the years in which those temporary differences areexpected to be recovered or settled. The effect on deferred tax assets and liabilities of a change in taxrates is recognized in income in the period that included the enactment date. Valuation allowances areprovided against deferred tax assets when it is deemed more likely than not that some portion or all ofthe deferred tax asset will not be realized within a reasonable time period. We assess tax positionsusing a two-step process. A tax position is recognized if it meets a more-likely-than-not threshold, andis measured at the largest amount of benefit that is greater than 50.0% percent of being realized.Uncertain tax positions are reviewed each balance sheet date. Liabilities recorded as a result of thisanalysis are classified as current or long-term based on the timing of expected payment.
Sales Taxes
Upon collection of sales tax from revenue, the amount of sales tax is placed into an accruedliability account. This liability is then relieved when the payment is sent to the proper governmentjurisdiction.
Foreign Currency Translation and Transactions
The functional currency for the international subsidiaries is the local currency. Assets and liabilitiesare translated into U.S. Dollars using current rates of exchange, while revenues and expenses aretranslated at the weighted-average exchange rate for the period. The resulting translation adjustmentsare recorded in other comprehensive income within shareholders’ equity.
Foreign currency transaction gains (losses) aggregated $1,321 and $(1,663) for the nine monthsended June 30, 2016 and 2017, respectively, and are primarily included in General and administrativeexpenses in the Consolidated Statements of Operations.
Research and Development Costs
Research and development costs are expensed as incurred.
Equity-based Compensation
The Company measures the cost of awards of equity instruments to employees based on thegrant-date fair value of the award. Given the absence of a public trading market for our common stock,the fair value of the common stock underlying our share-bank awards was determined by our board,with input from management, in each case using net income and market valuation approach. Stockoptions are granted with exercise prices equal to or greater than the estimated fair market value on thedate of grant as authorized by our compensation committee. The grant-date fair value is determinedusing the Black-Scholes model. The fair value, net of estimated forfeitures, is amortized ascompensation cost on a straight-line basis over the vesting period primarily as a component of Generaland administrative expenses.
Retirement Benefits
The Company applies, ASC Topic 715, Compensation—Retirement Benefits, which requires therecognition in pension obligations and accumulated other comprehensive income of actuarial gains or
F-66

Notes to Unaudited Condensed Consolidated Financial Statements (Continued)
(in thousands)
September 30, 2016 and June 30, 2017
2. Summary of Significant Accounting Policies (Continued)
losses, prior service costs or credits and transition assets or obligations that have previously beendeferred. The determination of retirement benefit pension obligations and associated costs requires theuse of actuarial computations to estimate participant plan benefits to which the employees will beentitled. The significant assumptions primarily relate to discount rates, expected long-term rates ofreturn on plan assets, rate of future compensation increases, mortality, years of service, and otherfactors. The Company develops each assumption using relevant experience in conjunction with market-related data for each individual country in which such plans exist. All actuarial assumptions arereviewed annually with third-party consultants and adjusted as necessary. For the recognition of netperiodic postretirement cost, the calculation of the expected return on plan assets is generally derivedby applying the expected long-term rate of return on the market-related value of plan assets. The fairvalue of plan assets is determined based on actual market prices or estimated fair value at themeasurement date.
Restructuring and Related Charges
The Company accounts for costs associated with exit or disposal in accordance with ASC 420, Exitor Disposal Cost Obligations, which requires that (i) liabilities associated with exit and disposal activitiesbe measured at fair value; (ii) onetime termination benefits be expensed at the date the entity notifiesthe employee, unless the employee must provide future service, in which case the benefits are expensedratably over the future service period; (iii) liabilities related to an operating lease/contract berecognized and measured at its fair value when the contract does not have any future economic benefitto the entity (i.e., the entity ceases to utilize the rights conveyed by the contract); and (iv) for typicallyall other costs related to an exit or disposal activity to be expensed as incurred.
Treated Water Outsourcing
Treated Water Outsourcing (TWO) is a joint venture between the Company and the Ondeo NalcoCompany (Nalco) to sell water management equipment and services to industrial customers locatedthroughout the United States.
On October 1, 2015, a change occurred in the partnership structure of TWO such that theCompany is now obligated to absorb all risk of loss up to 100% of the joint venture partner’s equity.As such, the accounting for the Company’s 50% interest changed from equity method investment tofull consolidation as a variable interest entity (VIE) under ASC 810, Consolidation.
The following provides a summary of TWO as of September 30, 2016 and June 30, 2017. TheCompany has not provided additional financial support to this entity which it is not contractually
F-67

Notes to Unaudited Condensed Consolidated Financial Statements (Continued)
(in thousands)
September 30, 2016 and June 30, 2017
2. Summary of Significant Accounting Policies (Continued)
required to provide, and the Company does not have the ability to use the assets of TWO to settleobligations of the Company’s other subsidiaries.
September 30, June 30,2016 2017
Current Assets (including $7,370 and $3,859) . . . . . . . . . . . . . . . . . . . . . . . . . . 9,048 10,864Property, Plant and Equipment . . . . . . . . . . . . . . . . . . . . . . . . . . . . . . . . . . . . 8,481 6,594Goodwill . . . . . . . . . . . . . . . . . . . . . . . . . . . . . . . . . . . . . . . . . . . . . . . . . . . . 2,206 2,206Other noncurrent assets . . . . . . . . . . . . . . . . . . . . . . . . . . . . . . . . . . . . . . . . . 8,229 525Total liabilities . . . . . . . . . . . . . . . . . . . . . . . . . . . . . . . . . . . . . . . . . . . . . . . . (16,684) (13,713)
Nine months ended
June 30, June 30,2016 2017
Total revenues . . . . . . . . . . . . . . . . . . . . . . . . . . . . . . . . . . . . . . . . . . . . . . . . . . $12,372 $11,645Total expenses . . . . . . . . . . . . . . . . . . . . . . . . . . . . . . . . . . . . . . . . . . . . . . . . . . 10,080 8,857Income from operations . . . . . . . . . . . . . . . . . . . . . . . . . . . . . . . . . . . . . . . . . . . $ 2,292 $ 2,788
Accounting Pronouncements Not Yet Adopted
In May 2014, the FASB issued ASU No. 2014-09, Revenue from Contracts with Customers(Topic 606). ASU No. 2014-09 clarifies the principles for recognizing revenue when an entity eitherenters into a contract with customers to transfer goods or services or enters into a contract for thetransfer of non-financial assets. ASU 2014-09 may be adopted using either of two acceptable methods:(1) retrospective adoption to each prior period presented with the option to elect certain practicalexpedients; or (2) adoption with the cumulative effect recognized at the date of initial application andproviding certain disclosures. To assess at which time revenue should be recognized, an entity shoulduse the following steps: (1) identify the contract(s) with a customer; (2) identify the performanceobligations in the contract; (3) determine the transaction price; (4) allocate the transaction price to theperformance obligations in the contract; and (5) recognize revenue when, or as, the entity satisfies aperformance obligation. The standard is effective for the Company for the quarter endingDecember 31, 2018. The Company has engaged a third party to assist in assessing the impact adoptionof this guidance will have on its consolidated financial statements.
In February 2016, the FASB issued ASU No. 2016-02, Leases (Topic 842). ASU No. 2016-02requires recognition of operating leases as lease assets and liabilities on the balance sheet, anddisclosure of key information about leasing arrangements. ASU No. 2016-02 will be effectiveretrospectively for the Company for the quarter ending December 31, 2019, with early adoptionpermitted. The Company is currently assessing the impact adoption of this guidance will have on itsconsolidated financial statements.
In March 2016, the FASB issued (ASU) 2016-09, Improvements to Employee Share-Based PaymentAccounting, which amends ASC Topic 718, Compensation—Stock Compensation. The ASU includesprovisions intended to simplify various aspects related to how share-based payments are accounted forand presented in the financial statements. ASU No. 2016-09 will be effective for the Company for the
F-68
Notes to Unaudited Condensed Consolidated Financial Statements (Continued)
(in thousands)
September 30, 2016 and June 30, 2017
2. Summary of Significant Accounting Policies (Continued)
quarter ending December 31, 2017. This update is not expected to have an impact on the Company’sconsolidated financial statements.
In January 2017, the FASB issued ASU 2017-04, Simplifying the Test for Goodwill Impairment. ThisASU simplifies how an entity is required to test goodwill for impairment by eliminating Step 2 from thegoodwill impairment test. Step 2 measures a goodwill impairment loss by comparing the implied valueof a reporting unit’s goodwill with the carrying amount of that goodwill. The amendments in this ASUare effective for the Company for the quarter ending December 31, 2020. The Company does notexpect this to have a material impact on the Consolidated Financial Statements.
In August 2016, the FASB issued ASU 2016-16, Statement of Cash Flows (Topic 230): Classificationof Certain Cash Receipts and Cash Payments (a consensus of the Emerging Issues Task Force). This newguidance is intended to reduce diversity in practice in how certain transactions are classified in thestatement of cash flows. ASU No. 2016-15 will be effective for the Company for the quarter endingDecember 31, 2017, with early adoption permitted. The guidance should be applied retrospectively toall periods presented, unless deem impracticable, in which case prospective application is permitted.The Company is currently evaluating the potential impact of adoption on the Company’s ConsolidatedFinancial Statements.
In May 2017, the FASB issued ASU 2017-09, Scope of Modification Accounting, which amendedAccounting Standards Code Topic 718. FASB issued ASU 2017-09 to reduce the cost and complexitywhen applying Topic 718 and standardize the practice of applying Topic 718 to financial reporting. TheASU was not developed to fundamentally change the definition of a modification, but instead toprovide guidance for what changes would qualify as a modification. ASU No. 2017-09 will be effectivefor the Company for the quarter ending December 31, 2018. The Company is currently evaluating thepotential impact of adoption on the Company’s Consolidated Financial Statements.
3. Acquisitions and Divestitures
Acquisitions support the Company’s strategy of delivering a broad solutions portfolio with robusttechnology across multiple geographies and end markets. The following acquisitions were made duringthe year ending September 30, 2016:
On April 11, 2016, the Company acquired 100% of privately held Magneto, a leader in thedevelopment and manufacture of anodes for the electrochemical industry and refurbishment of electrochlorination cells for seawater electrolysis, for A23,585 (approximately $26,729). As a result of theacquisition, approximately $700 of acquisition costs were incurred which are included in General andadministrative expenses. The company has approximately 120 employees across its two locations inSchiedam, the Netherlands and Suzhou, China. Magneto is included in the results of the Productssegment of the Company.
On April 15, 2016, the Company acquired 100% of privately held Neptune-Benson, a leadingmanufacturer of high-quality water filtration and disinfection products for the recreational, industrial,and municipal water markets for $283,704, less cash received of $2,357, of which $185,000 was fundedthrough newly acquired debt, $8,950 was contributed capital in the form of equity provided to thesellers, and the remaining was paid with cash. The Company incurred approximately $2,099 ofacquisition costs, which are included in General and administrative expenses. The company hasapproximately 110 employees across its United States and Canadian locations. Neptune Benson isincluded in the results the Products segment of the Company.
F-69

Notes to Unaudited Condensed Consolidated Financial Statements (Continued)
(in thousands)
September 30, 2016 and June 30, 2017
3. Acquisitions and Divestitures (Continued)
The following table presents the unaudited pro forma results for the nine months ended June 30,2016. The unaudited pro forma financial information combines the results of operations of EWT andNeptune Benson as though the Company had been combined as of October 1, 2015, and the pro formainformation is presented for informational purposes only and is not indicative of the results ofoperations that would have been achieved if the acquisition had taken place at such time. Theunaudited pro forma results presented below include adjustments for increased fair value of acquiredintangible assets and related amortization charges, acquisition costs, and interest.
Nine months ended
June 30, June 30,2016(a) 2017(b)
Total revenues . . . . . . . . . . . . . . . . . . . . . . . . . . . . . . . . . . . $851,981 $890,916Net (loss) income attributable to EWT Holdings I Corp. . . . . 16,741 (8,898)
(a) Proforma combined
(b) Nine months ended June 30, 2017 will be equivalent to the results in the Condensed Consolidated Statements ofOperations
On July 1, 2016, the Company acquired essentially all of the assets of Valve and FiltrationSystems, Ltd (VAF) through its recently acquired Neptune Benson business for approximately $3,317;$2,667 cash at closing, in addition to earn out payments over the next five years. Included inconsideration is $650, which represents the fair value of the earn outs at the date of the acquisition,with a maximum earnout payment of $1,000. VAF is a leading screen filtration manufacturer based inArvada, Colorado, and has 12 employees. VAF’s results are included within the Products segment ofthe Company.
On August 3, 2016, the Company acquired 100% of Delta Ultraviolet Corporation (Delta UV), aleading manufacturer and marketer of UV-C technology in North America, through the recentlyacquired Neptune Benson business for $4,813. The Company incurred approximately $100 ofacquisition costs, included in General and administrative expenses. Delta UV is based in Gardena,California and had 17 employees. Delta’s results are included within the Products segment of theCompany.
F-70
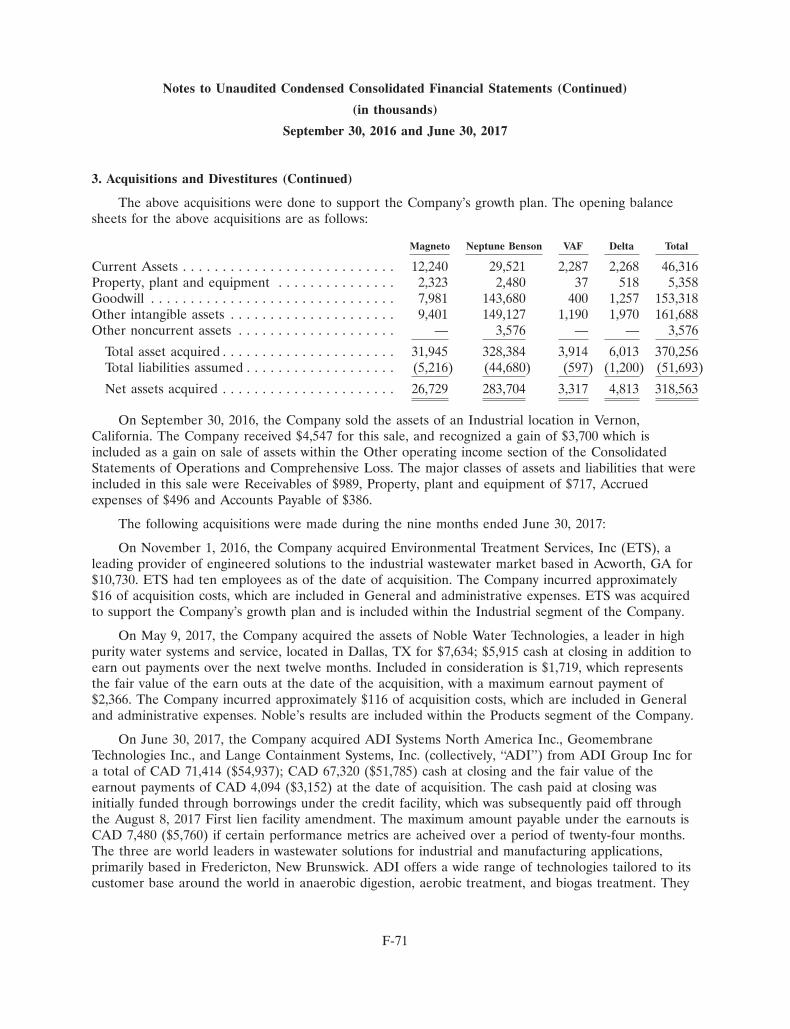
Notes to Unaudited Condensed Consolidated Financial Statements (Continued)
(in thousands)
September 30, 2016 and June 30, 2017
3. Acquisitions and Divestitures (Continued)
The above acquisitions were done to support the Company’s growth plan. The opening balancesheets for the above acquisitions are as follows:
Magneto Neptune Benson VAF Delta Total
Current Assets . . . . . . . . . . . . . . . . . . . . . . . . . . . 12,240 29,521 2,287 2,268 46,316Property, plant and equipment . . . . . . . . . . . . . . . 2,323 2,480 37 518 5,358Goodwill . . . . . . . . . . . . . . . . . . . . . . . . . . . . . . . 7,981 143,680 400 1,257 153,318Other intangible assets . . . . . . . . . . . . . . . . . . . . . 9,401 149,127 1,190 1,970 161,688Other noncurrent assets . . . . . . . . . . . . . . . . . . . . — 3,576 — — 3,576
Total asset acquired . . . . . . . . . . . . . . . . . . . . . . 31,945 328,384 3,914 6,013 370,256Total liabilities assumed . . . . . . . . . . . . . . . . . . . (5,216) (44,680) (597) (1,200) (51,693)
Net assets acquired . . . . . . . . . . . . . . . . . . . . . . 26,729 283,704 3,317 4,813 318,563
On September 30, 2016, the Company sold the assets of an Industrial location in Vernon,California. The Company received $4,547 for this sale, and recognized a gain of $3,700 which isincluded as a gain on sale of assets within the Other operating income section of the ConsolidatedStatements of Operations and Comprehensive Loss. The major classes of assets and liabilities that wereincluded in this sale were Receivables of $989, Property, plant and equipment of $717, Accruedexpenses of $496 and Accounts Payable of $386.
The following acquisitions were made during the nine months ended June 30, 2017:
On November 1, 2016, the Company acquired Environmental Treatment Services, Inc (ETS), aleading provider of engineered solutions to the industrial wastewater market based in Acworth, GA for$10,730. ETS had ten employees as of the date of acquisition. The Company incurred approximately$16 of acquisition costs, which are included in General and administrative expenses. ETS was acquiredto support the Company’s growth plan and is included within the Industrial segment of the Company.
On May 9, 2017, the Company acquired the assets of Noble Water Technologies, a leader in highpurity water systems and service, located in Dallas, TX for $7,634; $5,915 cash at closing in addition toearn out payments over the next twelve months. Included in consideration is $1,719, which representsthe fair value of the earn outs at the date of the acquisition, with a maximum earnout payment of$2,366. The Company incurred approximately $116 of acquisition costs, which are included in Generaland administrative expenses. Noble’s results are included within the Products segment of the Company.
On June 30, 2017, the Company acquired ADI Systems North America Inc., GeomembraneTechnologies Inc., and Lange Containment Systems, Inc. (collectively, ‘‘ADI’’) from ADI Group Inc fora total of CAD 71,414 ($54,937); CAD 67,320 ($51,785) cash at closing and the fair value of theearnout payments of CAD 4,094 ($3,152) at the date of acquisition. The cash paid at closing wasinitially funded through borrowings under the credit facility, which was subsequently paid off throughthe August 8, 2017 First lien facility amendment. The maximum amount payable under the earnouts isCAD 7,480 ($5,760) if certain performance metrics are acheived over a period of twenty-four months.The three are world leaders in wastewater solutions for industrial and manufacturing applications,primarily based in Fredericton, New Brunswick. ADI offers a wide range of technologies tailored to itscustomer base around the world in anaerobic digestion, aerobic treatment, and biogas treatment. They
F-71

Notes to Unaudited Condensed Consolidated Financial Statements (Continued)
(in thousands)
September 30, 2016 and June 30, 2017
3. Acquisitions and Divestitures (Continued)
also provide green energy recovery and water reuse technologies as well as industrial wastewater coverliners and containment systems. Combined, ADI has more than 260 customers in 35 countries. ADI’sresults are included within the Industrial segment of the Company. The Company incurredapproximately $109 of acquisition costs, which are included in General and administrative expenses.
On June 30, 2017, the Company acquired Olson Irrigation Systems, a leading designer andproducer of filters and irrigation components for the agriculture and industrial markets, based inSantee, California, for $9,406. Olson is part of the Company’s Product segment and will help thebusiness build upon its leadership in filtration serving a broad range of industrial applications. TheCompany incurred approximately $140 of acquisition costs, which are included in General andadministrative expenses.
The preliminary opening balance sheet for the acquisitions is summarized as follows:
ETS Noble ADI Olson Total
Current Assets . . . . . . . . . . . . . . . . . . . . . . . . . . . . . . $ 782 $ 618 $14,579 $2,417 $18,396Property, plant and equipment . . . . . . . . . . . . . . . . . . 376 256 719 593 1,944Goodwill . . . . . . . . . . . . . . . . . . . . . . . . . . . . . . . . . . 5,619 4,135 34,734 3,566 48,054Other intangible assets . . . . . . . . . . . . . . . . . . . . . . . . 3,953 2,916 13,244 3,263 23,376
Total asset acquired . . . . . . . . . . . . . . . . . . . . . . . . 10,730 7,925 63,276 9,839 91,770Total liabilities assumed . . . . . . . . . . . . . . . . . . . . . — (291) (8,339) (433) (9,063)
Net assets acquired . . . . . . . . . . . . . . . . . . . . . . . . . $10,730 $7,634 $54,937 $9,406 $82,707
4. Fair Value Measurements
As of September 30, 2016 and June 30, 2017, the fair values of cash and cash equivalents, accountsreceivable and accounts payable approximate carrying values due to the short maturity of these items.
The Company measures the fair value of pension plan assets and liabilities, deferred compensationplan assets and liabilities and long-term debt on a recurring basis pursuant to ASC Topic 820.ASC Topic 820 establishes a three-tier fair value hierarchy, which prioritizes the inputs used inmeasuring fair value. These tiers include:
Level 1: Quoted prices for identical instruments in active markets.
Level 2: Quoted prices for similar instruments in active markets; quoted prices for identical orsimilar instruments in markets that are not active; and model-derived valuations whose inputs areobservable or whose significant value driver is observable.
Level 3: Unobservable inputs in which little or no market data is available, therefore requiring anentity to develop its own assumptions.
F-72
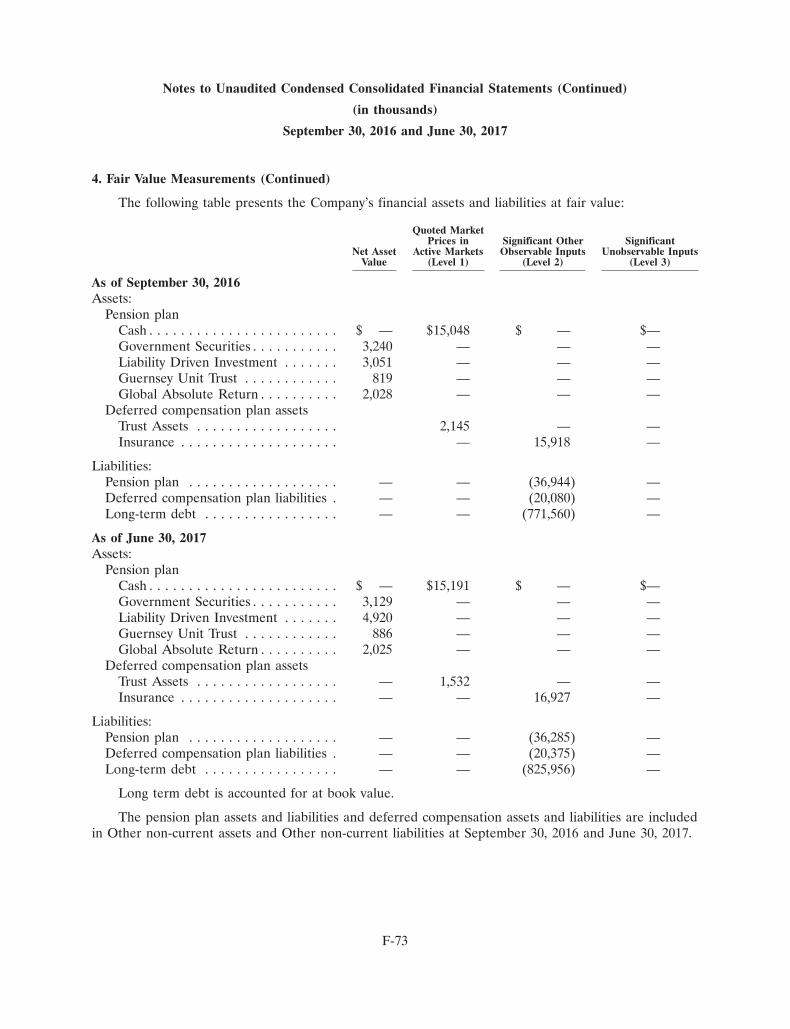
Notes to Unaudited Condensed Consolidated Financial Statements (Continued)
(in thousands)
September 30, 2016 and June 30, 2017
4. Fair Value Measurements (Continued)
The following table presents the Company’s financial assets and liabilities at fair value:
Quoted MarketPrices in Significant Other Significant
Net Asset Active Markets Observable Inputs Unobservable InputsValue (Level 1) (Level 2) (Level 3)
As of September 30, 2016Assets:
Pension planCash . . . . . . . . . . . . . . . . . . . . . . . . $ — $15,048 $ — $—Government Securities . . . . . . . . . . . 3,240 — — —Liability Driven Investment . . . . . . . 3,051 — — —Guernsey Unit Trust . . . . . . . . . . . . 819 — — —Global Absolute Return . . . . . . . . . . 2,028 — — —
Deferred compensation plan assetsTrust Assets . . . . . . . . . . . . . . . . . . 2,145 — —Insurance . . . . . . . . . . . . . . . . . . . . — 15,918 —
Liabilities:Pension plan . . . . . . . . . . . . . . . . . . . — — (36,944) —Deferred compensation plan liabilities . — — (20,080) —Long-term debt . . . . . . . . . . . . . . . . . — — (771,560) —
As of June 30, 2017Assets:
Pension planCash . . . . . . . . . . . . . . . . . . . . . . . . $ — $15,191 $ — $—Government Securities . . . . . . . . . . . 3,129 — — —Liability Driven Investment . . . . . . . 4,920 — — —Guernsey Unit Trust . . . . . . . . . . . . 886 — — —Global Absolute Return . . . . . . . . . . 2,025 — — —
Deferred compensation plan assetsTrust Assets . . . . . . . . . . . . . . . . . . — 1,532 — —Insurance . . . . . . . . . . . . . . . . . . . . — — 16,927 —
Liabilities:Pension plan . . . . . . . . . . . . . . . . . . . — — (36,285) —Deferred compensation plan liabilities . — — (20,375) —Long-term debt . . . . . . . . . . . . . . . . . — — (825,956) —
Long term debt is accounted for at book value.
The pension plan assets and liabilities and deferred compensation assets and liabilities are includedin Other non-current assets and Other non-current liabilities at September 30, 2016 and June 30, 2017.
F-73

Notes to Unaudited Condensed Consolidated Financial Statements (Continued)
(in thousands)
September 30, 2016 and June 30, 2017
5. Accounts Receivable
Accounts receivable are summarized as follows:
September 30, June 30,2016 2017
Accounts Receivable . . . . . . . . . . . . . . . . . . . . . . . . . . . . . $189,573 $206,060Allowance for Doubtful Accounts . . . . . . . . . . . . . . . . . . . (4,784) (3,591)
$184,789 $202,469
6. Inventories
The major classes of inventory, net are as follows:
September 30, June 30,2016 2017
Raw materials and supplies . . . . . . . . . . . . . . . . . . . . . . . . $ 60,363 $ 65,951Work in progress . . . . . . . . . . . . . . . . . . . . . . . . . . . . . . . 17,039 17,042Finished goods and products held for resale . . . . . . . . . . . . 39,961 47,133Costs of unbilled projects . . . . . . . . . . . . . . . . . . . . . . . . . 5,825 5,474Advance payment from customers . . . . . . . . . . . . . . . . . . . (655) (754)Reserves for excess and obsolete . . . . . . . . . . . . . . . . . . . . (10,141) (11,340)
$112,392 $123,506
7. Property, Plant, and Equipment
Property, plant, and equipment consists of the following:
September 30, June 30,2016 2017
Machinery and equipment . . . . . . . . . . . . . . . . . . . . . . . . $ 264,302 $ 311,939Land and buildings . . . . . . . . . . . . . . . . . . . . . . . . . . . . . 79,423 81,075Construction in process . . . . . . . . . . . . . . . . . . . . . . . . . . 27,388 31,949
371,113 424,963Less: accumulated depreciation . . . . . . . . . . . . . . . . . . . . (114,348) (153,133)
$ 256,765 $ 271,830
Depreciation expense, including depreciation expense for capital leases, was $38,147 and $38,645for the nine months ended June 30, 2016 and 2017, respectively. Maintenance and repair expense was$16,133 and $15,905 for the nine months ended June 30, 2016 and 2017, respectively.
F-74
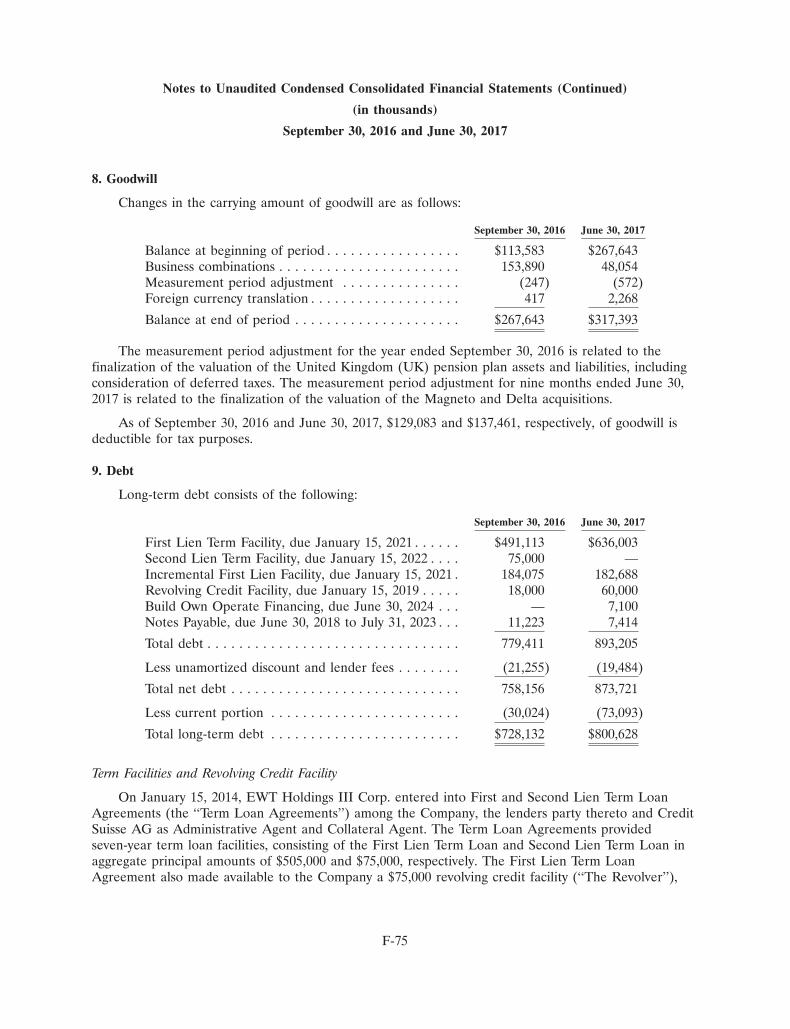
Notes to Unaudited Condensed Consolidated Financial Statements (Continued)
(in thousands)
September 30, 2016 and June 30, 2017
8. Goodwill
Changes in the carrying amount of goodwill are as follows:
September 30, 2016 June 30, 2017
Balance at beginning of period . . . . . . . . . . . . . . . . . $113,583 $267,643Business combinations . . . . . . . . . . . . . . . . . . . . . . . 153,890 48,054Measurement period adjustment . . . . . . . . . . . . . . . (247) (572)Foreign currency translation . . . . . . . . . . . . . . . . . . . 417 2,268
Balance at end of period . . . . . . . . . . . . . . . . . . . . . $267,643 $317,393
The measurement period adjustment for the year ended September 30, 2016 is related to thefinalization of the valuation of the United Kingdom (UK) pension plan assets and liabilities, includingconsideration of deferred taxes. The measurement period adjustment for nine months ended June 30,2017 is related to the finalization of the valuation of the Magneto and Delta acquisitions.
As of September 30, 2016 and June 30, 2017, $129,083 and $137,461, respectively, of goodwill isdeductible for tax purposes.
9. Debt
Long-term debt consists of the following:
September 30, 2016 June 30, 2017
First Lien Term Facility, due January 15, 2021 . . . . . . $491,113 $636,003Second Lien Term Facility, due January 15, 2022 . . . . 75,000 —Incremental First Lien Facility, due January 15, 2021 . 184,075 182,688Revolving Credit Facility, due January 15, 2019 . . . . . 18,000 60,000Build Own Operate Financing, due June 30, 2024 . . . — 7,100Notes Payable, due June 30, 2018 to July 31, 2023 . . . 11,223 7,414
Total debt . . . . . . . . . . . . . . . . . . . . . . . . . . . . . . . . 779,411 893,205
Less unamortized discount and lender fees . . . . . . . . (21,255) (19,484)
Total net debt . . . . . . . . . . . . . . . . . . . . . . . . . . . . . 758,156 873,721
Less current portion . . . . . . . . . . . . . . . . . . . . . . . . (30,024) (73,093)
Total long-term debt . . . . . . . . . . . . . . . . . . . . . . . . $728,132 $800,628
Term Facilities and Revolving Credit Facility
On January 15, 2014, EWT Holdings III Corp. entered into First and Second Lien Term LoanAgreements (the ‘‘Term Loan Agreements’’) among the Company, the lenders party thereto and CreditSuisse AG as Administrative Agent and Collateral Agent. The Term Loan Agreements providedseven-year term loan facilities, consisting of the First Lien Term Loan and Second Lien Term Loan inaggregate principal amounts of $505,000 and $75,000, respectively. The First Lien Term LoanAgreement also made available to the Company a $75,000 revolving credit facility (‘‘The Revolver’’),
F-75

Notes to Unaudited Condensed Consolidated Financial Statements (Continued)
(in thousands)
September 30, 2016 and June 30, 2017
9. Debt (Continued)
which contains a Letter of Credit sub-facility up to $35,000. These borrowings were issued at a discountto face value of .5% aggregating $2,900 and net of lender arrangement fees aggregating $16,700.Additional capitalized financing fees, including lender fees paid for the Revolving Credit Facilityplacement, aggregated $5,483. The First Lien Term Loan bears interest based on a variable rate subjectto a 1% floor + 3.75% spread. As of June 30, 2017, the applicable First Lien Term Loan interest ratewas 4.75%. First Lien principal and interest is payable in quarterly installments, with quarterly principalreductions of $1,648, and the balance due at maturity.
In April, 2016 the Company issued an Incremental First Lien Term Loan (the ‘‘Incremental FirstLien’’), in an aggregate principal amount of $185,000, with a 1% discount. The proceeds of theIncremental First Lien facility were used to finance the acquisition of Neptune Benson. TheIncremental First Lien bears interest based on a variable rate subject to a 1% floor + 4.5% spread,with quarterly interest payments and principal reductions of $462.5 through maturity. As of June 30,2017, the applicable Incremental First Lien interest rate was 5.65%. The Incremental Term Loan iscoterminous with the existing First Lien Term Loan. The Incremental First Lien borrowing issued inApril, 2016 was issued at a discount to face value of 1%, aggregating $1,850. Additional capitalizedfinancing fees associated with the transaction aggregated $4,446. Both of these amounts are included asa contra liability to debt and total $5,689 and $4,692, net of amortization, at September 30, 2016 andJune 30, 2017, respectively.
On October 28, 2016, the Company completed a tack-on financing to the First Lien Term Loan for$150,000, issued at a 0.25% discount of $375. The Company also upsized the Revolving Credit Facilitycapacity by $20,000 through this transaction, resulting in total Revolving Credit capacity of $95,000. TheCompany incurred $4,264 of additional financing fees related to this transaction, of which $3,823 werecapitalized and are included as a contra liability to debt on the balance sheet.
Proceeds from this transaction were used to repay $33,000 outstanding on the Revolving CreditFacility, and to extinguish the $75,000 Second Lien Term Loan facility. The Company had $2,075 ofunamortized fees related to the Second Lien Term Loan facility outstanding on October 28, 2016,which were written off upon extinguishment of the Second Lien debt.
Total fees, net of amortization, were $15,566 related to the First and Second Lien Term Loans, asof September 30, 2016. Total fees, net of amortization, were $14,792 related to the First Lien TermLoan and Incremental First Lien Term Loan as of June 30, 2017. These fees were included as acontract liability to debt on the balance sheet.
On June 30, 2017, the Company completed a Build Own Operate financing for $7,100. TheCompany incurred $50 of additional financing fees related to this transaction, which have beencapitalized and are included as a contra liability on the balance sheet. This financing fully amortizesover the seven year tenure and at an interest rate of one month LIBOR plus 300 basis points. At thetime of entering into the loan, the company entered into a swap transaction for the duration of theloan fixing the obligation at a rate of 5.08% per annum. Principal obligations are $254 per quarter.
Borrowings under the Revolving Credit Facility bear interest at variable rates plus a marginranging from 225 to 325 basis points, dependent upon The Company’s leverage ratio and Variable Rateselected. Base Rate borrowings under the Revolving Credit Facility at June 30, 2017 would haveincurred interest at 6.50%, calculated as the 225 basis point floor plus the Prime Rate of 3.75%. The
F-76

Notes to Unaudited Condensed Consolidated Financial Statements (Continued)
(in thousands)
September 30, 2016 and June 30, 2017
9. Debt (Continued)
weighted average interest rate on Revolver borrowings at September 30, 2016 was 4.66%. Base rateRevolver interest is calculated as the greatest of the Federal Funds Rate + 5 basis points, 1-MonthLIBOR + 1%, or the Prime Rate, plus 225 basis points.
The Company has borrowing availability under the Revolving Credit Facility of $75,000 and$95,000 and at September 30, 2016 and June 30, 2017, respectively, reduced for outstanding letter ofcredit guarantees. Such letter of credit guarantees are subject to a $35,000 sublimit within theRevolving Credit Facility. The Company’s outstanding letter of credit guarantees under this agreementaggregated approximately $9,742 and $7,476 at September 30, 2016 and June 30, 2017, respectively. Asof September 30, 2016 and June 30, 2017, the Company had outstanding revolver borrowings of $18,000and $60,000, with an unused portion of $47,258 and $27,524, respectively. The Company has issuedadditional letters of credit of $8,423 under a separate arrangement.
The Term Loan Agreement contains limitations on incremental borrowings, is subject to leverageratios and allow for prepayment. Under certain circumstances beginning with fiscal 2015 results ofoperations, the Company may be required to remit excess cash flows as defined based upon exceedingcertain leverage ratios. The Company did not exceed such ratios during fiscal 2016, does not anticipateexceeding such ratios during 2017, and therefore does not anticipate any additional repayments during2017.
Notes Payable
As of September 30, 2016 and June 30, 2017, the Company had notes payable in an aggregateoutstanding amount of $11,223 and $7,414, with interest rates ranging from 6.26% to 7.39%, and duedates ranging from June 30, 2018 to July 31, 2023. These notes are related to certain equipment relatedcontracts and are secured by the underlying equipment and assignment of the related contracts.
Repayment Schedule
Aggregate maturities of all long-term debt, including current portion of long-term debt andexcluding capital lease obligations as of June 30, 2017, are presented below:
Fiscal YearRemainder of 2017 . . . . . . . . . . . . . . . . . . . . . . . . . . . . . . . . . . . . . . . $ 63,6792018 . . . . . . . . . . . . . . . . . . . . . . . . . . . . . . . . . . . . . . . . . . . . . . . . . 13,4512019 . . . . . . . . . . . . . . . . . . . . . . . . . . . . . . . . . . . . . . . . . . . . . . . . . 9,9792020 . . . . . . . . . . . . . . . . . . . . . . . . . . . . . . . . . . . . . . . . . . . . . . . . . 9,8782021 . . . . . . . . . . . . . . . . . . . . . . . . . . . . . . . . . . . . . . . . . . . . . . . . . 792,704Thereafter . . . . . . . . . . . . . . . . . . . . . . . . . . . . . . . . . . . . . . . . . . . . . 3,514
Total . . . . . . . . . . . . . . . . . . . . . . . . . . . . . . . . . . . . . . . . . . . . . . . . . . . $893,205
10. Product Warranties
The Company accrues warranty obligations associated with certain products as revenue isrecognized. Provisions for the warranty obligations are based upon historical experience of costs
F-77
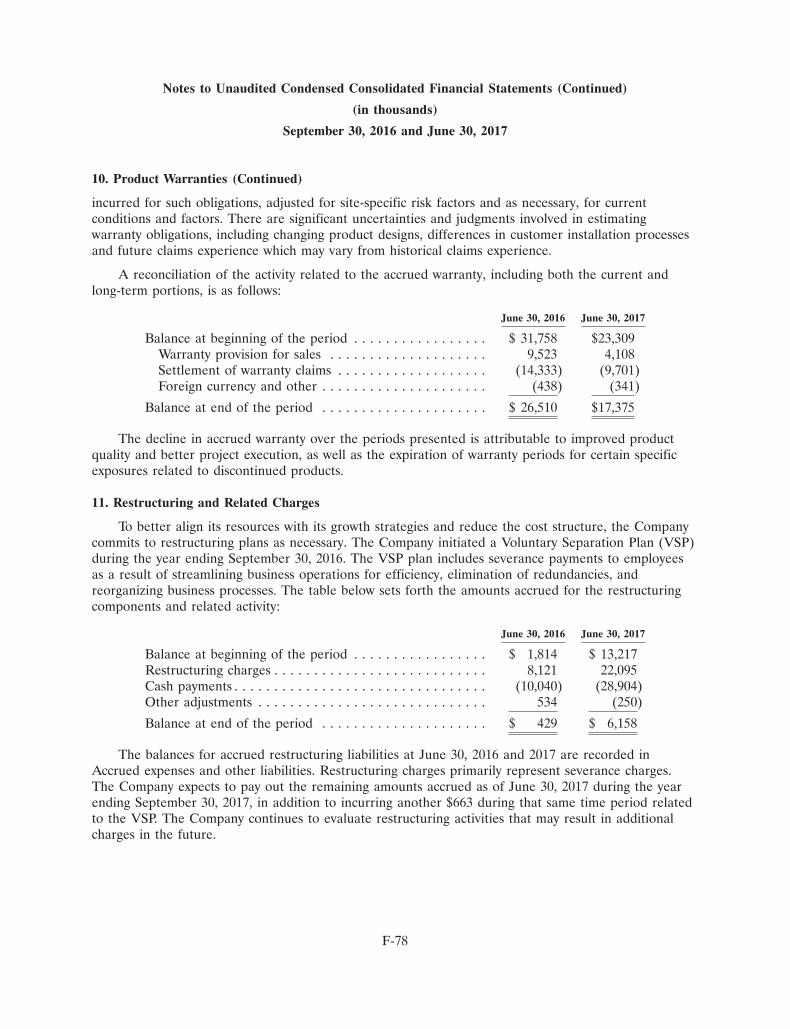
Notes to Unaudited Condensed Consolidated Financial Statements (Continued)
(in thousands)
September 30, 2016 and June 30, 2017
10. Product Warranties (Continued)
incurred for such obligations, adjusted for site-specific risk factors and as necessary, for currentconditions and factors. There are significant uncertainties and judgments involved in estimatingwarranty obligations, including changing product designs, differences in customer installation processesand future claims experience which may vary from historical claims experience.
A reconciliation of the activity related to the accrued warranty, including both the current andlong-term portions, is as follows:
June 30, 2016 June 30, 2017
Balance at beginning of the period . . . . . . . . . . . . . . . . . $ 31,758 $23,309Warranty provision for sales . . . . . . . . . . . . . . . . . . . . 9,523 4,108Settlement of warranty claims . . . . . . . . . . . . . . . . . . . (14,333) (9,701)Foreign currency and other . . . . . . . . . . . . . . . . . . . . . (438) (341)
Balance at end of the period . . . . . . . . . . . . . . . . . . . . . $ 26,510 $17,375
The decline in accrued warranty over the periods presented is attributable to improved productquality and better project execution, as well as the expiration of warranty periods for certain specificexposures related to discontinued products.
11. Restructuring and Related Charges
To better align its resources with its growth strategies and reduce the cost structure, the Companycommits to restructuring plans as necessary. The Company initiated a Voluntary Separation Plan (VSP)during the year ending September 30, 2016. The VSP plan includes severance payments to employeesas a result of streamlining business operations for efficiency, elimination of redundancies, andreorganizing business processes. The table below sets forth the amounts accrued for the restructuringcomponents and related activity:
June 30, 2016 June 30, 2017
Balance at beginning of the period . . . . . . . . . . . . . . . . . $ 1,814 $ 13,217Restructuring charges . . . . . . . . . . . . . . . . . . . . . . . . . . . 8,121 22,095Cash payments . . . . . . . . . . . . . . . . . . . . . . . . . . . . . . . . (10,040) (28,904)Other adjustments . . . . . . . . . . . . . . . . . . . . . . . . . . . . . 534 (250)
Balance at end of the period . . . . . . . . . . . . . . . . . . . . . $ 429 $ 6,158
The balances for accrued restructuring liabilities at June 30, 2016 and 2017 are recorded inAccrued expenses and other liabilities. Restructuring charges primarily represent severance charges.The Company expects to pay out the remaining amounts accrued as of June 30, 2017 during the yearending September 30, 2017, in addition to incurring another $663 during that same time period relatedto the VSP. The Company continues to evaluate restructuring activities that may result in additionalcharges in the future.
F-78
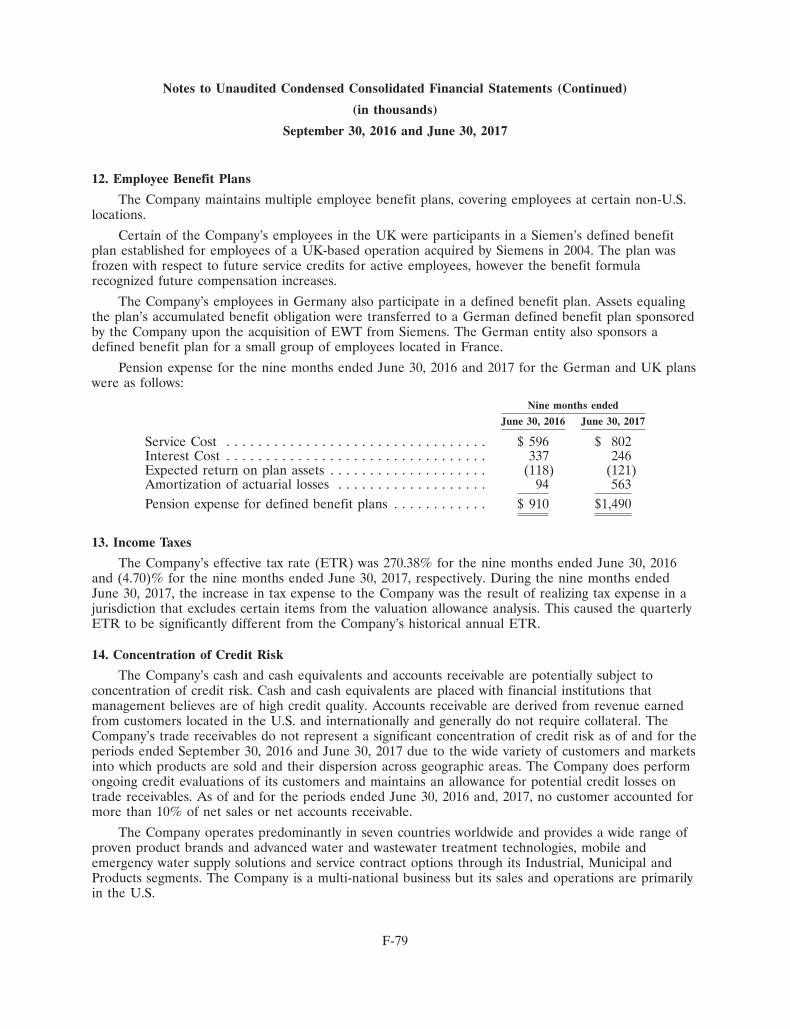
Notes to Unaudited Condensed Consolidated Financial Statements (Continued)
(in thousands)
September 30, 2016 and June 30, 2017
12. Employee Benefit Plans
The Company maintains multiple employee benefit plans, covering employees at certain non-U.S.locations.
Certain of the Company’s employees in the UK were participants in a Siemen’s defined benefitplan established for employees of a UK-based operation acquired by Siemens in 2004. The plan wasfrozen with respect to future service credits for active employees, however the benefit formularecognized future compensation increases.
The Company’s employees in Germany also participate in a defined benefit plan. Assets equalingthe plan’s accumulated benefit obligation were transferred to a German defined benefit plan sponsoredby the Company upon the acquisition of EWT from Siemens. The German entity also sponsors adefined benefit plan for a small group of employees located in France.
Pension expense for the nine months ended June 30, 2016 and 2017 for the German and UK planswere as follows:
Nine months ended
June 30, 2016 June 30, 2017
Service Cost . . . . . . . . . . . . . . . . . . . . . . . . . . . . . . . . . $ 596 $ 802Interest Cost . . . . . . . . . . . . . . . . . . . . . . . . . . . . . . . . . 337 246Expected return on plan assets . . . . . . . . . . . . . . . . . . . . (118) (121)Amortization of actuarial losses . . . . . . . . . . . . . . . . . . . 94 563Pension expense for defined benefit plans . . . . . . . . . . . . $ 910 $1,490
13. Income Taxes
The Company’s effective tax rate (ETR) was 270.38% for the nine months ended June 30, 2016and (4.70)% for the nine months ended June 30, 2017, respectively. During the nine months endedJune 30, 2017, the increase in tax expense to the Company was the result of realizing tax expense in ajurisdiction that excludes certain items from the valuation allowance analysis. This caused the quarterlyETR to be significantly different from the Company’s historical annual ETR.
14. Concentration of Credit Risk
The Company’s cash and cash equivalents and accounts receivable are potentially subject toconcentration of credit risk. Cash and cash equivalents are placed with financial institutions thatmanagement believes are of high credit quality. Accounts receivable are derived from revenue earnedfrom customers located in the U.S. and internationally and generally do not require collateral. TheCompany’s trade receivables do not represent a significant concentration of credit risk as of and for theperiods ended September 30, 2016 and June 30, 2017 due to the wide variety of customers and marketsinto which products are sold and their dispersion across geographic areas. The Company does performongoing credit evaluations of its customers and maintains an allowance for potential credit losses ontrade receivables. As of and for the periods ended June 30, 2016 and, 2017, no customer accounted formore than 10% of net sales or net accounts receivable.
The Company operates predominantly in seven countries worldwide and provides a wide range ofproven product brands and advanced water and wastewater treatment technologies, mobile andemergency water supply solutions and service contract options through its Industrial, Municipal andProducts segments. The Company is a multi-national business but its sales and operations are primarilyin the U.S.
F-79
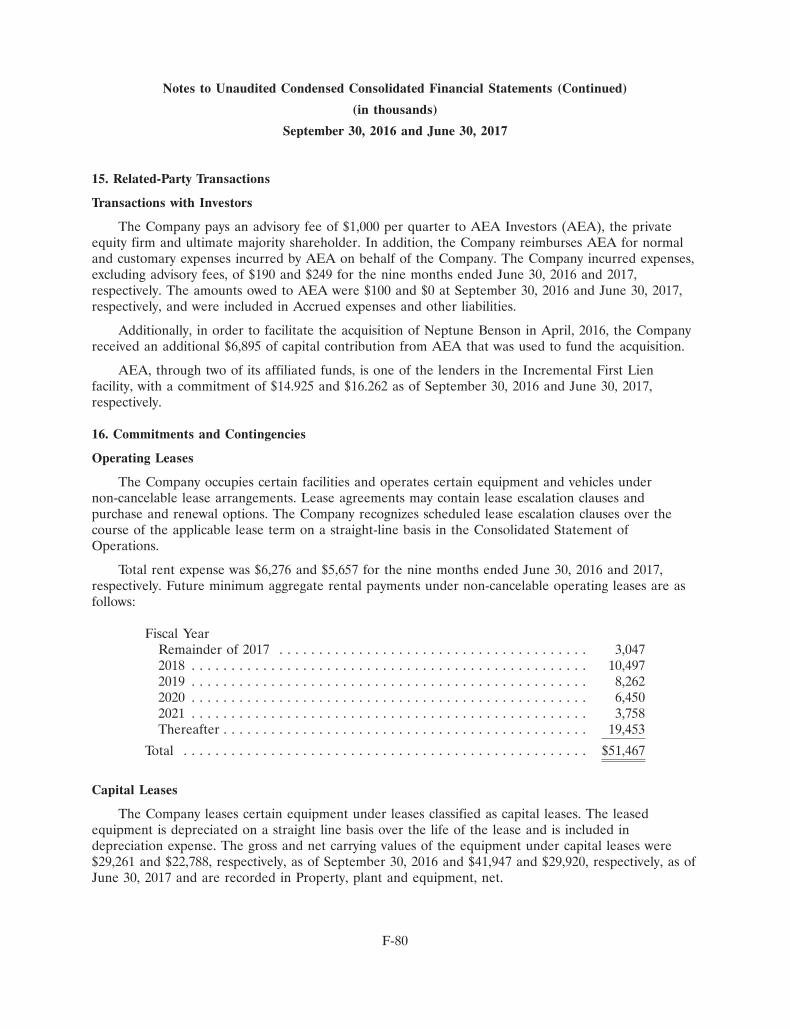
Notes to Unaudited Condensed Consolidated Financial Statements (Continued)
(in thousands)
September 30, 2016 and June 30, 2017
15. Related-Party Transactions
Transactions with Investors
The Company pays an advisory fee of $1,000 per quarter to AEA Investors (AEA), the privateequity firm and ultimate majority shareholder. In addition, the Company reimburses AEA for normaland customary expenses incurred by AEA on behalf of the Company. The Company incurred expenses,excluding advisory fees, of $190 and $249 for the nine months ended June 30, 2016 and 2017,respectively. The amounts owed to AEA were $100 and $0 at September 30, 2016 and June 30, 2017,respectively, and were included in Accrued expenses and other liabilities.
Additionally, in order to facilitate the acquisition of Neptune Benson in April, 2016, the Companyreceived an additional $6,895 of capital contribution from AEA that was used to fund the acquisition.
AEA, through two of its affiliated funds, is one of the lenders in the Incremental First Lienfacility, with a commitment of $14.925 and $16.262 as of September 30, 2016 and June 30, 2017,respectively.
16. Commitments and Contingencies
Operating Leases
The Company occupies certain facilities and operates certain equipment and vehicles undernon-cancelable lease arrangements. Lease agreements may contain lease escalation clauses andpurchase and renewal options. The Company recognizes scheduled lease escalation clauses over thecourse of the applicable lease term on a straight-line basis in the Consolidated Statement ofOperations.
Total rent expense was $6,276 and $5,657 for the nine months ended June 30, 2016 and 2017,respectively. Future minimum aggregate rental payments under non-cancelable operating leases are asfollows:
Fiscal YearRemainder of 2017 . . . . . . . . . . . . . . . . . . . . . . . . . . . . . . . . . . . . . . . 3,0472018 . . . . . . . . . . . . . . . . . . . . . . . . . . . . . . . . . . . . . . . . . . . . . . . . . . 10,4972019 . . . . . . . . . . . . . . . . . . . . . . . . . . . . . . . . . . . . . . . . . . . . . . . . . . 8,2622020 . . . . . . . . . . . . . . . . . . . . . . . . . . . . . . . . . . . . . . . . . . . . . . . . . . 6,4502021 . . . . . . . . . . . . . . . . . . . . . . . . . . . . . . . . . . . . . . . . . . . . . . . . . . 3,758Thereafter . . . . . . . . . . . . . . . . . . . . . . . . . . . . . . . . . . . . . . . . . . . . . . 19,453
Total . . . . . . . . . . . . . . . . . . . . . . . . . . . . . . . . . . . . . . . . . . . . . . . . . . . $51,467
Capital Leases
The Company leases certain equipment under leases classified as capital leases. The leasedequipment is depreciated on a straight line basis over the life of the lease and is included indepreciation expense. The gross and net carrying values of the equipment under capital leases were$29,261 and $22,788, respectively, as of September 30, 2016 and $41,947 and $29,920, respectively, as ofJune 30, 2017 and are recorded in Property, plant and equipment, net.
F-80

Notes to Unaudited Condensed Consolidated Financial Statements (Continued)
(in thousands)
September 30, 2016 and June 30, 2017
16. Commitments and Contingencies (Continued)
The following is a schedule showing the future minimum lease payments under capital leases byyears and the present value of the minimum lease payments as of June 30, 2017.
Fiscal YearRemainder of 2017 . . . . . . . . . . . . . . . . . . . . . . . . . . . . . . . . . . . . . . $ 2,4262018 . . . . . . . . . . . . . . . . . . . . . . . . . . . . . . . . . . . . . . . . . . . . . . . . 9,3942019 . . . . . . . . . . . . . . . . . . . . . . . . . . . . . . . . . . . . . . . . . . . . . . . . 8,3882020 . . . . . . . . . . . . . . . . . . . . . . . . . . . . . . . . . . . . . . . . . . . . . . . . 6,4252021 . . . . . . . . . . . . . . . . . . . . . . . . . . . . . . . . . . . . . . . . . . . . . . . . 3,608Thereafter . . . . . . . . . . . . . . . . . . . . . . . . . . . . . . . . . . . . . . . . . . . . 3,098
$33,339Less amount representing interest (at rates ranging from 2.15% to 3.65%) . 2,968
Present value of net minimum capital lease payments . . . . . . . . . . . . . . . 30,371Less current installments of obligations under capital leases . . . . . . . . . . 9,400
Obligations under capital leases, excluding current installments . . . . . . . . $20,971
The current installments of obligations under capital leases are included in Accrued expenses andother liabilities. Obligations under capital leases, excluding current installments, are included in Othernon-current liabilities.
The Company is a lessor to multiple parties. The Company purchases equipment through internalfunding or bank debt equal to the fair market value of the equipment. The equipment is then leased tocustomers for periods ranging from five to twenty years. The Company also leases equipment to onecustomer under a direct financing lease. The primary difference between this lease and the otheroperating leases is that this transaction resulted from a sale-leaseback transaction and does not havethe same level of performance guarantees that the other agreements have. As of June 30, 2017, future
F-81
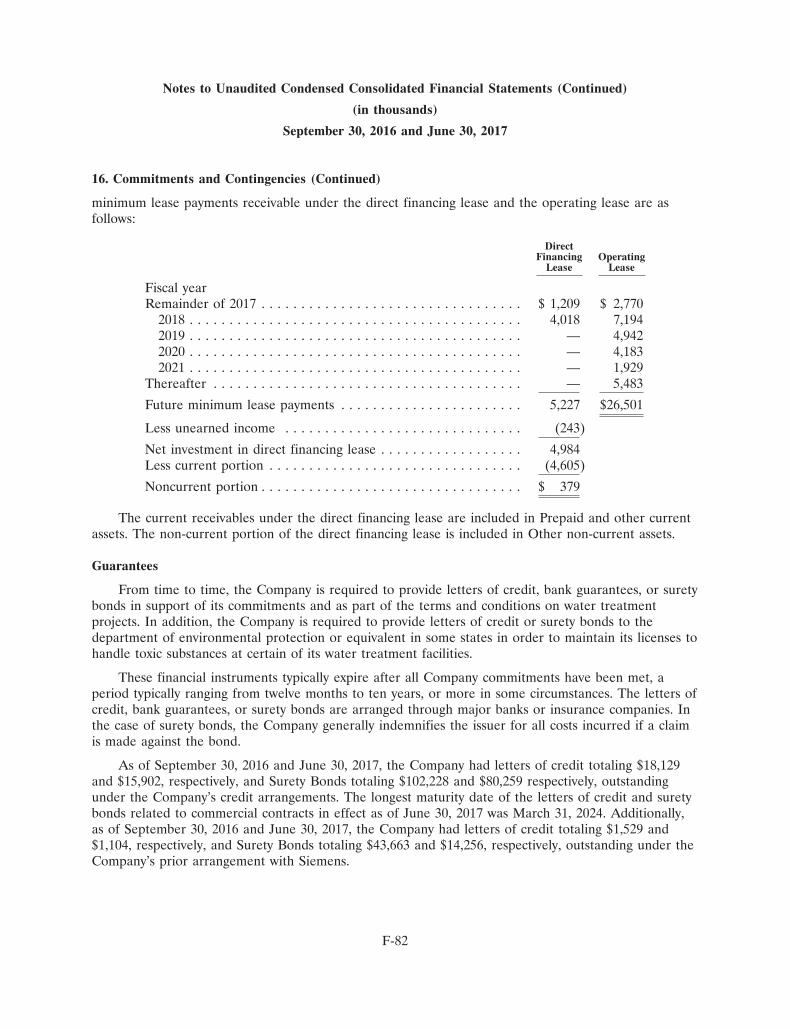
Notes to Unaudited Condensed Consolidated Financial Statements (Continued)
(in thousands)
September 30, 2016 and June 30, 2017
16. Commitments and Contingencies (Continued)
minimum lease payments receivable under the direct financing lease and the operating lease are asfollows:
DirectFinancing Operating
Lease Lease
Fiscal yearRemainder of 2017 . . . . . . . . . . . . . . . . . . . . . . . . . . . . . . . . . $ 1,209 $ 2,770
2018 . . . . . . . . . . . . . . . . . . . . . . . . . . . . . . . . . . . . . . . . . . 4,018 7,1942019 . . . . . . . . . . . . . . . . . . . . . . . . . . . . . . . . . . . . . . . . . . — 4,9422020 . . . . . . . . . . . . . . . . . . . . . . . . . . . . . . . . . . . . . . . . . . — 4,1832021 . . . . . . . . . . . . . . . . . . . . . . . . . . . . . . . . . . . . . . . . . . — 1,929
Thereafter . . . . . . . . . . . . . . . . . . . . . . . . . . . . . . . . . . . . . . . — 5,483
Future minimum lease payments . . . . . . . . . . . . . . . . . . . . . . . 5,227 $26,501
Less unearned income . . . . . . . . . . . . . . . . . . . . . . . . . . . . . . (243)
Net investment in direct financing lease . . . . . . . . . . . . . . . . . . 4,984Less current portion . . . . . . . . . . . . . . . . . . . . . . . . . . . . . . . . (4,605)
Noncurrent portion . . . . . . . . . . . . . . . . . . . . . . . . . . . . . . . . . $ 379
The current receivables under the direct financing lease are included in Prepaid and other currentassets. The non-current portion of the direct financing lease is included in Other non-current assets.
Guarantees
From time to time, the Company is required to provide letters of credit, bank guarantees, or suretybonds in support of its commitments and as part of the terms and conditions on water treatmentprojects. In addition, the Company is required to provide letters of credit or surety bonds to thedepartment of environmental protection or equivalent in some states in order to maintain its licenses tohandle toxic substances at certain of its water treatment facilities.
These financial instruments typically expire after all Company commitments have been met, aperiod typically ranging from twelve months to ten years, or more in some circumstances. The letters ofcredit, bank guarantees, or surety bonds are arranged through major banks or insurance companies. Inthe case of surety bonds, the Company generally indemnifies the issuer for all costs incurred if a claimis made against the bond.
As of September 30, 2016 and June 30, 2017, the Company had letters of credit totaling $18,129and $15,902, respectively, and Surety Bonds totaling $102,228 and $80,259 respectively, outstandingunder the Company’s credit arrangements. The longest maturity date of the letters of credit and suretybonds related to commercial contracts in effect as of June 30, 2017 was March 31, 2024. Additionally,as of September 30, 2016 and June 30, 2017, the Company had letters of credit totaling $1,529 and$1,104, respectively, and Surety Bonds totaling $43,663 and $14,256, respectively, outstanding under theCompany’s prior arrangement with Siemens.
F-82

Notes to Unaudited Condensed Consolidated Financial Statements (Continued)
(in thousands)
September 30, 2016 and June 30, 2017
16. Commitments and Contingencies (Continued)
Litigation
From time to time, as a normal incident of the nature and kind of business in which the Companyis engaged, various claims or charges are asserted and litigation commenced against it arising from orrelated to: product liability; personal injury; trademarks, trade secrets or other intellectual property;labor and employee disputes; commercial or contractual disputes; breach of warranty; or environmentalmatters. Claimed amounts may be substantial but may not bear any reasonable relationship to themerits of the claim or the extent of any real risk of court or arbitral awards. While it is not feasible topredict the outcome of these matters with certainty, and some lawsuits, claims or proceedings may bedisposed or decided unfavorably, the Company does not expect that any asserted or unasserted legalclaims or proceedings, individually or in the aggregate, will have a material adverse effect on the resultsof operations, or financial condition.
17. Accrued Expenses and Other Liabilities
Accrued expenses and other liabilities consisted of the following:
September 30, 2016 June 30, 2017
Salaries, wages and other benefits . . . . . . . . . . . . . . $ 44,776 $ 40,549Taxes . . . . . . . . . . . . . . . . . . . . . . . . . . . . . . . . . . . 10,643 10,505Obligation under capital leases . . . . . . . . . . . . . . . . . 6,231 9,400Insurance liabilities . . . . . . . . . . . . . . . . . . . . . . . . . 5,484 7,032Provisions for litigation . . . . . . . . . . . . . . . . . . . . . . 3,894 4,930Pension payable . . . . . . . . . . . . . . . . . . . . . . . . . . . 1,255 1,233Severance payments . . . . . . . . . . . . . . . . . . . . . . . . 13,217 6,158Third party commissions . . . . . . . . . . . . . . . . . . . . . 9,155 7,686Other . . . . . . . . . . . . . . . . . . . . . . . . . . . . . . . . . . . 16,652 28,840
$111,307 $116,333
18. Segment Reporting
The Company has three reportable segments—Industrial, Municipal and Products. The key factorsused to identify these reportable segments are the organization and alignment of the Company’sinternal operations, the nature of the products and services, and customer type. The business segmentsare described as follows:
Industrial combines equipment and services to improve operational reliability and environmentalcompliance for heavy and light industry, commercial and institutional markets. Their customers includehydrocarbon refineries, chemical processing, power, food and beverage, life sciences, health services andmicroelectronics.
Municipal helps engineers and municipalities meet new demands for plant performance throughleading equipment, solutions and services backed by trusted brands and over 100 plus years ofapplications experience. Their customers include waste water and drinking water collection anddistribution systems, utility operators and odor control services.
F-83
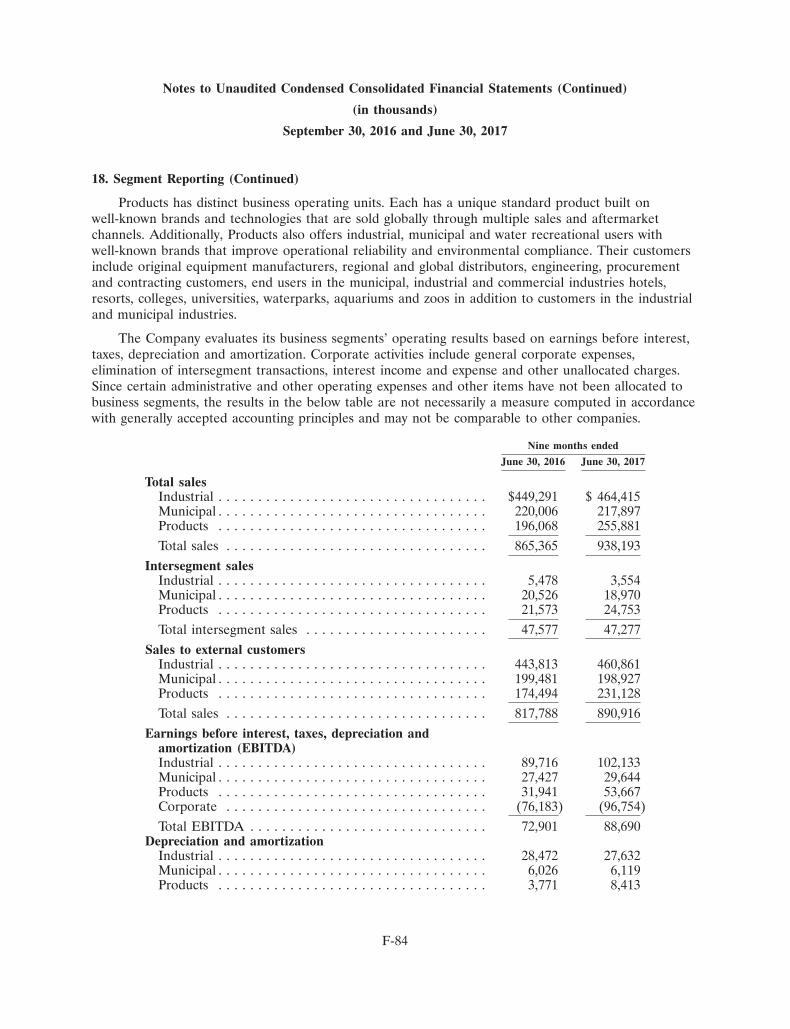
Notes to Unaudited Condensed Consolidated Financial Statements (Continued)
(in thousands)
September 30, 2016 and June 30, 2017
18. Segment Reporting (Continued)
Products has distinct business operating units. Each has a unique standard product built onwell-known brands and technologies that are sold globally through multiple sales and aftermarketchannels. Additionally, Products also offers industrial, municipal and water recreational users withwell-known brands that improve operational reliability and environmental compliance. Their customersinclude original equipment manufacturers, regional and global distributors, engineering, procurementand contracting customers, end users in the municipal, industrial and commercial industries hotels,resorts, colleges, universities, waterparks, aquariums and zoos in addition to customers in the industrialand municipal industries.
The Company evaluates its business segments’ operating results based on earnings before interest,taxes, depreciation and amortization. Corporate activities include general corporate expenses,elimination of intersegment transactions, interest income and expense and other unallocated charges.Since certain administrative and other operating expenses and other items have not been allocated tobusiness segments, the results in the below table are not necessarily a measure computed in accordancewith generally accepted accounting principles and may not be comparable to other companies.
Nine months ended
June 30, 2016 June 30, 2017
Total salesIndustrial . . . . . . . . . . . . . . . . . . . . . . . . . . . . . . . . . . $449,291 $ 464,415Municipal . . . . . . . . . . . . . . . . . . . . . . . . . . . . . . . . . . 220,006 217,897Products . . . . . . . . . . . . . . . . . . . . . . . . . . . . . . . . . . 196,068 255,881Total sales . . . . . . . . . . . . . . . . . . . . . . . . . . . . . . . . . 865,365 938,193
Intersegment salesIndustrial . . . . . . . . . . . . . . . . . . . . . . . . . . . . . . . . . . 5,478 3,554Municipal . . . . . . . . . . . . . . . . . . . . . . . . . . . . . . . . . . 20,526 18,970Products . . . . . . . . . . . . . . . . . . . . . . . . . . . . . . . . . . 21,573 24,753Total intersegment sales . . . . . . . . . . . . . . . . . . . . . . . 47,577 47,277
Sales to external customersIndustrial . . . . . . . . . . . . . . . . . . . . . . . . . . . . . . . . . . 443,813 460,861Municipal . . . . . . . . . . . . . . . . . . . . . . . . . . . . . . . . . . 199,481 198,927Products . . . . . . . . . . . . . . . . . . . . . . . . . . . . . . . . . . 174,494 231,128Total sales . . . . . . . . . . . . . . . . . . . . . . . . . . . . . . . . . 817,788 890,916
Earnings before interest, taxes, depreciation andamortization (EBITDA)Industrial . . . . . . . . . . . . . . . . . . . . . . . . . . . . . . . . . . 89,716 102,133Municipal . . . . . . . . . . . . . . . . . . . . . . . . . . . . . . . . . . 27,427 29,644Products . . . . . . . . . . . . . . . . . . . . . . . . . . . . . . . . . . 31,941 53,667Corporate . . . . . . . . . . . . . . . . . . . . . . . . . . . . . . . . . (76,183) (96,754)Total EBITDA . . . . . . . . . . . . . . . . . . . . . . . . . . . . . . 72,901 88,690
Depreciation and amortizationIndustrial . . . . . . . . . . . . . . . . . . . . . . . . . . . . . . . . . . 28,472 27,632Municipal . . . . . . . . . . . . . . . . . . . . . . . . . . . . . . . . . . 6,026 6,119Products . . . . . . . . . . . . . . . . . . . . . . . . . . . . . . . . . . 3,771 8,413
F-84

Notes to Unaudited Condensed Consolidated Financial Statements (Continued)
(in thousands)
September 30, 2016 and June 30, 2017
18. Segment Reporting (Continued)
Nine months ended
June 30, 2016 June 30, 2017
Corporate . . . . . . . . . . . . . . . . . . . . . . . . . . . . . . . . . 12,717 13,649Total depreciation and amortization . . . . . . . . . . . . . . . 50,986 55,813
Income from operationsIndustrial . . . . . . . . . . . . . . . . . . . . . . . . . . . . . . . . . . 61,244 74,501Municipal . . . . . . . . . . . . . . . . . . . . . . . . . . . . . . . . . . 21,401 23,525Products . . . . . . . . . . . . . . . . . . . . . . . . . . . . . . . . . . 28,170 45,254Corporate . . . . . . . . . . . . . . . . . . . . . . . . . . . . . . . . . (88,900) (110,418)Total income from operations . . . . . . . . . . . . . . . . . . . 21,915 32,862
Interest expense . . . . . . . . . . . . . . . . . . . . . . . . . . . . . . . (29,467) (39,117)Loss before income taxes . . . . . . . . . . . . . . . . . . . . . . . . (7,552) (6,255)Income tax benefit (expense) . . . . . . . . . . . . . . . . . . . . . 20,419 (295)Net income (loss) . . . . . . . . . . . . . . . . . . . . . . . . . . . . . . $ 12,867 $ (6,550)
Capital expendituresIndustrial . . . . . . . . . . . . . . . . . . . . . . . . . . . . . . . . . . $ 26,151 $ 31,019Municipal . . . . . . . . . . . . . . . . . . . . . . . . . . . . . . . . . . 4,011 4,239Products . . . . . . . . . . . . . . . . . . . . . . . . . . . . . . . . . . 2,445 1,577Corporate . . . . . . . . . . . . . . . . . . . . . . . . . . . . . . . . . 2,110 3,640
Total capital expenditures . . . . . . . . . . . . . . . . . . . . . . . $ 34,717 $ 40,475
September 30, June 30,2016 2017
AssetsIndustrial . . . . . . . . . . . . . . . . . . . . . . . . . . . . . . . . . . $ 370,970 $ 442,809Municipal . . . . . . . . . . . . . . . . . . . . . . . . . . . . . . . . . . 123,041 138,498Products . . . . . . . . . . . . . . . . . . . . . . . . . . . . . . . . . . . 477,804 496,132Corporate . . . . . . . . . . . . . . . . . . . . . . . . . . . . . . . . . . 324,416 343,264
Total assets . . . . . . . . . . . . . . . . . . . . . . . . . . . . . . . . . . $1,296,231 $1,420,703
September 30, June 30,2016 2017
GoodwillIndustrial . . . . . . . . . . . . . . . . . . . . . . . . . . . . . . . . . . . $ 80,157 $127,599Municipal . . . . . . . . . . . . . . . . . . . . . . . . . . . . . . . . . . . 9,691 10,049Products . . . . . . . . . . . . . . . . . . . . . . . . . . . . . . . . . . . . 177,795 179,745
Total goodwill . . . . . . . . . . . . . . . . . . . . . . . . . . . . . . . . . . $267,643 $317,393
F-85

Notes to Unaudited Condensed Consolidated Financial Statements (Continued)
(in thousands)
September 30, 2016 and June 30, 2017
19. Earnings per share
The following table sets forth the computation of basic and diluted loss from continuing operationsper common share (in thousands, except per share amounts):
Nine months ended
June 30, 2016 June 30, 2017
Numerator:Loss from continuing operations per common share -Net income (loss) from continuing operations attributable to EWT . . . . . . . $ 11,812 $ (8,898)Denominator:Weighted average shares . . . . . . . . . . . . . . . . . . . . . . . . . . . . . . . . . . . . . . 103,657 104,821Effect of dilutive securities:Share-based compensation . . . . . . . . . . . . . . . . . . . . . . . . . . . . . . . . . . . . 836 —
Denominator for diluted net income (loss) per common share—adjustedweighted average shares . . . . . . . . . . . . . . . . . . . . . . . . . . . . . . . . . . . . . 104,493 104,821
Basic income (loss) from continuing operations attributable to EWTHoldings I Corp per common share . . . . . . . . . . . . . . . . . . . . . . . . . . . . $ 0.11 $ (0.08)
Diluted income (loss) from continuing operations attributable to EWTHoldings I Corp per common share . . . . . . . . . . . . . . . . . . . . . . . . . . . . $ 0.11 $ (0.08)
Since the Company was in a net loss position for the nine months ended June 30, 2017, there wasno difference between the number of shares used to calculate basic and diluted loss per share. Becauseof their anti-dilutive effect, 9,489 common share equivalents comprised of employee stock options havebeen excluded from the diluted EPS calculation for the nine months ended June 30, 2017.
20. Subsequent Events
The Company performed an evaluation of subsequent events through October 16, 2017, the datethe consolidated financial statements were available to be issued.
On August 8, 2017 the company amended the First Lien Term Facility to 1) increase the term loanbalance by $80,000 2) reprice the Incremental First Lien Term Facility and 3) combine all tranches intoa single tranche. The First Lien Term Facility now carries a rate of LIBOR + 375 basis points.Proceeds from the additional borrowing were used to reduce the revolving credit facility balance and toincrease cash on hand for general corporate operating purposes.
On October 16, 2017, the Company’s Board of Directors effected a 26.9576-for-one stock split ofits common stock and increased its authorized shares to 1,000,000. All share and per share informationhas been retroactively adjusted to reflect the stock split. The incremental par value of the newly issuedshares was recorded with the offset to additional paid-in capital.
On October 16, 2017, the Company’s Board of Directors changed the name of the Company fromEWT Holdings I Corp. to Evoqua Water Technologies Corp.
F-86

Independent Auditor’s Report
To the Board of Directors and Shareholders ofNB Intermediate Holdings, LLC
Report on the Financial Statements
We have audited the accompanying consolidated financial statements of NB IntermediateHoldings, LLC and Subsidiaries (the Company) which comprise the consolidated balance sheet as ofDecember 31, 2015, and the related consolidated statements of income, changes in member’s equityand cash flows for the year then ended and the related notes to the consolidated financial statements(collectively, the financial statements).
Management’s Responsibility for the Financial Statements
Management is responsible for the preparation and fair presentation of these financial statementsin accordance with accounting principles generally accepted in the United States of America; thisincludes the design, implementation, and maintenance of internal control relevant to the preparationand fair presentation of financial statements that are free from material misstatement, whether due tofraud or error.
Auditor’s Responsibility
Our responsibility is to express an opinion on these financial statements based on our audit. Weconducted our audit in accordance with auditing standards generally accepted in the United States ofAmerica. Those standards require that we plan and perform the audit to obtain reasonable assuranceabout whether the financial statements are free from material misstatement.
An audit involves performing procedures to obtain audit evidence about the amounts anddisclosures in the financial statements. The procedures selected depend on the auditor’s judgment,including the assessment of the risks of material misstatement of the financial statements, whether dueto fraud or error. In making those risk assessments, the auditor considers internal control relevant tothe entity’s preparation and fair presentation of the financial statements in order to design auditprocedures that are appropriate in the circumstances, but not for the purpose of expressing an opinionon the effectiveness of the entity’s internal control. Accordingly, we express no such opinion. An auditalso includes evaluating the appropriateness of accounting policies used and the reasonableness ofsignificant accounting estimates made by management, as well as evaluating the overall presentation ofthe financial statements.
We believe that the audit evidence we have obtained is sufficient and appropriate to provide abasis for our audit opinion.
Opinion
In our opinion, the financial statements referred to above present fairly, in all material respects,the financial position of NB Intermediate Holdings, LLC and Subsidiaries as of December 31, 2015,and the results of their operations and their cash flows for the year then ended in accordance withaccounting principles generally accepted in the United States of America.
/s/ RSM US LLPBoston, MassachusettsApril 8, 2016, except for Note 13, as to which the date is April 15, 2016
F-87

NB Intermediate Holdings, LLC and Subsidiaries
Consolidated Balance Sheet as of December 31, 2015
December 31, 2015
ASSETSCash and cash equivalents . . . . . . . . . . . . . . . . . . . . . . . . . . . . . . . . . . . . . . . . . . . . $ 1,235,155Restricted cash . . . . . . . . . . . . . . . . . . . . . . . . . . . . . . . . . . . . . . . . . . . . . . . . . . . . 259,824Accounts receivable, net of allowance for doubtful accounts of $63,541 . . . . . . . . . . . 18,397,030Inventories, net . . . . . . . . . . . . . . . . . . . . . . . . . . . . . . . . . . . . . . . . . . . . . . . . . . . 10,582,896Prepaid expenses and other current assets . . . . . . . . . . . . . . . . . . . . . . . . . . . . . . . . 1,310,954
Total current assets . . . . . . . . . . . . . . . . . . . . . . . . . . . . . . . . . . . . . . . . . . . . . 31,785,859
Property and equipment, net . . . . . . . . . . . . . . . . . . . . . . . . . . . . . . . . . . . . . . . . . . 1,343,511Deferred Costs . . . . . . . . . . . . . . . . . . . . . . . . . . . . . . . . . . . . . . . . . . . . . . . . . . . . 695,625Intangible assets, net . . . . . . . . . . . . . . . . . . . . . . . . . . . . . . . . . . . . . . . . . . . . . . . . 36,658,324Goodwill . . . . . . . . . . . . . . . . . . . . . . . . . . . . . . . . . . . . . . . . . . . . . . . . . . . . . . . . 30,538,623
Total other assets . . . . . . . . . . . . . . . . . . . . . . . . . . . . . . . . . . . . . . . . . . . . . . . 69,236,083
Total assets . . . . . . . . . . . . . . . . . . . . . . . . . . . . . . . . . . . . . . . . . . . . . . . . . . . $101,021,942
LIABILITIES AND MEMBER’S EQUITYCurrent liabilities:
Revolving loan . . . . . . . . . . . . . . . . . . . . . . . . . . . . . . . . . . . . . . . . . . . . . . . . . . $ 900,000Current portion of long term debt . . . . . . . . . . . . . . . . . . . . . . . . . . . . . . . . . . . . 2,004,073Accounts payable and accrued expenses . . . . . . . . . . . . . . . . . . . . . . . . . . . . . . . . 8,785,507Distributions payable . . . . . . . . . . . . . . . . . . . . . . . . . . . . . . . . . . . . . . . . . . . . . . 2,673,078Customer deposits . . . . . . . . . . . . . . . . . . . . . . . . . . . . . . . . . . . . . . . . . . . . . . . . 773,357Contingent consideration payable . . . . . . . . . . . . . . . . . . . . . . . . . . . . . . . . . . . . . 582,839Due to related party . . . . . . . . . . . . . . . . . . . . . . . . . . . . . . . . . . . . . . . . . . . . . . 5,892
Total current liabilities . . . . . . . . . . . . . . . . . . . . . . . . . . . . . . . . . . . . . . . . . . . 15,724,746Long-term debt, net of current portion . . . . . . . . . . . . . . . . . . . . . . . . . . . . . . . . . . 61,173,258
Total liabilities . . . . . . . . . . . . . . . . . . . . . . . . . . . . . . . . . . . . . . . . . . . . . . . . . 76,898,004
Commitments and contingencies (Note 10) . . . . . . . . . . . . . . . . . . . . . . . . . . . . . . . . —
Member’s equity:Contributed equity . . . . . . . . . . . . . . . . . . . . . . . . . . . . . . . . . . . . . . . . . . . . . . . 44,416,090Additional paid in capital . . . . . . . . . . . . . . . . . . . . . . . . . . . . . . . . . . . . . . . . . . . 448,083Accumulated deficit . . . . . . . . . . . . . . . . . . . . . . . . . . . . . . . . . . . . . . . . . . . . . . . (20,740,235)
Total member’s equity . . . . . . . . . . . . . . . . . . . . . . . . . . . . . . . . . . . . . . . . . . . 24,123,938
Total liabilities and member’s equity . . . . . . . . . . . . . . . . . . . . . . . . . . . . . . . . . $101,021,942
See notes to consolidated financial statements.
F-88
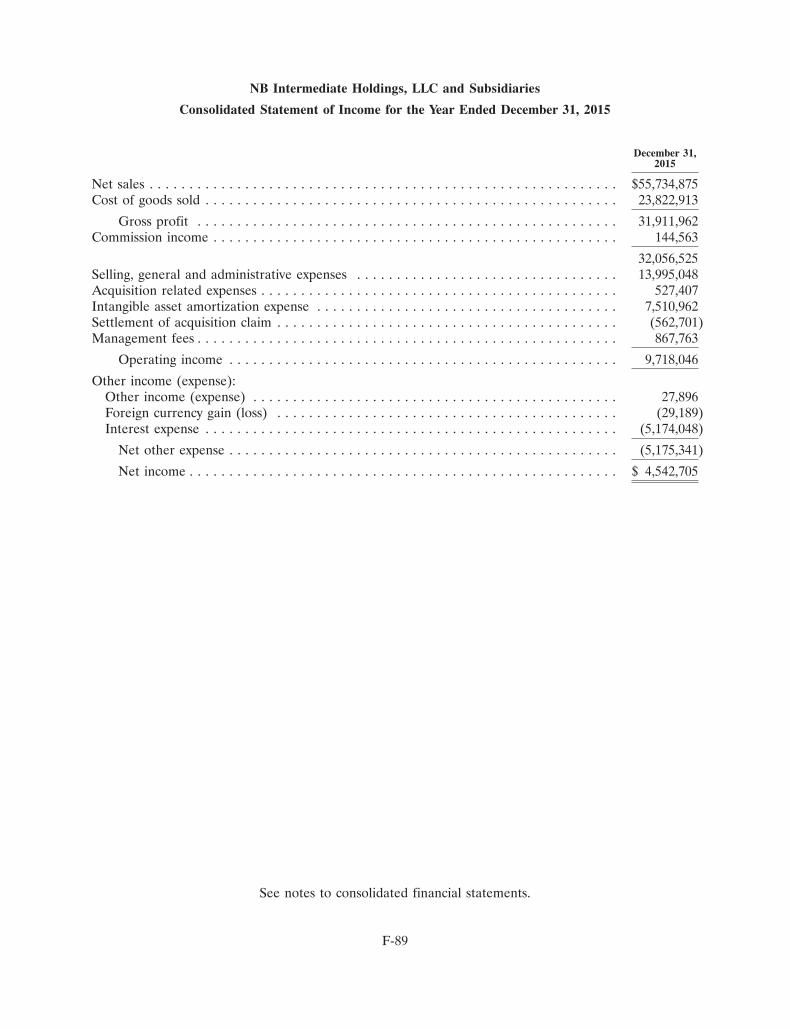
NB Intermediate Holdings, LLC and Subsidiaries
Consolidated Statement of Income for the Year Ended December 31, 2015
December 31,2015
Net sales . . . . . . . . . . . . . . . . . . . . . . . . . . . . . . . . . . . . . . . . . . . . . . . . . . . . . . . . . . . $55,734,875Cost of goods sold . . . . . . . . . . . . . . . . . . . . . . . . . . . . . . . . . . . . . . . . . . . . . . . . . . . . 23,822,913
Gross profit . . . . . . . . . . . . . . . . . . . . . . . . . . . . . . . . . . . . . . . . . . . . . . . . . . . . . 31,911,962Commission income . . . . . . . . . . . . . . . . . . . . . . . . . . . . . . . . . . . . . . . . . . . . . . . . . . . 144,563
32,056,525Selling, general and administrative expenses . . . . . . . . . . . . . . . . . . . . . . . . . . . . . . . . . 13,995,048Acquisition related expenses . . . . . . . . . . . . . . . . . . . . . . . . . . . . . . . . . . . . . . . . . . . . . 527,407Intangible asset amortization expense . . . . . . . . . . . . . . . . . . . . . . . . . . . . . . . . . . . . . . 7,510,962Settlement of acquisition claim . . . . . . . . . . . . . . . . . . . . . . . . . . . . . . . . . . . . . . . . . . . (562,701)Management fees . . . . . . . . . . . . . . . . . . . . . . . . . . . . . . . . . . . . . . . . . . . . . . . . . . . . . 867,763
Operating income . . . . . . . . . . . . . . . . . . . . . . . . . . . . . . . . . . . . . . . . . . . . . . . . . 9,718,046
Other income (expense):Other income (expense) . . . . . . . . . . . . . . . . . . . . . . . . . . . . . . . . . . . . . . . . . . . . . . 27,896Foreign currency gain (loss) . . . . . . . . . . . . . . . . . . . . . . . . . . . . . . . . . . . . . . . . . . . (29,189)Interest expense . . . . . . . . . . . . . . . . . . . . . . . . . . . . . . . . . . . . . . . . . . . . . . . . . . . . (5,174,048)
Net other expense . . . . . . . . . . . . . . . . . . . . . . . . . . . . . . . . . . . . . . . . . . . . . . . . . (5,175,341)
Net income . . . . . . . . . . . . . . . . . . . . . . . . . . . . . . . . . . . . . . . . . . . . . . . . . . . . . . $ 4,542,705
See notes to consolidated financial statements.
F-89

NB Intermediate Holdings, LLC and Subsidiaries
Consolidated Statement of Member’s Equity for the Year Ended December 31, 2015
Additional TotalContributed Paid in Accumulated Member’s
Equity Capital Deficit Equity
Balance at January 1, 2015 . . . . . . . . . . . . . . . . $45,166,090 $ 569,811 $(23,247,537) $22,488,364Net income . . . . . . . . . . . . . . . . . . . . . . . . . — — 4,542,705 4,542,705Distributions declared . . . . . . . . . . . . . . . . . . — — (2,035,403) (2,035,403)Redemption of member units . . . . . . . . . . . . (750,000) (391,832) — (1,141,832)Equity based compensation . . . . . . . . . . . . . . — 270,104 — 270,104
Balance at December 31, 2015 . . . . . . . . . . . . . $44,416,090 $ 448,083 $(20,740,235) $24,123,938
See notes to consolidated financial statements.
F-90
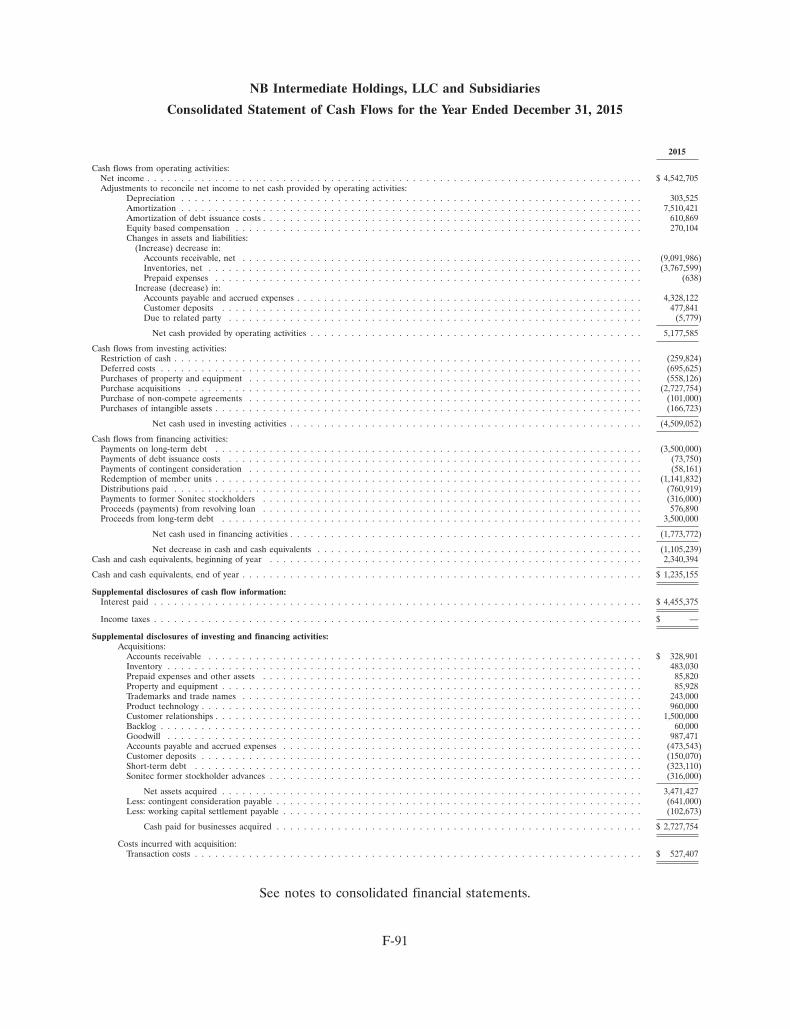
NB Intermediate Holdings, LLC and Subsidiaries
Consolidated Statement of Cash Flows for the Year Ended December 31, 2015
2015
Cash flows from operating activities:Net income . . . . . . . . . . . . . . . . . . . . . . . . . . . . . . . . . . . . . . . . . . . . . . . . . . . . . . . . . . . . . . . . . . . . . . . . . $ 4,542,705Adjustments to reconcile net income to net cash provided by operating activities:
Depreciation . . . . . . . . . . . . . . . . . . . . . . . . . . . . . . . . . . . . . . . . . . . . . . . . . . . . . . . . . . . . . . . . . . . . 303,525Amortization . . . . . . . . . . . . . . . . . . . . . . . . . . . . . . . . . . . . . . . . . . . . . . . . . . . . . . . . . . . . . . . . . . . . 7,510,421Amortization of debt issuance costs . . . . . . . . . . . . . . . . . . . . . . . . . . . . . . . . . . . . . . . . . . . . . . . . . . . . . . . . 610,869Equity based compensation . . . . . . . . . . . . . . . . . . . . . . . . . . . . . . . . . . . . . . . . . . . . . . . . . . . . . . . . . . . . 270,104Changes in assets and liabilities:
(Increase) decrease in:Accounts receivable, net . . . . . . . . . . . . . . . . . . . . . . . . . . . . . . . . . . . . . . . . . . . . . . . . . . . . . . . . . . . (9,091,986)Inventories, net . . . . . . . . . . . . . . . . . . . . . . . . . . . . . . . . . . . . . . . . . . . . . . . . . . . . . . . . . . . . . . . . (3,767,599)Prepaid expenses . . . . . . . . . . . . . . . . . . . . . . . . . . . . . . . . . . . . . . . . . . . . . . . . . . . . . . . . . . . . . . . (638)
Increase (decrease) in:Accounts payable and accrued expenses . . . . . . . . . . . . . . . . . . . . . . . . . . . . . . . . . . . . . . . . . . . . . . . . . . . 4,328,122Customer deposits . . . . . . . . . . . . . . . . . . . . . . . . . . . . . . . . . . . . . . . . . . . . . . . . . . . . . . . . . . . . . . 477,841Due to related party . . . . . . . . . . . . . . . . . . . . . . . . . . . . . . . . . . . . . . . . . . . . . . . . . . . . . . . . . . . . . (5,779)
Net cash provided by operating activities . . . . . . . . . . . . . . . . . . . . . . . . . . . . . . . . . . . . . . . . . . . . . . . . . 5,177,585
Cash flows from investing activities:Restriction of cash . . . . . . . . . . . . . . . . . . . . . . . . . . . . . . . . . . . . . . . . . . . . . . . . . . . . . . . . . . . . . . . . . . . . . (259,824)Deferred costs . . . . . . . . . . . . . . . . . . . . . . . . . . . . . . . . . . . . . . . . . . . . . . . . . . . . . . . . . . . . . . . . . . . . . . . (695,625)Purchases of property and equipment . . . . . . . . . . . . . . . . . . . . . . . . . . . . . . . . . . . . . . . . . . . . . . . . . . . . . . . . . . (558,126)Purchase acquisitions . . . . . . . . . . . . . . . . . . . . . . . . . . . . . . . . . . . . . . . . . . . . . . . . . . . . . . . . . . . . . . . . . . . (2,727,754)Purchase of non-compete agreements . . . . . . . . . . . . . . . . . . . . . . . . . . . . . . . . . . . . . . . . . . . . . . . . . . . . . . . . . . (101,000)Purchases of intangible assets . . . . . . . . . . . . . . . . . . . . . . . . . . . . . . . . . . . . . . . . . . . . . . . . . . . . . . . . . . . . . . . (166,723)
Net cash used in investing activities . . . . . . . . . . . . . . . . . . . . . . . . . . . . . . . . . . . . . . . . . . . . . . . . . . . . (4,509,052)
Cash flows from financing activities:Payments on long-term debt . . . . . . . . . . . . . . . . . . . . . . . . . . . . . . . . . . . . . . . . . . . . . . . . . . . . . . . . . . . . . . . (3,500,000)Payments of debt issuance costs . . . . . . . . . . . . . . . . . . . . . . . . . . . . . . . . . . . . . . . . . . . . . . . . . . . . . . . . . . . . . (73,750)Payments of contingent consideration . . . . . . . . . . . . . . . . . . . . . . . . . . . . . . . . . . . . . . . . . . . . . . . . . . . . . . . . . . (58,161)Redemption of member units . . . . . . . . . . . . . . . . . . . . . . . . . . . . . . . . . . . . . . . . . . . . . . . . . . . . . . . . . . . . . . . (1,141,832)Distributions paid . . . . . . . . . . . . . . . . . . . . . . . . . . . . . . . . . . . . . . . . . . . . . . . . . . . . . . . . . . . . . . . . . . . . . (760,919)Payments to former Sonitec stockholders . . . . . . . . . . . . . . . . . . . . . . . . . . . . . . . . . . . . . . . . . . . . . . . . . . . . . . . . (316,000)Proceeds (payments) from revolving loan . . . . . . . . . . . . . . . . . . . . . . . . . . . . . . . . . . . . . . . . . . . . . . . . . . . . . . . . 576,890Proceeds from long-term debt . . . . . . . . . . . . . . . . . . . . . . . . . . . . . . . . . . . . . . . . . . . . . . . . . . . . . . . . . . . . . . 3,500,000
Net cash used in financing activities . . . . . . . . . . . . . . . . . . . . . . . . . . . . . . . . . . . . . . . . . . . . . . . . . . . . (1,773,772)
Net decrease in cash and cash equivalents . . . . . . . . . . . . . . . . . . . . . . . . . . . . . . . . . . . . . . . . . . . . . . . . (1,105,239)Cash and cash equivalents, beginning of year . . . . . . . . . . . . . . . . . . . . . . . . . . . . . . . . . . . . . . . . . . . . . . . . . . . . . . . 2,340,394
Cash and cash equivalents, end of year . . . . . . . . . . . . . . . . . . . . . . . . . . . . . . . . . . . . . . . . . . . . . . . . . . . . . . . . . . . $ 1,235,155
Supplemental disclosures of cash flow information:Interest paid . . . . . . . . . . . . . . . . . . . . . . . . . . . . . . . . . . . . . . . . . . . . . . . . . . . . . . . . . . . . . . . . . . . . . . . . $ 4,455,375
Income taxes . . . . . . . . . . . . . . . . . . . . . . . . . . . . . . . . . . . . . . . . . . . . . . . . . . . . . . . . . . . . . . . . . . . . . . . . $ —
Supplemental disclosures of investing and financing activities:Acquisitions:
Accounts receivable . . . . . . . . . . . . . . . . . . . . . . . . . . . . . . . . . . . . . . . . . . . . . . . . . . . . . . . . . . . . . . . . $ 328,901Inventory . . . . . . . . . . . . . . . . . . . . . . . . . . . . . . . . . . . . . . . . . . . . . . . . . . . . . . . . . . . . . . . . . . . . . . 483,030Prepaid expenses and other assets . . . . . . . . . . . . . . . . . . . . . . . . . . . . . . . . . . . . . . . . . . . . . . . . . . . . . . . . 85,820Property and equipment . . . . . . . . . . . . . . . . . . . . . . . . . . . . . . . . . . . . . . . . . . . . . . . . . . . . . . . . . . . . . . 85,928Trademarks and trade names . . . . . . . . . . . . . . . . . . . . . . . . . . . . . . . . . . . . . . . . . . . . . . . . . . . . . . . . . . . 243,000Product technology . . . . . . . . . . . . . . . . . . . . . . . . . . . . . . . . . . . . . . . . . . . . . . . . . . . . . . . . . . . . . . . . . 960,000Customer relationships . . . . . . . . . . . . . . . . . . . . . . . . . . . . . . . . . . . . . . . . . . . . . . . . . . . . . . . . . . . . . . . 1,500,000Backlog . . . . . . . . . . . . . . . . . . . . . . . . . . . . . . . . . . . . . . . . . . . . . . . . . . . . . . . . . . . . . . . . . . . . . . . 60,000Goodwill . . . . . . . . . . . . . . . . . . . . . . . . . . . . . . . . . . . . . . . . . . . . . . . . . . . . . . . . . . . . . . . . . . . . . . 987,471Accounts payable and accrued expenses . . . . . . . . . . . . . . . . . . . . . . . . . . . . . . . . . . . . . . . . . . . . . . . . . . . . . (473,543)Customer deposits . . . . . . . . . . . . . . . . . . . . . . . . . . . . . . . . . . . . . . . . . . . . . . . . . . . . . . . . . . . . . . . . . (150,070)Short-term debt . . . . . . . . . . . . . . . . . . . . . . . . . . . . . . . . . . . . . . . . . . . . . . . . . . . . . . . . . . . . . . . . . . (323,110)Sonitec former stockholder advances . . . . . . . . . . . . . . . . . . . . . . . . . . . . . . . . . . . . . . . . . . . . . . . . . . . . . . . (316,000)
Net assets acquired . . . . . . . . . . . . . . . . . . . . . . . . . . . . . . . . . . . . . . . . . . . . . . . . . . . . . . . . . . . . . . 3,471,427Less: contingent consideration payable . . . . . . . . . . . . . . . . . . . . . . . . . . . . . . . . . . . . . . . . . . . . . . . . . . . . . . (641,000)Less: working capital settlement payable . . . . . . . . . . . . . . . . . . . . . . . . . . . . . . . . . . . . . . . . . . . . . . . . . . . . . (102,673)
Cash paid for businesses acquired . . . . . . . . . . . . . . . . . . . . . . . . . . . . . . . . . . . . . . . . . . . . . . . . . . . . . . $ 2,727,754
Costs incurred with acquisition:Transaction costs . . . . . . . . . . . . . . . . . . . . . . . . . . . . . . . . . . . . . . . . . . . . . . . . . . . . . . . . . . . . . . . . . . $ 527,407
See notes to consolidated financial statements.
F-91

NB Intermediate Holdings, LLC and Subsidiaries
Notes to Audited Consolidated Financial Statements
1. Nature of Operations and Basis of Presentation
NB Intermediate Holdings, LLC (‘‘NB Intermediate’’) is a wholly owned subsidiary of NBFiltration Holdings, LLC. (the ‘‘Parent’’). NB Intermediate, a Delaware Limited Liability Company, isthe sole owner of Neptune-Benson, LLC (‘‘Neptune-Benson’’). Neptune-Benson is the sole owner ofEngineered Treatment Systems, LLC (‘‘ETS’’) and 3287920 Nova Scotia Limited (‘‘Nova Scotia’’). NovaScotia is the sole owner of Sonitec-Vortisand Technologies ULC (‘‘Sonitec’’). The consolidated financialstatements include the accounts of NB Intermediate, Neptune-Benson, ETS, Nova Scotia and Sonitec(together, the ‘‘Company’’). The Parent, NB Intermediate and Neptune-Benson were established priorto July 7, 2011 for the purpose of acquiring all assets and assuming certain liabilities ofNeptune-Benson, Inc. On September 11, 2012, Neptune-Benson acquired the assets and assumedcertain liabilities of ETS. On December 6, 2013, Neptune-Benson acquired certain assets of BRI MetalWorks, Inc. (‘‘BRI’’). Nova Scotia was established on April 9, 2015, for the purpose of acquiring thestock of Sonitec-Vortisand Technologies ULC. On January 14, 2015, Neptune-Benson acquired certainassets of ProFlo, Inc. (‘‘ProFlo’’).
Neptune-Benson is principally engaged in the design and manufacture of aquatic filtration andrecirculation systems, and is headquartered in Coventry, Rhode Island. The Company sells its productsto swimming pool and aquatic recreational facilities, aquariums, zoos and water parks throughout theworld. The Company generally sells to contractors building or renovating these facilities. ETS isprincipally engaged in the design and manufacture of UV Systems for the commercial aquatics industryand for the industrial and municipal markets. ETS’s manufacturing facility is located in Beaver Dam,Wisconsin. Sonitec is principally engaged in the design and sale of micro-sand filters in the industrialsector. Sonitec’s facility is located in Montreal, Canada. Manufacturing for Sonitec filters is performedout of Coventry, Rhode Island. BRI was principally engaged in the design and manufacture of filtersand was a significant supplier to Neptune-Benson. ProFlo was principally engaged in the design andmanufacture of water strainers.
2. Summary of Significant Accounting Policies
Codification
The accompanying consolidated financial statements have been prepared in accordance withaccounting standards set by the Financial Accounting Standards Board (‘‘FASB’’). The FASB setsgenerally accepted accounting principles (‘‘GAAP’’) that the Company follows to ensure its financialcondition, results of operations, and cash flows are consistently reported. References to GAAP issuedby the FASB in these notes to the consolidated financial statements are to the FASB AccountingStandards Codification (‘‘ASC’’).
Principles of Consolidation
The consolidated financial statements include the accounts of the Company and its wholly-ownedsubsidiaries. All significant intercompany accounts and transactions have been eliminated inconsolidation.
Cash and Cash Equivalents
The Company considers all highly liquid investments with original maturity dates of three monthsor less when purchased, to be cash equivalents.
F-92

NB Intermediate Holdings, LLC and Subsidiaries
Notes to Audited Consolidated Financial Statements (Continued)
2. Summary of Significant Accounting Policies (Continued)
The Company maintains its cash and cash equivalents in bank deposit accounts, which, at timesmay exceed federally insured limits. The Company has not experienced losses in such accounts. TheCompany believes that it is not exposed to any significant credit risk on cash and cash equivalents.
Restricted Cash
The Company’s Bank has issued letters of guarantee to certain customers totaling $219,824 toguarantee the Company’s performance on extended warranty contracts purchased by certain customers.The letters of guarantee are secured by cash held in a restricted cash account. The Company also has$40,000 of restricted cash securing corporate credit cards. These amounts are classified as restrictedcash on the accompanying consolidated balance sheet at December 31, 2015.
Accounts Receivable
Accounts receivable are stated at the amount management expects to collect from the outstandingbalance. On a regular basis, the Company reviews the adequacy of its allowance for doubtful accountsbased on historical collection results and current economic conditions using factors based on the agingof its accounts receivable. In addition, the Company estimates specific additional allowances based onindications that a specific customer may be experiencing financial difficulties. When the Companydetermines that an account is uncollectible, it is written off against the allowance for doubtful accounts.Recoveries of amounts receivable previously written off are recorded when received. A receivable isconsidered to be past due if any portion of the receivable balance is outstanding for more than 90 days.
Inventories
Inventories, which include material, labor and overhead, are stated at the lower of cost or market.Cost is determined using the first-in, first-out (‘‘FIFO’’) method. The Company expenses overhead costsrelated to idle capacity in the period the costs are incurred. On a regular basis, the Company reviewsthe adequacy of its provision for excess and obsolete inventory based on historical experience, productknowledge and demand estimates. The Company records, as a charge to cost of goods sold, anyamounts required to reduce the carrying value of its inventory to net realizable value.
Property and Equipment
Property and equipment are stated at cost. Depreciation of property and equipment is recordedusing the straight-line method over the estimated useful lives of the assets. Maintenance and repaircosts are expensed as incurred. Upon sale or retirement, the cost and related accumulated depreciationare removed from the respective accounts and the resulting gain or loss is included in currentoperations.
The estimated useful lives of property and equipment are as follows:
Machinery and equipment . . . . . . . . . . . . . . . . . . . . . . . . . . . . . . . . . . 1 - 5 yearsComputer equipment and software . . . . . . . . . . . . . . . . . . . . . . . . . . . 1 - 5 yearsOffice equipment . . . . . . . . . . . . . . . . . . . . . . . . . . . . . . . . . . . . . . . . 1 - 5 yearsFurniture and fixtures . . . . . . . . . . . . . . . . . . . . . . . . . . . . . . . . . . . . . 1 - 5 yearsMotor vehicle . . . . . . . . . . . . . . . . . . . . . . . . . . . . . . . . . . . . . . . . . . . 5 years
F-93

NB Intermediate Holdings, LLC and Subsidiaries
Notes to Audited Consolidated Financial Statements (Continued)
2. Summary of Significant Accounting Policies (Continued)
Software Development Costs
Costs for software developed for internal use are accounted for in accordance with ASC 350,Intangibles—Goodwill and Other—Internal-Use Software. ASC 350 requires the capitalization of certaincosts incurred in connection with developing or obtaining internal-use software. In accordance withASC 350, the Company expenses costs incurred in the preliminary project stage of developing oracquiring internal use software, such as research and feasibility studies, as well as costs incurred in thepost-implementation/operational stage, such as maintenance and training. Capitalization of softwaredevelopment costs occurs only after the preliminary project stage is complete, management authorizesthe project, and it is probable that the project will be completed and the software will be used for thefunction intended. Costs associated with the purchase and development of computer software arecapitalized and amortized on a straight-line basis over the estimated useful life of the related asset onceplaced in service. Software development costs totaling $695,625 are recorded in deferred costs as ofDecember 31, 2015 and have not yet been placed in service. The capitalized costs include softwarelicense fees and contractor development and implementation costs. The software development projectwas put on hold by management late in 2015 and is expected to be continued in early 2016.
Impairment of Long-Lived Assets
The Company accounts for impairment of long-lived assets in accordance with ASC 360—Property,Plant and Equipment. ASC 360 requires that long-lived assets, including definite-lived intangibles, bereviewed for impairment whenever events or changes in circumstances indicate that the book value ofthe asset may not be recoverable. The Company evaluates whether events and circumstances haveoccurred that indicate possible impairment.
An asset is considered impaired if the net book value of the asset exceeds the future projectedundiscounted cash flows anticipated to be generated by the asset. The impairment is then measured asthe excess of the net book value of the asset over its estimated fair value. For the year endedDecember 31, 2015, no impairment charge was required.
Debt Issuance Costs
Debt issuance costs consist of capitalized professional fees, bank fees and other costs associatedwith the securing of bank financing. These costs represent a debt discount and reduce the carryingvalue of the related debt. The costs are being amortized using the effective interest method over theterms of the respective debt agreements. The Company paid debt issuance costs in 2015 totaling$73,750, which was recorded as additional debt discount in connection with the modifications of thesenior debt.
Amortization expense for the year ended December 31, 2015 was $610,869, and is included ininterest expense in the accompanying consolidated statement of income.
Goodwill and Intangible Assets
The Company accounts for business combinations pursuant to ASC 805, Business Combinations.Goodwill in such acquisitions represents the excess of the cost of a business acquired over the fairvalue of the net assets acquired, including identifiable intangible assets, and liabilities assumed.ASC 805 specifies criteria to be used in determining whether intangible assets acquired in a business
F-94

NB Intermediate Holdings, LLC and Subsidiaries
Notes to Audited Consolidated Financial Statements (Continued)
2. Summary of Significant Accounting Policies (Continued)
combination must be recognized and reported separately from goodwill. Amounts assigned to goodwilland other identifiable intangible assets were determined with the assistance of an independentappraiser using a market approach and a discounted cash flow analysis.
Under FASB ASC 350, Intangibles—Goodwill and Other, intangible assets with indefinite lives arereviewed annually for impairment. The review for impairment consists of a comparison of the fair valueof the asset with its carrying amount. Fair value is an estimate of the price a willing buyer would payfor the intangible asset and is generally estimated by discounting the expected future cash flowsassociated with the intangible asset.
In accordance with the related guidance, the Company, with the assistance of independentvaluation experts, conducts an impairment evaluation for goodwill at least annually, or more frequently,if events or changes in circumstances indicate that an asset might be impaired. The evaluation isperformed using a two-step process. The first step (defined as ‘‘Step 1’’) compares the book value ofthe Company’s reporting unit to its estimated fair value. The second step (defined as ‘‘Step 2’’) of thegoodwill impairment test, which is only required when the net book value of the reporting unit exceedsthe fair value, compares the implied fair value of goodwill to its book value to determine if animpairment is required. The Company estimates the fair value of its reporting units using the incomeand market approaches which measure the value of an intangible asset based on the expected stream ofmonetary benefits attributable to it over its remaining useful life, and market appraisal. The Companyhas two reporting units and performs its annual step 1 analysis in the fourth quarter.
The Company provides for amortization of intangible assets with definite lives using straight-linemethods over their estimated useful lives. The amortization periods of the intangible assets are asfollows:
Trademarks and trade names . . . . . . . . . . . . . . . . . . . . . . . . . . . . . . . . . 10 yearsDeveloped technology . . . . . . . . . . . . . . . . . . . . . . . . . . . . . . . . . . . . . . 9 yearsBacklog . . . . . . . . . . . . . . . . . . . . . . . . . . . . . . . . . . . . . . . . . . . . . . . . . <1 yearNon-compete agreements . . . . . . . . . . . . . . . . . . . . . . . . . . . . . . . . . . . . 5 yearsCustomer relationships . . . . . . . . . . . . . . . . . . . . . . . . . . . . . . . . . . . . . . 9 yearsPatents . . . . . . . . . . . . . . . . . . . . . . . . . . . . . . . . . . . . . . . . . . . . . . . . . 9 yearsSoftware development costs . . . . . . . . . . . . . . . . . . . . . . . . . . . . . . . . . . 3 years
Revenue Recognition
Revenue from product sales is recorded, net of sales tax, at the time of shipment, provided thatpersuasive evidence of an arrangement exists, the seller’s price to the buyer is fixed or determinableand collectability is reasonably assured. Shipping and handling fees charged to customers arerecognized at the time the products are shipped and are included in net sales. The related shipping andhandling costs are included in cost of goods sold on the accompanying consolidated statements ofoperations.
The company follows the guidance of Accounting Standards Codification (‘‘ASC’’) Subtopic 605-25,Multi-Deliverable Revenue Arrangements (ASC 605-25). Agreements containing multiple elements aredivided into separate units of accounting if certain criteria are met, including whether the deliveredelement has a stand-alone value to the customer. The consideration received is then allocated amongthe separate units based on the hierarchy discussed below. For those deliverables that qualify as
F-95

NB Intermediate Holdings, LLC and Subsidiaries
Notes to Audited Consolidated Financial Statements (Continued)
2. Summary of Significant Accounting Policies (Continued)
separate units of accounting, the Company must assign value based on each deliverable’s vendor-specific objective evidence (‘‘VSOE’’) of the value, if applicable, third-party evidence (‘‘TPE’’) of itsvalue if VSOE is not available, or estimated selling price (‘‘ESP’’) if neither VSOE or TPE is available.Arrangement consideration is then allocated to all deliverables using the relative selling price method.
Concentration of Credit Risk and Major Customers
For the year ended December 31, 2015 the Company had no customers that accounted for morethan 10% of sales. As of December 31, 2015, there was no individual customer that accounted for morethan 10% of the accounts receivable balance.
Advertising
The Company expenses the costs of advertising as incurred. For the year ended December 31,2015, advertising expenses amounted to $172,450.
Fair Value Measurements
The Company follows current accounting standards for fair value measurements, which define fairvalue as ‘‘the price that would be received to sell an asset or paid to transfer a liability in an orderlytransaction between market participants at the measurement date’’, and establish a fair value hierarchythat requires an entity to maximize the use of observable inputs and minimize the use of unobservableinputs when measuring fair value. A financial instrument’s categorization within the fair value hierarchyis based upon the lowest level of input that is significant to the fair value measurement. There arethree levels of inputs that may be used to measure fair value.
Level 1—Applies to assets or liabilities for which there are quoted prices in active markets foridentical assets or liabilities.
Level 2—Applies to assets or liabilities for which there are inputs, other than quoted pricesincluded within Level 1, that are observable for the asset or liability such as quotedprices for similar assets or liabilities in active markets; quoted prices for identical assetsor liabilities in markets with insufficient volume or infrequent transactions (less activemarkets); or model-derived valuations in which significant inputs are observable or canbe derived principally from, or corroborated by, observable market data.
Level 3—Applies to assets or liabilities for which there are unobservable inputs to the valuationmethodology that are significant to the measurement of the fair value of the assets orliabilities.
Use of Estimates
The preparation of consolidated financial statements in conformity with accounting principlesgenerally accepted in the United States of America requires management to make estimates andassumptions that affect the reported amounts of assets and liabilities and disclosure of contingent assetsand liabilities at the date of the financial statements and the reported amount of revenues and expensesduring the reporting period. Actual results could differ from those estimates. Significant estimatesincluded in the consolidated financial statements include allowance for doubtful accounts, excess and
F-96
NB Intermediate Holdings, LLC and Subsidiaries
Notes to Audited Consolidated Financial Statements (Continued)
2. Summary of Significant Accounting Policies (Continued)
obsolete inventory, warranty reserves, equity based compensation, contingent consideration and theestimated values and lives of long-lived assets, including goodwill and intangible assets.
Product Warranties
Most of the Company’s products carry a product warranty, which generally provides customers theright to return defective product during the specified warranty period, for repair or replacement at nocost to the customer. Based upon a specific issue identified during 2013, with respect to certain gratessold through June 2013, the Company recorded a warranty reserve. At December 31, 2015, there wasno requirement for a warranty reserve on other products. Following is a schedule of warranty reserveactivity:
Warranty reserve, beginning balance . . . . . . . . . . . . . . . . . . . . . . . . . . . . $250,288Warranty costs . . . . . . . . . . . . . . . . . . . . . . . . . . . . . . . . . . . . . . . . . . . . —Warranty claims . . . . . . . . . . . . . . . . . . . . . . . . . . . . . . . . . . . . . . . . . . . (45,718)
Warranty reserve, ending balance . . . . . . . . . . . . . . . . . . . . . . . . . . . . . . $204,570
Financial Instruments
The carrying amount of cash and cash equivalents, accounts receivable, accounts payable, accruedexpenses and customer deposits approximate fair value due to the short term nature of theseinstruments. The carrying amount of the long-term debt is reported net of unamortized debt issuancecosts totaling $672,669 at December 31, 2015. The face value of the senior debt and revolving line ofcredit approximates fair value as the related interest rates approximate the Company’s incrementalborrowing rate for similar obligations. The face value of the related debt instruments are presented inNote 7. In addition, the senior and revolving debt are at variable rates. The following table summarizesthe estimated fair values of the Company’s other financial instruments at December 31, 2015:
Fair Value atDecember 31,
2015
Senior debt and revolving loan . . . . . . . . . . . . . . . . . . . . . . . . . . . . . $(64,750,000)
Equity Based Compensation
The Company accounts for equity-based awards to employees using the fair value method asprescribed by U.S. GAAP. Accordingly, compensation expense is recorded for the fair value of equityawards issued to employees measured at the date of grant, over the requisite service period for P unitsof five years.
Compensation costs for unit awards issued to employees and expected to vest, are recognized overthe vesting period based on the grant date fair value of the unit awards. For time based awards,compensation cost is recognized on a straight-line basis over the vesting period. The grant date hasbeen considered the measurement date for all awards granted.
The fair value of each grant is estimated on the date of the grant based on a valuation of theequity interests issued, which is performed by a third party valuation specialist.
F-97
NB Intermediate Holdings, LLC and Subsidiaries
Notes to Audited Consolidated Financial Statements (Continued)
2. Summary of Significant Accounting Policies (Continued)
Income Taxes
The Company is a Limited Liability Company which has elected to be taxed as a partnership. TheCompany is not liable for any income taxes. The members of the Company’s parent will pay incometaxes on their respective share of the Company’s income. The Company will declare and paydistributions calculated at the highest tax rate of the members on the income earned and reported bythe Company on its tax returns. Such amounts will be recognized as a distribution in the period inwhich the income is earned. The Company declared $2,035,403 of distributions for the year endedDecember 31, 2015.
The Company follows FASB ASC 740, Accounting for Uncertainty in Income Taxes (‘‘ASC 740’’).ASC 740 provides guidance for how uncertain tax positions should be recognized, measured, presentedand disclosed in the financial statements. ASC 740 also requires the evaluation of tax positions taken orexpected to be taken in the course of preparing the Company’s tax returns to determine whether thetax positions are more-likely-than-not of being sustained by the applicable tax authority. Tax positionsnot deemed to meet a more-likely-than-not threshold would be recorded as a tax expense in the currentyear.
The Company files tax returns in the federal and various state jurisdictions. Management hasreviewed the Company’s tax positions for the open tax years 2012 - 2015 and has determined that noprovision for uncertain tax positions is required in the Company’s consolidated financial statements.Penalties and interest, if any, would be recorded in income tax expense.
Foreign Currency Translation
The Company accounts for activity with its Sonitec subsidiary in accordance with ASC 830, ForeignCurrency Matters. The Company determined that the functional currency of the Sonitec subsidiary is theUnited States Dollar.
Accordingly, all monetary assets and liabilities of the Sonitec subsidiary are remeasured into U.S.dollars at exchange rates in effect as of the balance sheet date, and nonmonetary assets and liabilitiesare translated at historical exchange rates. Results of operations are remeasured at the averageexchange rates for the period. Foreign exchange gains and losses from revaluation of the non-U.S.dollar denominated assets and liabilities, which were immaterial in 2015 are included in the Company’sresults of operations.
The transaction gains and losses for the year ended December 31, 2015 were $29,189 and arerecorded in other income (expense), net, in the consolidated statements of operations for the year thenended.
Recent Accounting Policies
On August 12, 2015, the FASB issued Accounting Standards Update (ASU) 2015-14, Revenuefrom Contracts with Customers (Topic 606): Deferral of the Effective Date. This ASU: (a) defers theeffective date of ASU 2014-09, Revenue from Contracts with Customers (Topic 606), by one year forboth public and nonpublic entities and (b) allows early adoption of the ASU by all entities as of theoriginal effective date for public entities. ASU 2014-09, Revenue from Contracts with Customers(Topic 606), will require an entity to recognize the amount of revenue to which it expects to be entitled
F-98

NB Intermediate Holdings, LLC and Subsidiaries
Notes to Audited Consolidated Financial Statements (Continued)
2. Summary of Significant Accounting Policies (Continued)
for the transfer of promised goods or services to customers. The updated standard will replace mostexisting revenue recognition guidance in U.S. GAAP when it becomes effective for annual reportingperiods beginning after December 15, 2018. The Company is currently assessing the impact adoption ofthis guidance will have on its consolidated financial statements.
The FASB issued Accounting Standards Update (ASU) 2015-03, Interest—Imputation of Interest(Subtopic 835-30): Simplifying the Presentation of Debt Issuance Cost. This ASU requires that debtissuance costs related to a recognized debt liability be presented in the balance sheet as a directdeduction from the carrying amount of that debt liability, consistent with debt discounts. Therecognition and measurement guidance for debt issuance costs is not affected by the new guidance.This standard was implemented as of December 31, 2015.
3. Business Combinations
Sonitec Acquisition
On April 9, 2015, Neptune-Benson acquired all of the stock of Sonitec-VortisandTechnologies ULC and non-compete agreements with the seller, for a total consideration of $2,727,957,including a working capital settlement of $102,673, paid in January 2016. Of the total consideration,$2,637,957 was allocated to the purchase and $90,000 was allocated to the non-compete agreements. Ofthe consideration transferred, $2,334,284 was paid in cash to the sellers and a contingent earnout withan estimated fair market value of $291,000 was incurred. The contingent consideration requires theCompany to make additional payments to the sellers, based on the performance of the business. Thecontingent payment is based on the value of purchase orders received for the year endingDecember 31, 2016 and was calculated by the Company’s third party valuation specialist based on aprobability weighting of likely outcomes.
Assets acquired and liabilities assumed in connection with the acquisition have been recorded attheir fair values. The excess of the acquisition price over the fair value of the assets acquired andliabilities assumed was recorded as goodwill. All of the goodwill is deductible by the Parent Company’smembers for tax purposes. The Company incurred $483,654 in acquisition related expenses. The
F-99

NB Intermediate Holdings, LLC and Subsidiaries
Notes to Audited Consolidated Financial Statements (Continued)
3. Business Combinations (Continued)
following summarizes the estimated fair value of the assets acquired and liabilities assumed by theCompany in accordance with the acquisition method of accounting:
Accounts receivable . . . . . . . . . . . . . . . . . . . . . . . . . . . . . . . . . . . . . . . $ 328,901Inventory . . . . . . . . . . . . . . . . . . . . . . . . . . . . . . . . . . . . . . . . . . . . . . 308,560Prepaid expenses and other current assets . . . . . . . . . . . . . . . . . . . . . . 85,820Property and equipment . . . . . . . . . . . . . . . . . . . . . . . . . . . . . . . . . . . 85,928Tradename . . . . . . . . . . . . . . . . . . . . . . . . . . . . . . . . . . . . . . . . . . . . . 220,000Product technology . . . . . . . . . . . . . . . . . . . . . . . . . . . . . . . . . . . . . . . 760,000Customer relationships . . . . . . . . . . . . . . . . . . . . . . . . . . . . . . . . . . . . 1,500,000Backlog . . . . . . . . . . . . . . . . . . . . . . . . . . . . . . . . . . . . . . . . . . . . . . . 60,000Goodwill . . . . . . . . . . . . . . . . . . . . . . . . . . . . . . . . . . . . . . . . . . . . . . 551,471Accounts payable and accrued expenses . . . . . . . . . . . . . . . . . . . . . . . . (473,543)Customer deposits . . . . . . . . . . . . . . . . . . . . . . . . . . . . . . . . . . . . . . . . (150,070)Short-term debt . . . . . . . . . . . . . . . . . . . . . . . . . . . . . . . . . . . . . . . . . (323,110)Sonitec former stockholder advances . . . . . . . . . . . . . . . . . . . . . . . . . . (316,000)
Net assets acquired . . . . . . . . . . . . . . . . . . . . . . . . . . . . . . . . . . . . . $2,637,957
Fair market value of net assets acquired:
Total fair market value of net assets acquired . . . . . . . . . . . . . . . . . . . . $2,637,957Less: contingent consideration . . . . . . . . . . . . . . . . . . . . . . . . . . . . . . . (291,000)Less: working capital settlement payable . . . . . . . . . . . . . . . . . . . . . . . . (102,673)
Cash paid for net assets acquired . . . . . . . . . . . . . . . . . . . . . . . . . . . $2,244,284
The purpose of the transaction was to expand and diversify the Company’s customer base toinclude industrial and municipal markets and to add complimentary products and services. Goodwillrecorded in the transaction reflects the synergistic value of the customer base and product lines of thecompanies acquired and the Company’s ability to leverage the existing and newly acquired resources toexpand sales and profitability. The costs of the non-compete agreements are amortized over the life ofthe agreements.
The contractual gross receipts acquired were $364,723. Management anticipates recovery of thesereceipts of $328,901.
ProFlo, Inc. Acquisition
On January 14, 2015, Neptune-Benson acquired certain assets of ProFlo, Inc., for a totalconsideration of $844,470. Of the total consideration, $833,470 was allocated to the purchase and$11,000 was allocated to the non-compete agreements. Of the consideration transferred, $494,470 waspaid in cash to the sellers and a contingent earnout with an estimated fair market value of $350,000was incurred. The contingent consideration requires the Company to make additional payments to thesellers, based on the performance of the business. The contingent consideration was calculated by theCompany’s third party valuation specialist based on a probability weighting of potential outcomesdiscounted for the inherent risk and time value of money. Assets acquired in connection with the
F-100

NB Intermediate Holdings, LLC and Subsidiaries
Notes to Audited Consolidated Financial Statements (Continued)
3. Business Combinations (Continued)
acquisition have been recorded at their fair values. The Company incurred $43,753 in acquisitionrelated expenses.
The following summarizes the estimated fair value of the assets acquired by the Company inaccordance with the acquisition method of accounting:
Inventory . . . . . . . . . . . . . . . . . . . . . . . . . . . . . . . . . . . . . . . . . . . . . . . $174,470Tradename . . . . . . . . . . . . . . . . . . . . . . . . . . . . . . . . . . . . . . . . . . . . . . 23,000Product technology . . . . . . . . . . . . . . . . . . . . . . . . . . . . . . . . . . . . . . . . 200,000Goodwill . . . . . . . . . . . . . . . . . . . . . . . . . . . . . . . . . . . . . . . . . . . . . . . . 436,000
Total assets acquired . . . . . . . . . . . . . . . . . . . . . . . . . . . . . . . . . . . . . . $833,470
Fair market value of net assets acquired:
Total fair market value of net assets acquired . . . . . . . . . . . . . . . . . . . . . $ 833,470Less: contingent consideration . . . . . . . . . . . . . . . . . . . . . . . . . . . . . . . . (350,000)
Cash paid for net assets acquired . . . . . . . . . . . . . . . . . . . . . . . . . . . . $ 483,470
The purpose of the transaction was to acquire a key product from a supplier to the Company andbenefit from improved margins and the ability to accelerate the delivery of completed products.
Settlement of Acquisition Claim
In 2015, the Company settled claims against the seller in a prior acquisition related to productissues and to recover costs incurred during 2012-2015. The Company received $562,701 which wasreleased from escrow for claims related to this prior acquisition. The recovery was recorded as gain inthe accompanying consolidated statements of operations for the year ended December 31, 2015.
4. Inventories
Inventories consisted of the following at December 31, 2015:
Finished goods . . . . . . . . . . . . . . . . . . . . . . . . . . . . . . . . . . . . . . . . . $ 4,630,776WIP . . . . . . . . . . . . . . . . . . . . . . . . . . . . . . . . . . . . . . . . . . . . . . . . . 2,714,778Raw materials . . . . . . . . . . . . . . . . . . . . . . . . . . . . . . . . . . . . . . . . . . 3,237,342
$10,582,896
F-101

NB Intermediate Holdings, LLC and Subsidiaries
Notes to Audited Consolidated Financial Statements (Continued)
5. Property and Equipment
Property and equipment consisted of the following at December 31, 2015:
Machinery and equipment . . . . . . . . . . . . . . . . . . . . . . . . . . . . . . . . . . $1,284,666Computer equipment . . . . . . . . . . . . . . . . . . . . . . . . . . . . . . . . . . . . . 229,859Office equipment . . . . . . . . . . . . . . . . . . . . . . . . . . . . . . . . . . . . . . . . 183,250Furniture and fixtures . . . . . . . . . . . . . . . . . . . . . . . . . . . . . . . . . . . . . 269,391Leasehold improvements . . . . . . . . . . . . . . . . . . . . . . . . . . . . . . . . . . . 97,583Motor vehicles . . . . . . . . . . . . . . . . . . . . . . . . . . . . . . . . . . . . . . . . . . 104,832
2,169,581Less—accumulated depreciation . . . . . . . . . . . . . . . . . . . . . . . . . . . . . . (826,070)
$1,343,511
Total depreciation expense for the year ended December 31, 2015 was $303,525.
6. Intangible Assets
Intangible assets consisted of the following at December 31, 2015:
Accumulated Net BookCost Amortization Value
Definite lived intangible assets:Trademarks and trade names . . . . . . . . $16,543,000 $ (6,582,693) $ 9,960,307Developed technology . . . . . . . . . . . . . 9,960,000 (4,805,014) 5,154,986Backlog . . . . . . . . . . . . . . . . . . . . . . . 1,620,000 (1,603,750) 16,250Non-compete agreements . . . . . . . . . . . 1,451,000 (1,053,708) 397,292Customer relationships . . . . . . . . . . . . 39,373,000 (18,438,884) 20,934,116Patents . . . . . . . . . . . . . . . . . . . . . . . . 195,373 — 195,373
$69,142,373 $(32,484,049) $36,658,324
Amortization expense totaled $7,510,421 for the year ended December 31, 2015.
Estimated amortization expense, in the aggregate, and for the next five years and thereafter isexpected to be:
2016 . . . . . . . . . . . . . . . . . . . . . . . . . . . . . . . . . . . . . . . . . . . . . . . . . $ 7,701,7602017 . . . . . . . . . . . . . . . . . . . . . . . . . . . . . . . . . . . . . . . . . . . . . . . . . 7,368,6412018 . . . . . . . . . . . . . . . . . . . . . . . . . . . . . . . . . . . . . . . . . . . . . . . . . 6,983,7852019 . . . . . . . . . . . . . . . . . . . . . . . . . . . . . . . . . . . . . . . . . . . . . . . . . 5,363,4582020 . . . . . . . . . . . . . . . . . . . . . . . . . . . . . . . . . . . . . . . . . . . . . . . . . 3,554,822Thereafter . . . . . . . . . . . . . . . . . . . . . . . . . . . . . . . . . . . . . . . . . . . . 5,685,858
$36,658,324
For the amortizing intangible assets, the remaining weighted-average amortization period foraggregate net intangible assets at December 31, 2015 is 5.5 years.
F-102

NB Intermediate Holdings, LLC and Subsidiaries
Notes to Audited Consolidated Financial Statements (Continued)
6. Intangible Assets (Continued)
Goodwill consisted of the following at December 31, 2015:
Balance at December 31, 2014 . . . . . . . . . . . . . . . . . . . . . . . . . . . . . . $29,551,152Acquisition of Sonitec . . . . . . . . . . . . . . . . . . . . . . . . . . . . . . . . . . 551,471Acquisition of ProFlo . . . . . . . . . . . . . . . . . . . . . . . . . . . . . . . . . . . 436,000
Balance at December 31, 2015 . . . . . . . . . . . . . . . . . . . . . . . . . . . . . . $30,538,623
7. Long-Term Debt
On September 11, 2012, the Company entered into a new credit facility with GE Capital (‘‘GE’’),which provided a Senior Debt term loan of $47,000,000 and a revolving line of credit of $8,000,000.The Senior Debt term loan was used to repay the Senior Debt term loan provided by Maranon andfinance the acquisition of Engineered Treatment Systems, LLC. The Company also amended andrestated the Mezzanine Debt agreement to increase loan availability to $22,000,000. Substantially all ofthe Company’s assets are pledged as collateral under these debt agreements with the senior debt havingpriority over the mezzanine debt. On May 9, 2014, the Company amended and restated their creditfacility with GE to increase the senior debt to an aggregate principle amount of $66,475,000. Theproceeds of the additional senior debt were used to repay the mezzanine debt of $22,000,000 plusaccrued interest on the same date. On April 9, 2015, the Company amended and restated their creditfacility with GE to increase the senior debt to an aggregate principle amount of $66,475,000. Theadditional proceeds totaling $3,500,000 were used to finance the acquisition of Sonitec-VortisandTechnologies ULC. The debt agreements contain certain covenants, including a fixed charge coverageratio, a leverage ratio, a limit on capital expenditures and EBITDA metrics that must be met on aperiodic basis.
Revolving Line of Credit
The Company has an option to calculate interest, on the revolving line of credit, at either LIBOR,with a floor of 1%, plus a margin of 4.50%, or the Bank’s base rate, plus a margin of 3.25% (7% atDecember 31, 2015). The outstanding balance under this agreement at December 31, 2015 was$900,000. The revolving line of credit expires on January 17, 2017. The line is cross-collateralized withthe senior debt.
Senior Debt
On September 11, 2012, the Company entered into a senior debt term loan payable in the amountof $47,000,000 to GE in quarterly principal payments of $587,500, plus interest, until September 30,2016 with a balloon payment totaling $37,600,000 due on January 17, 2017. On May 9, 2014, theCompany amended and restated their credit facility to increase the senior debt term loan to anaggregate principle amount of $66,475,000, with quarterly principal payments of $875,000, plus interest,until September 30, 2016 with a balloon payment totaling $57,725,000 due on January 17, 2017.
On April 9, 2015, the Company amended and restated their credit facility to increase the seniordebt term loan to an aggregate principle amount of $66,475,000, with quarterly principal payments of$875,000, plus interest, until September 30, 2016 with a balloon payment totaling $61,225,000 due onJanuary 17, 2017. The Company has an option to calculate interest at either LIBOR, with a floor of
F-103
NB Intermediate Holdings, LLC and Subsidiaries
Notes to Audited Consolidated Financial Statements (Continued)
7. Long-Term Debt (Continued)
1%, plus a margin of 4.50%, or the Bank’s base rate, plus a margin of 3.25% (7.00% at December 31,2015).
The outstanding balance on the note at December 31, 2015 was $63,850,000, and is carried net ofunamortized debt issue cost of $672,669, as of December 31, 2015.
Long-term debt consisted of the following at December 31, 2015:
Senior debt . . . . . . . . . . . . . . . . . . . . . . . . . . . . . . . . . . . . . . . . . . . . $63,850,000Less—unamortized debt issuance costs . . . . . . . . . . . . . . . . . . . . . . . . (672,669)
63,177,331Less—current portion . . . . . . . . . . . . . . . . . . . . . . . . . . . . . . . . . . . . (2,004,073)
Long-term debt, net of current portion . . . . . . . . . . . . . . . . . . . . . . $61,173,258
Aggregate principal maturities of long-term debt at December 31, 2015, are as follows:
2016 . . . . . . . . . . . . . . . . . . . . . . . . . . . . . . . . . . . . . . . . . . . . . . . . . $ 2,625,0002017 . . . . . . . . . . . . . . . . . . . . . . . . . . . . . . . . . . . . . . . . . . . . . . . . . 61,225,000
$63,850,000
8. Member Equity
On July 7, 2011 the Company’s Parent organized the Company under the Delaware LimitedLiability Company Act. The Company shall continue until dissolved and its affairs wound up inaccordance with the Company’s operating agreement. There were no Member contributions during theyear ended December 31, 2015.
During the year ended December 31, 2015, the Company repurchased a total of 2,418.11 Class AMember units from a former Member for total consideration of $1,141,832.
Member Contributions
The Company’s Member shall not be obligated to make any additional equity contributions to theCompany. The Member shall not have the right to withdraw or to be repaid any capital contributed byit or to receive any other payment in respect of the Member’s interest.
Distributions
Distributions (including without limitation, distributions upon liquidation of the Company) may bemade from all cash or property available for distribution and shall be made 100% to the Member. Anydistributions made prior to the liquidation of the Company shall be made at such times and in suchmanner as shall be determined by the Member in its sole discretion. During the year endedDecember 31, 2015, the Company declared distributions totaling $2,035,403 to its member.
F-104

NB Intermediate Holdings, LLC and Subsidiaries
Notes to Audited Consolidated Financial Statements (Continued)
8. Member Equity (Continued)
Equity Based Compensation
Under the plan, the Parent issues P Units to employees of the Company in connection with and aspart of its compensation and incentive arrangements. The P Units were granted at various times duringthe fiscal year, vest ratably at 20% per year, and are only exercisable in conjunction with a change incontrol of the Company, consummation of an initial public offering, or dissolution of the Company, asdefined by the agreement. The Company recognizes compensation expense for P Units that are issuedby its Parent in accordance with the Parent’s operating agreement. The Company recognizes the costsassociated with P Units using the fair value recognition provisions of ASC 718, Compensation—StockCompensation on a straight-line basis over the vesting period of the awards.
The Parent issued P Units to certain members of the Company’s management and employeesduring 2015. At December 31, 2015, 14,486 P units were issued and outstanding.
The Company estimates the fair value of each P Unit on the grant date using an option pricingvaluation model incorporating the assumptions around the estimated stock price, dividend yield,expected volatility, risk free rate, and the discount associated with the limited marketability of theseunits.
A summary of P Unit activity, for the year ended December 31, 2015, is as follows:
Weighted-AverageNonvested Grant Date
Units Fair Value
Nonvested at December 31, 2014 . . . . . . . . . . . . . . . . . . 9,842 $95.36Granted . . . . . . . . . . . . . . . . . . . . . . . . . . . . . . . . . . . — —Vested . . . . . . . . . . . . . . . . . . . . . . . . . . . . . . . . . . . . (2,926) 95.17Forfeited . . . . . . . . . . . . . . . . . . . . . . . . . . . . . . . . . . (274) 90.79
Nonvested at December 31, 2015 . . . . . . . . . . . . . . . . . . 6,642 $92.77
Compensation expense recognized in the financial statements for the year ended December 31,2015 was $270,104, and is included in selling, general and administrative expense. As of December 31,2015, there was approximately $616,069 of unrecognized compensation expense related to nonvestedawards that is expected to be recognized from 2016 through 2019.
9. Fair Value Measurements
The following table presents the Company’s assets and liabilities measured at fair value on arecurring basis, as of December 31, 2015.
Fair Value Measurement
December 31, 2015 Level 1 Level 2 Level 3 Total
Contingent consideration payable . . . . . . . . . $— $— $582,839 $582,839
$— $— $582,839 $582,839
Included in Level 3 liabilities is the contingent consideration payable to the seller of the Sonitecshares in connection with the Company’s acquisition. The obligation was recorded at fair value based
F-105

NB Intermediate Holdings, LLC and Subsidiaries
Notes to Audited Consolidated Financial Statements (Continued)
9. Fair Value Measurements (Continued)
on a weighted probability of the payment amount discounted based on the relative risk of the estimateand the time value of money. The liability is adjusted to fair value at each reporting period. No fairvalue adjustment was made to the liability between the acquisition date and the balance sheet dateaside from payments under the terms of the agreement. The categorization of the framework used toprice the liabilities is considered Level 3, due to the subjective nature of the unobservable inputs usedto determine the fair value.
Level 3 Value Techniques
Financial assets and liabilities are considered Level 3 when the fair values are determined usingpricing models, discounted cash flow methodologies, or similar techniques and at least one significantmodel assumption or input is unobservable. The following table provides a reconciliation of theCompany’s Level 3 contingent consideration obligations for each of the following years:
Beginning balance . . . . . . . . . . . . . . . . . . . . . . . . . . . . . . . . . . . . . . . . . $ —Contingent consideration from Sonitec acquisition . . . . . . . . . . . . . . . . . . 291,000Contingent consideration from ProFlo acquisition . . . . . . . . . . . . . . . . . . 350,000Payments of contingent consideration . . . . . . . . . . . . . . . . . . . . . . . . . . . (58,161)
Ending balance . . . . . . . . . . . . . . . . . . . . . . . . . . . . . . . . . . . . . . . . . $582,839
10. Commitments And Contingencies
Operating Lease Commitments
The Company leases several buildings used in the operations of its business, under leases whichexpire through 2020. Rental payments include amounts for operating expenses and taxes in excess ofbase-year values established within the leases.
Future minimum rent payments under operating leases with related parties, as discussed inNote 11, in the aggregate and for the next five years ending December 31, are as follows:
2016 . . . . . . . . . . . . . . . . . . . . . . . . . . . . . . . . . . . . . . . . . . . . . . . . . . $ 821,4722017 . . . . . . . . . . . . . . . . . . . . . . . . . . . . . . . . . . . . . . . . . . . . . . . . . . 693,7832018 . . . . . . . . . . . . . . . . . . . . . . . . . . . . . . . . . . . . . . . . . . . . . . . . . . 587,0162019 . . . . . . . . . . . . . . . . . . . . . . . . . . . . . . . . . . . . . . . . . . . . . . . . . . 587,0162020 . . . . . . . . . . . . . . . . . . . . . . . . . . . . . . . . . . . . . . . . . . . . . . . . . . 30,762
$2,720,049
Rental expense for the operating leases amounted to $742,076, for the year ended December 31,2015.
Letter of Guarantee
In the ordinary course of business, the Company is contingently liable for performance underletters of guarantee totaling approximately $220,000 at December 31, 2015. The letters of credit aresecured by a cash account totaling $259,824.
F-106

NB Intermediate Holdings, LLC and Subsidiaries
Notes to Audited Consolidated Financial Statements (Continued)
10. Commitments And Contingencies (Continued)
Other
During 2015, the Company entered into retention bonuses with certain executives that are payableonly upon a sale of the company, as defined. As a result, no amount has been accrued for any futurebonus payout under this plan as of December 31, 2015. The amount of the bonuses varies dependingon the return on investment to the investors, as defined in the agreement.
The Company is involved in a variety of claims and other legal proceedings generally incidental toits normal business activities. While the outcome of any of these proceedings cannot be accuratelypredicted, the Company does not believe the ultimate resolution of any of these existing matters wouldhave a material adverse effect on its financial condition or results of operations.
11. Related Party Transactions
Management Agreement
The Company entered into a management services agreement with the majority investor in theCompany’s parent entity, in July 2011. Under the terms of this agreement the investor is required toprovide management and business services to the Company, including financial, marketing, insurance,executive personnel, corporate development and limited legal services, in exchange for an annual feeequal to the greater of $500,000 or a percentage of EBITDA, as defined, plus out of pocket costs, paidon a quarterly basis. The total cost of these services, for the year ended December 31, 2015, was$867,763.
Operating Lease
The Company leased manufacturing and office facilities from Gillespie Court LLC, an entitypartially owned by a minority owner and former owner of Neptune-Benson, Inc. The Company leasesmanufacturing and office facilities from Commercial Drive 238, LLC, an entity partially owned byminority owners of NB Filtration Holdings, LLC and former owner of Engineered TreatmentSystems, LLC (‘‘ETS’’). Rent expense and future minimum lease payments under these leases areincluded in Note 10.
Advances
For the year ended December 31, 2015, the Company owed $9,167, to its Parent, NB FiltrationHoldings, LLC for various advances, net of reimbursements.
The Company purchases significant amounts of its inventory and supplies from ATG—Willand(‘‘ATG’’), an entity partially owned by minority owners of NB Filtration Holdings, LLC and sellers ofETS. Total purchases from ATG, for the year ended December 31, 2015, were $1,904,368. In additionto inventory and supply purchases, ATG provides support services to the Company. Expenses related tosupport services for 2015 totaled $259,320. Total accounts payable to ATG were $150,973 atDecember 31, 2015.
The Company also sells products to ATG when ATG is unable to procure material from itssuppliers. Net sales to ATG for the year ended December 31, 2015 totaled $45,420. Total accountsreceivable from ATG were $3,420 at December 31, 2015.
F-107
NB Intermediate Holdings, LLC and Subsidiaries
Notes to Audited Consolidated Financial Statements (Continued)
11. Related Party Transactions (Continued)
The Company sells product to Neuman Pools, Inc. (‘‘Neuman’’), an entity partially owned byminority owners of NB Filtration Holdings, LLC and sellers of ETS. Total sales to Neuman for the yearended December 31, 2015 were $3,872,577. Total accounts receivable from Neuman were $1,397,543 atDecember 31, 2015.
The Company also shares employee resources with Neuman and reimburses them for certainexpenses incurred. Expenses of $6,691 were paid to Neuman for the year ended December 31, 2015.There were no accounts payable due to Neuman at December 31, 2015.
12. Employee Benefit Plan
Defined Contribution Plan
The Company offers a 401(k) plan to its full time employees who have completed one year ofcontinuous service, including time spent at the acquired companies. Employees may contribute apercentage of their annual compensation to the plan, up to the annual IRS limits. The Company doesnot provide a matching contribution, but, at its sole discretion, does provide a profit sharingcontribution to its employees on an annual basis. The Company’s contribution under this plan, chargedto operations in the year ended December 31, 2015, amounted to $321,734.
13. Subsequent Events
The Company has evaluated subsequent events through April 15, 2016, the date the financialstatements were available to be issued. No subsequent events have been identified that requirerecognition or disclosure other than the events described below.
On January 1, 2016, 3297920 Nova Scotia Limited and Sonitec-Vortisand Technologies ULC weremerged together to form Sonitec-Vortisand Technologies, Inc.
On April 15, 2016, Evoqua Water Technologies acquired 100% of the member’s equity of theCompany for $283.7 million.
F-108

NB Intermediate Holdings, LLC and Subsidiaries
Consolidated Balance Sheets as of March 31, 2016 (unaudited) and December 31, 2015
March 31, December 31,2016 2015
ASSETSCash and cash equivalents . . . . . . . . . . . . . . . . . . . . . . . . . . . . . . . . . . . $ 1,260,569 $ 1,235,155Restricted cash . . . . . . . . . . . . . . . . . . . . . . . . . . . . . . . . . . . . . . . . . . . 30,829 259,824Accounts receivable, net of allowance for doubtful accounts of $73,541
and $63,541 . . . . . . . . . . . . . . . . . . . . . . . . . . . . . . . . . . . . . . . . . . . 13,380,112 18,397,030Inventories, net . . . . . . . . . . . . . . . . . . . . . . . . . . . . . . . . . . . . . . . . . . 12,973,745 10,582,896Prepaid expenses and other current assets . . . . . . . . . . . . . . . . . . . . . . . 1,705,418 1,310,954
Total current assets . . . . . . . . . . . . . . . . . . . . . . . . . . . . . . . . . . . . 29,350,673 31,785,859
Property and equipment, net . . . . . . . . . . . . . . . . . . . . . . . . . . . . . . . . . 1,547,762 1,343,511Deferred costs . . . . . . . . . . . . . . . . . . . . . . . . . . . . . . . . . . . . . . . . . . . 695,625 695,625Intangible assets, net . . . . . . . . . . . . . . . . . . . . . . . . . . . . . . . . . . . . . . 34,855,248 36,658,324Goodwill . . . . . . . . . . . . . . . . . . . . . . . . . . . . . . . . . . . . . . . . . . . . . . . 30,538,623 30,538,623
Total other assets . . . . . . . . . . . . . . . . . . . . . . . . . . . . . . . . . . . . . . 67,637,258 69,236,083
Total assets . . . . . . . . . . . . . . . . . . . . . . . . . . . . . . . . . . . . . . . . . . $ 96,987,931 $101,021,942
LIABILITIES AND MEMBER’S EQUITYCurrent liabilities:
Revolving loan . . . . . . . . . . . . . . . . . . . . . . . . . . . . . . . . . . . . . . . . . $ 900,000 $ 900,000Current portion of long term debt . . . . . . . . . . . . . . . . . . . . . . . . . . . 62,455,049 2,004,073Accounts payable and accrued expenses . . . . . . . . . . . . . . . . . . . . . . . 6,065,323 8,785,507Distributions payable . . . . . . . . . . . . . . . . . . . . . . . . . . . . . . . . . . . . . 1,664,318 2,673,078Customer deposits . . . . . . . . . . . . . . . . . . . . . . . . . . . . . . . . . . . . . . . 1,356,098 773,357Contingent consideration payable . . . . . . . . . . . . . . . . . . . . . . . . . . . . 582,839 582,839Due to related party . . . . . . . . . . . . . . . . . . . . . . . . . . . . . . . . . . . . . — 5,892
Total current liabilities . . . . . . . . . . . . . . . . . . . . . . . . . . . . . . . . . . 73,023,627 15,724,746Long-term debt, net of current portion . . . . . . . . . . . . . . . . . . . . . . . . . — 61,173,258
Total liabilities . . . . . . . . . . . . . . . . . . . . . . . . . . . . . . . . . . . . . . . . 73,023,627 76,898,004
Commitments and contingencies . . . . . . . . . . . . . . . . . . . . . . . . . . . . . . — —Member’s equity:
Contributed equity . . . . . . . . . . . . . . . . . . . . . . . . . . . . . . . . . . . . . . 44,416,090 44,416,090Additional paid in capital . . . . . . . . . . . . . . . . . . . . . . . . . . . . . . . . . 515,609 448,083Accumulated deficit . . . . . . . . . . . . . . . . . . . . . . . . . . . . . . . . . . . . . (20,967,395) (20,740,235)
Total member’s equity . . . . . . . . . . . . . . . . . . . . . . . . . . . . . . . . . . 23,964,304 24,123,938
Total liabilities and member’s equity . . . . . . . . . . . . . . . . . . . . . . . . $ 96,987,931 $101,021,942
See notes to consolidated financial statements.
F-109

NB Intermediate Holdings, LLC and Subsidiaries
Unaudited Consolidated Statements of Net Loss for the Three Months Ended March 31,2015 and 2016
Three months ended
March 31, 2016 March 31, 2015
Net sales . . . . . . . . . . . . . . . . . . . . . . . . . . . . . . . . . . . . . . . . . . . . . . . $12,154,800 $ 8,992,883Cost of goods sold . . . . . . . . . . . . . . . . . . . . . . . . . . . . . . . . . . . . . . . . 5,306,478 3,960,993
Gross profit . . . . . . . . . . . . . . . . . . . . . . . . . . . . . . . . . . . . . . . . . 6,848,322 5,031,890Commission income . . . . . . . . . . . . . . . . . . . . . . . . . . . . . . . . . . . . . . . 14,283 42,816
6,862,605 5,074,706Selling, general and administrative expenses . . . . . . . . . . . . . . . . . . . . . . 3,706,972 2,565,445Acquisition related expenses . . . . . . . . . . . . . . . . . . . . . . . . . . . . . . . . . — 61,836Intangible asset amortization expense . . . . . . . . . . . . . . . . . . . . . . . . . . 1,900,907 1,813,129Management fees . . . . . . . . . . . . . . . . . . . . . . . . . . . . . . . . . . . . . . . . . 221,693 199,362
Operating income . . . . . . . . . . . . . . . . . . . . . . . . . . . . . . . . . . . . . 1,033,032 434,934
Other expense:Other expense . . . . . . . . . . . . . . . . . . . . . . . . . . . . . . . . . . . . . . . . . (38,874) (1,122)Foreign currency loss . . . . . . . . . . . . . . . . . . . . . . . . . . . . . . . . . . . . (32,791) —Interest expense . . . . . . . . . . . . . . . . . . . . . . . . . . . . . . . . . . . . . . . . (1,188,527) (1,217,851)
Net other expense . . . . . . . . . . . . . . . . . . . . . . . . . . . . . . . . . . . . . (1,260,192) (1,218,973)
Net loss . . . . . . . . . . . . . . . . . . . . . . . . . . . . . . . . . . . . . . . . . . . . $ (227,160) $ (784,039)
See notes to consolidated financial statements.
F-110
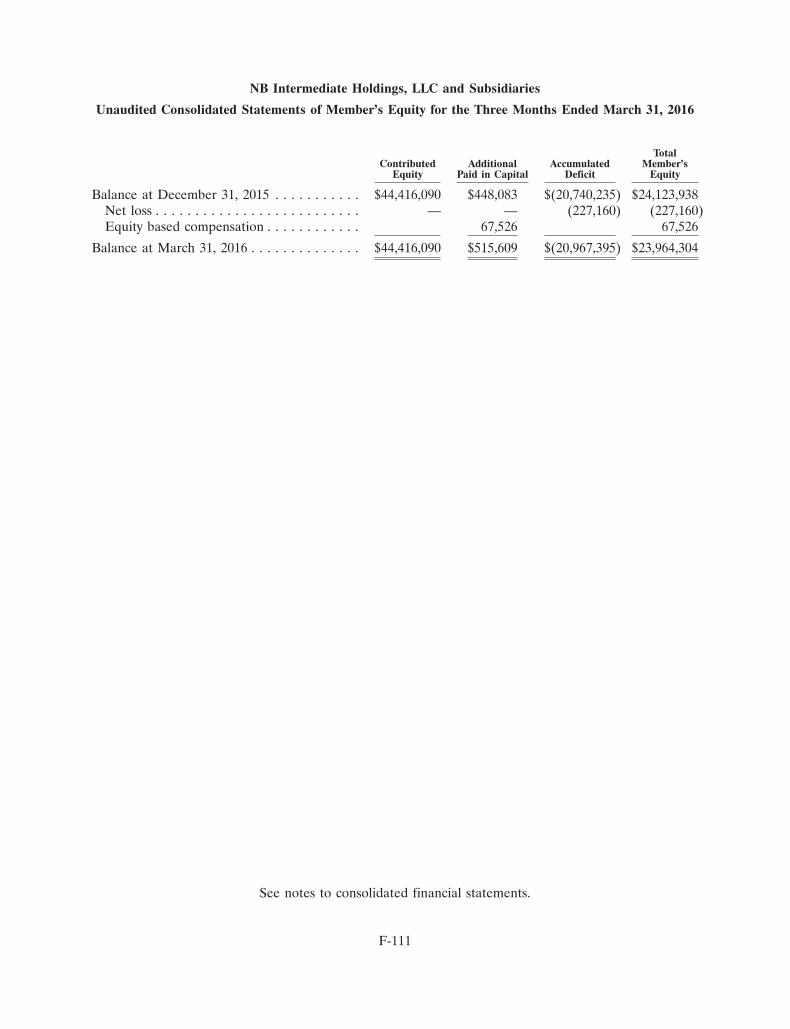
NB Intermediate Holdings, LLC and Subsidiaries
Unaudited Consolidated Statements of Member’s Equity for the Three Months Ended March 31, 2016
TotalContributed Additional Accumulated Member’s
Equity Paid in Capital Deficit Equity
Balance at December 31, 2015 . . . . . . . . . . . $44,416,090 $448,083 $(20,740,235) $24,123,938Net loss . . . . . . . . . . . . . . . . . . . . . . . . . . — — (227,160) (227,160)Equity based compensation . . . . . . . . . . . . 67,526 67,526
Balance at March 31, 2016 . . . . . . . . . . . . . . $44,416,090 $515,609 $(20,967,395) $23,964,304
See notes to consolidated financial statements.
F-111
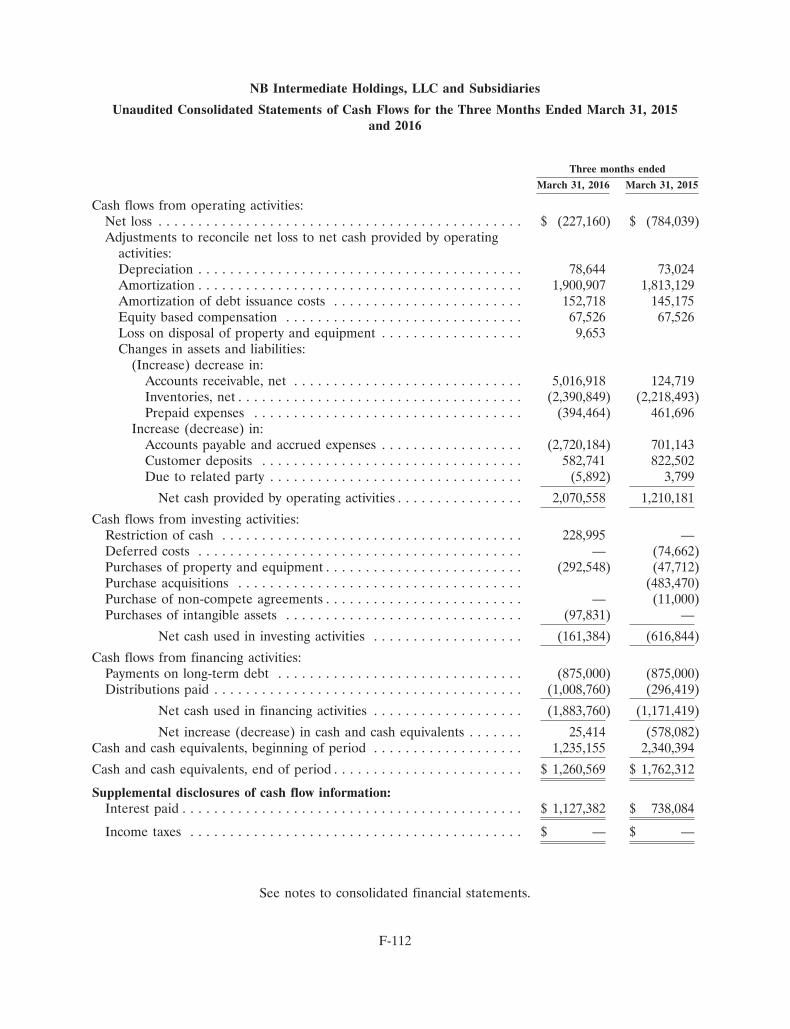
NB Intermediate Holdings, LLC and Subsidiaries
Unaudited Consolidated Statements of Cash Flows for the Three Months Ended March 31, 2015and 2016
Three months ended
March 31, 2016 March 31, 2015
Cash flows from operating activities:Net loss . . . . . . . . . . . . . . . . . . . . . . . . . . . . . . . . . . . . . . . . . . . . . . $ (227,160) $ (784,039)Adjustments to reconcile net loss to net cash provided by operating
activities:Depreciation . . . . . . . . . . . . . . . . . . . . . . . . . . . . . . . . . . . . . . . . . 78,644 73,024Amortization . . . . . . . . . . . . . . . . . . . . . . . . . . . . . . . . . . . . . . . . . 1,900,907 1,813,129Amortization of debt issuance costs . . . . . . . . . . . . . . . . . . . . . . . . 152,718 145,175Equity based compensation . . . . . . . . . . . . . . . . . . . . . . . . . . . . . . 67,526 67,526Loss on disposal of property and equipment . . . . . . . . . . . . . . . . . . 9,653Changes in assets and liabilities:
(Increase) decrease in:Accounts receivable, net . . . . . . . . . . . . . . . . . . . . . . . . . . . . . 5,016,918 124,719Inventories, net . . . . . . . . . . . . . . . . . . . . . . . . . . . . . . . . . . . . (2,390,849) (2,218,493)Prepaid expenses . . . . . . . . . . . . . . . . . . . . . . . . . . . . . . . . . . (394,464) 461,696
Increase (decrease) in:Accounts payable and accrued expenses . . . . . . . . . . . . . . . . . . (2,720,184) 701,143Customer deposits . . . . . . . . . . . . . . . . . . . . . . . . . . . . . . . . . 582,741 822,502Due to related party . . . . . . . . . . . . . . . . . . . . . . . . . . . . . . . . (5,892) 3,799
Net cash provided by operating activities . . . . . . . . . . . . . . . . 2,070,558 1,210,181
Cash flows from investing activities:Restriction of cash . . . . . . . . . . . . . . . . . . . . . . . . . . . . . . . . . . . . . . 228,995 —Deferred costs . . . . . . . . . . . . . . . . . . . . . . . . . . . . . . . . . . . . . . . . . — (74,662)Purchases of property and equipment . . . . . . . . . . . . . . . . . . . . . . . . . (292,548) (47,712)Purchase acquisitions . . . . . . . . . . . . . . . . . . . . . . . . . . . . . . . . . . . . (483,470)Purchase of non-compete agreements . . . . . . . . . . . . . . . . . . . . . . . . . — (11,000)Purchases of intangible assets . . . . . . . . . . . . . . . . . . . . . . . . . . . . . . (97,831) —
Net cash used in investing activities . . . . . . . . . . . . . . . . . . . (161,384) (616,844)
Cash flows from financing activities:Payments on long-term debt . . . . . . . . . . . . . . . . . . . . . . . . . . . . . . . (875,000) (875,000)Distributions paid . . . . . . . . . . . . . . . . . . . . . . . . . . . . . . . . . . . . . . . (1,008,760) (296,419)
Net cash used in financing activities . . . . . . . . . . . . . . . . . . . (1,883,760) (1,171,419)
Net increase (decrease) in cash and cash equivalents . . . . . . . 25,414 (578,082)Cash and cash equivalents, beginning of period . . . . . . . . . . . . . . . . . . . 1,235,155 2,340,394
Cash and cash equivalents, end of period . . . . . . . . . . . . . . . . . . . . . . . . $ 1,260,569 $ 1,762,312
Supplemental disclosures of cash flow information:Interest paid . . . . . . . . . . . . . . . . . . . . . . . . . . . . . . . . . . . . . . . . . . . $ 1,127,382 $ 738,084
Income taxes . . . . . . . . . . . . . . . . . . . . . . . . . . . . . . . . . . . . . . . . . . $ — $ —
See notes to consolidated financial statements.
F-112
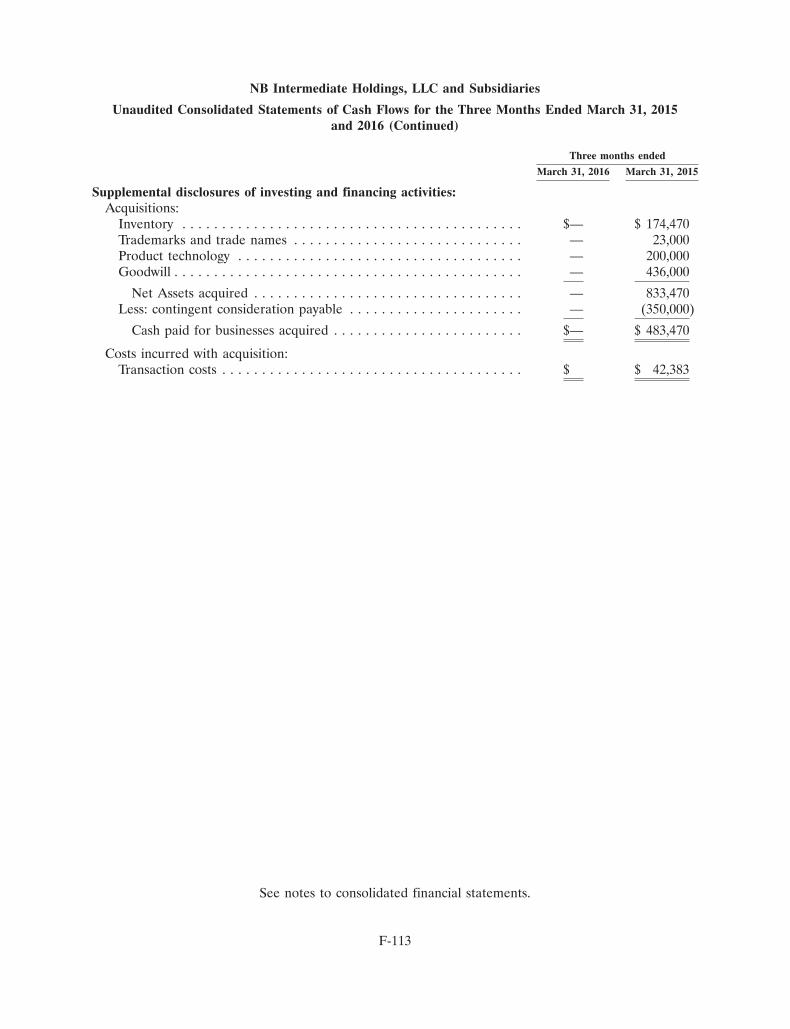
NB Intermediate Holdings, LLC and Subsidiaries
Unaudited Consolidated Statements of Cash Flows for the Three Months Ended March 31, 2015and 2016 (Continued)
Three months ended
March 31, 2016 March 31, 2015
Supplemental disclosures of investing and financing activities:Acquisitions:
Inventory . . . . . . . . . . . . . . . . . . . . . . . . . . . . . . . . . . . . . . . . . . . $— $ 174,470Trademarks and trade names . . . . . . . . . . . . . . . . . . . . . . . . . . . . . — 23,000Product technology . . . . . . . . . . . . . . . . . . . . . . . . . . . . . . . . . . . . — 200,000Goodwill . . . . . . . . . . . . . . . . . . . . . . . . . . . . . . . . . . . . . . . . . . . . — 436,000
Net Assets acquired . . . . . . . . . . . . . . . . . . . . . . . . . . . . . . . . . . — 833,470Less: contingent consideration payable . . . . . . . . . . . . . . . . . . . . . . — (350,000)
Cash paid for businesses acquired . . . . . . . . . . . . . . . . . . . . . . . . $— $ 483,470
Costs incurred with acquisition:Transaction costs . . . . . . . . . . . . . . . . . . . . . . . . . . . . . . . . . . . . . . $ $ 42,383
See notes to consolidated financial statements.
F-113

NB Intermediate Holdings, LLC and Subsidiaries
Notes to Unaudited Consolidated Financial Statements
1. Nature of Operations and Basis of Presentation
NB Intermediate Holdings, LLC (‘‘NB Intermediate’’) is a wholly owned subsidiary of NBFiltration Holdings, LLC. (the ‘‘Parent’’). NB Intermediate, a Delaware Limited Liability Company, isthe sole owner of Neptune-Benson, LLC (‘‘Neptune-Benson’’). Neptune-Benson is the sole owner ofEngineered Treatment Systems, LLC (‘‘ETS’’) and 3287920 Nova Scotia Limited (‘‘Nova Scotia’’). NovaScotia is the sole owner of Sonitec-Vortisand Technologies ULC (‘‘Sonitec’’). The consolidated financialstatements include the accounts of NB Intermediate, Neptune-Benson, ETS, Nova Scotia and Sonitec(together, the ‘‘Company’’). The Parent, NB Intermediate and Neptune-Benson were established priorto July 7, 2011 for the purpose of acquiring all assets and assuming certain liabilities ofNeptune-Benson, Inc. On September 11, 2012, Neptune-Benson acquired the assets and assumedcertain liabilities of ETS. On December 6, 2013, Neptune-Benson acquired certain assets of BRI MetalWorks, Inc. (‘‘BRI’’). Nova Scotia was established on April 9, 2015, for the purpose of acquiring thestock of Sonitec-Vortisand Technologies ULC. On January 14, 2015, Neptune-Benson acquired certainassets of ProFlo, Inc. (‘‘ProFlo’’).
Neptune-Benson is principally engaged in the design and manufacture of aquatic filtration andrecirculation systems, and is headquartered in Coventry, Rhode Island. The Company sells its productsto swimming pool and aquatic recreational facilities, aquariums, zoos and water parks throughout theworld. The Company generally sells to contractors building or renovating these facilities. ETS isprincipally engaged in the design and manufacture of UV Systems for the commercial aquatics industryand for the industrial and municipal markets. ETS’s manufacturing facility is located in Beaver Dam,Wisconsin. Sonitec is principally engaged in the design and sale of micro-sand filters in the industrialsector. Sonitec’s facility is located in Montreal, Canada. Manufacturing for Sonitec filters is performedout of Coventry, Rhode Island. BRI was principally engaged in the design and manufacture of filtersand was a significant supplier to Neptune-Benson. ProFlo was principally engaged in the design andmanufacture of water strainers.
2. Summary of Significant Accounting Policies
Codification
The accompanying consolidated financial statements have been prepared in accordance withaccounting standards set by the Financial Accounting Standards Board (‘‘FASB’’). The FASB setsgenerally accepted accounting principles (‘‘GAAP’’) that the Company follows to ensure its financialcondition, results of operations, and cash flows are consistently reported. References to GAAP issuedby the FASB in these notes to the consolidated financial statements are to the FASB AccountingStandards Codification (‘‘ASC’’).
Principles of Consolidation
The consolidated financial statements include the accounts of the Company and its wholly-ownedsubsidiaries. All significant intercompany accounts and transactions have been eliminated inconsolidation.
Cash and Cash Equivalents
The Company considers all highly liquid investments with original maturity dates of three monthsor less when purchased, to be cash equivalents.
F-114

NB Intermediate Holdings, LLC and Subsidiaries
Notes to Unaudited Consolidated Financial Statements (Continued)
2. Summary of Significant Accounting Policies (Continued)
The Company maintains its cash and cash equivalents in bank deposit accounts, which, at timesmay exceed federally insured limits. The Company has not experienced losses in such accounts. TheCompany believes that it is not exposed to any significant credit risk on cash and cash equivalents.
Restricted Cash
The Company has $30,829 and $40,000 of restricted cash securing corporate credit cards as ofMarch 31, 2016 and December 31, 2015. In addition, as of December 31, 2015, the Company’s bankissued letters of guarantee to certain customers totaling $219,824 to guarantee the Company’sperformance on extended warranty contracts purchased by certain customers. These amounts areclassified as restricted cash on the accompanying consolidated balance sheet as of December 31, 2015.
Accounts Receivable
Accounts receivable are stated at the amount management expects to collect from the outstandingbalance. On a regular basis, the Company reviews the adequacy of its allowance for doubtful accountsbased on historical collection results and current economic conditions using factors based on the agingof its accounts receivable. In addition, the Company estimates specific additional allowances based onindications that a specific customer may be experiencing financial difficulties. When the Companydetermines that an account is uncollectible, it is written off against the allowance for doubtful accounts.Recoveries of amounts receivable previously written off are recorded when received. A receivable isconsidered to be past due if any portion of the receivable balance is outstanding for more than 90 days.
Inventories
Inventories, which include material, labor and overhead, are stated at the lower of cost or market.Cost is determined using the first-in, first-out (‘‘FIFO’’) method. The Company expenses overhead costsrelated to idle capacity in the period the costs are incurred. On a regular basis, the Company reviewsthe adequacy of its provision for excess and obsolete inventory based on historical experience, productknowledge and demand estimates. The Company records, as a charge to cost of goods sold, anyamounts required to reduce the carrying value of its inventory to net realizable value.
Property and Equipment
Property and equipment are stated at cost. Depreciation of property and equipment is recordedusing the straight-line method over the estimated useful lives of the assets. Maintenance and repaircosts are expensed as incurred. Upon sale or retirement, the cost and related accumulated depreciationare removed from the respective accounts and the resulting gain or loss is included in currentoperations.
The estimated useful lives of property and equipment are as follows:
Machinery and equipment . . . . . . . . . . . . . . . . . . . . . . . . . . . . . . . . . . 1 - 5 yearsComputer equipment and software . . . . . . . . . . . . . . . . . . . . . . . . . . . 1 - 5 yearsOffice equipment . . . . . . . . . . . . . . . . . . . . . . . . . . . . . . . . . . . . . . . . 1 - 5 yearsFurniture and fixtures . . . . . . . . . . . . . . . . . . . . . . . . . . . . . . . . . . . . . 1 - 5 yearsMotor vehicle . . . . . . . . . . . . . . . . . . . . . . . . . . . . . . . . . . . . . . . . . . . 5 years
F-115
NB Intermediate Holdings, LLC and Subsidiaries
Notes to Unaudited Consolidated Financial Statements (Continued)
2. Summary of Significant Accounting Policies (Continued)
Software Development Costs
Costs for software developed for internal use are accounted for in accordance with ASC 350,Intangibles—Goodwill and Other—Internal-Use Software. ASC 350 requires the capitalization of certaincosts incurred in connection with developing or obtaining internal-use software. In accordance withASC 350, the Company expenses costs incurred in the preliminary project stage of developing oracquiring internal use software, such as research and feasibility studies, as well as costs incurred in thepost-implementation/operational stage, such as maintenance and training. Capitalization of softwaredevelopment costs occurs only after the preliminary project stage is complete, management authorizesthe project, and it is probable that the project will be completed and the software will be used for thefunction intended. Costs associated with the purchase and development of computer software arecapitalized and amortized on a straight-line basis over the estimated useful life of the related asset onceplaced in service. Software development costs totaling $695,625 are recorded in deferred costs as ofMarch 31, 2016 and December 31, 2015 and have not yet been placed in service. The capitalized costsinclude software license fees and contractor development and implementation costs. The softwaredevelopment project was put on hold by management late in 2015 and is expected to be continued inearly 2016.
Impairment of Long-Lived Assets
The Company accounts for impairment of long-lived assets in accordance with ASC 360—Property,Plant and Equipment. ASC 360 requires that long-lived assets, including definite-lived intangibles, bereviewed for impairment whenever events or changes in circumstances indicate that the book value ofthe asset may not be recoverable. The Company evaluates whether events and circumstances haveoccurred that indicate possible impairment.
An asset is considered impaired if the net book value of the asset exceeds the future projectedundiscounted cash flows anticipated to be generated by the asset. The impairment is then measured asthe excess of the net book value of the asset over its estimated fair value. For the quarters endedMarch 31, 2016 and 2015, no impairment charge was required.
Debt Issuance Costs
Debt issuance costs consist of capitalized professional fees, bank fees and other costs associatedwith the securing of bank financing. These costs represent a debt discount and reduce the carryingvalue of the related debt. The costs are being amortized using the effective interest method over theterms of the respective debt agreements.
Amortization expense for the quarters ended March 31, 2016 and 2015 was $152,718 and $145,175,respectively, and is included in interest expense in the accompanying consolidated statements ofoperations.
Goodwill and Intangible Assets
The Company accounts for business combinations pursuant to ASC 805, Business Combinations.Goodwill in such acquisitions represents the excess of the cost of a business acquired over the fairvalue of the net assets acquired, including identifiable intangible assets, and liabilities assumed.ASC 805 specifies criteria to be used in determining whether intangible assets acquired in a business
F-116

NB Intermediate Holdings, LLC and Subsidiaries
Notes to Unaudited Consolidated Financial Statements (Continued)
2. Summary of Significant Accounting Policies (Continued)
combination must be recognized and reported separately from goodwill. Amounts assigned to goodwilland other identifiable intangible assets were determined with the assistance of an independentappraiser using a market approach and a discounted cash flow analysis.
Under FASB ASC 350, Intangibles—Goodwill and Other, intangible assets with indefinite lives arereviewed annually for impairment. The review for impairment consists of a comparison of the fair valueof the asset with its carrying amount. Fair value is an estimate of the price a willing buyer would payfor the intangible asset and is generally estimated by discounting the expected future cash flowsassociated with the intangible asset.
In accordance with the related guidance, the Company, with the assistance of independentvaluation experts, conducts an impairment evaluation for goodwill at least annually, or more frequently,if events or changes in circumstances indicate that an asset might be impaired. The evaluation isperformed using a two-step process. The first step (defined as ‘‘Step 1’’) compares the book value ofthe Company’s reporting unit to its estimated fair value. The second step (defined as ‘‘Step 2’’) of thegoodwill impairment test, which is only required when the net book value of the reporting unit exceedsthe fair value, compares the implied fair value of goodwill to its book value to determine if animpairment is required. The Company estimates the fair value of its reporting units using the incomeand market approaches which measure the value of an intangible asset based on the expected stream ofmonetary benefits attributable to it over its remaining useful life, and market appraisal. The Companyhas two reporting units and performs its annual step 1 analysis in the fourth quarter.
The Company provides for amortization of intangible assets with definite lives using straight-linemethods over their estimated useful lives. The amortization periods of the intangible assets are asfollows:
Trademarks and trade names . . . . . . . . . . . . . . . . . . . . . . . . . . . . . . . . . 10 yearsDeveloped technology . . . . . . . . . . . . . . . . . . . . . . . . . . . . . . . . . . . . . . 9 yearsBacklog . . . . . . . . . . . . . . . . . . . . . . . . . . . . . . . . . . . . . . . . . . . . . . . . . <1 yearNon-compete agreements . . . . . . . . . . . . . . . . . . . . . . . . . . . . . . . . . . . . 5 yearsCustomer relationships . . . . . . . . . . . . . . . . . . . . . . . . . . . . . . . . . . . . . . 9 yearsPatents . . . . . . . . . . . . . . . . . . . . . . . . . . . . . . . . . . . . . . . . . . . . . . . . . 9 yearsSoftware development costs . . . . . . . . . . . . . . . . . . . . . . . . . . . . . . . . . . 3 years
Revenue Recognition
Revenue from product sales is recorded, net of sales tax, at the time of shipment, provided thatpersuasive evidence of an arrangement exists, the seller’s price to the buyer is fixed or determinableand collectability is reasonably assured. Shipping and handling fees charged to customers arerecognized at the time the products are shipped and are included in net sales. The related shipping andhandling costs are included in cost of goods sold on the accompanying consolidated statements ofoperations.
The company follows the guidance of Accounting Standards Codification (‘‘ASC’’) Subtopic 605-25,Multi-Deliverable Revenue Arrangements (ASC 605-25). Agreements containing multiple elements aredivided into separate units of accounting if certain criteria are met, including whether the deliveredelement has a stand-alone value to the customer. The consideration received is then allocated amongthe separate units based on the hierarchy discussed below. For those deliverables that qualify as
F-117

NB Intermediate Holdings, LLC and Subsidiaries
Notes to Unaudited Consolidated Financial Statements (Continued)
2. Summary of Significant Accounting Policies (Continued)
separate units of accounting, the Company must assign value based on each deliverable’s vendor-specific objective evidence (‘‘VSOE’’) of the value, if applicable, third-party evidence (‘‘TPE’’) of itsvalue if VSOE is not available, or estimated selling price (‘‘ESP’’) if neither VSOE or TPE is available.Arrangement consideration is then allocated to all deliverables using the relative selling price method.
Concentration of Credit Risk and Major Customers
For the quarter ended March 31, 2016 the Company had one customer (Neuman Pools, Inc., arelated party, see Note 11) that accounted for 12.5% of sales. As of March 31, 2016, the samecustomer accounted for 11% of the accounts receivable balance. No other customers exceed 10% ofsales for the quarter ended March 31, 2015 or exceeded 10% of the accounts receivable balance as ofDecember 31, 2015.
Fair Value Measurements
The Company follows current accounting standards for fair value measurements, which define fairvalue as ‘‘the price that would be received to sell an asset or paid to transfer a liability in an orderlytransaction between market participants at the measurement date’’, and establish a fair value hierarchythat requires an entity to maximize the use of observable inputs and minimize the use of unobservableinputs when measuring fair value. A financial instrument’s categorization within the fair value hierarchyis based upon the lowest level of input that is significant to the fair value measurement. There arethree levels of inputs that may be used to measure fair value.
Level 1—Applies to assets or liabilities for which there are quoted prices in active markets foridentical assets or liabilities.
Level 2—Applies to assets or liabilities for which there are inputs, other than quoted pricesincluded within Level 1, that are observable for the asset or liability such as quotedprices for similar assets or liabilities in active markets; quoted prices for identical assetsor liabilities in markets with insufficient volume or infrequent transactions (less activemarkets); or model-derived valuations in which significant inputs are observable or canbe derived principally from, or corroborated by, observable market data.
Level 3—Applies to assets or liabilities for which there are unobservable inputs to the valuationmethodology that are significant to the measurement of the fair value of the assets orliabilities.
Use of Estimates
The preparation of consolidated financial statements in conformity with accounting principlesgenerally accepted in the United States of America requires management to make estimates andassumptions that affect the reported amounts of assets and liabilities and disclosure of contingent assetsand liabilities at the date of the financial statements and the reported amount of revenues and expensesduring the reporting period. Actual results could differ from those estimates. Significant estimatesincluded in the consolidated financial statements include allowance for doubtful accounts, excess andobsolete inventory, warranty reserves, equity based compensation, contingent consideration and theestimated values and lives of long-lived assets, including goodwill and intangible assets.
F-118
NB Intermediate Holdings, LLC and Subsidiaries
Notes to Unaudited Consolidated Financial Statements (Continued)
2. Summary of Significant Accounting Policies (Continued)
Product Warranties
Most of the Company’s products carry a product warranty, which generally provides customers theright to return defective product during the specified warranty period, for repair or replacement at nocost to the customer. Based upon a specific issue identified during 2013, with respect to certain gratessold through June 2013, the Company recorded a warranty reserve. Management has determined therewas no requirement for a warranty reserve on other products. Following is a schedule of warrantyreserve activity:
March 31, December 31,2016 2015
Warranty reserve, beginning balance . . . . . . . . . . . . . . . . . . $204,570 $239,845Warranty costs . . . . . . . . . . . . . . . . . . . . . . . . . . . . . . . . . . —Warranty claims . . . . . . . . . . . . . . . . . . . . . . . . . . . . . . . . . — (35,275)
Warranty reserve, ending balance . . . . . . . . . . . . . . . . . . . . $204,570 $204,570
Financial Instruments
The carrying amount of cash and cash equivalents, accounts receivable, accounts payable, accruedexpenses and customer deposits approximate fair value due to the short term nature of theseinstruments. The carrying amount of the long-term debt is reported net of unamortized debt issuancecosts totaling $519,952 at March 31, 2016. The face value of the senior debt and revolving line of creditapproximates fair value as the related interest rates approximate the Company’s incremental borrowingrate for similar obligations. The face value of the related debt instruments are presented in Note 7. Inaddition, the senior and revolving debt are at variable rates. The following table summarizes theestimated fair values of the Company’s other financial instruments at March 31, 2016 andDecember 31, 2015:
Fair Value at Fair Value atMarch 31, December 31,
2016 2015
Senior debt and revolving loan . . . . . . . . . . . . . . . . . . . $63,875,000 $64,750,000
Equity Based Compensation
The Company accounts for equity-based awards to employees using the fair value method asprescribed by U.S. GAAP. Accordingly, compensation expense is recorded for the fair value of equityawards issued to employees measured at the date of grant, over the requisite service period.
Compensation costs for unit awards issued to employees and expected to vest, are recognized overthe vesting period based on the grant date fair value of the unit awards. For time based awards,compensation cost is recognized on a straight-line basis over the vesting period. The grant date hasbeen considered the measurement date for all awards granted.
The fair value of each grant is estimated on the date of the grant based on a valuation of theequity interests issued, which is performed by a third party valuation specialist.
F-119

NB Intermediate Holdings, LLC and Subsidiaries
Notes to Unaudited Consolidated Financial Statements (Continued)
2. Summary of Significant Accounting Policies (Continued)
Income Taxes
The Company is a Limited Liability Company which has elected to be taxed as a partnership. TheCompany is not liable for any income taxes. The members of the Company’s parent will pay incometaxes on their respective share of the Company’s income. The Company will declare and paydistributions calculated at the highest tax rate of the members on the income earned and reported bythe Company on its tax returns. Such amounts will be recognized as a distribution in the period inwhich the income is earned. The Company did not declare distributions for the quarters endedMarch 31, 2016 and 2015.
The Company follows FASB ASC 740, Accounting for Uncertainty in Income Taxes (‘‘ASC 740’’).ASC 740 provides guidance for how uncertain tax positions should be recognized, measured, presentedand disclosed in the financial statements. ASC 740 also requires the evaluation of tax positions taken orexpected to be taken in the course of preparing the Company’s tax returns to determine whether thetax positions are more-likely-than-not of being sustained by the applicable tax authority. Tax positionsnot deemed to meet a more-likely-than-not threshold would be recorded as a tax expense in the currentyear.
The Company files tax returns in the federal and various state jurisdictions. Management hasreviewed the Company’s tax positions for the open tax years 2012 - 2016 and has determined that noprovision for uncertain tax positions is required in the Company’s consolidated financial statements.Penalties and interest, if any, would be recorded in income tax expense.
Foreign Currency Translation
The Company accounts for activity with its Sonitec subsidiary in accordance with ASC 830, ForeignCurrency Matters. The Company determined that the functional currency of the Sonitec subsidiary is theUnited States Dollar.
Accordingly, all monetary assets and liabilities of the Sonitec subsidiary are remeasured into U.S.dollars at exchange rates in effect as of the balance sheet date, and nonmonetary assets and liabilitiesare translated at historical exchange rates. Results of operations are remeasured at the averageexchange rates for the period.
The transaction losses for the quarters ended March 31, 2016 and 2015 were $32,791 and $0,respectively, and are recorded in other income (expense), net, in the consolidated statements of net lossfor the quarters then ended.
Recent Accounting Policies
On August 12, 2015, the FASB issued Accounting Standards Update (ASU) 2015-14, Revenuefrom Contracts with Customers (Topic 606): Deferral of the Effective Date. This ASU: (a) defers theeffective date of ASU 2014-09, Revenue from Contracts with Customers (Topic 606), by one year forboth public and nonpublic entities and (b) allows early adoption of the ASU by all entities as of theoriginal effective date for public entities. ASU 2014-09, Revenue from Contracts with Customers(Topic 606), will require an entity to recognize the amount of revenue to which it expects to be entitledfor the transfer of promised goods or services to customers. The updated standard will replace mostexisting revenue recognition guidance in U.S. GAAP when it becomes effective for annual reporting
F-120

NB Intermediate Holdings, LLC and Subsidiaries
Notes to Unaudited Consolidated Financial Statements (Continued)
2. Summary of Significant Accounting Policies (Continued)
periods beginning after December 15, 2018. The Company is currently assessing the impact adoption ofthis guidance will have on its consolidated financial statements.
The FASB issued Accounting Standards Update (ASU) 2015-03, Interest—Imputation of Interest(Subtopic 835-30): Simplifying the Presentation of Debt Issuance Cost. This ASU requires that debtissuance costs related to a recognized debt liability be presented in the balance sheet as a directdeduction from the carrying amount of that debt liability, consistent with debt discounts. Therecognition and measurement guidance for debt issuance costs is not affected by the new guidance.This standard was implemented as of December 31, 2015.
In February 2016, the FASB issued ASU No. 2016-02, Leases (Topic 842). ASU No. 2016-02requires recognition of operating leases as lease assets and liabilities on the balance sheet, anddisclosure of key information about leasing arrangements. ASU No. 2016-02 will be effectiveretrospectively for the Company for the quarter ending December 31, 2019, with early adoptionpermitted. The Company is currently assessing the impact adoption of this guidance will have on itsconsolidated financial statements.
3. Business Combinations
Sonitec Acquisition
On April 9, 2015, Neptune-Benson acquired all of the stock of Sonitec-Vortisand TechnologiesULC and non-compete agreements with the seller, for a total consideration of $2,727,957, including aworking capital settlement of $102,673, paid in January 2016. Of the total consideration, $2,637,957 wasallocated to the purchase and $90,000 was allocated to the non-compete agreements. Of theconsideration transferred, $2,334,284 was paid in cash to the sellers and a contingent earn out with anestimated fair market value of $291,000 was incurred. The contingent consideration requires theCompany to make additional payments to the sellers, based on the performance of the business. Thecontingent payment is based on the value of purchase orders received for the year endingDecember 31, 2016 and was calculated by the Company’s third party valuation specialist based on aprobability weighting of likely outcomes.
Assets acquired and liabilities assumed in connection with the acquisition have been recorded attheir fair values. The excess of the acquisition price over the fair value of the assets acquired andliabilities assumed was recorded as goodwill. All of the goodwill is deductible by the Parent Company’smembers for tax purposes. For the year ending December 31, 2015, the Company incurred $483,654 in
F-121
NB Intermediate Holdings, LLC and Subsidiaries
Notes to Unaudited Consolidated Financial Statements (Continued)
3. Business Combinations (Continued)
acquisition related expenses. The following summarizes the estimated fair value of the assets acquiredand liabilities assumed by the Company in accordance with the acquisition method of accounting:
Accounts receivable . . . . . . . . . . . . . . . . . . . . . . . . . . . . . . . . . . . . . . . $ 328,901Inventory . . . . . . . . . . . . . . . . . . . . . . . . . . . . . . . . . . . . . . . . . . . . . . 308,560Prepaid expenses and other current assets . . . . . . . . . . . . . . . . . . . . . . 85,820Property and equipment . . . . . . . . . . . . . . . . . . . . . . . . . . . . . . . . . . . 85,928Tradename . . . . . . . . . . . . . . . . . . . . . . . . . . . . . . . . . . . . . . . . . . . . . 220,000Product technology . . . . . . . . . . . . . . . . . . . . . . . . . . . . . . . . . . . . . . . 760,000Customer relationships . . . . . . . . . . . . . . . . . . . . . . . . . . . . . . . . . . . . 1,500,000Backlog . . . . . . . . . . . . . . . . . . . . . . . . . . . . . . . . . . . . . . . . . . . . . . . 60,000Goodwill . . . . . . . . . . . . . . . . . . . . . . . . . . . . . . . . . . . . . . . . . . . . . . 551,471Accounts payable and accrued expenses . . . . . . . . . . . . . . . . . . . . . . . . (473,543)Customer deposits . . . . . . . . . . . . . . . . . . . . . . . . . . . . . . . . . . . . . . . . (150,070)Short-term debt . . . . . . . . . . . . . . . . . . . . . . . . . . . . . . . . . . . . . . . . . (323,110)Sonitec former stockholder advances . . . . . . . . . . . . . . . . . . . . . . . . . . (316,000)
Net assets acquired . . . . . . . . . . . . . . . . . . . . . . . . . . . . . . . . . . . . . $2,637,957
Fair market value of net assets acquired:
Total fair market value of net assets acquired . . . . . . . . . . . . . . . . . . . . $2,637,957Less: contingent consideration . . . . . . . . . . . . . . . . . . . . . . . . . . . . . . . (291,000)Less: working capital settlement payable . . . . . . . . . . . . . . . . . . . . . . . . (102,673)
Cash paid for net assets acquired . . . . . . . . . . . . . . . . . . . . . . . . . . . $2,244,284
The purpose of the transaction was to expand and diversify the Company’s customer base toinclude industrial and municipal markets and to add complimentary products and services. Goodwillrecorded in the transaction reflects the synergistic value of the customer base and product lines of thecompanies acquired and the Company’s ability to leverage the existing and newly acquired resources toexpand sales and profitability. The costs of the non-compete agreements are amortized over the life ofthe agreements.
The contractual gross receipts acquired were $364,723. Management anticipates recovery of thesereceipts of $328,901.
ProFlo, Inc. Acquisition
On January 14, 2015, Neptune-Benson acquired certain assets of ProFlo, Inc., for a totalconsideration of $844,470. Of the total consideration, $833,470 was allocated to the purchase and$11,000 was allocated to the non-compete agreements. Of the consideration transferred, $494,470 waspaid in cash to the sellers and a contingent earn out with an estimated fair market value of $350,000was incurred. The contingent consideration requires the Company to make additional payments to thesellers, based on the performance of the business. The contingent consideration was calculated by theCompany’s third party valuation specialist based on a probability weighting of potential outcomesdiscounted for the inherent risk and time value of money. Assets acquired in connection with the
F-122

NB Intermediate Holdings, LLC and Subsidiaries
Notes to Unaudited Consolidated Financial Statements (Continued)
3. Business Combinations (Continued)
acquisition have been recorded at their fair values. For the year ending December 31, 2015, theCompany incurred $43,753 in acquisition related expenses.
The following summarizes the estimated fair value of the assets acquired by the Company inaccordance with the acquisition method of accounting:
Inventory . . . . . . . . . . . . . . . . . . . . . . . . . . . . . . . . . . . . . . . . . . . . . . . $174,470Tradename . . . . . . . . . . . . . . . . . . . . . . . . . . . . . . . . . . . . . . . . . . . . . . 23,000Product technology . . . . . . . . . . . . . . . . . . . . . . . . . . . . . . . . . . . . . . . . 200,000Goodwill . . . . . . . . . . . . . . . . . . . . . . . . . . . . . . . . . . . . . . . . . . . . . . . . 436,000
Total assets acquired . . . . . . . . . . . . . . . . . . . . . . . . . . . . . . . . . . . . . . . $833,470
Fair market value of net assets acquired:
Total fair market value of net assets acquired . . . . . . . . . . . . . . . . . . . . . $ 833,470Less: contingent consideration . . . . . . . . . . . . . . . . . . . . . . . . . . . . . . . . (350,000)
Cash paid for net assets acquired . . . . . . . . . . . . . . . . . . . . . . . . . . . . . $ 483,470
The purpose of the transaction was to acquire a key product from a supplier to the Company andbenefit from improved margins and the ability to accelerate the delivery of completed products.
4. Inventories
Inventories consisted of the following:
March 31, December 31,2016 2015
Finished goods . . . . . . . . . . . . . . . . . . . . . . . . . . . . . . . $ 5,676,944 $ 4,630,776WIP . . . . . . . . . . . . . . . . . . . . . . . . . . . . . . . . . . . . . . . 3,328,091 2,714,778Raw materials . . . . . . . . . . . . . . . . . . . . . . . . . . . . . . . 3,968,710 3,237,342
$12,973,745 $10,582,896
F-123

NB Intermediate Holdings, LLC and Subsidiaries
Notes to Unaudited Consolidated Financial Statements (Continued)
5. Property and Equipment
Property and equipment consisted of the following:
March 31, December 31,2016 2015
Machinery and equipment . . . . . . . . . . . . . . . . . . . . . . . . $1,510,668 $1,284,666Computer equipment . . . . . . . . . . . . . . . . . . . . . . . . . . . . 291,029 229,859Office equipment . . . . . . . . . . . . . . . . . . . . . . . . . . . . . . 184,702 183,250Furniture and fixtures . . . . . . . . . . . . . . . . . . . . . . . . . . . 269,391 269,391Leasehold improvements . . . . . . . . . . . . . . . . . . . . . . . . . 101,507 97,583Motor vehicles . . . . . . . . . . . . . . . . . . . . . . . . . . . . . . . . 104,832 104,832
2,462,129 2,169,581Less—accumulated depreciation . . . . . . . . . . . . . . . . . . . . (914,367) (826,070)
$1,547,762 $1,343,511
Total depreciation expense for the quarter ended March 31, 2016 and 2015 was $78,644 and$73,024, respectively.
6. Intangible Assets
Intangible assets consisted of the following:
March 31, 2016
Accumulated Net BookCost Amortization Value
Definite lived intangible assets:Trademarks and trade names . . . . . . . . . . $16,543,000 $ (6,996,268) $ 9,546,732Developed Technology . . . . . . . . . . . . . . 9,960,000 (5,099,935) 4,860,065Backlog . . . . . . . . . . . . . . . . . . . . . . . . . 1,620,000 (1,618,750) 1,250Non-compete agreements . . . . . . . . . . . . 1,451,000 (1,126,258) 324,742Customer relationships . . . . . . . . . . . . . . 39,373,000 (19,543,745) 19,829,255Patents . . . . . . . . . . . . . . . . . . . . . . . . . . 293,204 — 293,204
$69,240,204 $(34,384,956) $34,855,248
December 31, 2015
Accumulated Net BookCost Amortization Value
Definite lived intangible assets:Trademarks and trade names . . . . . . . . . . $16,543,000 $ (6,582,693) $ 9,960,307Developed Technology . . . . . . . . . . . . . . 9,960,000 (4,805,014) 5,154,986Backlog . . . . . . . . . . . . . . . . . . . . . . . . . 1,620,000 (1,603,750) 16,250Non-compete agreements . . . . . . . . . . . . 1,451,000 (1,053,708) 397,292Customer relationships . . . . . . . . . . . . . . 39,373,000 (18,438,884) 20,934,116Patents . . . . . . . . . . . . . . . . . . . . . . . . . . 195,373 — 195,373
$69,142,373 $(32,484,049) $36,658,324
F-124
NB Intermediate Holdings, LLC and Subsidiaries
Notes to Unaudited Consolidated Financial Statements (Continued)
6. Intangible Assets (Continued)
Amortization expense totaled $1,900,907 and $1,813,129 for the quarters ended March 31, 2016and 2015, respectively.
7. Long-Term Debt
On September 11, 2012, the Company entered into a new credit facility with GE Capital (‘‘GE’’),which provided a Senior Debt term loan of $47,000,000 and a revolving line of credit of $8,000,000.The Senior Debt term loan was used to repay the Senior Debt term loan provided by Maranon andfinance the acquisition of Engineered Treatment Systems, LLC. The Company also amended andrestated the Mezzanine Debt agreement to increase loan availability to $22,000,000. Substantially all ofthe Company’s assets are pledged as collateral under these debt agreements with the senior debt havingpriority over the mezzanine debt. On May 9, 2014, the Company amended and restated their creditfacility with GE to increase the senior debt to an aggregate principle amount of $66,475,000. Theproceeds of the additional senior debt were used to repay the mezzanine debt of $22,000,000 plusaccrued interest on the same date. On April 9, 2015, the Company amended and restated their creditfacility with GE to increase the senior debt to an aggregate principle amount of $66,475,000. Theadditional proceeds totaling $3,500,000 were used to finance the acquisition of Sonitec-VortisandTechnologies ULC. The debt agreements contain certain covenants, including a fixed charge coverageratio, a leverage ratio, a limit on capital expenditures and EBITDA metrics that must be met on aperiodic basis.
Revolving Line of Credit
The Company has an option to calculate interest, on the revolving line of credit, at either LIBOR,with a floor of 1%, plus a margin of 4.50%, or the Bank’s base rate, plus a margin of 3.25% (6.75%and 7% at March 31, 2016 and December 31, 2015, respectively). The outstanding balance under thisagreement at March 31, 2016 was $900,000. The revolving line of credit expires on January 17, 2017.The line is cross-collateralized with the senior debt.
Senior Debt
On September 11, 2012, the Company entered into a senior debt term loan payable in the amountof $47,000,000 to GE in quarterly principal payments of $587,500, plus interest, until September 30,2016 with a balloon payment totaling $37,600,000 due on January 17, 2017. On May 9, 2014, theCompany amended and restated their credit facility to increase the senior debt term loan to anaggregate principle amount of $66,475,000, with quarterly principal payments of $875,000, plus interest,until September 30, 2016 with a balloon payment totaling $57,725,000 due on January 17, 2017.
On April 9, 2015, the Company amended and restated their credit facility to increase the seniordebt term loan to an aggregate principle amount of $66,475,000, with quarterly principal payments of$875,000, plus interest, until September 30, 2016 with a balloon payment totaling $61,225,000 due onJanuary 17, 2017. The Company has an option to calculate interest at either LIBOR, with a floor of1%, plus a margin of 4.50%, or the Bank’s base rate, plus a margin of 3.25% (6.75% at March 31,2016).
The outstanding balance on the note at March 31, 2016 and December 31, 2015 was $62,975,001and $63,850,000, respectively, and is carried net of unamortized debt issue cost of $519,952 and$672,669, respectively, as of March 31, 2016 and December 31, 2015.
F-125
NB Intermediate Holdings, LLC and Subsidiaries
Notes to Unaudited Consolidated Financial Statements (Continued)
7. Long-Term Debt (Continued)
Long-term debt consisted of the following at March 31, 2016 and December 31, 2015:
March 31, December 31,2016 2015
Senior debt . . . . . . . . . . . . . . . . . . . . . . . . . . . . . . . . . $62,975,001 $63,850,000Less—unamortized debt issuance costs . . . . . . . . . . . . . . (519,952) (672,669)
62,455,049 63,177,331Less—current portion . . . . . . . . . . . . . . . . . . . . . . . . . . (62,455,049) (2,004,073)
Long-term debt, net of current portion . . . . . . . . . . . . . $ — $61,173,258
Aggregate principal maturities of long-term debt at March 31, 2016 and December 31, 2015, are asfollows:
March 31, December 31,2016 2015
Due within one year . . . . . . . . . . . . . . . . . . . . . . . . . . . $62,975,001 $ 2,625,000Due thereafter . . . . . . . . . . . . . . . . . . . . . . . . . . . . . . . — 61,225,000
$62,975,001 $63,850,000
8. Member’s Equity
On July 7, 2011 the Company’s Parent organized the Company under the Delaware LimitedLiability Company Act. The Company shall continue until dissolved and its affairs wound up inaccordance with the Company’s operating agreement. There were no Member contributions during thequarters ended March 31, 2016 and 2015.
Distributions
Distributions (including without limitation, distributions upon liquidation of the Company) may bemade from all cash or property available for distribution and shall be made 100% to the Member. Anydistributions made prior to the liquidation of the Company shall be made at such times and in suchmanner as shall be determined by the Member in its sole discretion. During the quarters endedMarch 31, 2016 and 2015, the Company declared zero distributions to its member.
Equity Based Compensation
The Parent issues P Units to employees of the Company in connection with and as part of itscompensation and incentive arrangements. The Company recognizes compensation expense for P Unitsthat are issued by its Parent in accordance with the Parent’s operating agreement. The Companyrecognizes the costs associated with P Units using the fair value recognition provisions of ASC 718,Compensation—Stock Compensation on a straight-line basis over the vesting period of the awards.
F-126

NB Intermediate Holdings, LLC and Subsidiaries
Notes to Unaudited Consolidated Financial Statements (Continued)
9. Fair Value Measurements
The following table as of both March 31, 2016 and December 31, 2015 presents the Company’sassets and liabilities measured at fair value on a recurring basis.
Fair Value Measurement
Level 1 Level 2 Level 3 Total
Contingent consideration payable . . . . . . . . . $— $— $582,839 $582,839
$— $— $582,839 $582,839
Included in Level 3 liabilities is the contingent consideration payable to the seller of the Sonitecshares in connection with the Company’s acquisition. The obligation was recorded at fair value basedon a weighted probability of the payment amount discounted based on the relative risk of the estimateand the time value of money. The liability is adjusted to fair value at each reporting period. No fairvalue adjustment was made to the liability between the acquisition date and the balance sheet dateaside from payments under the terms of the agreement. The categorization of the framework used toprice the liabilities is considered Level 3, due to the subjective nature of the unobservable inputs usedto determine the fair value.
Level 3 Value Techniques
Financial assets and liabilities are considered Level 3 when the fair values are determined usingpricing models, discounted cash flow methodologies, or similar techniques and at least one significantmodel assumption or input is unobservable. The following table provides a make-up of the Company’sLevel 3 contingent consideration obligations as of both March 31, 2016 and December 31, 2015:
Contingent consideration from Sonitec acquisition . . . . . . . . . . . . . . . . . . $291,000Contingent consideration from ProFlo acquisition . . . . . . . . . . . . . . . . . . 291,839
$582,839
10. Commitments and Contingencies
Operating Lease Commitments
The Company leases several buildings used in the operations of its business, under leases whichexpire through 2020. Rental payments include amounts for operating expenses and taxes in excess ofbase-year values established within the leases.
Future minimum rent payments under operating leases with related parties, as discussed inNote 11, in the aggregate and for the next five years ending December 31, are as follows:
April 1 - December 31, 2016 . . . . . . . . . . . . . . . . . . . . . . . . . . . . . . . . $ 616,1042017 . . . . . . . . . . . . . . . . . . . . . . . . . . . . . . . . . . . . . . . . . . . . . . . . . . 693,7832018 . . . . . . . . . . . . . . . . . . . . . . . . . . . . . . . . . . . . . . . . . . . . . . . . . . 587,0162019 . . . . . . . . . . . . . . . . . . . . . . . . . . . . . . . . . . . . . . . . . . . . . . . . . . 587,0162020 . . . . . . . . . . . . . . . . . . . . . . . . . . . . . . . . . . . . . . . . . . . . . . . . . . 30,762
$2,514,681
F-127

NB Intermediate Holdings, LLC and Subsidiaries
Notes to Unaudited Consolidated Financial Statements (Continued)
10. Commitments and Contingencies (Continued)
Rental expense for the operating leases was $186,497 and $131,747 for the quarters endedMarch 31, 2016 and 2015, respectively.
Other
During 2015, the Company entered into retention bonuses with certain executives that are payableonly upon a sale of the company, as defined. As a result, no amount has been accrued for any futurebonus payout under this plan as of March 31, 2016. The amount of the bonuses varies depending onthe return on investment to the investors, as defined in the agreement.
The Company is involved in a variety of claims and other legal proceedings generally incidental toits normal business activities. While the outcome of any of these proceedings cannot be accuratelypredicted, the Company does not believe the ultimate resolution of any of these existing matters wouldhave a material adverse effect on its financial condition or results of operations.
11. Related Party Transactions
Management Agreement
The Company entered into a management services agreement with the majority investor in theCompany’s parent entity, in July 2011. Under the terms of this agreement the investor is required toprovide management and business services to the Company, including financial, marketing, insurance,executive personnel, corporate development and limited legal services, in exchange for an annual feeequal to the greater of $500,000 or a percentage of EBITDA, as defined, plus out of pocket costs, paidon a quarterly basis. The total cost of these services, for the quarters ended March 31, 2016 and 2015was $221,693 and $199,362, respectively.
Operating Lease
The Company leased manufacturing and office facilities from Gillespie Court LLC, an entitypartially owned by a minority owner and former owner of Neptune-Benson, Inc. The Company leasesmanufacturing and office facilities from Commercial Drive 238, LLC, an entity partially owned byminority owners of NB Filtration Holdings, LLC and former owner of Engineered TreatmentSystems, LLC (‘‘ETS’’). Rent expense and future minimum lease payments under these leases areincluded in Note 10.
Advances
As of March 31, 2016 and December 31, 2015, the Company owed $9,167 to its Parent,NB Filtration Holdings, LLC for various advances, net of reimbursements.
The Company purchases significant amounts of its inventory and supplies from ATG—Willand(‘‘ATG’’), an entity partially owned by minority owners of NB Filtration Holdings, LLC and sellers ofETS. Total purchases from ATG, for the quarters ended March 31, 2016 and 2015 was $423,088 and$438,279, respectively. In addition to inventory and supply purchases, ATG provides support services tothe Company. Expenses related to support services and royalties for the quarter ended March 31, 2016were $45,675 and $10,525, respectively. Expenses related to support services and royalties for thequarter ended March 31, 2015 were $45,405 and zero, respectively. Total accounts payable to ATG was$87,842 and $150,973 at March 31, 2016 and December 31, 2015, respectively.
F-128

NB Intermediate Holdings, LLC and Subsidiaries
Notes to Unaudited Consolidated Financial Statements (Continued)
11. Related Party Transactions (Continued)
The Company also sells products to ATG when ATG is unable to procure material from itssuppliers. Net sales to ATG for the quarters ended March 31, 2016 and December 31, 2015 totaled$1,454 and $2,716 respectively. Total accounts receivable from ATG was $4,874 and $3,420 at March 31,2016 and December 31, 2015, respectively.
The Company sells product to Neuman Pools, Inc. (‘‘Neuman’’), an entity partially owned byminority owners of NB Filtration Holdings, LLC and sellers of ETS. Total sales to Neuman for thequarters ended March 31, 2016 and 2015 were $1,504,992 and $305,951, respectively. Total accountsreceivable from Neuman was $1,554,635 and $1,397,543 at March 31, 2016 and December 31, 2015,respectively.
The Company also shares employee resources with Neuman and reimburses them for certainexpenses incurred. Expenses of zero and $466 were paid to Neuman for the quarters ended March 31,2016 and 2015, respectively.
12. Employee Benefit Plan
Defined Contribution Plan
The Company offers a 401(k) plan to its full time employees who have completed one year ofcontinuous service, including time spent at the acquired companies. Employees may contribute apercentage of their annual compensation to the plan, up to the annual IRS limits. The Company doesnot provide a matching contribution, but, at its sole discretion, does provide a profit sharingcontribution to its employees on an annual basis. The Company’s contribution under this plan, chargedto operations in the quarter ended March 31, 2016 and 2015 was $79,527 and $82,233, respectively.
13. Subsequent Events
The Company has evaluated subsequent events through July 17, 2017, the date the financialstatements were available to be issued. No subsequent events have been identified that requirerecognition or disclosure other than the events described below.
On April 15, 2016, Evoqua Water Technologies acquired 100% of the member’s equity of theCompany for $283.7 million.
F-129

13JUL201714031008
27,777,777 Shares
Evoqua Water Technologies Corp.
Common Stock
Credit SuisseJ.P. Morgan
RBC Capital MarketsCitigroup
Goldman Sachs & Co. LLCMorgan Stanley
BairdRaymond James
StifelWells Fargo Securities
Through and including , 2017 (the 25th day after the date of this prospectus), all dealerseffecting transactions in these securities, whether or not participating in this offering, may be requiredto deliver a prospectus. This is in addition to a dealer’s obligation to deliver a prospectus when actingas an underwriter and with respect to an unsold allotment or subscription.