27 march, 2020 to: annual wage review fair work commission
TRANSCRIPT
1
27 March, 2020
To: Annual Wage Review
Fair Work Commission
11 Exhibition Street
Melbourne VIC 3000
Dear Friends;
On behalf of the Centre for Future Work, I am pleased to make the attached submission to
your annual wage review.
Thank you for the opportunity to present our views, and we would be glad to provide
further information as required.
Sincerely,
Dr. Jim Stanford
Economist and Director, Centre for Future Work
Level 1 Endeavour House, 1 Franklin St, Manuka, ACT 2603
+61 2 6130 0530

2
Contents About the Centre for Future Work ........................................................................................ 3
Summary ................................................................................................................................ 3
The Historic Slowdown in Australian Wage Growth.............................................................. 4
The Growing Importance of the Annual Wage Review in Australian Wage Growth ............ 8
Changing Seasonal Patterns in the WPI ................................................................................. 8
Observed and ‘Underlying’ Wage Growth ........................................................................... 10
‘Backing Out’ the Effect of Annual Wage Adjustments ....................................................... 12
Wage Growth by Pay-Setting Method ................................................................................. 15
The Consequences of a Minimum Wage Freeze ................................................................. 16
Conclusion ............................................................................................................................ 19

3
ABOUT THE CENTRE FOR FUTURE WORK
The Centre for Future Work is a research institute associated with the Australia Institute
(Australia’s leading progressive think tank). We undertake and publish research into a wide
range of labour market, employment, income, and related issues. We are independent and
non-partisan. Please see our website to access any of our reports, at
http://www.futurework.org.au/.
SUMMARY
This submission reviews the historic slowdown in Australian wage growth which has
occurred since 2013: producing the slowest sustained wage growth in the postwar era, and
halting real wage improvements for most workers. In this context, we review several
different pieces of empirical evidence attesting to the growing importance of national
minimum wage increases, in supporting wage growth and preventing that wage stagnation
from getting even worse. Various indicators confirm that increases in the national minimum
wage (and flow-through effects to Modern Award wage rates, and other workers whose
wages track the national wage award) are the primary factor behind the limited recovery in
nominal wage growth which has been observed since 2017. Without the relatively strong
minimum wage increases which have been implemented since 2017, overall wage growth in
the Australian labour market would still be tracking at below 2% – even lower than the
record-low increases recorded in 2016 and early 2017.
The implications of this analysis for the 2020 national wage award are very important. If the
wage panel accepts the predictable arguments from employer groups that wages should not
be increased because of the turmoil associated with the COVID-19 pandemic (on top of
macroeconomic and labour market conditions that were already rather dismal), then the
only source of reliable wage strength would be removed from the labour market. Our
analysis indicates that if there is no increase in the minimum wage, overall wage growth this
year will sink below 1%. At a moment when Australia’s overall economy is already teetering
on the edge of widespread deflation (with devastating consequences for aggregate demand
and financial stability), accentuating deflationary pressures by freezing nominal wages
would be counterproductive and highly risky. In our judgment the wage panel should
proceed with a regular, healthy increase in the minimum wage, in line with the long-run
objectives of fairness and economic efficiency. That will help the coming multi-dimensional
effort to stabilise Australia’s economy and labour market, not hurt it.
4
THE HISTORIC SLOWDOWN IN AUSTRALIAN WAGE
GROWTH
As the panel is aware, nominal wage increases in Australia have decelerated dramatically in
recent years. Several statistical indicators confirm that nominal wage growth slowed down
sharply after approximately 2013, and since then has averaged about 2% per year. Figure 1
illustrates the trend in year-over-year growth in the ABS Wage Price Index (WPI), the most
commonly-cited measure of labour costs.
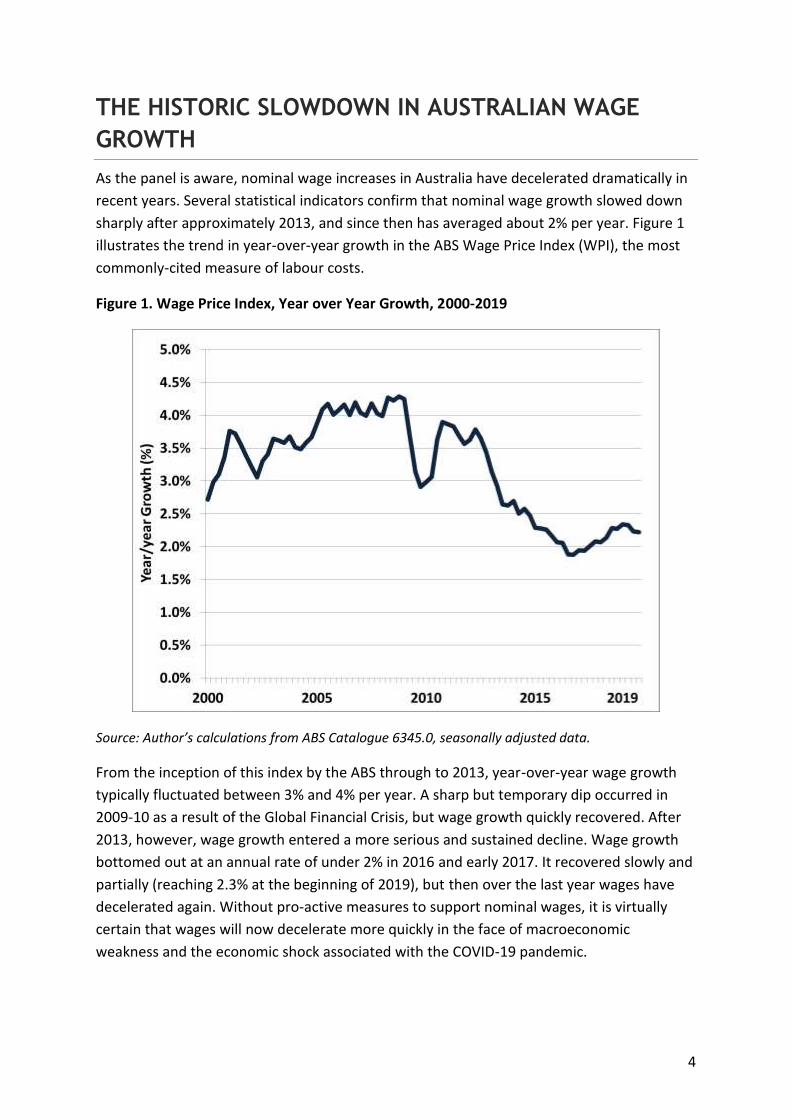
Figure 1. Wage Price Index, Year over Year Growth, 2000-2019
Source: Author’s calculations from ABS Catalogue 6345.0, seasonally adjusted data.
From the inception of this index by the ABS through to 2013, year-over-year wage growth
typically fluctuated between 3% and 4% per year. A sharp but temporary dip occurred in
2009-10 as a result of the Global Financial Crisis, but wage growth quickly recovered. After
2013, however, wage growth entered a more serious and sustained decline. Wage growth
bottomed out at an annual rate of under 2% in 2016 and early 2017. It recovered slowly and
partially (reaching 2.3% at the beginning of 2019), but then over the last year wages have
decelerated again. Without pro-active measures to support nominal wages, it is virtually
certain that wages will now decelerate more quickly in the face of macroeconomic
weakness and the economic shock associated with the COVID-19 pandemic.
5
Other methods for measuring wages (including average weekly wages, and wage and labour
cost measures derived from national income accounts1) confirm the extent of the decline in
nominal wage growth, and its timing. A structural break in wage determination seems to
have occurred around 2013. Wage growth since then, averaging around 2% per year, has
constituted the slowest sustained rate of wage growth in Australia’s postwar history.2
During the initial years of the wage deceleration, workers who were covered by enterprise
agreements fared better than the overall average depicted in Figure 1. Average annual wage
increases in quantifiable enterprise agreements outpaced the WPI average by a full
percentage point from 2013 through 2018. Wage increases in enterprise agreements were
also decelerating, but not as quickly as for other workers, and this helped to sustain overall
wage growth. However, with ultra-low wage growth increasingly entrenched in expectations
and attitudes (not to mention the erosion of EA coverage and union bargaining power in
recent years), this EA wage advantage is shrinking.
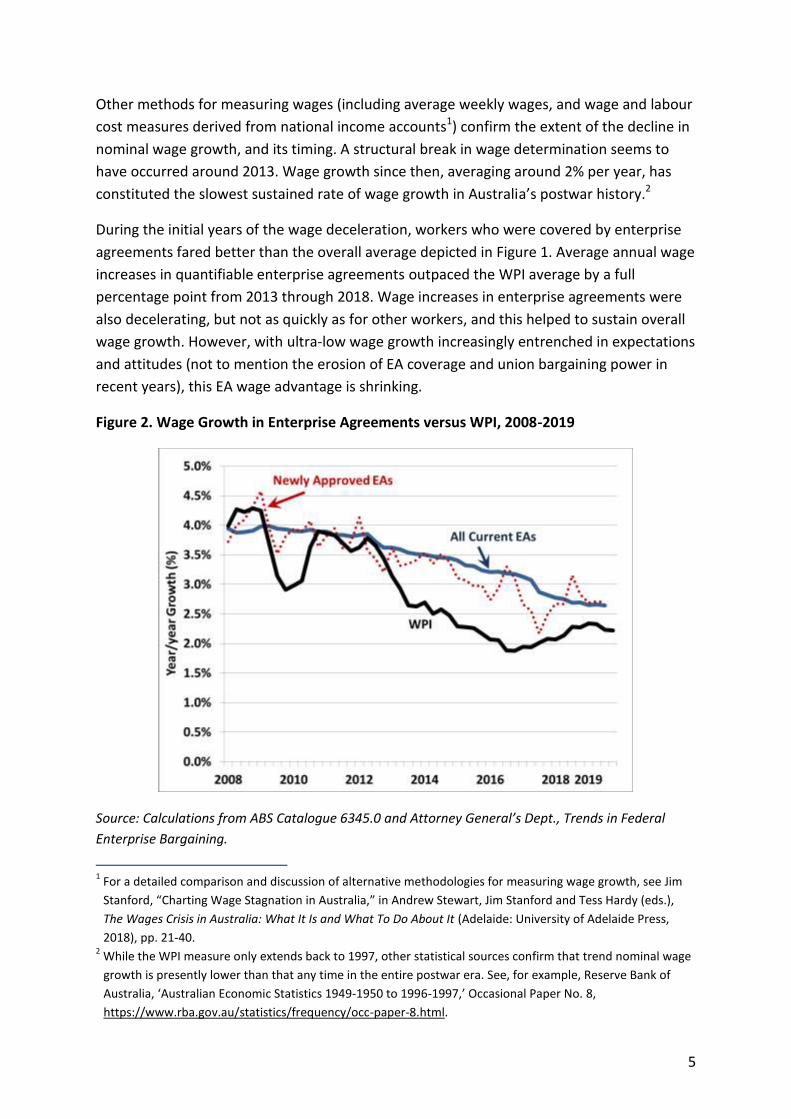
Figure 2. Wage Growth in Enterprise Agreements versus WPI, 2008-2019
Source: Calculations from ABS Catalogue 6345.0 and Attorney General’s Dept., Trends in Federal
Enterprise Bargaining.
1 For a detailed comparison and discussion of alternative methodologies for measuring wage growth, see Jim
Stanford, “Charting Wage Stagnation in Australia,” in Andrew Stewart, Jim Stanford and Tess Hardy (eds.),
The Wages Crisis in Australia: What It Is and What To Do About It (Adelaide: University of Adelaide Press,
2018), pp. 21-40. 2 While the WPI measure only extends back to 1997, other statistical sources confirm that trend nominal wage
growth is presently lower than that any time in the entire postwar era. See, for example, Reserve Bank of
Australia, ‘Australian Economic Statistics 1949-1950 to 1996-1997,’ Occasional Paper No. 8,
https://www.rba.gov.au/statistics/frequency/occ-paper-8.html.
6
As indicated in Figure 2, the gap between wage increases specified in current EAs and the
overall WPI trend in the labour market closed to about one-quarter percentage point by late
2019. Since enterprise agreements impart stability and inertia to wage patterns (in part
because they are typically in force for some years), this downward trend in wage bargaining
will make it more difficult to restore normal wage growth in future years.
Similarly, a gap that once existed between public sector and private sector wage growth has
also mostly disappeared, as low nominal wage growth becomes increasingly entrenched in
the expectations and political dynamics of public sector wage determination.
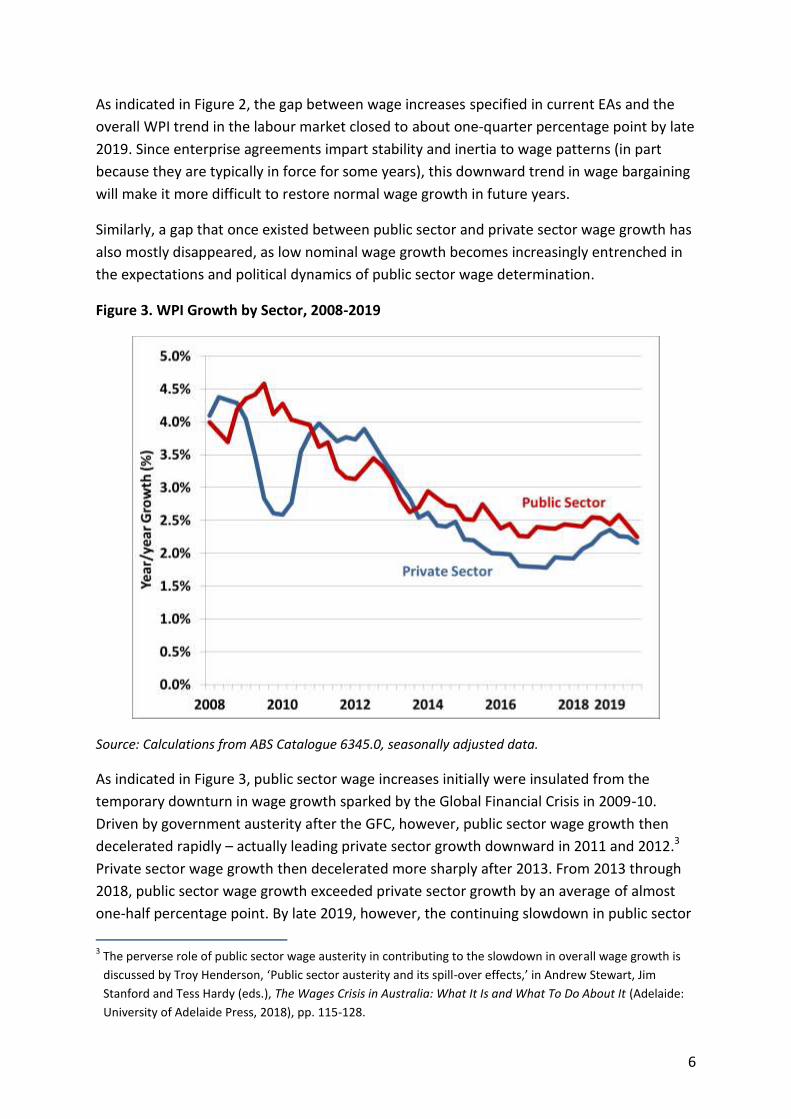
Figure 3. WPI Growth by Sector, 2008-2019
Source: Calculations from ABS Catalogue 6345.0, seasonally adjusted data.
As indicated in Figure 3, public sector wage increases initially were insulated from the
temporary downturn in wage growth sparked by the Global Financial Crisis in 2009-10.
Driven by government austerity after the GFC, however, public sector wage growth then
decelerated rapidly – actually leading private sector growth downward in 2011 and 2012.3
Private sector wage growth then decelerated more sharply after 2013. From 2013 through
2018, public sector wage growth exceeded private sector growth by an average of almost
one-half percentage point. By late 2019, however, the continuing slowdown in public sector
3 The perverse role of public sector wage austerity in contributing to the slowdown in overall wage growth is
discussed by Troy Henderson, ‘Public sector austerity and its spill-over effects,’ in Andrew Stewart, Jim
Stanford and Tess Hardy (eds.), The Wages Crisis in Australia: What It Is and What To Do About It (Adelaide:
University of Adelaide Press, 2018), pp. 115-128.

7
wage settlements effectively ‘caught up’ to the weak private sector trend (which now is
declining again). Public sector wage growth in the December quarter of 2019 was the lowest
on record (2.25%), less than one-tenth of a percentage point higher than the private sector
figure. This further attests to the extent to which very low wage growth is becoming
embedded in institutions and policy settings. This will make it all the harder for wage growth
in the future to return to normal rates – and makes it all the more important to prevent any
further deceleration in wage norms.
The consequences of the unprecedented slowdown in nominal wage growth in recent years
have been severe, affecting many dimensions of economic life:
Real wage growth has effectively stalled for several years, with inflation-adjusted
average weekly earnings showing no growth since 2013.
The gap between real wage growth and real labour productivity growth has widened
substantially during this period. While productivity performance in the economy has
been disappointing in recent years, productivity growth has still outpaced (non-
existent) real wage growth.
The link between broad economic progress (measured by GDP and productivity
growth) and the real living standards of Australian workers has been weakened; in
turn, this affects employment relationships, attitudes, and flexibility in Australian
workplaces.
Stagnant real incomes have enhanced financial stress on Australian households.
Slow nominal wage growth and falling unit labour costs have undermined inflation
expectations and the effectiveness of monetary policy, contributing to the chronic
failure of the Reserve Bank of Australia to attain its target inflation rate.4
Weak wage growth has undermined consumer spending, which was stagnant even
before the onset of bushfires and the COVD-19 pandemic. Consumer spending is the
largest single expenditure component of GDP, and hence this holds back job-creation
and economic growth.
In sum, the unprecedented slowdown of wage growth in Australia since 2013 has had many
painful and destructive economic and social consequences. And the longer that stagnation is
allowed to persist, the more is becomes ‘hard-wired’ into economic and political processes –
and the harder it will be to repair in the future. For all these reasons, it is more important
than ever that the panel consider these broader labour market, macroeconomic and even
socio-cultural effects of unprecedented nominal wage weakness, and use its power to help
to restore regular and appropriate nominal wage increases. The entire labour market is
4 At time of writing, year-over-year consumer inflation has fallen below the RBA’s target for 22 consecutive
quarters, undershooting desired inflation by an average of three-quarters of a percentage point. This is by far
the longest-lasting one-sided error in the history of Australia’s inflation-targeting regime.
8
depending on the panel to stop the further downward slide of wage growth, and provide
leadership in pushing nominal wage growth back toward more normal and healthy levels.5
THE GROWING IMPORTANCE OF THE ANNUAL WAGE
REVIEW IN AUSTRALIAN WAGE GROWTH
The annual adjustments to the national minimum wage, and flow-through increases to
Modern Awards wage rates, have become increasingly important in influencing and
supporting the overall level of wage growth in Australia’s economy. This is confirmed in our
submission by an analysis of several pieces of empirical data, including:
The changing seasonal pattern of observed wage increases (as measured by the ABS
WPI).
The stagnation of ‘underlying’ wage growth trends, measured by the trend of wage
growth in quarters that do not include an annual wage adjustment.
Severe weakness in wage growth for workers who are not covered by the annual
wage review (after ‘backing out’ the effects of annual wage adjustments for
minimum wage, Award-covered workers, and others whose wages track the national
wage award).
Disaggregated data on wage growth by method of wage-setting.
CHANGING SEASONAL PATTERNS IN THE WPI
The ABS reports its WPI in original (unadjusted), seasonally adjusted, and trend versions.
There is a strong seasonal pattern in the WPI arising from the concentration of wage
increases around 1 July (the beginning of each financial year). Thus the original (unadjusted)
WPI series regularly shows a large jump in the September quarter (the quarter which
includes July 1). Changes in the national minimum wage also come into effect on 1 July, and
this further accentuates that seasonal spike in wage growth.
Figure 4 illustrates this strong seasonal pattern in (unadjusted) WPI data, using the within-
quarter percentage change6 in the original WPI series, over the last 12 years (dating back to
2008, before the onset of the Global Financial Crisis).
5 As indicated by RBA Governor Philip Lowe, nominal wage growth of around 3.5% per year would be
compatible with both the attainment of the RBA’s 2.5% inflation target and trend annual growth in real
labour productivity (of around 1% per year); see Philip Lowe, ‘Evidence to House of Representatives Standing
Committee on Economics,’ Parliament of Australia, Sydney, 16 February 2018: 14-15. 6 We use the within-quarter change, not year-over-year change, to fully capture the seasonal pattern in the
WPI.

9
Figure 4. Seasonal Pattern of WPI Increases
Source: Author’s calculations from ABS Catalogue 6345.0; unadjusted data.
There are several interesting aspects to note about this evidence. First, it is normal that a
disproportionate share of annual recorded wage growth occurs during the September
quarter of each year (running from July 1 through September 30). This is partly because
many employment contracts and enterprise agreements are denominated to coincide with
the financial year – and hence specify wage increments that come into effect on July 1. It
also indicates the importance of annual wage adjustments in the national minimum wage,
and in Modern Awards, which also occur on July 1. In most years (but not always7), more
wage growth occurs within the September quarter than in any other quarter of the year.
It is also clear that the relative gap between wage growth in the September quarter, and
other quarters of the year, has increased in recent years. As visible in Figure 4, the
highlighted ‘red’ bars (when the national minimum wage was raised, and corresponding
adjustments made to Modern Awards) are more prominently raised above the pattern set in
other quarters of the year. The growing relative height of the September quarter
adjustments can be seen more readily in Figure 5, which plots (over the same 12-year
period) the ratio of recorded wage growth in the September quarter, to the average of wage
growth in the other quarters.
7 2008 was an exception, in which there was more unadjusted wage growth that occurred in the December
quarter than the September quarter.

10
Figure 5. September Quarter Wage Growth Premium
Source: Author’s calculations from ABS Catalogue 6345.0 as explained in text.
We term the ratio of September quarterly wage growth to the other quarters as the
‘September Quarter Wage Growth Premium.’ In earlier years (up to and including 2014) this
premium typically fluctuated around 1.5, but it has widened notably in recent years. Since
2015 the premium has averaged 2.0 (and peaked at almost 2.5 in 2018, coincident with the
strong 3.5% increase in the minimum wage implemented that year). In other words, since
2015, unadjusted wage growth recorded in the quarter that includes the annual wage
review adjustments has been twice as strong as wage growth at all other times of the year.
This attests to the growing relative importance of those annual wage review adjustments to
the overall pattern of wage growth across the labour market.8
OBSERVED AND ‘UNDERLYING’ WAGE GROWTH
The seasonal nature of WPI data also allows for a further approach to disaggregating the
impact of annual wage adjustments on overall wage trends.
8 An alternative statistical explanation might be that employment contracts had somehow become more
concentrated around July 1 adjustment dates, but there is no reason nor evidence to indicate that this has
been the case.

11
Figure 6. Observed and Underlying WPI Growth
Source: Author’s calculations from ABS Catalogue 6345.0 as explained in text; calendar year averages of unadjusted data.
We define a measure of ‘underlying’ wage growth as the annualised average of wage
growth (unadjusted for seasonality) reported in the three quarters of each calendar year
which do not encompass an annual wage adjustment (namely, the March, June and
December quarters). This provides a measure of the pace at which wages would be growing,
without the impact of annual adjustments to the national minimum wage and Modern
Award wage rates. That underlying growth is illustrated by the blue line in Figure 6. Until
2012, it ranged between 3 and 4% per year – similar to overall WPI growth (illustrated in
Figure 1). Beginning in 2013 it began to decelerate sharply, falling below 2% by 2015, and
staying below 2% until the present.
Figure 6 also indicates how weakness in that underlying wage pressure has become
entrenched as a result of persistent and historically low wage increases. This ‘underlying’
wage growth has remained below 2% for five consecutive years. It is only because stronger
wage increases have been awarded in the September quarters of each year, that the overall
rate of wage increases (as measured by the WPI) has regained and exceeded the 2% marker
since the September quarter of 2017. It is not a coincidence that the first quarter year-over-
year WPI growth once again exceeded 2% (September 2017) was also the quarter in which a
relatively stronger minimum wage award (3.3%) was implemented.

12
‘BACKING OUT’ THE EFFECT OF ANNUAL WAGE
ADJUSTMENTS
Another perspective on the profound weakness of underlying wage trends can be gained
through a decomposition of wage growth in the broader labour market, between the effects
(both direct and indirect) of annual wage awards, and wage growth arising from other
forces and factors. The first step in this analysis is to develop an estimate of the total share
of employed workers whose wage growth can be linked to the annual wage award. This
estimate is summarised in Table 1.
Table 1 Annual Wage Awards and Pay-Setting Methods
Share of Employees
Covered (%)
Direct Award Coverage 21.0%
EA-Covered Linked to Awards 3.1%
Individual Contracts Linked to Awards (est) 10% ?
Total Wage Award Linked At least 33%
Source: Author’s calculations from ABS Catalogues 6306.0, 6291.0.55.003 Table 13, Attorney General’s Department Trends in Federal Enterprise Bargaining (various issues), Wright and Buchanan (2013), as described in text.
Of course, the proportion of workers who are directly paid the national minimum wage is
small. A much larger proportion receive annual wage adjustments linked to the national
wage award through a Modern Award. The 2018 survey of employers published in the ABS’s
biennial Employee Earnings and Hours report suggests that some 21% of employed
Australians are paid according to the terms of a Modern Award.9
But there are other groups of workers whose wage increases are also determined as a result
of the national wage award. For example, wages in a growing number of enterprise
agreements are now linked directly to changes in minimum wages or relevant award rates.
This is reflected in the rising share of current EAs with what are called ‘non-quantifiable
wage increases’: that is, wage arrangements that are not explicitly specified, but rather
depend on the evolution of other variables outside of the direct control of the parties to the
agreement. Those external factors can include consumer price inflation and corporate or
individual performance metrics; but a very common external benchmark is changes in
relevant minimum wage or award wages. For example, several recently-renewed large
9 Award-dependence is higher among non-managerial employees (22.5%) and in the private sector (24.5%).

13
enterprise agreements in the retail sector provide for future wage increases to match
changes in the relevant national wage award.
The Commonwealth Attorney General’s Department tracks lodgments of enterprise
agreements with non-quantifiable wage provisions.10 In the most recent three-year period
covered by this data (ending in September 2019), non-quantifiable agreements accounted
for 22% of all lodged EAs (or almost 2900 agreements), and covered 725,000 workers (or
31% of all employees covered by lodged EAs in that period). The Attorney General’s data
provide a limited breakdown of different categories of non-quantifiable arrangements,
however that breakdown is incomplete; a generic ‘Other Reason’ category is the largest
single sub-group. Therefore, we assume that half of the total number of workers covered by
non-quantifiable EAs have wages that are linked directly or indirectly to changes in the
national minimum wage or Modern Awards. Given the current coverage of federally-
registered EAs (current agreements cover just under 20% of all employees as of late 2019),
that amounts to just over 3% of all employees.11
Compensation for another group of workers also depends on trends in the national
minimum wage and Modern Awards wages. Research has indicated that a significant share
of workers on individual employment contracts also work for wages that effectively mirror
the wage rates specified in relevant awards. Other terms of those ‘individual’ contracts
(which typically follow company- or industry-specific templates) may vary from Awards, but
wage rates often mimic those specified in the Awards. We estimate that about one in four
workers on individual contracts (or around 10% of all employees) have wages that reflect
changes in Award rates.12
Across these three categories, therefore, we estimate that at least one-third of Australian
employees work for wages that are directly or indirectly linked to the changes in wages
specified as a result of the annual wage review. Not all of those workers will have their
wages adjusted on July 1, but the increments which they receive over the course of a
calendar year will mirror those annual adjustments.
On the basis of that assumption, we can proceed to consider the growing resonance of
those annual wage adjustments on the overall trajectory of wages in the Australian labour
market – and document the continuing weakness in underlying wage trends in the absence
10
See Attorney General’s Department Trends in Federal Enterprise Bargaining (various issues). 11
Total current federally-registered EAs cover 20% of employees; an estimated 31% of those have non-
quantifiable wage terms, of which we estimate half are tied to minimum or Award wage rates. 20%*31%*0.5
implies just over 3% of employees are covered by such agreements. 12
Wright and Buchanan find that about half of all individual contracts have some link to Award wage norms,
which would imply an even larger spillover influence from Award rates than is implied in Table 1. See Sally
Wright and John Buchanan, Award Reliance, Research Report 6/2013, Fair Work Commission, Melbourne,
2013; see also Andrew Stewart and Mark Bray, “Modern Awards Under the Fair Work Act,” Australian Journal
of Labour Law (forthcoming) for further evidence on this practice.

14
of the minimum wage increases. This exercise is described in Table 2, for the four most
recent calendar years.
Table 2 ‘Backing Out’ Underlying Non-Minimum-Wage Growth
(Calendar Years)
2016 2017 2018 2019
1 Minimum Wage Increase (1 July) 2.4% 3.3% 3.5% 3.0%
2 Share of Workforce Affected ⅓
3 Weighted-Average Contribution (1*2, % pts) 0.79% 1.09% 1.16% 0.99%
4 Total Calendar Year Growth WPI 1.97% 1.99% 2.19% 2.28%
5 Residual Without Min. Wage (4-3, % pts) 1.18% 0.87% 1.00% 1.26%
6 Workforce Covered (100% - 2) ⅔
7 Implied Rate of Wage Growth (5/6) 1.76% 1.32% 1.51% 1.91%
Source: Author’s calculations from ABS Catalogues 6306.0 and 6345.0 as explained in text.
The first row of Table 2 indicates the size of each year’s minimum wage increase – occurring
at the mid-point of each calendar year. As discussed above, we assume that increase applies
(directly or indirectly) to one-third of workers. We can then compute the contribution that
the wage award made that year to the weighted-average overall growth in the WPI for that
calendar year (equal to one-third of the minimum wage increase).
The lower half of Table 2 then ‘backs out’ the implied rate of wage growth that must be
occurring in the other two-thirds of the workforce, to be consistent with the actually
observed calendar-year increase in the overall WPI. In calendar 2016, implied wage growth
for those not covered (directly or indirectly) by the minimum wage was 1.76%. The cautious
2.4% increase in the national minimum wage that year lifted the rate of WPI growth slightly,
but still left it below 2% for the year. In 2017 the rate of wage growth for non-minimum-
wage-linked workers weakened further (to just 1.32%). But a stronger minimum wage
increase that year lifted overall WPI growth by two-thirds of a percentage point, to just
under 2%. In 2018, the impact of the minimum wage award is especially dramatic: the 3.5%
increase that year lifted the weighted average WPI growth by seven-tenths of a percentage
point. Even in 2019, when underlying wage growth strengthened slightly, and the minimum
wage award was pared back to 3%, final WPI growth was almost one-half percentage point
stronger than it would have been without that award.
The key finding of this exercise is that in the absence of strong minimum wage increases,
overall wage growth in Australia’s labour market would still be well below 2% per year: even

15
weaker than the rock-bottom wage growth that was recorded in 2016 and the first half of
2017. The primary reason that there has been any recovery in overall WPI growth at all since
2017 is the more ambitious adjustments to the national minimum wage (with its flow-
through into Awards and other wage-setting arrangements) that have been implemented in
the last three annual wage reviews.13 In the absence of those annual wage adjustments,
nominal wage growth in the overall labour market would remain below 2%.
This finding is consistent with the analysis in the preceding section (illustrated in Figure 6),
that estimated ‘underlying’ wage growth (annualised growth in the three quarters other
than the quarter that includes the annual wage review) as languishing below 2% each year
since 2015. This corroborates the conclusion that in the absence of a strong annual wage
adjustment, national wage growth would still be plumbing the postwar record lows that
were experienced in 2016 and early 2017.
WAGE GROWTH BY PAY-SETTING METHOD
A final piece of evidence attesting to the growing importance of minimum wage
adjustments is provided by recent Reserve Bank of Australia analysis, on the basis of
unpublished micro data from the ABS. The Reserve Bank separately reported wage growth
for employees from 2000-2018 disaggregated into three different categories of pay
arrangements: Awards, enterprise agreements, and individual contracts.14 The analysis
compiled and aggregated micro data on wage growth for individuals, according to each pay
arrangement. We reproduce the summary findings below, as Figure 7.
This evidence shows that workers whose wages are set directly by an Award have
experienced the strongest wage growth of any category since 2017, most recently averaging
over 3%. Two clear steps in the pattern of Award-dependent wage increases are visible,
corresponding to the July 2017 and July 2018 awards, respectively.15 In contrast, wage
increases in enterprise agreements were still plumbing near-record lows (around 2.25%) at
the end of this data series. That is consistent with the evidence presented above in Figure 2:
namely, that EA wage bargaining is still adjusting to more fully reflect the ‘new normal’ of
record-low wage increases. Workers on individual contracts, meanwhile, experienced the
worst deceleration of wages (bottoming out at just 1.5% in 2016), and recovering only
partially since then (still falling below 2% at end-2018).
13
The average minimum wage increase announced in the three modest recent years (2017 through 2019) was
3.27% – about six-tenths of a percentage point higher than the average over the previous five years. This
confirms a notable strengthening of minimum wage policy since 2017. 14
See James Bishop and Natasha Cassidy, “Wages growth by Pay-setting Method,” RBA Bulletin, June 2019. 15
Figure 7 does not include the period covered by the 2019 minimum wage award.

16
Figure 7. Wages Growth by Pay-Setting Method, 2000-2018
Source: Reproduced from Bishop and Cassidy (2019).
The point here is not just that Award wages grew the fastest of any of these categories since
2016. Rather, it is also that the recovery in Award wages (starting with the 3.3% adjustment
on 1 July 2017) clearly led the (smaller) rebound in wage growth in individual contracts. This
attests further to the important role of the annual wage award in influencing wage norms
throughout the labour market. Some of the ‘echo’ of the national wage award that is visible
in individual contract data reflects the fact that many individual contracts (as discussed
above) have wage rates that effectively track Award rates. But it also reflects the economic
and moral pressure that all private employers will face in order to keep up with the wage
benchmarks determined through the annual wage review.
THE CONSEQUENCES OF A MINIMUM WAGE FREEZE
We have reviewed several different pieces of empirical evidence that confirm that the
relatively stronger minimum wage increases implemented in the last three years have
played an important and positive role in arresting the unprecedented deceleration of
17
Australian wage growth that started around 2013, and sparking a partial but fragile
recovery. Without the consecutive wage awards implemented since 2017 (of 3.3%, 3.5%,
and 3%, respectively), it is clear that overall nominal wage growth in Australia’s economy
would still be languishing below 2% – even worse than the all-time record lows recorded in
official WPI data for 2016 and early 2017. This confirms the crucial role played by the
national wage award in setting a floor to labour market functioning, and stabilising wage
norms in the face of unfavourable macroeconomic circumstances.
This finding is not solely of academic interest. Australia’s labour market is entering a period
of unprecedented turmoil, and this year’s wage review will be critically important in
stabilising and preserving wage expectations. Labour market conditions were already weak
as we entered 2020: WPI growth was decelerating throughout 2019, macroeconomic
performance was flagging, and the bushfires crisis had already disrupted economic activity
and labour markets in many parts of the country. But the labour market crisis resulting from
the COVID-19 pandemic, and health orders which are effectively shutting down significant
parts of Australia’s economy, pose an unprecedented challenge to economic governance in
all areas.
Influential voices have already called for the national minimum wage to be frozen as a result
of the pandemic. We disagree strongly with that conclusion for several reasons. First, on the
basis of the preceding analysis, let us consider what would happen to national wage growth
in the absence of a normal annual increase in the minimum wage (translated into parallel
increases in Award wages, and then indirectly to wages in EAs and individual contracts that
track the Awards). Line 5 in Table 2 reports the contribution to weighted-average overall
wage growth made by wage increases received by the two-thirds of Australian workers
whose wages are not closely linked to the national wage award. In 2019, that contribution
was 1.26%. In all years reported in Table 2, that contribution was lifted upward by a much
stronger increase in the national wage award. But if there was no increase in that national
wage award, than that 1.26% contribution would be the only contribution to national wage
growth – and hence the overall rate of WPI growth for the year would also have equaled
1.26%.
However, that 1.26% contribution itself has undoubtedly weakened, as a result of the
renewed deceleration of wages throughout calendar 2019 – and now the cataclysm being
experienced in the labour market as a result of the COVID-19 pandemic. We estimate that
the underlying rate of wage growth for those employees not covered (directly or indirectly)
by the national wage award will sink this year to 1% or lower. If there is no increase in the
national minimum wage (and the wages that are linked to it), then that 1% increases for
two-thirds of the workforce will be the only source of wage pressure in the economy – and
hence overall WPI growth would decelerate in the coming year to around 0.7%, or possibly
even lower.

18
Wage increases so close to zero, at a moment of immense macroeconomic instability, pose
a clear and present danger to the ability of Australia’s economy to negotiate the challenging
months and years ahead. One of the greatest risks of a severe economic downturn is
deflation: that is, a generalised fall in nominal price levels. Deflation causes consumers to
further defer purchases (as they await even lower prices in the future); it causes the real
burden of debts to explode; and it wreaks havoc with investment expectations and
intentions. Deflation is typically associated with depression – and Australia already enters
this downturn perilously close to it.16
The nominal wage is the most important price in the economy. It serves as an effective
anchor for nominal price levels. If wages are not adequately growing, then prices will not be
growing at a healthy rate either. And if wages are not growing at all, then prices will
probably start falling – heralding looming macroeconomic disaster. For this reason, it is
essential, despite the worrying macroeconomic climate, that the wage panel proceed with a
normal, healthy increase in the minimum wage, fully passed through into Award rates.
The heightened danger of deflation in the present moment is confirmed by a comparison of
current nominal price trends, to the trends that prevailed at the time of the Global Financial
Crisis in 2008-09. Some observers will suggest that the wage panel’s decision to freeze the
minimum wage for one year in July 2009 (followed by a double-sized ‘catch-up’ increase in
July 2010) is a precedent for a similar approach this year. That argument ignores the impact
of several years of wage deceleration and unduly low inflation on Australian nominal values
since that previous crisis. As summarised in Table 3, all major measures of inflation have
decelerated dramatically since December 2008 (the most recent data point which the wage
panel could have considered in determining its 2009 national wage award).
Table 3 Measures of Inflation, 2008 v. 2019
Measure Year-over-year
Growth (%)
Dec. 2008 Dec. 2019
Consumer Price Index 3.70% 1.84%
GDP Implicit Deflator 7.26% 1.85%
Wage Price Index 4.29% 2.22%
Source: Author’s calculations from ABS Catalogues 5206.0, 6401.0 and 6345.0.
16
Indeed, measured by the average price of GDP output, Australia was already experiencing economy-wide
deflation in the December quarter of 2019, when output-weighted prices fell at an annualized rate of 3.0%
(author’s calculations from ABS Catalogue 5206.0, Table 5).
19
This suggests there is far less inflationary cushion in the economy today, than there was in
December 2008 (when the GFC was having its impact). Moreover, it is already apparent that
the impact of the coronavirus pandemic on domestic employment and output is going to be
far worse than the downturn that followed the GFC. All this enhances the risk of tipping
wages, and the overall economy, into outright deflation. Traditional arguments that freezing
or reducing labour costs could somehow restore business confidence and preserve
employment levels (even as entire sections of the economy effectively shut down) are not
credible; they are reminiscent of similar arguments made by market fundamentalists at the
beginning of the 1930s. It is more important, at this dangerous moment, to anchor the
nominal valuations of the economy, and then provide needed support to employment (and
employers) through alternative means, such as proposals for a significant wage subsidy
(similar to those already implemented in the UK and several other countries).
CONCLUSION
As a result of the unprecedented weakness of nominal wage trends in Australia since 2013,
the annual national wage award has taken on greater importance as a reliable support for
the overall wage trajectory. Without relatively strong wage awards (that met or exceeded
3%) in the last three years, nominal wage growth in the overall labour market would still be
below 2% – and getting weaker in the face of the current macroeconomic shock. In this
context, it is vital that the panel proceed with a normal, healthy increase in the national
minimum wage, flowing fully through to Award rates, in line with the long-term objectives
of fairness and efficiency.